Particle Size Distribution Effect on Physical and Mechanical Properties of Cob
Info: 16029 words (64 pages) Dissertation
Published: 2nd Nov 2021
Tagged: ConstructionEarth Sciences
Abstract
Earth construction provides a home for more than 30% of the world’s population and is used in a variety of techniques. Cob is a composite material and combines clay, silt, aggregates and straw in monolithic walls. This method of construction is mostly found in the South-West of England, in Devon and some are over 400 years old. Whist research into its properties has highlighted some important aspects, there is scope to learn more.
Historic England have recognised a need to assess the susceptibility of historic cob walls to collapse and, therefore, further understanding of its material properties is required.
This dissertation investigates the effects of the particle size distribution and grading of cob, on the physical and mechanical properties it possesses. It focuses on the plastic and liquid limits, vapour sorption and compressive strength. Cob blocks from Mike Wye & Associates were considered, due to the large volume of material required to complete these tests.
Particle size distribution is determined for a cob block from Mike Wye, which is then used to produce samples for plasticity and vapour sorption testing. The Atterberg limits were found to show a linear relationship after a certain grading, enabling the potential prediction of both the liquid and plastic limits at a higher grading than used by a standard. The smallest grading tested produced significantly higher limits for both tests, whilst higher gradings followed a linear correlation closely. This pattern also featured in vapour sorption tests.
Compression testing was carried out at varied moisture contents and produced higher maximum stresses than seen previously in literature. Reasons for this include varied particle size distributions and comparison of different shaped samples. The young’s modulus was determined and the failure plane discussed.
A relationship between the grading of the soil and its Atterberg limits at the particle size distribution found was established. The vapour sorption data can be used in conjunction with this, to enable a prediction of the moisture content of cob at varied relative humidities. The physical properties established enable the subsequent mechanical properties to be understood. The results from this investigation provide preliminary findings in the field, and there is opportunity for further research to be done. A series of testing methods are recommended to Historic England as a means of building/wall assessment.
Table of Contents
1 Introduction
1.1 Earth Construction
1.2 Cob
1.3 Causes of Failure in Historic Cob Buildings
1.4 Cob as a Building Material
1.5 Historic England
1.6 Scope of Project
1.7 Aims and objectives
2 Literature Review
2.1 Moisture Content
2.2 Straw content
2.3 Particle Size Distribution
2.4 Current Survey Procedure
2.5 Summary and Conclusion
3 Materials and Methodology
3.1 Materials
3.2 Particle Size Distribution
3.3 Plasticity Testing
3.4 Moisture Content
3.5 Dynamic Vapour Sorption
3.6 Compression
4 Results
4.1 Material Properties
4.2 Physical Properties
5 Analysis and Discussion
5.1 Particle Size Distribution
5.2 Plasticity
5.3 Dynamic Vapour Sorption
5.4 Compression
6 Summary and Conclusion
6.1 Summary
6.2 Utilisation of Results
6.3 Recommendations for Future Work
6.4 Conclusion
References
List of Figures
Figure 1.1 Regional distribution of earth construction in the UK (Pearson, 1992)
Figure 1.2 Typical cob house showing construction details (Historic Buildings Trust, Devon, 1992)
Figure 2.1 Change in Ultimate Compressive Strength (UCS) of straw-clay with moisture content (Keefe, 2005)
Figure 2.2 Effect of a variation in straw and moisture content on the compressive strength of cob (Saxton, 1995)
Figure 2.3 Recommended particle size distributions of cob from Pearson (1992) and Saxton (1995)
Figure 2.4 Comparison between plasticity of clay and chalk (Pearson, 1992)
Figure 2.5 Recommended plasticity for adobe bricks (Houben and Guillard, 1989)
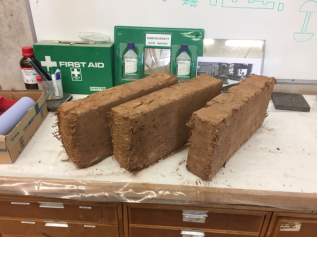
Figure 3.1 Cob Blocks from Mike Wye & Associates
Figure 3.2 Make up of
Figure 3.3 DVS Advantage 1
Figure 3.4 Compression of cob block showing orientation
Figure 4.1 Particle size distribution of cob block
Figure 4.2 Results of plastic and liquid limit tests (BS 5930: 2015)
Figure 4.3 DVS results for MW cob at different gradings
Figure 4.4 Maximum stress in cob blocks at different moisture contents
Figure 4.5 Young’s modulus of cob blocks at different moisture contents
Figure 5.1 Saxton (1995) distribution ±10%
Figure 5.2 Plastic Limits of cob at different gradings
Figure 5.3 Plastic limit trendline with boundary error
Figure 5.4 Plastic limit with suggested trendline
Figure 5.5 Liquid limit of different gradings of cob material with 95% confidence interval
Figure 5.6 Liquid limit with suggested trendline
Figure 5.7 Liquid limit trendline with error bounds
Figure 5.8 Plastic and liquid limit observed correlations
Figure 5.9 Moisture content of cob at different gradings and RH from DVS
Figure 5.10 Comparison of MW cob compressive strength and Keefe (2005) UCS
Figure 5.11 95% RH Failure
Figure 5.12 40% RH Failure
Figure 5.13 20% RH Failure
Figure 5.14 Submerged Failure
Figure 5.15 Penetration depth of submerged cob block
List of Tables
Table 2.1 Effects of water on clays (Houben & Guillard, 1989)
Table 5.1 Plastic limit statistics
Table 5.2 P-values for t-test of plastic limit
Table 5.3 Liquid limit statistics
Table 5.4 P-value for t-test of DVS results
List of Terms
| DVS | Dynamic Vapour Sorption |
| HE | Historic England |
| LL | Liquid Limit |
| MW | Mike Wye & Associates |
| PI | Plastic Index |
| PL | Plastic Limit |
| RH | Relative Humidity |
| UCS | Ultimate Compressive Strength |
| YM | Young’s Modulus |
1 Introduction
1.1 Earth Construction
Earth is a versatile form of vernacular construction, demonstrated by its numerous forms such as cob, adobe, rammed earth, and extruded earth blocks. Earth provides shelter for more than 30% of the world’s population (Houben & Guillard, 1989), and 25% of the endangered UNESCO world heritage sites are constructed with earth, highlighting the importance in conservation and protection of these historic buildings (Auroville: Earth Institute, 2016).
Earth construction within the UK is equally varied, mostly dependent on location and type of soil available within the immediate area of the building. Figure 1.1 illustrates the distribution of earth construction throughout the UK, for instance the clay lump adobe in the East, Wychert in the East Midlands, and Clay (cob) in the South-West. Cob is found in these areas due to the suitability of the soil for construction due to their clay content and grading. There are approximately 20,000 cob structures within Devon, more than 100 of which have been lost within the last decade (Historic Buildings Trust, Devon, 1992). Further research is necessary to protect these, often neglected, historic buildings.
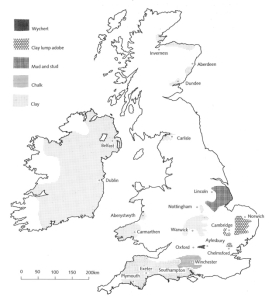
Figure 1.1 Regional distribution of earth construction in the UK (Pearson, 1992)
1.2 Cob
Cob is a monolithic wall construction and its main constituents are clay, silt, aggregate and straw. From analysis of cob buildings that remain standing, an ideal cob mix is one that is well graded with an adequate clay content (Historic Buildings Trust, Devon, 1992). Cob houses are typically 2 storeys high and come in a variety of different layouts (Saxton, 1995). Construction involves using soil and aggregates from the vicinity of the site and combining them in a large pit, typically by foot or horses/cattle. The mixture is then placed onto a stone plinth in a series of lifts, which are left to dry between successive construction periods (Historic Buildings Trust, Devon, 1992). A summary of this is shown in Figure 1.2. This technique of construction is a result of centuries of development and adaptation by those that chose to build with the vernacular material. Due to the large variability in the material and general lack of knowledge in its properties, building regulations do not exist. As result of this, the historic buildings within the UK contain completely varied cob mixtures (Saxton & Coventry, 1995).
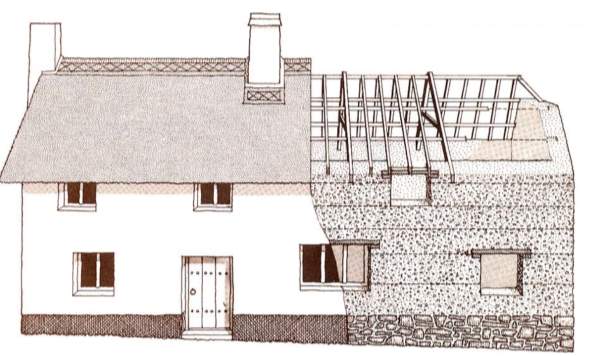
Figure 1.2 Typical cob house showing construction details (Historic Buildings Trust, Devon, 1992)
1.3 Causes of Failure in Historic Cob Buildings
Recent collapses in historic cob buildings have been due to a variety of factors, predominantly causing an increase in the internal moisture content (Devon Live, 2014). Some of the recognised influences are render type, high level erosion and low level erosion (Pearson, 1992). Cement based renders are often applied to cob houses to cover a façade that needs repair, as this is common practice in modern construction techniques. Moisture is allowed into the cob material via small cracks in the surface of the render, however it cannot escape at the same rate in which it is absorbed, causing moisture to accumulate within the wall. Due to this extra moisture, the cob has a reduced compressive strength and can no longer support the loads applied to it (Saxton, 1995). This causes it to fail suddenly and without warning.
A raised ground level at the base of a cob wall can cause failure as it leads to low level erosion of cob walls. The stone plinth at the base of the wall is vital in allowing moisture to escape and increasing the ground level can reduce this ability. Erosion at the base of the cob section is therefore more likely as moisture can build up, ultimately contributing to failure.
Overhanging eaves are an essential part of a cob building, as it prevents rainwater from infiltrating the cob material. If there is insufficient overhanging, rainwater can erode the wall surface and moisture can build up, additionally leading to failure (Pearson, 1992).
1.4 Cob as a Building Material
A typical mix of cob comprises of clay, gravels and sands in approximately equal proportions. Saxton (1995) suggests around 35% of each, with a margin of error of 10%. Clay forms the binder in the cob material, providing the cohesion necessary to hold the cohesionless aggregates together. This mix of sand, silt, gravel and clay works as a composite material, each component contributing to its success as a building material.
A typical cob mix can provide approximately 0.6 N/mm2 of compressive strength (Saxton, 1995), which is supported by Pearson (1992) who recommends up to 1.0 N/mm2 at around 10% moisture content. Both strengths are considered adequate for domestic loading.
1.5 Historic England
Historic England aim to protect the building heritage of England, through research and collaboration (Historic England, 2017). The need to diagnose if a historic cob building is susceptible to failure, through analysis in the laboratory, has been recognised by the organisation. Failure is defined in this instance as the point at which the building no longer fulfils its requirements of its function. For example, a wall of a building that collapses. The research completed for this dissertation will, therefore, contribute to aiding Historic England to gain a greater understanding of the condition of the historic cob buildings in and around Devon.
1.6 Scope of Project
This project will focus on cob from Mike Wye & Associates (MW). Historic cob will not be used due to the scarcity of the material, and difficulty in sourcing large enough volumes. The MW cob blocks are assumed to be representative of historic cob. The blocks are manufactured to provide a comparable material for repair work and investigation of this assumption is an opportunity for future research.
The particle size distribution will not be changed for the compression testing due to the large volume of cob required. Cob blocks will be compressed in their supplied form; the only alteration being its moisture content. The variation of particle size distribution and compressive strength is considered an area of further research.
1.7 Aims and objectives
The aim of this project is to distinguish a link between the particle size distribution of cob and the relevant physical and mechanical properties. Ultimately, this will provide Historic England with a tool to assess historic buildings, as a greater understanding in the properties will be achieved. This will be undertaken in accordance with a full study into the current literature on the topic.
The objectives for this dissertation are as follows:
- Identify the particle size distribution of a MW cob block
- Investigate how the particle size distribution of cob effects the Atterberg limits and vapour sorption properties, at different gradings
- Investigate the effect of moisture content on the compressive properties of cob
2 Literature Review
There are multiple different variables that are known to affect the properties of cob, some of which have been listed below (Houben & Guillard, 1989):
- Moisture content;
- Straw content;
- Particle size distribution.
Each of these variables has potential to have an adverse effect on the success of cob in historic walling, and will be discussed in this review.
2.1 Moisture Content
One of the main reasons for a cob material to fail is due to excess moisture within the cob material (Historic Buildings Trust, Devon, 1993). For a cob wall to be stable, it must contain enough moisture to ensure that the clay can cover all the grains within the mix thoroughly, to achieve an evenly distributed composite material (Pearson, 1992). Table 2.1 demonstrates how the presence of water within a clay can affect its behaviour. Clay is considered, in this instance, as it forms the bulk of the cob material and is the portion that holds it together.
Table 2.1 Effects of water on clays (Houben & Guillard, 1989)
| Effect | Description |
| Cohesion | Caused by the surface tension of the water at its interface between air or the interaction of clay particles and polarised molecules of water. |
| Suction | Caused by the interaction of surface tension forces with the surface hydration forces when the clay dries out. |
| Swell | Caused by water being absorbed, triggering the clay to increase in volume |
| Shrinkage | Caused by water evaporating |
| Plasticity | Caused by water acting as a lubricant between clay particles. |
Generally, the most dominant parameter that has been tested is the moisture content of cob and its relationship with the compressive strength. The work of Keefe (2005) explores this relationship and is shown in Figure 2.1.
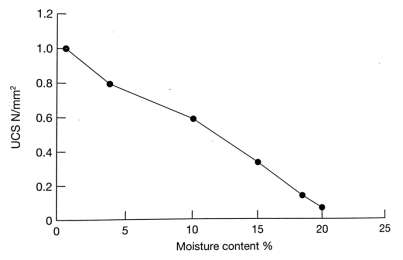
Figure 2.1 Change in Ultimate Compressive Strength (UCS) of straw-clay with moisture content (Keefe, 2005)
Here, there is a reduction in compressive strength with an increase in moisture content. The ultimate compressive strength varies from 0.05 N/mm2 (50 kN/m2) to 1N/mm2 (1000 kN/m2) at a moisture content of 20% and 1% respectively. This is a large variation in compressive strength, demonstrating that moisture content is a critical parameter in the use of cob as a building material.
2.1.1 Effect of Moisture Content on Function
The research of Greer (1996) highlights that there are three modes of failure linked with the moisture content of cob:
- High moisture content;
- Low moisture content;
- Intermediate moisture content.
Clay soils at a high moisture content (>10%) possess little cohesive properties, as an excess in moisture between clay particles causes the bonds to become weaker as the tensile strength provided by the surface tension reduces. Subsequently, the soil fails by plastic failure as it is no longer able to hold together. Plasticity is mainly caused by the adsorption of water at the surface of the clay mix. Clay particles therefore require water to cohere to each other. Due to these particles having a large specific surface, adsorption of moisture has a significant effect on the behaviour of the clay fraction (Greer, 1996). The plate-like structure of clay particles allows the water to act as a barrier between them, allowing them to slide freely over each other. The more water is present, the more the particles can slide; subsequently causing the clay to behave in a plastic manner. This continues with the addition of water, until it can no longer hold together and gravity overcomes it. This is known as the liquid limit. The range between the point clay can just hold together to the moisture content at which it no longer can is known as the plasticity index. A low plasticity index demonstrates that a soil will transfer between its plastic limit and liquid limit with little change in moisture content. Therefore, a low plastic index in cob would indicate a low resistance to failure and a rapid collapse.
At low moisture contents (
This change in failure mode is not considered to make the cob significantly weaker. An intermediate moisture content implies a mixture of plastic flow and crack propagation (Greer, 1996).
Keefe (2005) supports the suggested failure modes for cob blocks, as compression tests are carried out on a damp and a dry sample of cob. The damp sample (at 10.5% moisture) fails plastically, whereas the dry sample fails in a brittle manner by producing a shear crack. The exact compressive strength required of a cob wall depends on the loading within the house. As previously mentioned, approximately 0.6N/mm2 is considered adequate for domestic loading, however, the failure stress of historic cob could significantly differ from this. Consequently, the material properties of cob that effect the absorption of moisture are of intrigue for this project. Further research into this could imply a critical material contents or moisture content of the cob, in which case intervention via repairs would take place.
2.2 Straw content
Straw within cob provides the essential tensile strength required to carry and distribute loads. At correct proportions, the straw within the cob promotes an increase in compressive strength due to its ability to prevent cracks from propagating. Straw reduces the stress created by a crack, through bridging the tensile forces across the crack, rather than allowing it to further split the clay. It also works by increasing the surface area the crack must generate to spread (Greer, 1996).
Observations by Greer (1996) demonstrate how the straw affects the dry shrinkage properties of cob. Two mixes were compared, one with straw and one without. The mixture without straw produced a small number of very large cracks upon drying. Whereas, the mix with straw produced much smaller cracks. This indicates that as the percentage of straw in cob is increased, the size of cracks produced whilst drying decreases. The research of Saxton (1995) supports this, observing that samples with the lowest straw contents produced the largest cracks. Minimised cracking is beneficial in that it improves the level of stress the material can tolerate (Greer, 1996).
An excessive straw content can also cause larger cracks upon drying. Greer (1996) suggests that over a certain percentage, the straw could contribute to making the material weaker. Keefe (2005) reinforces this, stating that areas of high straw content contribute to weaknesses within the cob material, largely due to a reduction in cohesion between straw strands. This factor is unlikely to be an issue in historic cob, as they would either have collapsed already, or would not have completed construction due to the cob mix not passing the rules of thumb set by cob builders (Pearson, 1992).
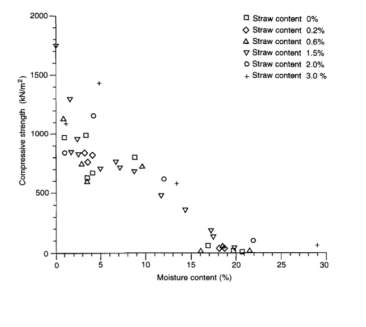
2.2.1 Moisture and Straw Content
Saxton (1995) investigated the relationship between moisture and straw content and the compressive strength provided by the corresponding cob mix. The results of Saxton (1995) are shown in Figure 2.2, presenting that the highest compressive strengths are achieved at moisture contents of approximately 2% and a straw content within a range of 0-1.5%. It is interesting here that at a straw content of 3% and 2%, the compressive strength decreases once the moisture content reduces to 1%. This pattern further reinforces the findings of Greer (1996), suggesting that at higher straw contents, the level of cracking is increased causing a reduction in the compressive strength. This is prominent at lower moisture contents, as there less interaction between the clay and straw. Moisture is required for this to be successful.
Despite this, the presence of straw within cob enables it to be used for construction. Similarly to concrete, Cracks in cob are areas of weakness, and are a clear sign of failure in historic walling. Since it is important to understand when a building is failing, the presence of straw adds a factor of safety here as the inhabitants are given warning of its failure. The absorption and desorption of moisture is affected by the straw content of cob (Saxton, 1995). This could also contribute to the plasticity of the material.
2.2.2 Soil Type
It is understood from geological analysis of the Devonshire area that the types of soil significantly vary dependent on location and the soils used to construct the houses consequently differ, too. The geology within Devon mainly consists of Carboniferous slates, siltstones and sandstones (Harries, 1995). It is thought that this variance in geology can cause buildings to be particularly susceptible to failure. Keefe, et al. 2001 suggest that buildings in separate geological regions are at a greater risk of failure such as the Permo-Triassic being at greater risk than the Culm measures. Historically, the Culm measures are successful in use for construction (Historic Buildings Trust, Devon, 1992)
These soils here vary in cohesion, strength and other factors which in turn affect the overall properties of cob. The variation in soil type was recognised by Coventry as a factor contributing to the compressive strength of cob (Saxton & Coventry, 1995). Coventry (1995) found that the compressive strengths of cob samples from three different geological regions in Devon were significantly different. This indicates that the soil type has an impact on the strength of cob. Keefe, et al., (2001) looks further into this, suggesting that the presence of excess salts can effect the compressive strength of cob.
The presence of salts is advised to be of equal importance in cob failure to its moisture content by Keefe et al. (2001). Little is known of the effect salts have on cob walling, however it is proposed here that salts can increase the moisture content, as well as cause voids within the material. Houben and Guillard (1989) briefly explain that salts cause efflorescence and might contribute to the deterioration of cob over time. An investigation into the salts present in cob is beyond the scope of this project, but is worth noting as an area for future work.
2.3 Particle Size Distribution
The sensitivity of cob to moisture is somewhat governed by its particle size distribution. Greer (1996) explains there is a link between the capacity of cob in absorbing moisture and the strength of a cob wall. It is understood that the ideal cob mix has a well-graded particle size distribution (Keefe, 2005). Those that build with cob successfully have rules of thumb that ensure the mix of cob is adequate for construction (Pearson, 1992). For example, they can indicate if the clay content is high enough to hold the particles together. The Historic Buildings Trust (1993) highlight that cob with low levels of clay and silt particles are particularly susceptible to failure. Pearson (1992) suggests an upper and lower bound particle size distribution, of which soil within these bounds is considered suitable for earth construction. Saxton (1996) advises that a typical cob wall contains 35% gravel, 35% sand and 30% clay, with a tolerance of 10% for each. This is summarised in Figure 2.3.
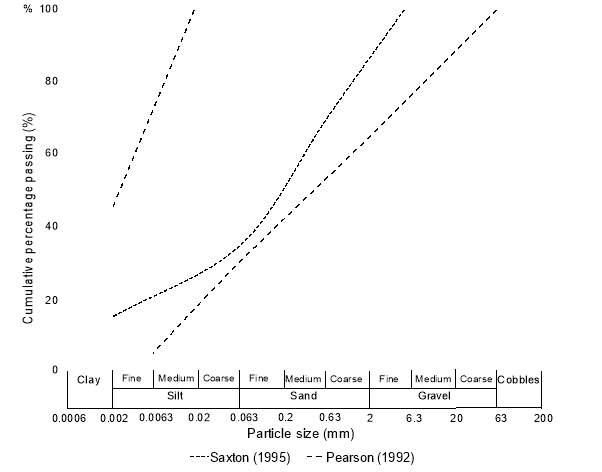
Figure 2.3 Recommended particle size distributions of cob from Pearson (1992) and Saxton (1995)
Despite the recommendations being based on real cob buildings, not all buildings follow this distribution (Keefe, et al., 2001). The work of Keefe et al., (2001) covers data collected from failed cob buildings, in which only 5 of 22 samples followed the typical distribution suggested by Saxton (1995). There is opportunity to investigate this further, through consideration of further cob walls within the Devonshire area.
The effects of particle size distribution on the strength of cob can be compared to that of concrete. This is assumption is considered reasonable as cob and concrete demonstrate some essential similarities. Both are composite materials, with one part possessing a higher compressive strength than the other (aggregate and clay/cement), encased within a cohesive material with a low compressive strength (Greer, 1996). The varying stiffness of the components of cob provides different levels of resistance to loading. Once loaded, the aggregate will deform less than the clay and the distribution of strain will depend on the distribution of particle sizes. A poorly graded cob (with large steps in its grading), for example, is unable to distribute strains effectively, due to an increase in the volume of voids.
A well-graded particle size distribution ensures that there are minimal voids within the mix. This is inevitable within cob material, however it can be minimised. Voids are an issue structurally as they do not provide stiffness to the material, thus contributing to strain magnification (Greer, 1996). Strain magnification is an extra strain distributed on the clay during compression, due to an increase in voids, or a reduction in gravel. Greer (1996) talks of “macro” and “micro” voids present within cob, each affecting its compressive strength in different ways.
Micro voids (10-50 nm) are, as Greer (1996) describes, caused by adsorbed water and any “repulsive or attractive” forces between particles. The volume of micro voids depends on the moisture content of the material and the available charge in the clay particles and moisture ions. Micro voids will be found in the clay fraction of the cob mix. The quantity of micro voids is increased due to the plate-like structure of the clay, and affects the compressive strength of the cob material by increasing the distance that the forces on the bonds between particles need to travel.
Macro voids (200 to 300 m) are a similar size to air voids in cob, and are determined by the compaction process, packing density and the quantity of clay/silt (Greer, 1996). Keefe (2005) supports this, stating that voids are a result of inadequate compaction or straw dispersal. There is a relationship between void content and permeability of the soil, as the more voids there are within the mix, the more moisture-absorbing capacity it has. The void content has an adverse effect on the compressive strength of cob due to it creating inherent weaknesses in the mix, however Greer (1996) does not explore the degree at which it is affected. This effect can be likened to the effect of cracking in the material (Section XX).
Keefe, et al. (2001) further comments that the aggregate content can affect the strength of cob. Aggregates contribute to the strength of cob as they prevent the growth of cracks. A crack must have enough force to overcome the bonding between the clay and the aggregate, or enough to overcome this and the strength of the aggregate particle (Greer, 1996). The aggregate, therefore, holds the cob together due to the bond strength between it and the clay, much like the same interaction with straw. Therefore, it is important that the cob mixture has a good variation of particle sizes so the collaboration of aggregate and smaller particles is optimised (Warren, 1999).
The particle size distribution is therefore understood to some extent; most understanding has been learnt by cob builders throughout the trial and error process in construction, others from analysis of other materials. The particle size distribution will be a focus of the research in this project, as it is felt there is significantly more to learn here.
2.3.1 Plasticity
Keefe (2005) suggests that it is the plasticity and cohesion of soils that are the most important in their use as a building material. In its most basic form, plasticity is the combination of the particle size distribution and the moisture content of the soil. The particle size distribution governs the moisture capacity of the soil, thus its behaviour at a variation of moisture contents. Plasticity is defined by the Atterberg limits (BS 1377-2:1990) which include the plastic limit and liquid limit. The plasticity is considered for the clay fraction only, as the test only includes the soil passing through the 0.425mm sieve. It is these smaller particles that govern the properties of a soil, whereas the larger particles fill the voids (Barnes, 2010). These limits have been found in most relevant literature, mostly as a preliminary classification test.
Pearson (1992) makes the comparison between the plasticity in clay and chalk, as seen in Figure 2.4. This comparison is made as chalk has been known to be used in some cob walling (Pearson, 1992).
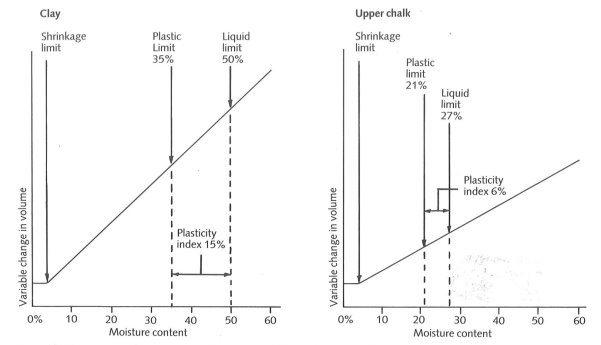
Figure 2.4 Comparison between plasticity of clay and chalk (Pearson, 1992)
As shown here, the plastic index of clay is much larger than the plastic index of chalk. Thus, clay can remain in a plastic state for a larger range of moisture contents, and has less of a sudden transition between plastic and liquid, or plastic and solid. Clay also seems to increase in volume much more rapidly with an increased moisture content, indicating that dry shrinkage and settlement in cob with primarily clay as its binder, is a more significant factor than in cob with chalk.
Saxton (1995) recommends that a typical cob mix has a plastic limit (PL) of 20% and a liquid limit (LL) of 40%, giving a plastic index (PI) of 20%. These are lower than those found by Pearson (1992), as a PL of 35% and a LL of 50% was found for clay (Figure 2.4). Both were found at the same grading; all soil passing through the 0.425mm sieve (BS 1377-2: 1990). However, they contain a different particle size distribution as Saxton (1995) was performed on cob, whereas Pearson (1992) was only clay, which would contain mostly particles of sizes smaller than 0.02mm whereas the cob would contain a range of particles larger than this.
The plasticity of adobe bricks is discussed by Houben and Guillard (1989), and boundaries for the suitable plastic index and liquid limit are suggested. This is shown in Figure 2.5. Adobe is similar to cob in that it contains a well graded soil with the addition of straw. It differs, however, as it is left to dry in the sun before being used for construction. Nonetheless, its basic build-up is comparable to cob. In Figure 2.5, a liquid limit between 30% and 50% is suggested, giving a plastic index of between 15% and 30%. Both the findings of Pearson (1992) and Saxton (1995) fit within this criterion, however the particle size distributions are considerably different. Saxton (1995) adds that a LL above 60% and a PI greater than 30% is unsuitable for cob due the significant shrinkage upon drying, as well as the mixing time. Thus, these boundaries are not agreed upon entirely. Further research into where the boundaries lie for historic cob is necessary, and will be completed in this project.
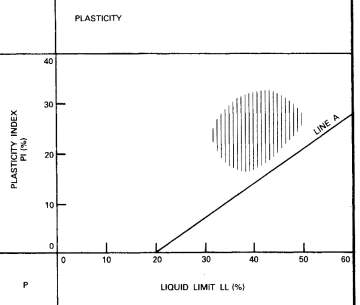
Figure 2.5 Recommended plasticity for adobe bricks (Houben and Guillard, 1989)
2.4 Current Survey Procedure
Keefe, et al. 2001 also recognised a need for a diagnostic procedure of analysis to follow to understand the failure modes of cob buildings. Here, a 6-step procedure is suggested, including qualitative and quantitive stages, and are based on the analysis of 22 cob buildings that have failed within a 35km radius of Exeter, Devon. The steps are listed below (Keefe, et al., 2001).
- “Characteristics and features of the site environment
- Building structure or construction
- Maintenance and repair history of the building
- Condition of the building and possible causes of failure
- Procedure for dampness surveys
- Analysis and testing of the cob”
Most of the phases involve measuring and observing actual cob buildings, and the stage most applicable to this project Is stage 6, where samples are taken to the laboratory. The authors endorse a simplified particle size distribution, which only requires up to 600g of material. This, along with an analysis of fines, plastic and liquid limits, dry density, porosity and compression tests if enough material can be acquired are suggested areas of investigation.
Although the data that would be collected as a result of this diagnostic is useful in describing the properties of cob, little conclusions can be drawn about the material properties and the critical levels. It also relies on access to large volumes of material being readily available. It is largely accepted that the moisture content is one of the main causes of failure, so the use of remote sensing moisture content devises is suggested with the aim of monitoring moisture content within cob. This method of material analysis appears to be a simple solution to an obvious problem; once the moisture content reaches a certain ‘critical’ content, a specialist is notified and action is taken. Unfortunately, there are limitations to this method in that the reliability of the sensors is largely unknown and, as previously mentioned, the failure of cob is caused by the contribution of many different variables. However, the use of moisture sensors could provide a preliminary warning to the potential collapse of a building, perhaps set up once the material properties and the effects this has on the strength of cob is known. Keefe, et al. recommends that further research of the effects on particle size distribution is needed, in addition to the general properties and the consequence of these on the structural integrity of this natural material.
2.5 Summary and Conclusion
It is concluded that cob is a considerably varied and complex natural building material; the properties of which are understood to some extent, yet there is a large scope for further research. It is implied that the moisture content is perhaps the biggest contributor to failure within the cob material, Pearson (1992) even stating that the “biggest threat [to earth construction] is moisture”.
The moisture content of cob has been investigated to a great depth and approximate strengths are known for a variety of moisture contents. When the proportion of straw is varied, however, the compressive strengths appear to vary more significantly. Other properties of cob, such as the void content, drying shrinkage have been investigated, giving general conclusions on the effects these have on its use as a building material.
The plasticity of cob has been highlighted as a particularly important parameter in successful cob material. The plastic and liquid limits are typically found using BS 1377-2: 1990 through the Atterberg limits. These tests are limited as they only consider soil passing the 0.425mm sieve. Within literature, these limits are usually performed as part of the classification process. Due to its noted significance, the plasticity of cob will be investigated further to gain additional appreciation of the behaviour of cob. In conjunction with this, a need for understanding into the absorption properties of cob at a variation of particle size distributions.
The particle size distribution is recognised as another important factor contributing to the properties of cob. The effects of the particle size distribution on the compressive strength is an area that has not been investigated, particularly not for historic cob.
3 Materials and Methodology
To gain further understanding of the plastic behaviour of cob and its link with the moisture, the following properties will be investigated;
- Physical Properties
- Particle Size Distribution (PSD)
- Plastic Limit (PL)
- Liquid Limit (LL)
- Dynamic Vapour Sorption (DVS)
- Mechanical Properties
- Compressive strength
The particle size distribution is first determined as this information is necessary in learning how the material being used for this project compares to historic cob and literature. The plastic limit, liquid limit (Atterberg limits) and vapour sorption tests demonstrate how the cob reacts to moisture. Compression tests are then performed to understand how this variation in moisture effects its performance in compression.
3.1 Materials
Cob material has been sourced from Mike Wye & Associates (MW) in Devon. All material used to make the cob has been sourced from the area local to MW. This material will be used for the testing in this project. Historic material was not used due to the large mass of material required; historic cob material is scarce and protected. The material used for this project is typically used for repair works, and is thus required to provide equivalent strengths to historic material. MW test the blocks prior to distributing them, to ensure they surpass a minimum compressive strength. Classification procedures were first carried out to gain an understanding of the material in line with BS 1377-2: 1990. For other tests where standards were not present, BS 1377-2: 1990 was modified to suit. The material will be stored in the soils laboratory at the University of Bath, at a relative humidity of 40% (average room humidity).
3.2 Particle Size Distribution
The particle size distribution is determined by three different tests defined in BS 1377-2-1990. For the largest grains, the dry sieve method is used. This was chosen as at the largest diameters, the contribution of residual clay material is negligible. The wet sieve method is then used for grains passing through the 6.3mm sieve. For particles smaller than 0.063mm, the hydrometer method is used. All three methods are combined to produce an overall particle size distribution.
3.3 Plasticity Testing
The particle size distribution of the cob material and the effects this has on the plastic and liquid limit will be tested. The plastic and liquid limits are measured using different gradings of soil, with proportions set out by the particle size distribution gained in Section 3.3.
The cone penetrometer test is used to determine the liquid limit (LL), whilst the plastic limit (PL) was found using the method stated in Section 5 of BS 1377-2: 1990. These are the Atterberg Limit tests. Plastic Index is found using the difference between these two limits.
Atterberg limits will be found for different gradings of cob; each sample being the soil passing a grading of sieve. For instance, a sample considered ‘
3.4 Moisture Content
Samples are placed in a drying oven at 105C for 24h. Moisture content of the soil is determined using the method defined in BS 1377-2-1990, Section 2.
3.5 Dynamic Vapour Sorption
The dynamic vapour sorption (DVS) equipment monitors and records the response of a material to the relative humidity (RH) of the air surrounding it and is shown in Figure 3.4.
Tests using the DVS will be undertaken in the same manner as the plasticity tests in that the influence of each particle size will be observed. Each test takes approximately 14 hours and uses 50mg of material. The RH is incrementally increased over this period, whilst the change in mass is recorded. As shown, the relative humidity is increased and the mass is recorded once equilibrium has been reached at the particular RH and the mass no longer changes. Typically, the relative humidity is increased in steps of 5% from 0% to 95% (sorption) and returns to 0% (desorption).
For each grading, samples are built up using the particle size distribution gained from Section 3.1. Figure 3.4 shows the constituents of one sample weighing approximately 5g, out of which a representative sample of approximately 50mg is taken.
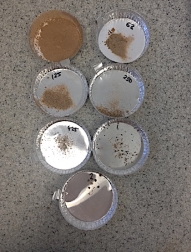
Figure 3.2 Make up of
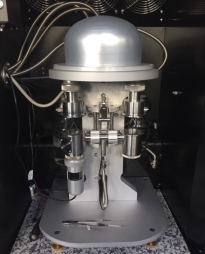
Figure 3.3 DVS Advantage 1
3.6 Compression
To test the behaviour of the cob blocks in compression, the Dartek 2000kN and Mayes 200kN testing frames are used. All cob blocks are placed in the same orientation, seen in Figure 3.4. The effects of capping were ignored here, as all tests were performed in the same way and considered negligible.
Variation in moisture content will be achieved through placing the blocks in different RH environments, including 20%, 40% (RH of room), 95% and fully submerged in water. Each block is placed in the humidity chamber for a period of 21 days. The submerged block is submerged in distilled water for a period of 10 minutes, and then compressed in the same manner.
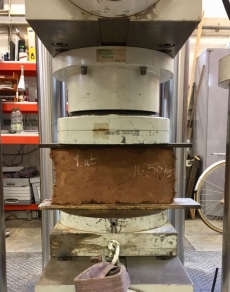
Figure 3.4 Compression of cob block showing orientation
4 Results
4.1 Material Properties
4.1.1 Particle size distribution
The particle size distribution measured for a single cob block from MW is shown in Figure 4.1. It is well graded, with an approximately linear distribution. The distribution of the cob block clearly lies within the recommended boundaries of Pearson (1992), although follows a dissimilar grade line to that recommended by Saxton (1995). The block contained 0.58% straw. This was removed during the sieving process, after the dry sieving was completed.
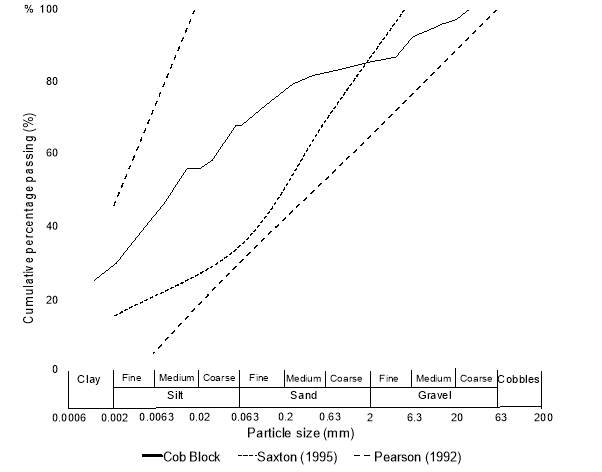
Figure 4.1 Particle size distribution of cob block
4.1.2 Plasticity
The results of the plasticity tests are provided in Figure 4.2. The cob block at a grading of 0.425mm (BS 1377-2: 1990) is found to be a low plasticity clay (CL). The
To complete these tests, a total of 16kg of cob material was sieved using the dry and wet sieving methods. From this material, 400g samples were built up using the PSD found in Section 4.1.1, at 7 different gradings. The Atterberg limit tests were then completed on each sample.
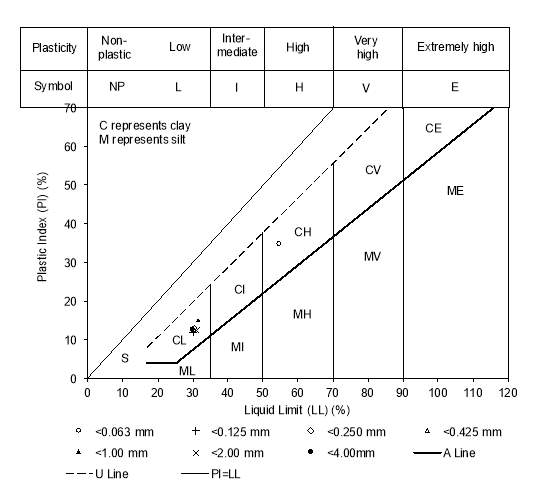
Figure 4.2 Results of plastic and liquid limit tests (BS 5930: 2015)
4.1.3 Dynamic Vapour Sorption
Vapour sorption tests were performed on soil at the same gradings as used for plasticity testing, using the particle size distribution found in Section 4.1.1. Figure 4.3 shows the sorption curves from the DVS test. The desorption curves were recorded but not shown, for clarity. The change in mass is equal to the moisture content of the sample. Resembling that seen in the plastic and liquid limits, the
The DVS tests were carried out over one complete cycle, with an additional calibration cycle. One cycle is considered as a rise in the RH from 0% to 95% and back to 0%.
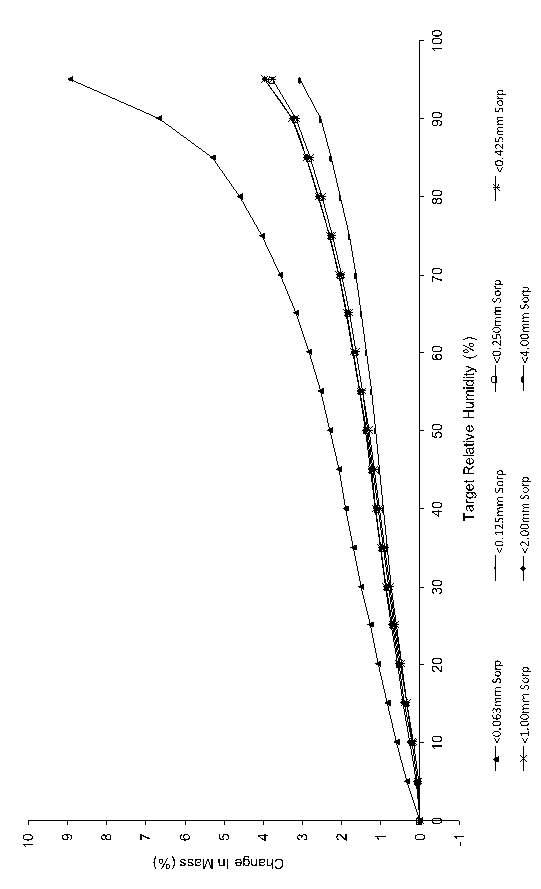
Figure 4.3 DVS results for MW cob at different gradings
4.2 Physical Properties
4.2.1 Compression
Samples of cob block representing different moisture contents were tested in triplicate, allowing for analysis in variability. The blocks were compressed, unconfined, at a constant displacement rate of 3mm/min vertically, which was applied until a peak stress had been reached. The results of maximum stress and young’s modulus generated by the cob blocks are seen in Figure 4.4 and Figure 4.5 respectively.
The maximum stress represents the strength of the material and is shown to decrease with an increase in moisture content. The variability of the material is clear; demonstrated by the error bars. The readings at 2.24% moisture content (20% RH) included only 2 blocks due to an anomalous block in the set. This block had a much lower maximum load due to the stress being concentrated on a central rock protruding the top of the block.
The young’s modulus (YM) of a material represents the stiffness of a material. Again, there is a decreasing trend, with the young’s modulus of cob decreasing with increase in moisture content.
Figure 4.4 Maximum stress in cob blocks at different moisture contents
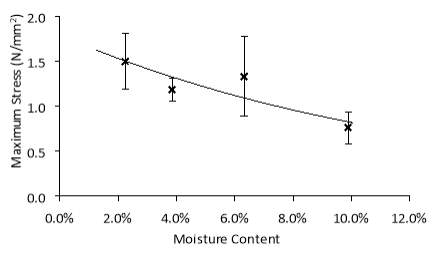
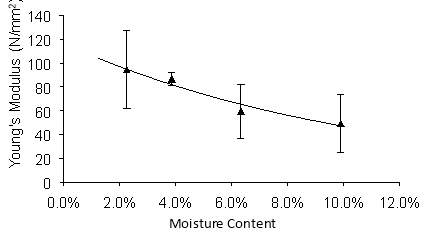
Figure 4.5 Young’s modulus of cob blocks at different moisture contents
5 Analysis and Discussion
5.1 Particle Size Distribution
The particle size distribution of the cob block is representative of cob, as it is reasonably well graded and lies within the recommendations of Pearson (1992). The distribution is significantly different to the suggested typical PSD for cob by Saxton (1995). Nonetheless, the cob material does include more than 15% of clay, as Saxton (1995) suggests that there should be more than this value to ensure there is enough to act as a binder between the other gradings.
The cob block tested indicates a much larger proportion of material below 2mm than recommended by Saxton (1995), at approximately 68%, suggesting that cob is made up a larger proportion of smaller particles. In contrast, there is much less material than the suggested typical that is above 2mm. The distribution set by Saxton (1995) is suggested to have an error of ±10%. Figure 5.1 shows these boundaries graphically.
The cob block tested only follows these boundaries marginally. The significance of this is unknown as only one cob block was tested and will not be found unless more PSD tests are completed on the cob blocks. The particle size distribution found was taken, for the purposes of this project, as representative of historic material. The distribution of historic cob is proposed as an area of further work.
5.1.1 Limitations
There are many limitations to these results, the main factor being that only one cob block was tested. This was largely due to prioritising later work which might be more applicable to the project. Saxton (1995) demonstrates work into the particle size distribution of cob, however there is scope for more research to be done in terms of historic cob material, since it is the basis of tests in the proceeding sections.
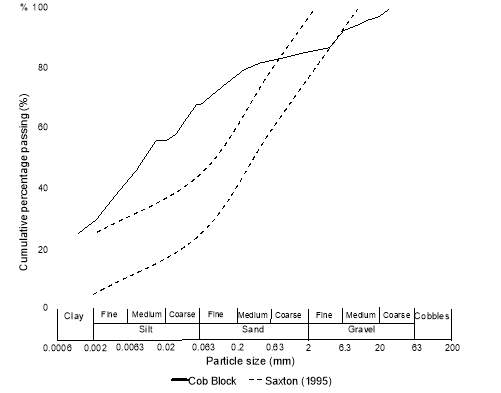
Figure 5.1 Saxton (1995) distribution ±10%
5.2 Plasticity
5.2.1 Plastic Limit
The Plastic Limit (PL) of the material is classified by the soil passing through the 0.425mm sieve (British Standards Institution, 1990). Here, the PL of soil passing through the remaining sieves has been found using the same method of rolling cylinders until they break at 3.0mm. For the sample of material that had passed through the 4.00mm sieve, this was somewhat challenging due to some of the particles being larger than the 3mm rod. Nonetheless, the proportion of material that was smaller than 3mm is greatly out-weighed by the particles that were larger (see Figure 3.2).
The plastic limits of the various gradings of cob material have been plotted against their moisture content at which the plastic limit was reached in Figure 5.2. The PL peaks at the soil that has passed through the 0.063mm sieve. As the grading begins to include larger particle sizes, the moisture content is linear. The high moisture content of the material smaller than 0.063mm is expected due to the higher surface area of the smaller particles, ultimately making it more sensitive and absorbent.
A low coefficient of variance is important in showing that the measurements taken are valid. The coefficient of variance (COV) for the plastic limit is shown in Table 5.1. Generally, the COV for the data sets is low, the average being 2.27%. Confidence intervals demonstrate that the data is close to the true value. For the plasticity tests, the 95% confidence interval produced an average of 0.65%, which reinforces the fact that the plastic limits achieved are likely to be close to the true value (Table 5.1). The standard deviation is the distance from the mean, which reinforces the fact that the results are valid as this is also relatively low. Therefore, the results are considered valid.
Despite these statistics, there is still some variability in the results. From Figure 5.2, in general, the plastic limit tends to remain linear after 0.125mm. However, some of the gradings produce overlapping error, such as that between the
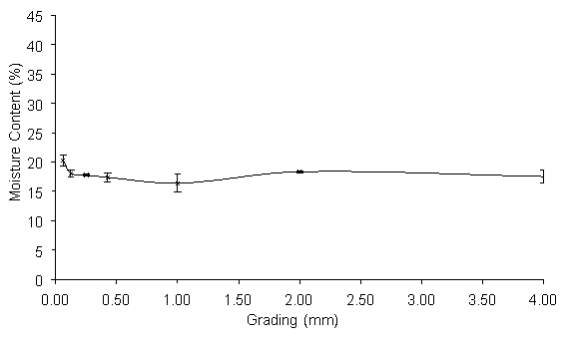
Figure 5.2 Plastic Limits of cob at different gradings
Table 5.1 Plastic limit statistics
| Aver-age | ||||||||
| Plastic Limit (%) | 20.28 | 18.09 | 17.79 | 17.40 | 16.39 | 18.37 | 17.54 | |
| Standard Deviation (%) | 0.57 | 0.19 | 0.47 | 0.47 | 0.36 | 0.30 | 0.49 | 0.41 |
| Coefficient of Variance (%) | 2.83 | 1.07 | 2.66 | 2.70 | 2.19 | 1.64 | 2.78 | 2.27 |
| 95% Confidence Interval (%) | 0.91 | 0.31 | 0.75 | 0.75 | 0.57 | 0.48 | 0.78 | 0.65 |
5.2.1.1 The T-Test
The t-test is a statistical way of determining whether two data sets are reliably different (Devore & Berk, 2012). This is relevant for the plastic limit, as quite often the plastic limits of two different gradings are very close together, meaning that one cannot state whether they are statistically different to each other. The t-test applied here was 2-tail and type 3. Typically, if the test yields a P-value lower than 5% the two variables are statistically different (reject the null hypothesis). The hypotheses for the tests are:
- H0: There is no difference in the data (P-value
- H: There is a difference in the data (P-value >5%)
The results of the t-test are shown in Table 5.2. Red/orange indicates a P-value greater than 5%; green indicating a P-value less than 5%. Notably, the t-test demonstrates that the grading less than 0.063mm is statistically different to all other gradings of cob soil, with the largest P-value here being 0.269%. The highest P-value is between the
| Sample (mm) | |||||||
| 0.269% | 0.063% | 0.029% | 0.008% | 0.277% | 0.039% | ||
| 0.269% | 30.675% | 5.443% | 0.061% | 17.901% | 10.857% | ||
| 0.063% | 30.675% | 29.264% | 0.401% | 9.328% | 49.975% | ||
| 0.029% | 5.443% | 29.264% | 1.561% | 1.749% | 69.334% | ||
| 0.008% | 0.061% | 0.401% | 1.561% | 0.018% | 1.054% | ||
| 0.277% | 17.901% | 9.328% | 1.749% | 0.018% | 3.512% | ||
| 0.035% | 4.398% | 45.025% | 65.772% | 0.317% | 1.154% |
Table 5.2 P-values for t-test of plastic limit
5.2.1.2 Observed Trends
The plastic limits produced by the different gradings of soil can be summarised by the trendline seen in Figure 5.4. This has been taken from Figure 5.2, and simplified into two linear relationships. The peak is at the
Nonetheless, there is still error in these readings. The 95% confidence interval for the plastic limit, as seen in Table 5.1, has a maximum value of 0.91%. This value has been used in Figure 5.6 to demonstrate the expected upper and lower limit of the trendline. It would be of interest to test more samples at these gradings to understand the variability. As previously mentioned, only one plastic limit test was taken for each grading, thus further testing is an area for additional work.
From the correlation shown in Figure 5.6, it is therefore suggested that the plastic limit of the cob is constant after 0.125mm, regardless of grading. More work is needed here, however this is potentially very useful in terms of this project. It could allow the plastic limit to be predicted with larger gradings than suggested by BS 1377-2. As the gradings become greater, it is more representative of the whole cob block, therefore a more realistic plastic limit can be achieved
R2 = 0.723
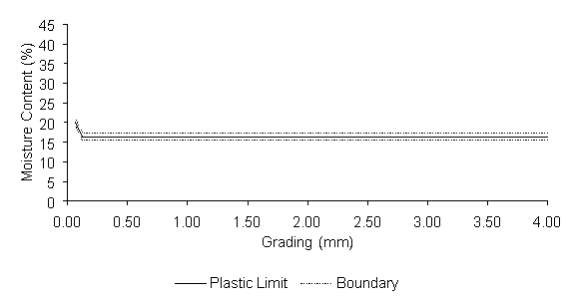
Figure 5.3 Plastic limit trendline with boundary error
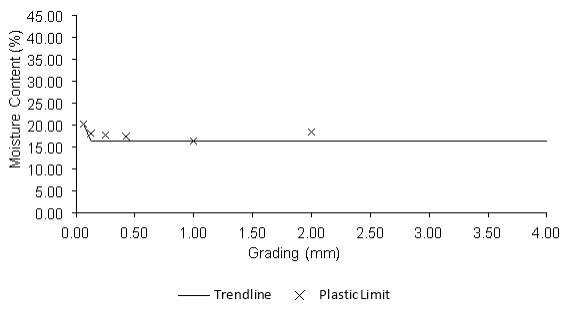
Figure 5.4 Plastic limit with suggested trendline
5.2.1.3 Limitations
The plastic limit test carries limitations in that there is large scope for human error. The size of the break, for example, might not always be at exactly 3mm and is up to the individual undertaking the experiment to decide. To make the data here as close to the true value as possible, 4 tests per grading were completed. Notably, there is still some error in this, however due to the nature of the material this is considered negligible.
5.2.2 Liquid Limit
The liquid limit was determined using the graphical method described in BS 1377:2, thus the spread in data is likely to be varied throughout each sample set. The variation is, therefore, due to human error in the mixing and cone-drop process. Nonetheless, all tests were carried out by the author and observations in the test process provide an understanding into the sensitivity in the material to moisture.
Figure 5.2 shows this graphically. The error bars demonstrate the error at the 95% confidence interval. The sample of soil smaller than 0.063mm has a liquid limit significantly larger than the remaining samples, however, it also produces the most considerable confidence interval. During the test here, it was noted that the material of the
The liquid limit follows a very similar trend to that seen in the plastic limit. There is a large peak at the material passing through the 0.063mm sieve, however, the material at larger gradings follows a linear pattern. As the larger gradings are introduced, the proportion of particles smaller than 0.063mm decreases, thus the surface area of the total sample is also decreasing.
The coefficient of variance for the liquid limits has an average of 2.37%. This indicates a greater variance in data than produced by the plastic limit, though only by a small margin. The 95% confidence interval is additionally greater in the liquid limit, as well as the average standard deviation. Significantly higher values of all three parameters are produced by the grading less than 0.063mm, which increases the average. This is mostly due to experimental error in achieving the 20mm penetration, especially in the case of
Figure 5.5 Liquid limit of different gradings of cob material with 95% confidence interval
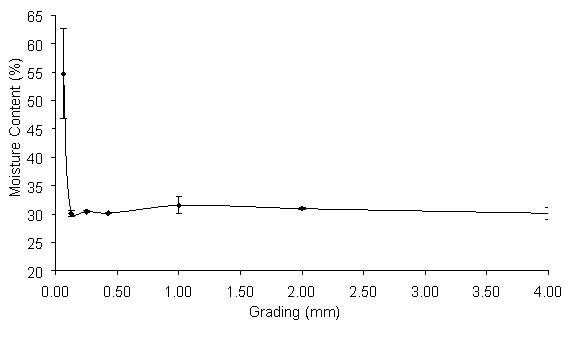
Table 5.3 Liquid limit statistics
| Aver-age | ||||||||
| Liquid Limit (%) | 54.71 | 30.15 | 30.04 | 30.43 | 31.52 | 30.95 | 30.13 | |
| Standard Deviation (%) | 4.97 | 0.05 | 0.45 | 0.09 | 0.94 | 0.14 | 0.66 | 1.04 |
| Coefficient of Variance (%) | 9.08 | 0.16 | 1.48 | 0.29 | 2.98 | 0.44 | 2.18 | 2.37 |
| Confidence Interval (%) | 7.90 | 0.08 | 0.55 | 0.11 | 1.50 | 0.17 | 1.04 | 1.62 |
5.2.2.1 Observed Trends
The liquid limit demonstrates a similar pattern to that seen in the plastic limit, in that it peaks at 0.063mm, and then becomes relatively linear after 0.125mm. Figure 5.7 demonstrates this, with the linear section taken as the liquid limit at the
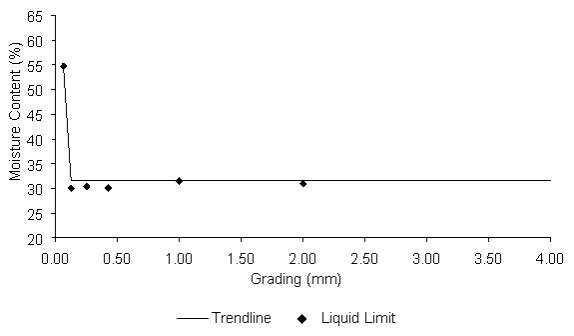
R2 = 0.997
Figure 5.6 Liquid limit with suggested trendline
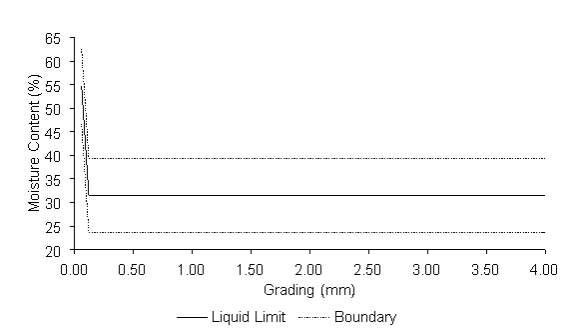
Figure 5.7 Liquid limit trendline with error bounds
5.2.3 Comparison
The plastic and liquid limit correlations have been combined in Figure 5.9. The variation in COV can clearly be seen here; the liquid limit produced a much greater value than the plastic limit. This is largely due to the different testing methods and the variation of the liquid limit can be reduced through improvement in testing technique. It is interesting to note that the difference between the plastic limit at 0.063mm and 0.125mm is much smaller than seen in the liquid limit. This indicates the increased sensitivity of the particles smaller than 0.063mm to higher moisture contents. There is scope for further investigation into this.
The limits achieved here lie within the boundaries set by Houben and Guillard (1989), shown in Figure 2.5. Due to this, the zone could be considered as representative of cob as well as adobe. However, more Atterberg limit tests are required for this to be confirmed. The PL and LL achieved by Saxton (1995) are greater than those achieved in these results, although Saxton (1995) only gives values of approximately 20% (PL) and 40(%). The liquid limit suggested by Saxton (1995) lies within the boundaries set in Figure 5.9, which indicates that this correlation can give a rough indicator of the liquid limit. However, the same cannot be said for the plastic limit. Future work should consider the relationship between the particle size distribution, the proportion of particles below 0.063mm perhaps, and its Atterberg limits. In doing this, a way of relating the PSD gained to the plastic and liquid limits could be found.
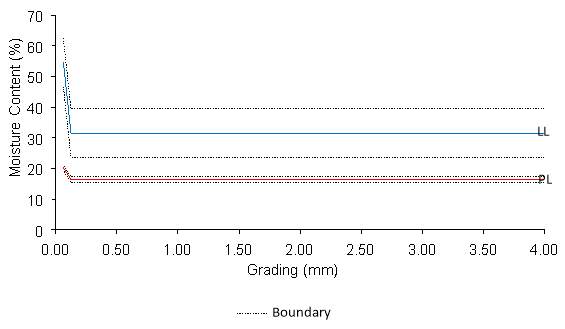
Figure 5.8 Plastic and liquid limit observed correlations
5.3 Dynamic Vapour Sorption
The DVS results show, similarly to the plasticity data, that the 0.063mm grading has a significant contribution to the moisture adsorption capacity of the soil. This is due to the increased surface area of the whole sample; the
DVS data can be used here to gain further understanding in the reaction of cob to moisture (humidity). Figure 5.10 shows how the grading affects the moisture content of the cob at different relative humidity. This relationship follows a similar pattern to that seen in the plastic and liquid limits and could be used in a complementary way. Only the RH values between 60% and 95% have been plotted here, as these were considered the most feasible in Devon, and therefore the most likely RH values for historic cob to be exposed to.
Unlike the plasticity tests, Figure 5.10 shows a decreasing trend in moisture content as the particle sizes become larger. Progressing this, it would be necessary to run DVS cycles on gradings larger than tested for this project, such as
Typically, a complete DVS test involves at least 3 cycles of sorption and desorption. On observation of one test involving 3 cycles, it was concluded that one calibration cycle would be performed, followed by a single sorption and desorption. This reduced the test time by approximately 15 hours and allowed more gradings to be tested.
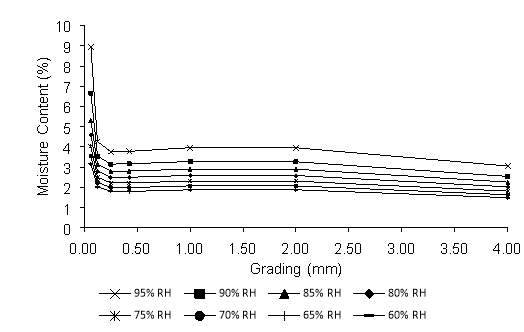
Figure 5.9 Moisture content of cob at different gradings and RH from DVS
5.3.1 The T-Test
The t-test is an indicator of how similar or different a data set is. This has been performed on the DVS data at each grading of sample and is shown in Table 5.4. The results of the t-test should follow the correlation of Figure 4.3 in that the gradings that are close together should have a P-value greater than 5%.
The t-test here, as for plasticity, was 2-tail and type 3. If the test yields a P-value lower than 5% the two variables are considered statistically different (reject the null hypothesis). The hypotheses for the tests are:
- H0: There is no difference in the data (P-value
- H: There is a difference in the data (P-value >5%)
The results of the t-test are shown in Table 5.4. Red/orange indicates a P-value greater than 5%; green indicating a P-value less than 5% (as before). The results suggest the null hypothesis, comparable to the plastic limit, can only be rejected for the t-test between the
Table 5.4 P-value for t-test of DVS results
| Sample (mm) | |||||||
| 5.27% | 2.36% | 2.28% | 3.18% | 3.28% | 0.76% | ||
| 5.27% | 61.01% | 59.13% | 75.29% | 77.24% | 21.49% | ||
| 2.36% | 61.01% | 97.56% | 84.17% | 81.85% | 45.51% | ||
| 2.28% | 59.13% | 97.56% | 81.87% | 79.57% | 47.76% | ||
| 3.18% | 75.29% | 84.17% | 81.87% | 97.75% | 34.26% | ||
| 3.28% | 77.24% | 81.85% | 79.57% | 97.75% | 32.41% | ||
| 0.76% | 21.49% | 45.51% | 47.76% | 34.26% | 32.41% |
5.3.2 Limitations
The DVS results carry some limitations. Only 1 test was carried out for each grading of cob, which could reduce the accuracy of results. In addition to this, just 50mg was used for each sample. The samples for each grading were constructed so that they would be as representative of the cob as possible; a riffler and scales sensitive to 3 decimal places were used. Nonetheless, there is still potential error in this. The use of reduced cycles is also a limitation and has already been discussed.
5.4 Compression
The maximum stresses follow the exponential trendline, as also observed by Heath, et al. (2009). An R2 value of 0.777 is found, indicating a close correlation of the data to the trendline. Figure 5.10 shows the results of Keefe (2005) in comparison to the compressive strengths produced by the MW cob blocks. The exponential for the MW blocks has been forecast to show what strengths would be predicted at a higher moisture content, from the results of these tests. The results from compression tests of the MW blocks are greater than those recorded by Keefe (2005). A different particle size distribution could be a factor contributing to this difference in strength. However, the particle size distribution of the Keefe (2005) cob is unknown, but it can be assumed to be different simply due to the variation in cob expected. The relationship between PSD and compressive strength is an area for future work.
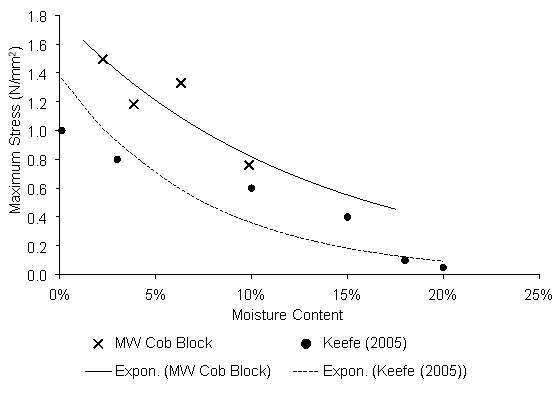
Figure 5.10 Comparison of MW cob compressive strength and Keefe (2005) UCS
The young’s modulus of a material represents its stiffness. The relationship between this and moisture content is shown in Figure 4.4. Again, there is a decreasing trend, with the young’s modulus of cob decreasing with an increase in moisture content. The young’s modulus follows the exponential, which is again observed by Heath, et al., 2009. This allows an accurate prediction of the young’s modulus for an alternative grading. The confidence intervals have an average of 21.37%, indicating a large variance in the data sets. Nonetheless, an R2 value of 0.952 is produced, indicating a stronger correlation between the exponential for the YM than for the maximum stress.
Failure planes of cob material can be seen in Figures 10-13 below. The variability of the cob material is evident from observation; some include large boulders visible on the outside, whilst others contain foreign material such as litter. Although this is not helpful structurally, it should not be ignored as this is typical of the cob construction techniques. Section 1.2 describes the construction method, where soil and aggregates are collected in the surrounding area of the house and mixed on site. Other material is, therefore, inevitably going to infiltrate the mix.
The block at 95% appears to have a steeper failure plane than the block at 20%. The blocks at 20% also seemed to break in a more brittle manner, with failure planes running centrally, rather than close to the perimeter such as in the 95% RH (Figure 4.10 and 4.12). The submerged block produces failure planes that are considerably less well defined; the moisture at the ends of the blocks causing the cob to stick together.
The blocks submerged in distilled for a period of 10 minutes had an average absorption depth of 100mm, which was enough to ensure the block still had enough remaining strength to support itself. The absorption depth is obvious here; the water producing a defined level of absorption (Figure 5.15), whereas this was less clear in the sample at 95% and below. Due to this, it was assumed that the time in which the blocks were submerged was long enough for the moisture to permeate the entire block.
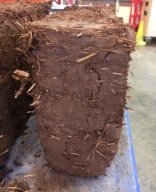
Figure 5.11 95% RH Failure
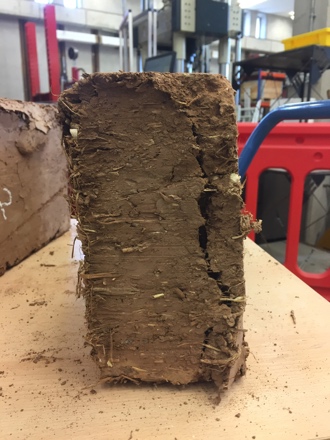
Figure 5.12 40% RH Failure
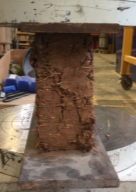
Figure 5.13 20% RH Failure
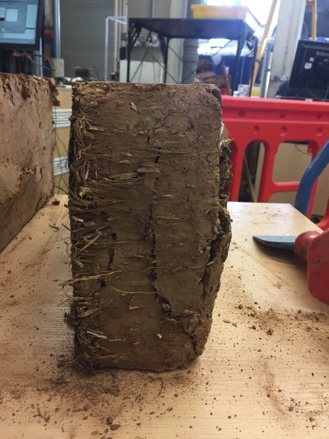
Figure 5.14 Submerged Failure
The submerged cob block absorbed the water particularly quickly at the ends (side seen in Figure 5.14), and on average, water penetrated the blocks by 100mm around the perimeter of this section. The blocks appear to be constructed using extrusion; the ends being sliced to make individual blocks. Because of this, the ends of the blocks are compacted less and the straw is mostly aligned along the length of the block. This increases the capacity of the blocks to absorb moisture at these faces.
Due to the production process in cob historically (Section 1.2), it is expected that there is some variability in the PSD and constituents of cob material. Due to the quantities of material required to do so, this variability is not known for the cob used, however, like any other material, a margin of error is predicted due to this.
Nonetheless, the effects of geometry of the cob blocks is potentially a factor contributing to the variability in compressive strengths, most notably in the difference between strengths demonstrated by the cob here and that seen in literature. Cob tested by Saxton (1995), for example, was compressed in cylinders of 300mm and 150mm diameter, and produced strengths of around 0.6 N/mm2. The cob blocks for this investigation, at the same moisture content, produced a maximum stress of 1.0 N/mm2.
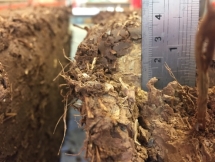
Figure 5.15 Penetration depth of submerged cob block
It was noted that the failure strains of the cob blocks varied progressively more as the moisture content was increased. The submerged blocks failed average 4.3% strain, whereas 40% RH failed at average 2.1% strain. This suggests that the cob blocks with larger moisture content deforms considerably more before failure than those with less. It also suggests that the material becomes noticeably more variable the more moisture is introduced.
5.4.1 Limitations
The results from compressive tests of the cob material are limited in that they are only representative of the MW material, and not historic cob. It is likely that the historic material differs in its particle size distribution, therefore behaviour in compression. A variation in the particle size distribution and the effects this has on the compressive strength in cob is an opportunity for further investigation.
Considering the variability of the cob blocks, and the blocks tested at 20% RH in particular; the probability of an anomalous result is high. It could be considered that more blocks should be tested per data set. However, it was concluded that due to the scope of the project, 3 blocks would be sufficient.
6 Summary and Conclusion
6.1 Summary
In summary, the aims or this project have been completed through experimentation. The results produced as a part of this are relevant in that they add to existing assessment methods of historic cob buildings.
The particle size distribution of the MW cob block was found to be within the limits set by Pearson (1992), however, was significantly different from the distribution suggested by Saxton (1995). This PSD formed the basis of the investigation into the material properties of cob.
The plastic and liquid limits of different sieve gradings were found through using this distribution and re-building samples to complete the Atterberg limit tests. Results of this were of note, as a linear relationship was discovered between the plastic and liquid limits of the cob and its grading, once particles were greater than 0.063mm diameter. These results are significant as they suggest that the plastic and liquid limits of cob are independent of soil grading. This was particularly convincing for the liquid limit, as regression analysis demonstrated there is a strong correlation between them. Due to the larger particle size grading than used in BS 1377-2: 1990, this sample is considered more representative of the whole cob block, thus more representative of a cob wall.
The vapour sorption of the cob material was also found using the same gradings as used for the plasticity testing. Much smaller samples were built up in the same way, and tested using the DVS Advantage 1. Sorption curves produced support the findings in the plasticity analysis as there is a significant difference in the
Compression testing performed in agreement with the recommendations from literature. As the moisture content was increased in the cob blocks, both the maximum stress and young’s modulus decreased. Notably, the maximum stress found in the block with the highest moisture content (9.88%) was greater than 0.6 N/mm2, as recommended by Saxton (1995).
From the results of this investigation, the following approximations of the properties of cob can be made:
- The plastic and liquid limits at a grading smaller than 4.00mm, and greater than 0.125mm
- The moisture content of cob, given its surrounding relative humidity
- Further indication of a critical moisture content
- The compressive strength and young’s modulus of cob, given its moisture content
6.2 Utilisation of Results
The results from this investigation can be used to understand the approximate strength and likelihood of failure of historic cob material, in addition to its general properties. This research should be used in addition to the methods suggested by Keefe, et al., 2001. Aforementioned in Section 2.4 the following procedure for assessment of cob buildings is recommended (Keefe, et al., 2001).
- “Characteristics and features of the site environment
- Building structure or construction
- Maintenance and repair history of the building
- Condition of the building and possible causes of failure
- Procedure for dampness surveys
- Analysis and testing of the cob”
Additionally, it would be necessary to complete a full loading assessment of the building/wall at serviceability limit state to recognise the size of loads on the cob walls. This research can add to stage 6 of this procedure.
Results from previous stages of assessment should highlight areas within a wall that of interest or concern; samples should be taken from these areas as they are worst-case and at risk. These samples should be placed in an air tight container immediately to allow for moisture content readings. It is important that these analyses are carried out by those that understand the building material and have some experience with it.
The variability in the moisture content is critical in ensuring that the cob does not fail due to exposure to too much moisture. The relative humidity in Devon varies between 60-99% annually (Weather Online , 2017). The ambient moisture content of cob can be estimated as between 4-7%, using this data. However, it is unlikely that the relative humidity alone is the driver behind the subsequent moisture content. Cob can take months to regulate its moisture content (Historic Buildings Trust, Devon, 1993). DVS measurements could aid this investigation, as the time taken for the sample to regulate to the relative humidity it is submerged is measured.
Geometry and construction method is an important factor, as a large variation in absorption depth was seen in the submerged block between the narrow ends and the compressed sides. Critical moisture levels are likely to be achieved at higher values of RH. This is demonstrated as when the block was submerged, the maximum stress reduced to 0.76 N/mm2. It is worth noting here that this is still above the strength suggested by Saxton (1995) as adequate for supporting typical domestic loading. Therefore, a ‘critical’ moisture content of cob must depend on other factors, as it is clear from comparisons to literature that one cob mix is completely different to another. It is not likely that one moisture content will be critical for all cob walls; however, the variability is now understood to a greater extent than before.
6.2.1 Process of Assessment
Through analysis of the results of this project, the following process of analysis of historic cob material is proposed:
- Measure RH of surrounding
- Take sample of around 800g from defined critical area
- Determine particle size distribution (simplified version, as suggested in Keefe, et al., 2005)
- Determine Atterberg limits at
- DVS cycle
- Determine moisture content of sample
Further work is required to justify these steps, however, the results of these should give an idea into the properties of the cob building under investigation. They are, nonetheless, preliminary findings an a significant amount of further work is required to improve the validity of results.
6.3 Recommendations for Future Work
Considering the scope of this project, there are further areas of research that are recommended. The main limitation to the testing in this project is that it does not involve historic cob material, which is the basis of the investigation. The cob blocks here are somewhat representative of previously tested cob, in terms of compressive strength. However, a continuation of this work with the use of historic material would allow the comparison of the two.
Another area of research is the effect of the particle size distribution on the compressive strength and engineering properties of cob. The PSD varies between cob buildings, and there is a need for an understanding in how this affects the capacity of cob within historic buildings. The proportion of clay has been noted as a significant contributor to the plasticity of cob. However, Augarde (2015) suggests that the particle size distribution is not the most significant factor in the consequent properties of soils; the distribution of voids is more significant. It is explained here that this distribution should relate to the “macro-scopically” perceived properties. This approach has also been recommended by Greer (1996).
There is opportunity for a continuation of both the plasticity and vapour sorption tests at larger gradings, as only particles up to 4mm diameter were used. In completing this, results would be more characteristic of genuine cob soil can be determined. For instance, the suction properties resulting from the compaction process of cob. Jaquin, et al., (2009) concludes that the suction between particles within unstabilised rammed earth causes an increase in the strength. This could be applicable to cob; however, it is considerably less compacted than rammed earth.
6.4 Conclusion
The conclusions that are drawn from this research can be summarised to 3 main points.
- Once particles greater than 0.063mm are added to cob, its sensitivity to moisture reduces,
- The grading of cob does not have a significant effect on the plastic or liquid limits after
- Cob at this particle size distribution produces adequate strength for domestic loading,
- A procedure of analysis of historic cob buildings has been recommended, but more research is required.
The statement that once particles larger than 0.063mm are added to cob both the plastic and liquid limit can be assumed as constant is particularly dominant. A need for more understanding of the properties of cob as a building material was recognised. The research completed enables a prediction of the plastic and liquid limits of the cob at a larger grading than suggested by BS 1377-2:1990. This is, therefore, more representative of a cob wall than previous findings in literature. Arguably, this is limited in that the tests defined in this standard require a 3mm bar for plastic limit. At a grading of less than 4.00mm, it can be expected that there are particles larger than 3mm within the sample. The significance of this was considered negligible due to the small proportion of particles likely to be larger than 3mm. In addition, these findings demonstrate that results gained from the method stated in BS 1377-2: 1990 (using
The Vapour Sorption of cob is significant as it demonstrates the response of the material to moisture. The results show that as additional particle sizes are added in the same proportions, the moisture adsorbing capacity is reduced, and the soil becomes less sensitive to an increase in moisture content. Further data is required in this area to make a complete judgement on its application to cob. Future work should focus on the use of historic cob, with regard to its particle size distribution, such as the proportion of particles smaller than 0.063mm, for instance. In general, the results from the testing here has provided a supporting medium to plasticity results considering the substantial difference in the Atterberg limits.
The compression testing of MW cob blocks reinforces their appropriate application as a material for repair. Compressive strengths were in line, if not greater, than those described in literature.
This is an important step in the advance of knowledge of the material properties of historic cob, a field that becomes increasingly critical with time. The plasticity properties found are perhaps the most interesting and are worth additional research. Further research should continue with the aim of realising the behaviour of cob as a composite material; at present, only the properties of portions of it are understood. It is essential this work continues to protect an essential part of our heritage.
References
Augarde, C., 2015. Earthen construction: A geotechnical engineering perspective. Rammed earth construction: cutting-edge research on traditional and modern rammed earth.
Auroville: Earth Institute, 2016. Introduction: a millenia old tradition. [Online]
Available at: http://www.earth-auroville.com/world_techniques_introduction_en.php
[Accessed 30 November 2016].
Barnes, G., 2010. Soil Mechanics: Principles and Practice, Chippenham: Palgrave Macmilliam.
Bristish Standards Institution, 2015. BS 5930: 2015 Code of practice for ground inverstigation. London: BSI Standards Limited 2015.
British Standards Institution, 1990. BS 1377-2-1990. s.l.:Board of the BSI.
Craig, R. F., 2004. Craig’s Soil Mechanics. 7th Edition ed. New York: Spon Press.
Devon Live, 2014. Warning to cob wall owners after part of building crushes van in Cullompton. [Online]
Available at: http://www.devonlive.com/warning-cob-wall-owners-building-crushes-van/story-20693045-detail/story.html
[Accessed 16 April 2017].
Devore, J. L. & Berk, K. N., 2012. Modern Mathematical Satistics with Applications. 2nd Edition ed. New York: Springer.
Greer, J., 1996. The effect of moisture content and composition on the compressive strength and rigidity of cob made from soil of the Breccia measures near Teignmouth, Devon., Plymouth: University of Plymouth.
Harison, J. A., 1988. Using the BS cone penetrometer for the determination of the plastic limit of soils. Geotechnique, 38(3), pp. 433-438.
Harries, R., 1995. The geological properties of earth material from central Devon in to its suitability for building in ‘cob’. s.l., s.n., pp. 14-21.
Heath, A., Fourie, C., Walker, P. & Lawrence, M., 2009. Compressive strength of extruded unfired clay masonry units. s.l., Institute of Civil Engineers.
Historic Buildings Trust, Devon, 1992. The Cob Buildings of Devon 1: History, Building Methods and Conservation, s.l.: Historic Buildings Trust, Devon.
Historic Buildings Trust, Devon, 1993. The Cob Buidlings of Devon 2: Repair and Maintenance, Devon: Historic Buildings Trust.
Historic England, 2017. Our Research Strategy and Agenda. [Online]
Available at: https://www.historicengland.org.uk/research/agenda
[Accessed 15 April 2017].
Houben, H., 1995. Earthen Architecture and Modernity. Plymouth, Univeristy of Plymouth.
Houben, H. & Guillard, H., 1989. Earth Construction: A comprehensive guide. 1st Edition ed. Marseille: Editions Parenthese.
Jaquin, P. A., Augarde, C. E., Gallipoli, D. & Toll, D. G., 2009. The strength of unstabilised rammed earth materials, Durham: Durham Research.
Keefe, L., 2005. Earth Building: Methods and materials, repair and conservation. 1st Edition ed. Abingdon: Taylor & Francis.
Keefe, L., Watson, L. & Griffiths , R., 2001. A proposed diagnostic survey procedure for cob walls. Structures & Buildings , February , 146(1), pp. 57-65.
Keefe, L., Watson, L. & Griffiths, R., 2000. Possible causes of structural failure in traditional cob buildings. London, James & James (Science Publishers) Ltd..
Maskell, D., Heath, A. & Walker, P., n.d. Laboratory Scale Testing of Extruded Earth Masonry Units, Bath: University of Bath.
McCann, J., 1983. Clay and Cob Buildings. 1st Edition ed. Aylesbury: Shire Publications Ltd. .
Mike Wye & Associates Ltd, 2017. Cob Blocks. [Online]
Available at: https://www.mikewye.co.uk/product/cob-blocks/
[Accessed 2 April 2017].
Minke, G., 2009. Building with Earth: Design adn Technology of Sustainable Architecture. 2nd Edition ed. Berlin: Birkhauser.
P.A. Chabriac, A. F. J.-C. M. J. B.-G., 2015. A procedure to measure the in-situ hygrothermal behaviour of unstablised rammed earth walls. Rammed earth construction: cutting-edge research on traditional and modern rammed earth.
Pearson, G. T., 1992. Conservation of Clay and Chalk Buildings. 1st Edition ed. London: Donhead Publishing.
Saxton, R., 1995. The performance of cob as a building material. The Structural Engineer, 7(7).
Saxton, R. & Coventry, K., 1995. The Engineering Performance of Cob. Plymouth, University of Plymouth, pp. 65-77.
Smith, M. G., 1998. The Cobber’s Companion: How to build your own earthen home. 2nd Edition ed. Oregon: The Cob Cottage.
United States Department of Agriculture, 1990. Engineering Field Manual: Chapter 4 Elementary Soil Engineering, s.l.: US Government Printing Office.
Warren, J., 1999. Conservation of Earth Sructures. 1st Edition ed. Oxford: Butterworth-Heineman.
Watson, K. & McCabe, L., 2011. The cob building technique: Past, present and future, Plymouth: University of Plymouth.
Weather Online , 2017. Exeter Airport. [Online]
Available at: http://www.weatheronline.co.uk/weather/maps/city
[Accessed 4 April 2017].
Widgery, M. & Lee, T., 1997. Devon Earth Building Association: Cob and the Building Regulations. Structural Survey, 15(1), pp. 42-49.
Cite This Work
To export a reference to this article please select a referencing stye below:
Related Services
View all


Related Content
All TagsContent relating to: "Earth Sciences"
Earth Sciences is a field of study that focuses on the science behind planet Earth. Earth Sciences explores the physical and chemical aspects of not only planet Earth, but it's atmosphere too.
Related Articles

DMCA / Removal Request
If you are the original writer of this dissertation and no longer wish to have your work published on the UKDiss.com website then please: