Acceleration-based Approach to Timber Floor Serviceability Design
Info: 19567 words (78 pages) Dissertation
Published: 13th Dec 2019
Tagged: Construction
A dynamic, acceleration-based, approach to timber floor serviceability design
Abstract
Pre-fabricated solid timber panel construction (such as cross-laminated timber) is experiencing rapid growth in the United Kingdom as both clients and designers become aware of the benefits it can offer in terms of improved construction time and reduced material wastage. However limited understanding of the dynamic behaviour of these products means limited design guidance is available. Existing serviceability design methods have been formulated for concrete slab or joisted timber construction methods and cannot be applied to solid timber panel floors.
The serviceability design methods currently proposed in Eurocode 5 are heavily based on empirical understanding and this is leading to more general concern over their accuracy and suitability. Furthermore, there is no crossover between design criteria for proposed floors (Eurocode 5) and assessment criteria for existing floors (vibration dose value limits). This lack of harmony makes it difficult to pinpoint the source of vibration issues in floor design post-commissioning, raising issues of legal responsibility in the result of inhabitant complaint.
From this standpoint a new design method is proposed, intended exclusively for footfall-induced excitation of high frequency floors subject to walking by a single individual. The approach makes use of a floor’s peak vertical acceleration as the primary parameter to be predicted. The criteria is based on the vibration dose value (VDV) in an attempt to improve harmony between the design and assessment of solid timber panel floors.
Testing has been carried out on four glulam timber panel test floors at a primary school in Bath, Somerset in order to assess the accuracy of the model’s prediction of floor response. Overall, the model was found to offer a good fit to the experimental data, and provide some robustness against uncertainties in input parameters. The small number of test floors used means further testing will be required before the approach can confidently be confirmed as being usable. Testing on other timber floor construction types would allow extension of the design method beyond solid manufactured panel floors. It is concluded that the major barrier to vibration design of solid timber panel floors remains the accuracy of predicted floor dynamic parameters (natural frequency, damping ratio, modal mass) at design stage. More official guidance is needed on how to go about this.
Contents
2.1. Definition of the solid timber floor
2.2. Solid timber floors in the United Kingdom
2.3. Analysis of a vibration event
2.4. Summary of background information
3.1. A description of human response to floor vibration
3.2. Serviceability design criteria for proposed floors
3.3. Serviceability assessment criteria for existing floors
3.4. Impact on current research
4. Initial proposed design approach
7.2. Data processing and frequency weighting
8.2. Accuracy of input parameters
8.3. Prediction of peak acceleration
8.4. Prediction of event dose value
10. Recommendations for future work
11. Flow-chart of design process
Appendix A. Nucleus Centre floor plan test drawings (Not to scale)
Table of Tables
Table 6.1. Test floor dimensions and support conditions
Table 6.2. Floor build-up and associated dead load
Table 7.1. Median measured values for natural frequency and damping ratio
Table 7.3. ANOVA statistics for non-linear regression
Table 8.1. Estimated fundamental natural frequencies (Hz) for each floor
Table 8.2. Damping guidelines given in design standards
Table 8.3. Changes in FEA predicted natural frequency and modal mass due to variation in total mass
Table 8.1. Peak weighted acceleration of third floor corridor from walking by a single tester
Table of Figures
Figure 1.1. Initial proposed calculation process
Figure 2.1. CLT panel under construction (source: Stora Enso)
Figure 2.2. Vibration process according to ISO 10137
Figure 2.3. Acceleration-time response of a timber panel test floor under heel-drop excitation
Figure 2.4. Frequency domain plot of heel-drop test
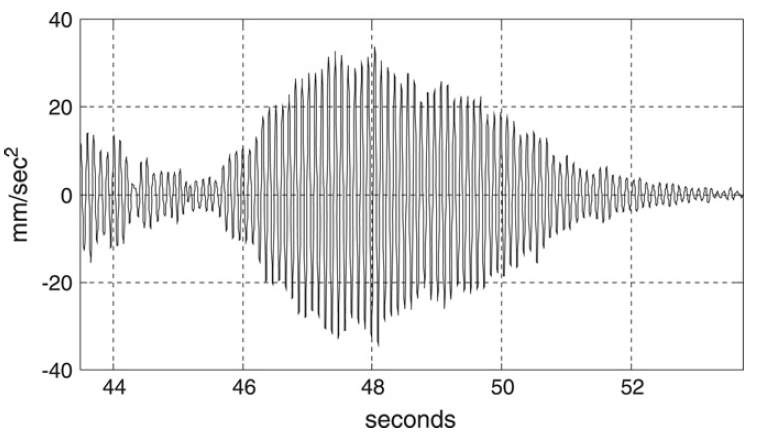
Figure 2.5. Resonant response of a low frequency floor (Brownjohn & Middleton, 2008)
Figure 2.6. Impulsive response of a high frequency floor as tester walks away from sensor
Figure 3.2. Limiting RMS acceleration criteria for a range of natural frequencies (ISO 10137:2007)
Figure 6.1. MM Holz Profideck glulam timber floor panel (Mayer Melnhof Holz, n.d.)
Figure 6.2. Proposed panel to panel construction details (Mayer Melnhof Holz, 2013)
Figure 6.3. MATLAB Frequency weighting curve (Wb) suitable for vertical vibrations
Figure 6.4. Half-power bandwidth method from frequency domain plot
Figure 7.1. Raw and weighted acceleration-time responses for 1.75 Hz footfall frequency
Figure 7.2. Measured vs. predicted peak acceleration (K = 3.21) (outliers in orange)
Figure 7.3. Relationship between peak acceleration and vibration dose value for individual footfalls
Figure 8.1. % variation in predicted peak acceleration due to changes in input parameters
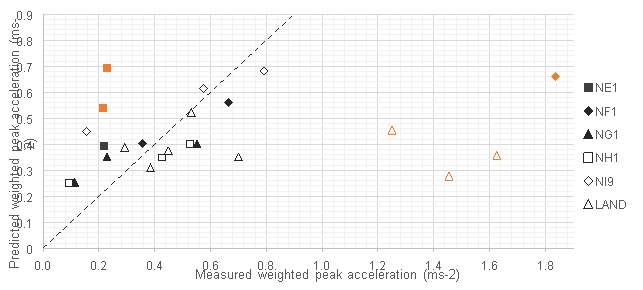
Figure 8.2. Measured vs. predicted peak acceleration (K = 3.21)
Figure 8.3. Weighted acceleration-time plot fitted with exponential functions
Figure 8.4. Estimated against predicted dose value for each test
Figure 8.5. Linear relationship between peak acceleration and vibration dose value
1. Introduction
This dissertation aims to propose a new method for assessing the design of solid timber floors against unwanted human-induced footfall vibrations. Timber floors are notoriously susceptible to problems with dynamic loading and serviceability design checks are quite often the governing criteria. As the industry moves to using larger, and more innovative timber floor construction types current design criteria are becoming inaccurate at predicting floor response. This is leading to floors experiencing unacceptable vibration problems in service, necessitating costly remedial works that, if left unchecked, could damage the reputation of the timber sector. This problem is more pronounced in solid timber panel floors, which behave differently to conventional joisted floors and as a result often fall outside the scope of conventional design methods.
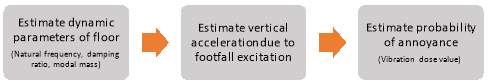
The proposed new design method will use the floor’s vertical acceleration as the primary parameter to be limited. This is an approach contrary to the velocity criteria present in current European design codes. A series of tests have been carried out on real (in service) test floors to establish a possible relationship between a floor’s structural properties (damping, natural frequency) and the resultant vibration dose value induced by footfall loading in order to allow prediction of a floor’s probability to cause annoyance to building inhabitants. This process is indicated graphically in Figure 1.1
Only human-induced footfall vibrations by single individuals (not in a group or crowd) have been considered. The methods proposed apply to floors likely to exhibit an impulsive response to excitation (normally floors having a natural frequency greater than 8 Hz). The test floors used were constructed from glued-laminated timber panels and were located within a school building. The findings are limited to this construction and occupancy type, however it is hoped that further research will enable expansion of the proposed methods to further floors.
Before proposing a new design method it is essential to understand the context for timber floor serviceability design. The following questions are initially discussed.
- What is a solid timber floor and where are they used?
- What causes a building to vibrate?
- How do humans perceive vibration?
- What criteria currently exist for vibration serviceability design of solid timber panel floors and what are their shortcomings?
2. Background information
2.1. Definition of the solid timber floor
Solid timber panels are a type of manufactured timber product. They are formed from gluing or laminating together smaller sections of timber. By reconstituting the timber in this way, larger sections can be created. In addition the combination of many smaller elements into large panels helps to reduce the variability in strength typically exhibited in traditional timber.
Cross-laminated timber (CLT) is widely used for structural purposes. CLT is a two-way spanning manufactured timber product. It is formed by laminating together thin layers of softwood (hardwoods can be used, but are less common). The grain direction of each layer is perpendicular to those in adjacent layers, helping to ensure uniform strength in both longitudinal and transverse directions. Thicknesses can vary up to 340 mm in sections up to 24 metres in length (X-LAM Alliance, n.d.). This variability in size affords designers far greater freedom than conventional joisted timber floors and is a major contributing factor to the rise in use of solid timber panels. Since the introduction of CLT to the UK in 2001, the industry has seen a 25% year on year increase in its use (Jones, et al., 2016).
2.2. Solid timber floors in the United Kingdom
Despite its growing popularity, solid timber panelling (and CLT in particular) is yet to become a mainstream construction material in the UK. This is, in part due to uncertainties over its performance. Jones et al. (2016) found that 53% of designers and contractors cited a lack of knowledge about CLT and its properties as the most significant barrier to adoption in the UK. CLT behaves very differently to conventional timber due to its laminate form and uniform cross sectional properties. However, currently Eurocode 5 gives no specific guidance on designing with the material. TRADA does offer some guidance in its GD10 guide (‘Cross-laminated timber (Eurocode 5) design guide for project feasibility’) however technical knowledge amongst the engineering profession is limited (Lane, 2014) and design work is generally carried out by small, specialist sub-contractors (Jones, et al., 2016). The lack of regulatory guidance means many firms are not able to design with CLT simply due to a lack of knowledge
However the absence of regulatory guidance raises another issue; that of legal liability in the event of problems following building commissioning. Serviceability conditions often govern due to the relatively low mass and stiffness of timber floors when compared to alternatives, such as concrete slabs. Even if there is willing amongst designers and contractors to adopt such materials the associated risk of doing so may, in future, lead to legal cases as serviceability issues arise. This may be deterring many in the industry from using sold timber panels.
2.3. Analysis of a vibration event
Now that the floor construction type has been clarified it is necessary to explore how vibration affects floors in service. Solid timber floors experience vibration in much the same way as other floor construction types. ISO 10137:2007 provides general information on the design of buildings and structures to limit vibration. It defines the vibration process as being formed from three main interactions or events, as shown in Figure 2.2.

This dissertation limits its focus to certain types of event, path and receiver and it is therefore important to define the above terms in more detail.
2.3.2. Sources of building vibration
Vibration sources are classified differently according to the various guidance documents available. ISO 10137:2007 broadly delineates sources according to whether they originated inside or outside the building.
Sources of external vibration can be extremely wide ranging and prediction of their transmission paths difficult. Internal vibration is generally caused either by human excitation or machinery. Human-induced vibration results from building inhabitants walking (or running) across the floor. Walking tends to fall within a narrow defined band of forcing frequency, approximately 1.7-2.4 Hz (Ellis, 2000) whereas machine-induced vibrations can occur over a wider spectrum. This makes machine-induced vibrations highly equipment specific, and developing design criteria to minimise their effect is therefore difficult. In spaces where humans are present footfall vibrations usually form the predominant source of floor excitation (Middleton & Brownjohn, 2010). Excitation from sources other than human footfalls is outside the scope of this dissertation.
BS 6472-1:2008 acts as a basis for evaluating human exposure to vibration. It further defines vibration according to its time duration; continuous, intermittent or occasional. Human-induced vibration (except in the case of very busy spaces subject to constant pedestrian movement) can be described as intermittent or occasional. None of the floors examined in this study would normally experience continuous footfall excitation.
2.3.3. Transmission path
Transmission path refers to the medium through which a vibration event is transferred (the solid timber floor, in the case of this study). A floor’s response to forced vibration will primarily depend on its natural frequency, damping ratio and mass. In general increasing either the mass or damping ratio of a floor will reduce the amplitude of its vibration response. Changes in natural frequency elicit a more nuanced response however and explanation of this effect is important to clarifying the scope of the study.
A single heel-strike causes a floor to undergo an initial period of forced vibration. This forcing response is then followed by a period of free vibration, decaying with time until the floor returns to an approximate steady state. This effect is indicated in the graph in Figure 2.3, reproduced from a similar figure presented in Hu et al. (2001).
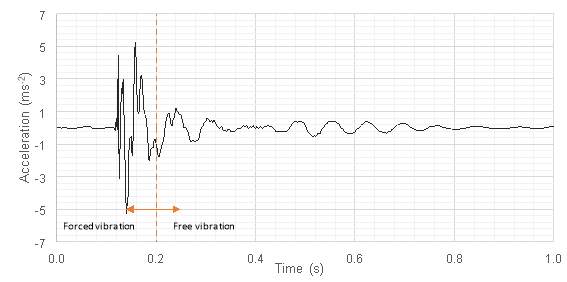
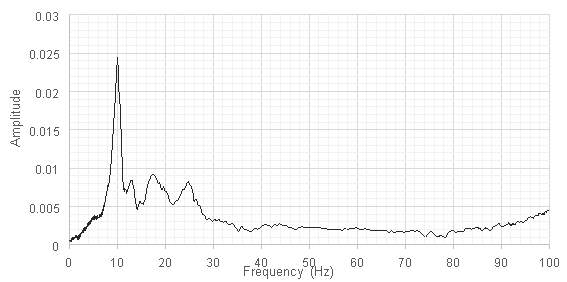
As there is no forcing function during this period the floor vibration is formed of several dominant (natural) frequencies. Figure 2.4 shows the frequency domain plot for a heel-drop test carried out on a CLT test floor. The floor can be seen to be excited primarily at frequencies of 10 Hz, 18 Hz and 25 Hz.
The largest floor responses are exhibited when the fundamental (first) natural frequency closely coincides with discrete multiples of the pacing frequency (defined by the time between individual heel-strikes) of an inhabitant (Ellis, 2000). A footfall force (F(t)) can be represented by a sinusoidal function formed of N terms describing the harmonic components of the pacing frequency, as in [1].
| Ft=p1+∑n=1Nαnsin(n2πfp+ϕn) |
Here p is the static weight of the inhabitant, fp is the pace rate, n the Fourier component of the nth harmonic and n the phase angle of the nth harmonic. The accuracy to which this equation can represent a footfall force depends on the number of equation terms (N). The majority of the force is present in the first four harmonic terms of the forcing function (N=4) (Middleton & Brownjohn, 2010). Since normal pacing frequencies are usually around 2 Hz, floors with a natural frequency less than 8 Hz (4fp) can experience resonance, where subsequent footfalls combine to reach a steady state value as in Figure 2.5.
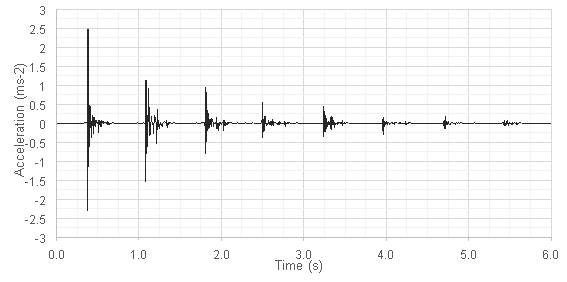
Floors with a natural frequency above approximately 8 Hz will not encounter resonant steady-state vibration but will instead respond in a transient manner (Allen & Murray, 1993) since there is very little force present in these higher frequencies. Such a response can be seen in Figure 2.6. In general, the higher the natural frequency of a floor the shorter the time period of free vibration before the response returns to zero (or at least below the threshold of human perception) (Hu, et al., 2001).
Some high frequency floors can exhibit resonant response (Brownjohn & Middleton, 2008). Ellis (2000) suggests a reason for this. Resonant response is also affected by the damping properties of the floor, and Ellis cites examples where low frequency floors responded transiently. Floors with a natural frequency lower than 8 Hz tend to be longer span floors which will often have low damping values. Higher frequency floors tend to have shorter spans and higher damping. Where damping properties do not correlate with span in the expected manner (large span and large damping) then floors do emerge that do not seem to fit this criteria. However this effect is unusual. Difficulties in predicting damping properties for floors means classification along these lines is difficult.
Classifying a floor as either high or low frequency is preferred and is essential if any analysis or design is required due to the difference in response to excitation. Design guides (timber or otherwise) generally specify that a floor be designed to have a fundamental natural frequency greater than 8 Hz (BS EN 1995-1-1 Section 7.3.3) to account for the fact that continuous vibration causes greater annoyance to building inhabitants than transient vibration. The majority of solid timber floors currently in service should (in principle) therefore be classed as high frequency. This dissertation will only look to develop a design criterion for high frequency floors.
2.3.4. Vibration receiver
A vibration receiver refers to any human or object within the space that is caused to accelerate (and move) by the event (ISO 10137:2007 section 4.4). Disturbance due to the rattling of furniture or machinery is not considered in this dissertation. Human receivers are assumed to be in direct contact with the floor.
The Handbook of Human Vibration (Griffin, 2012) categorises the effects of vibration under three headings; interference with comfort; interference with activities; interference with health. Vibrations may interfere with comfort by disturbing vision or causing movement of body organs leading to (in extreme cases) motion sickness. Comfort can therefore be seen to be directly linked to interference with activities; disturbance of vision or other sensory functions can directly impact the ability to carry out a task. Interference with health usually only occurs if an inhabitant is exposed to continuous vibrations for extended periods (several years according to ISO 2631-1:1997 section 7.1). The impulsive, footfall vibrations considered in this dissertation are unlikely to lead to anything other than inhabitant annoyance. Design criteria have been formulated on the basis of annoyance alone.
ISO 2631-1:1997 contains discussion on the effects of human orientation with respect to the transmission path (sitting, standing or lying). Humans perceive vibrations differently depending on this orientation and a series of weighting factors are provided in design codes to account for this. As a general case this dissertation explores human response to vertical vibrations whilst standing.
2.4. Summary of background information
In this section an overview has been given of the type of floor this dissertation will examine. The vibration process that this dissertation will consider is also now defined. The human response to individual pedestrian induced excitation of high frequency floors represents the most generic case under which vibration can occur and will act as the starting point for this research. There is a clear need for greater research into how to design solid timber panel floors, in particular for serviceability conditions which often govern.
A literature review has next been conducted to help understand the current industry approach to minimising annoyance due to floor vibrations. This is documented in the following section.
3. Literature Review
In order to design or assess a structure for vibration serviceability there is a need to understand how humans perceive and are affected by vibration events. This area of study is first discussed. Vibration serviceability is considered both prior to floor construction (design) and after commissioning, should adverse comment arise (assessment).The following sections of this literature review examine how researchers have attempted to transfer an understanding of human response into design & assessment criteria that enable timber floors to be classified as acceptable or unacceptable.
The aim of this is to gain an appreciation of two factors:
- What factors and parameters affect acceptable performance of different floors;
- The successes and shortcomings of existing criteria in predicting acceptable performance.
3.1. A description of human response to floor vibration
The study of how building inhabitants perceive, and respond to, vibrations is well established. It should be noted however that attempts to quantify and confirm the response to vibration are inherently affected by humanistic factors. Age, cultural background and building function can all affect level of perception to varying extents. Nonetheless, an understanding of the field (including its limitations) is key to developing methods of predicting acceptability of timber floors.
The study of human response to vibration is considered to have begun with the work of Reiher and Meister (1931).Ten participants were subjected to undamped steady state vibration whilst lying or standing on a laboratory platform. Participant response was measured (using a scale measuring from ‘barely perceptible’ to ‘intolerable’) for a range of different frequencies. A relationship was developed between peak deflection, frequency and human perception, assuming that vibration was undamped. There was however no allowance made for the effects of structural damping on participant response.
Further laboratory work by Lenzen (1966) and Wiss & Parmelee (1974) developed relationships similar to Reiher & Meister’s that could be applied to transient, damped vibrations. Most importantly, the latter study demonstrated how as damping was increased, certain values of vibration frequency and peak deflection became less noticeable.
Atherton et al. (1976) began to apply these principles to timber floors. Twenty four full-size floors were tested, producing 1,222 impact and 278 walking displacement-time result series. It was noted that human participants exhibited greater response to walking vibrations than single impact displacements. This is due to the fact that for floors with low damping response walking displacements tend to combine and more closely resemble a steady-state, continuous vibration (as discussed in section 2.3.2).
The finding that short period, high amplitude responses are more acceptable than steady state vibrations was confirmed by Ellingwood & Tallin (1984). This study also suggested that vibration response due to a single walking person is more troublesome than that caused by a group. It is therefore more appropriate when defining serviceability criteria to consider single walking source excitation.
Whilst the above studies (and others) demonstrate broad agreement on the parameters affecting human perception (namely frequency, amplitude and damping) there is difficulty combining and comparing the quantitative results due to the wide variety of floor types, vibration sources and measurement techniques. Kalkert et al. (1993) expresses this concern, and highlights the need to adequately quantify and confirm the type of vibration to be controlled (steady-state or impulsive)
3.2. Serviceability design criteria for proposed floors
Existing serviceability criteria have been developed for use with conventional construction types such as concrete slab or joisted timber floors. They place limits on certain measurable properties of a floor’s response to vibration. In this review design criteria have been grouped according to the quantities they attempt to control. Extensive use over a number of years has demonstrated the usefulness of these criteria for conventional construction types, however the same cannot be said for solid timber panel floors.
3.2.1. Criteria limiting deflection
The most basic attempts to control vibration involve limiting the static deflection of a structure under normal loading. The traditional deflection limit of span/360 is listed in the US Federal Housing Administration’s 1964 standard ‘Minimum Property Standard’s for One and Two Living Units’ but it was likely in use for a considerable time prior to this.
However this limit is based on deflection of an isolated joist or beam and does not take into account the effect of stiffness in the across joist direction. Onysko (1988) carried out an in-depth study of 300 residential timber floors and found that limiting predicted deflection under a 1 kN point load offered a more effective means of minimising vibration. This method offered levels of simplicity similar to the traditional live load deflection limits of the past however made account of the across joist stiffness in calculating deflection. Deflection limits (given in [2] in mm) vary according to the span length (L).
| δ=2.0 L<3.0m
δ= 8L1.3 (3.0<L<6.0m) |
Other versions of [2] were developed for various alternative floor construction types involving engineered timber joists and concrete. A form of [2] is given in the NA to BS EN 1995-1-1:2004 Table NA.6 demonstrating that static limits are still very much in use in industry.
However the equations are highly empirical in nature and lack a consideration for the dynamic properties of floors. The use of static criteria can only ever hope to minimise the probability of a floor experiencing unwanted vibration. This can lead to unsatisfactory performance still arising in some cases.
3.2.2. Criteria limiting deflection and peak velocity due to unit impulse
Ohlsson (1982,1988) was an early proponent of dynamic methods. His method proposed two criteria. The first was to limit fundamental natural frequency to greater than 8 Hz. The second involved limiting peak velocity due to unit impulse (v0 ms-1) to less than
| v0<100f1-1 |
|
|
| v0=4(0.4+0.6n40)mbL+200 |
|
where
| n40=40f(1)2-1bL4(EI)L(EI)b0.25 |
|
The parameters are; f(1), fundamental natural frequency (Hz); , damping ratio (%); n40, number of first order modes with frequencies up to 40 Hz; m, mass of floor (kg/m2); b, short dimension of floor (m); L, long dimension of floor (m); EI, equivalent bending stiffness of the floor (Nm2/m).
Ohlsson’s method has proved successful to some extent, and forms the basis of the Eurocode 5 approach. However the method has not been properly validated. Indeed as the unit impulse is a theoretical concept this can never be completely possible. Hu (2000) found issues when trying to experimentally confirm Ohlsson’s approach. Furthermore, the approach does not allow for the design of longer span, low frequency (< 8 Hz) floors. Low frequency floors are not predisposed to fail in service, as this method suggests. If they have high damping ratio and adequate distributed mass then they can perform well. This criteria may therefore be unnecessary, restricting the use of larger, more innovative floor types.
Furthermore, it seems unusual to base the criterion on peak amplitude (velocity) response with no direct consideration for the duration of floor response or the number of vibration events. This narrow view may still lead to inhabitant adverse comment.
This method, and others, require prediction of the floor’s natural frequency and damping ratio. Difficulties arise with solid timber floors (such as CLT) due to limited research in this area. Natural frequency calculation methods for lightweight joisted floors or heavy concrete slabs cannot always describe the dynamic behaviour of solid timber panels. No design equation is given in the British National Annex to Eurocode 5 for this purpose. Matilainen & Puttonen (2014) compared the accuracy of several existing equations to experimental data and found that conventional plate theory (typically used for concrete slabs) is not accurate when timber panel relative thickness (l/h) is less than 20 due to disregard f0r the effects of inter-layer transverse shear stresses. More refined methods do exist, such as first-order shear deformation theory (Reddy, 1984) but often are too complex for inclusion in design codes.
Finite element techniques can offer an accurate means of determining natural frequency (Matilainen & Puttonen, 2014), however their use is entirely at the mercy of the designer. Differing assumptions with regards to support and loading conditions can yield varying results. Furthermore not all designers have access or expertise with the use of such software. Hand calculation methods are required for validation of FE output at the very least.
3.2.3. Criteria limiting fundamental natural frequency
Dolan et al. (1999) proposed that the fundamental frequency of a floor should be limited to; 15 Hz for unoccupied floors; 14 Hz for occupied floors. This method is appealing for several reasons. Firstly, it neglects the effects of damping, which is difficult to predict at the design stage. Secondly, its simplicity means it can be used by those previously unfamiliar with floor vibration design. Furthermore it can be extensively validated as minimal data is needed about a floor.
However, in simplifying the situation to a problem involving one parameter (natural frequency) the method is conservative, particularly for heavier floors (Hu (2000)). The results given in Dolan et al’s original paper show many floors deemed acceptable by human participants that fell below the criterion and, on this basis, should not have been constructed. This discrepancy maybe due to the misconception explained in Ellis (2000) and discussed in 2.3.3. By neglecting the effects of damping ratio and modal mass the criterion does not allow for the construction of more innovative, and perhaps efficient, floors preferring only to allow traditional construction types. It is not clear how a timber panel floor would stand up against this criterion.
3.2.4. Criteria limiting RMS acceleration
Smith and Chui (1988,1990) proposed criteria that avoided use of theoretical concepts and thus could be validated. They too limited fundamental natural frequency to greater than 8 Hz but also suggested frequency weighted RMS acceleration be no greater than 0.45 ms-2. In order to estimate arms the following equations are used.
| f1= 2π2L2(EI)L(n-1)msb+mj(n-1)+4Wo/L |
|
|
| arms=2000Kmπf(1)2 |
|
The parameters are; n, number of joists; ms, mass per unit floor area of floor sheathing (kg/m2); mj, mass per unit length of joists; b, floor width (m); K, parameter based on fundamental frequency, damping ratio and duration of heel impact. As with Ohlsson’s method in 3.2.2 the criterion has been formulated specifically for high frequency floors and may unnecessarily restrict designers. Furthermore, problems still abound when trying to estimate the natural frequency of a timber panel floor for use with this method. It is not clear whether the empirical relationship for RMS acceleration holds for non-joisted floors.
Al Foqaha’a et al. (1999) used a combination of finite element analysis and laboratory tests to build on the work of Smith and Chui (1988,1990). The study proposes a power relationship between RMS acceleration and natural frequency for a given floor stiffness.
| arms=c1f0c2 |
|
The coefficients c1 and c2 depend on the mass-density of the floor, m (N/m4). Increased stiffness results in lower RMS acceleration, as expected. The correlation between the test data and the design equations is strong, however the predicted RMS acceleration values do seem quite high, with the majority exceeding Smith and Chui’s acceptability criteria of 0.45 ms-2. This is likely due to testing on bare floors (with resulting low damping ratios). Figure 3.1 is extracted from Al Foqaha’a et al. (1999).
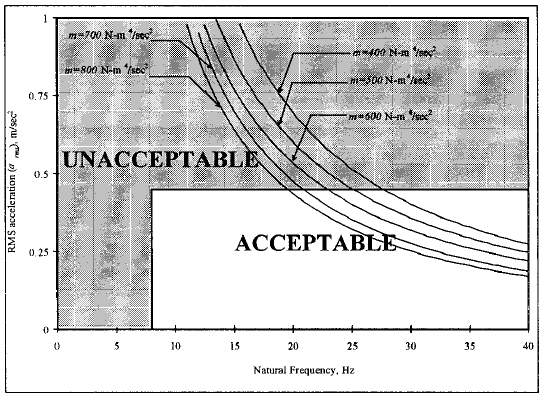
- Acceptability criteria limiting RMS acceleration (from bare test-floor data) (Al Foqaha’a, et al., 1999)
The low mass on the bare test floors means that the criteria has only been demonstrated for floors with a natural frequency greater than 20 Hz. Unless the RMS acceleration limit could be revised, or new coefficients (c1 and c2) developed for floors with greater mass, the use of such a simple power relationship may not be feasible.
The use of RMS acceleration seems unusual when high frequency floors (f > 8Hz) are likely to exhibit an impulsive response to footfall excitation. RMS acceleration cannot effectively describe highly impulsive responses. ISO 2631-1:1997 recommends that RMS acceleration not be used for transient events for this reason when assessing existing floors.
3.2.5. Criteria limiting a combination of parameters
Hu and Chui (2003) instead suggested a criterion combining fundamental natural frequency and static deflection under a 1kN point load.
| f1δ0.44>18.7 |
|
However whilst there appears good correlation between the relationship and test data, the criteria fails to resolve many of the issues observed previously. With no consideration made for the dynamic behaviour of the floor this empirical static check will only reduce the probability of adverse comment arising.
Ellis (2000) has attempted to address the problems surrounding a lack of consideration for dynamic effects, proposing a means of predicting the peak acceleration of a steady-state (low frequency) floor response. The steady-state acceleration is predicted based on the peak force, damping ratio and stiffness of the floor and is then modified by two factors (R1 & R2) to account for resonance build up and the effect of walking path across a space. The equations proposed for use are relatively complex (and hence are not reproduced here) but correlated reasonably well with experimental results, although slightly over-estimated peak acceleration as a perfectly resonant response is unlikely to occur in practice.
In a further paper Ellis (2001) goes on to propose criterion for design using his calculation method. This paper makes use of the vibration dose value (VDV) (discussed fully in 3.3) to quantify acceptability. Various empirical relationships are proposed such that, from knowing the peak acceleration of a single walking event, one can estimate the VDV for several such walking events throughout the day.
| VDV=0.48×a×n4 |
In [10] n is the number of events experienced throughout an exposure period (usually a day). This method is interesting, since it makes use of existing criteria (VDV) for floor assessment. Secondly, it takes the dynamic properties of the floor into account. This approach removes the temptation for designers to use the criterion simply as a ‘black box’, something that many of the previous design methods fail to address. There will be little knowledge, or care, if practicing engineers are not allowed to understand the intricacies of their design. By allowing multiple parameters to be altered (from damping ratio to expected number of events per hour) the designer is more involved and can propose more innovative, efficient floor constructions in the full knowledge of what assumptions have been made.
Ellis’s empirical relationships for vibration dose value are unlikely to hold for impulsive vibration events however and Ellis proposes no method for the prediction of peak acceleration for highly damped, or high frequency, floors. Since the empirical relationship to VDV is based on data for groups of walking individuals in a single steel-framed building greater research is needed before extrapolating to timber framed floors. Also, since Ellingwood & Tallin (1984) demonstrated that vibration due to a single walking individual is more annoying than due to a walking group this method may under-predict the likelihood of complaint.
The Steel Construction Institute have, since 1989, proposed several dynamic methods for dynamically predicting acceleration response to impulsive loading. The latest method is given in SCI P354:2009. The weighted peak acceleration at a point (r) from excitation at a point (e) in a single mode of vibration (n) is given by
| aw,peak,e,r,n=2πfn1-2e,nr,nFIMnWn |
|
The parameters are; e,n and r,n, the mode shape amplitudes at the point on the floor where the impulse force is applied and the point where the response is to be calculated respectively; FI, the impulsive excitation force (Ns) ; Mn, the modal mass of mode n (kg); Wn, the appropriate code-defined frequency weighting factor. The impulsive excitation force is based on Arup’s effective impulse (Wilford, et al., 2007).
The above calculation is carried out for the first four frequency modes and an RMS acceleration calculated by summing the modal acceleration responses using superposition. An adaptation of the relationship given in [10] is then used to convert the RMS acceleration to a VDV. However, as discussed previously, this method has not been proven to be applicable to impulsive floor responses.
Whether this method can be applied to timber panel floors is also unclear. It has been developed for use with concrete and composite steel deck floors and so may not be usable in its current form.
3.3. Serviceability assessment criteria for existing floors
Existing floors have traditionally been assessed according to different criteria than those used for design purposes. There are two main standards that offer criteria for floor assessment.
3.3.1. Criteria limiting vibration dose value
BS 6472-1:2008 makes use of the concept of the vibration dose value (VDV, ms-1.75), calculated by equation [12]. Vibration dose value is a particularly effective means of quantifying the effects of impulsive vibration since it is sensitive to large peaks in acceleration response.
| VDV=∫0Taw4tdt14 |
The frequency weighted acceleration (aw) series is obtained from measured excitation of the floor. The data is weighted (using mathematical filters) as humans are more perceptive to certain frequencies of vibration (5-16 Hz). Frequencies outside this range are attenuated by the filter. However the application of these filters is not straightforward and little guidance is available. BS 6841:1987 gives parameters for defining the filters in an analog form that cannot be implemented on the discrete forms of acceleration data generated by floor testing. BS 8041: 2005 attempts to address this but does so in a ‘bit-part’ manner that provides little clarity. ISO 10137: 2007 gives more comprehensive description of how to build the required analog filters, however there is no guidance on how to convert these to a digital form possible for use. The most complete source of information is Rimmell and Mansfield (2007). Here real methods are given (including worked examples) that enable the application of digital filters according to ISO 10137, BS 6841 and ISO 5349-1 (guidance for hand-transmitted vibrations).
Once the designer has filtered the data and calculated a dose valu for an excitation event then the total VDV over a day must be determined according to [13].
| VDVday=n0.25×VDV |
In the above equation n denotes the number of expected events in a day or night period. Limits on day-time and night-time total VDV are given in Table 3.1, extracted from BS 6472.
- VDV ranges which might result in various probabilities of adverse comment within residential buildings (BS 6472:2008)
| Place and time | Low probability of adverse comment (ms-1.75) | Adverse comment possible (ms-1.75) | Adverse comment probable (ms-1.75) |
| Residential buildings 16 h day | 0.2 to 0.4 | 0.4 to 0.8 | 0.8 to 1.6 |
| Residential buildings 8 h night | 0.1 to 0.2 | 0.2 to 0.4 | 0.4 to 0.8 |
The above method is reproduced in other design standards and is used extensively for assessing many sources of vibration. However there is no source given for the limits presented in Table 3.1. Likewise there is no guidance available on what constitutes a likely number of daily vibration events. This leaves the method highly open to interpretation.
3.3.2. Criteria limiting RMS acceleration
ISO 10137:2007 (as well as re-producing the VDV ranges given in Table 3.1) places limits on weighted RMS acceleration according to the graph in Figure 3.2. RMS values should be multiplied by a response factor to account for human perception varying depending on the building use.
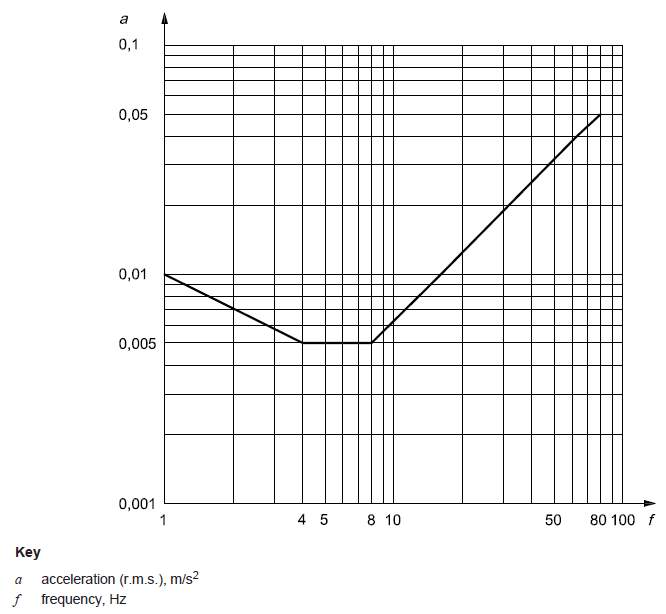
For the floor to be deemed acceptable this value must be less than a limit based on the floors fundamental natural frequency. However RMS acceleration can only be used for more resonant excitation (where the crest factor is less than six) and as such this method is possibly not applicable to the high frequency floors that are considered in this study.
As with VDV there is uncertainty over the derivation of the criteria. Lewis & Griffin (1998) compared results using both RMS and VDV limits and found that, for more severe motions differences between expected safe exposure limits were greater than 250%. Vibration dose values were on the whole more conservative.
3.4. Impact on current research
In conducting a review of existing literature several key issues seem to exist in relation to current vibration serviceability design of solid timber panel floors. Initially there is difficulty in predicting the dynamic properties of floors, owing to the limited research information available to date. This leads to inevitable confidence issues over any final results and is stymying use of the material in construction. Rigorous testing of existing prediction formulae is needed, which ultimately will help to enable design guidance documents to be published for solid timber floors. This is not something that this dissertation will be able to focus on, however it would be useful to compare predicted values to measured values to initially test feasibility of some of the proposed equations.
In conjunction, it is not certain that existing design criteria can be used with timber panel floors. Testing will be required to reformulate design methods such as Ohlsson’s velocity impulse approach for use with solid timber panel floors. However, many proposed design criteria are highly empirical in their derivation, and lack a sensitivity for the complicated relationship between different variables. Whilst in the majority of cases this ensures low likelihood of adverse floor response, there is a danger that these criteria could be applied ineffectively by an unaware designer. This is especially true when considering the case of manufactured timber floors which, as mentioned, do not necessarily behave as would traditional timber. It might therefore be more preferable to propose an entirely new set of design criteria that can cater for modern floor construction types as well as resolving some of the issues relating to empirical, static, design checks.
The high-low frequency classification has placed the focus almost entirely on designing to ensure high frequency response. There is little information to explain how a low frequency floor might be designed, with Eurocode 5 suggesting only that ‘a special investigation should be made (BS EN 1995-1-1:2004, p.53). This is an area where greater understanding is needed as this could create opportunity for more creative long-span floor design if suitable criteria were available.
The VDV method for assessing existing floors seems reasonable and is used extensively in industry. However supporting test data could not be obtained and differences in predicted inhabitant response compared to RMS acceleration limiting criteria (Lewis & Griffin, 1998) suggest that refinement may be required. There is little clarity on how dose values should be summed to represent total exposure over a period. In public or semi-public spaces, such as libraries, schools or shopping centres the recommended exposure period of a 16h day is clearly not appropriate given inhabitants will not remain in the same space for this amount of time. Furthermore, the published design standards don’t offer a consensus on which floor assessment method or criteria should be used, in particular where frequency weighting filters are concerned. This creates a situation where different designers or design standards could generate different conclusions on the acceptability of an existing floor.
In turn, there is little harmony between criteria for existing and proposed floors. This has the potential to develop into a large problem if vibration issues are discovered in service. Engineers are designing floors to meet a set of criteria different to those used to practically assess them. The risks posed by this approach create a serious legal, and therefore financial, problem for practicing engineers expected to design timber floors that satisfy client requirements. Ellis (2001) offers the only glimpse of how this issue might be resolved. The outcome is promising and suggests harmonisation is feasible. The impending revision of Eurocode 5 (scheduled for 2022) offers an opportunity to implement these changes. Combining dose value limits into a new design criteria would enable a more holistic approach to floor design and assessment. Not only could a reliance on empirical design be reduced, but the design and assessment of timber floors could be carried out with the same philosophy in mind. This would make it easier for designers to locate, test, and resolve problems with a floor’s design.
It is from this stand-point that any serviceability design approach should be developed. There do remain some broader uncertainties over quantification of dose value limits and dynamic floor parameters. These are topics for other studies. If a design method can be formulated along the lines proposed that (initially) offers reasonable accuracy then there is greater possibility of convincing the timber industry to review these uncertainties. In light of this literature review an initial design approach is proposed for testing.
4. Initial proposed design approach
The proposed approach can broadly be broken into three stages, each of which enable the prediction of a different parameter:
- Peak vertical acceleration when a single individual crosses the floor.
- Event dose value experienced by a single human receiver.
- Total dose value over an entire exposure period as a result of repeated walking events.
The formulae presented in SCI P354 for use with high frequency floors seem to offer the most complete current understanding of transient vibration response, at least in steel framed buildings. An amended form of this relationship is proposed below, that could enable prediction of the peak acceleration of a manufactured solid timber floor.
| aw,peak=2πKfn1-2FIMnWb |
The parameters are as follows; K, an empirical parameter specific to the floor construction type; fn,fundamental natural frequency of the floor (Hz); , damping ratio (%); FI, impulsive excitation force (Ns); Wn, frequency weighting factor corresponding to the fundamental natural frequency; Mn, modal mass (kg).
The terms relating to the modal amplitude at both the source and the receiver have been discarded from the SCI P354 equation. The worst case floor acceleration response will be when the receiver is directly next to the source. For this condition both amplitude terms equate to 1 and therefore are unnecessary.
Manufactured timber floors are generally not as stiff as concrete slab floors. The empirical factor K is included to account for the fact that the acceleration response will likely be greater for cross-laminated timber. In addition, the original method in SCI P354 recommended that acceleration values for modes up to twice the fundamental natural frequency be combined. For high frequency floors the higher modes will usually not contribute significantly to floor acceleration. Prediction of higher order natural frequencies is difficult if the designer is not familiar with the use of finite element software packages capable of such analysis. The proposed method simplifies the analysis to a single degree of freedom (SDOF) system. In doing so the estimation of design parameters can be achieved by hand and the range of model application can be increased. Experimental testing will be required to assess the best method of predicting design parameters.
The weighting factor Wb would be calculated according to the following formulae, approximations to the frequency weighting curves used for assessing existing floors.
| Wb=1.0 8≤fn<16Hz
Wb=16fn fn≥16Hz |
|
It is not possible at this stage to propose an approach for estimating event vibration dose value from peak acceleration. Chang (2016) conducted (unpublished) testing of low frequency floors and found a power relationship between peak acceleration and VDV. However this relationship was developed for resonant, not impulsive, floor response.
Once event dose value has been predicted then total value can be predicted, based on the number of walking events expected over an exposure period.
| VDVday=n0.25×VDV |
|
This equation is identical to those given in current floor assessment guides (BS 6472, ISO 10137). The dose limits given in these standards would also apply (Table 3.1).
5. Experimental aims
Experimental testing of the proposed approach was carried out in order to:
- Develop an initial value for empirical factor, K to allow prediction of peak acceleration;
- Establish the relationship between peak acceleration and VDV;
- Measure accuracy of parameter estimation and the resultant effect on design model accuracy
6. Methodology
6.1. Experimental set-up
Vibration was measured on four test floors at a two-storey primary school in Bath, Somerset. The school was empty of pupils and staff at the time of visiting. A glulam beam and column frame supported solid timber floor panels. The external walls were formed from straw bale panels.
6.1.1. Test floor arrangement
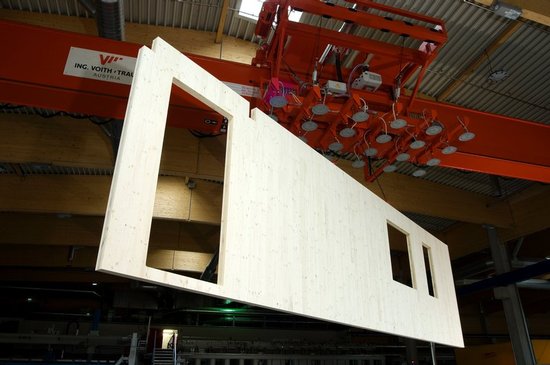
The four test floors were constructed from glue laminated timber panels, as shown in Figure 6.1. Each panel was 1.15 m in width, with length varying according to the dimensions of the floor.

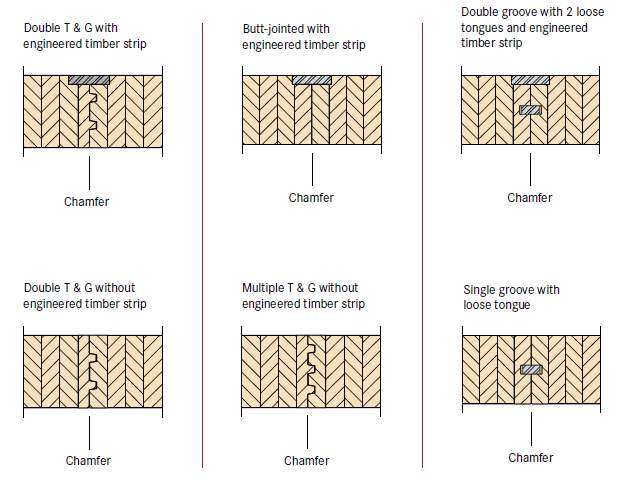
Floor panels were joined together using tongue and groove joints and a mechanically connected timber strip. It was not possible to ascertain the exact construction detail, although it is likely that it matched one of those proposed in the supplier technical manual, and presented in Figure 6.2.
The dimensions of the test floors varied, and are given in Table 6.1. See Appendix A for plan drawings of each floor (with dimensions and support conditions shown).
| Floor | Dimensions (m)
(span direction in bold) |
Support conditions | Panel thickness (m) |
| a | 7.20 x 8.75 | Simply supported on all four sides. | 0.240 |
| b | 7.20 x 8.75 | Simply supported on all four sides. | 0.240 |
| c a | 14.00 x 20.60 | Simply supported along three sides. Lines of mid-span support. Final edge cantilevers beyond support. | 0.240 |
| d | 6.60 x 9.30 | Simply supported on all four sides | 0.240 |
| a Floor partitioned into three rooms and one corridor. Measurements taken in all rooms. | |||
6.1.2. Testing method
It was elected to measure floor response to both footfall excitation and heel-drop tests. The accelerometer was positioned at the centre of the main span in each room (or as close as sensor wiring would allow) as this was assumed to be the position of largest vibration amplitude. Heel-drop tests were made at several locations in each room. Heel drop tests have been shown to give good frequency response resolution (in comparison to hammer-drop tests) for floor natural frequencies in the range 2-15 Hz (Blakeborough & Williams, 2003). These tests were carried out to allow prediction of the floor’s damping properties and natural frequencies. At each location in each room measurements were recorded for 120 seconds. A period of approximately 10 seconds was left between each heel-drop test to ensure the vibration amplitude had fully decayed before re-excitation.
Three walking events were recorded in each room. This data was collected to compare to predicted values using equation [14], and hence allow estimation of the empirical factor, K. The tester followed a walking path considered to be likely based on the layout of desks and other furniture. See Appendix A for drawings showing approximate walking path. The approximate location of the acceleration sensor and furniture is also shown. The walking pace was varied for each test, since this forms part of the relationship proposed in [14]. It was not possible to control the walking pace exactly but attempt was made to in each room to walk at what was felt to be natural ‘Slow’, ‘Medium, and ‘Fast’ paces.
6.2. Data analysis
Once data had been collected for the test floors this needed to be processed to extract meaningful results.
6.2.1. Experimental data processing
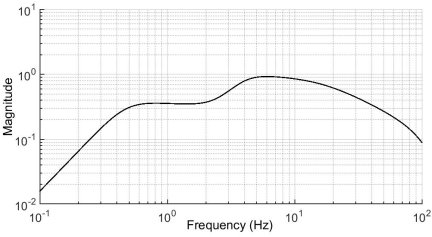
The raw data needed to be weighted as humans are more perceptive to certain frequency bands (5 – 16 Hz). The magnitude of frequencies outside this range is reduced by multiplying by the filter shown in the plot in Figure 6.3. Frequency weighting was carried out in MATLAB using digital filters according to guidance given in standards (ISO 2631-1 and others) and Rimell & Mansfield (2007). This weighted data was used to calculate weighted peak acceleration and vibration dose value.
To ensure accuracy of the weighting filters the data was sampled at 1250 Hz. This value is higher than the minimum 900 Hz recommended in BS 8041 section C2.4 and the minimum 1200 Hz recommended in Rimell and Mansfield (2007).
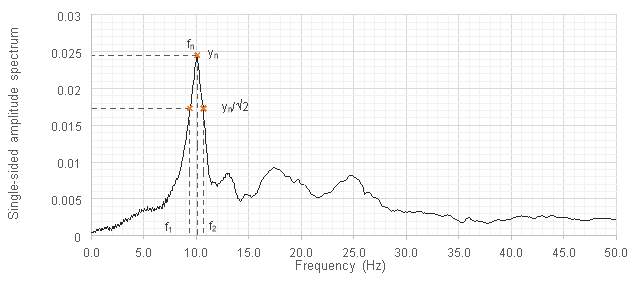
Natural frequencies for each floor were determined from frequency domain plots of the un-weighted heel-drop tests. A fast Fourier transform (FFT) algorithm was used to convert measured time-domain data to the frequency domain. Damping ratios were also estimated from the frequency domain plots. The half-power bandwidth method was used, as defined in equation [17] and Figure 6.4.
| =f2-f12fn |
6.2.2. Finite element analysis
Finite element models were constructed of each floor in order to predict the natural frequencies and corresponding modal masses. The floor construction and associated dead weight was estimated from construction drawings. A proportion of the live load in the classrooms was assumed to be semi-permanent (desks and chairs). Photographs of each room were used to estimate the approximate dead load due to classroom furniture. The NA to BS EN 1991-1:2002 stipulates that the uniformly distributed live load for classrooms should be 3.0 kN/m2. Design standards typically recommend assuming between 10% and 20% of live load as being semi-permanent (SCI P354, HIVOSS EN02). Calculated values for furniture loading were compared to these limits as a sense check.
| Description | Value (kN/m2) |
| Structural panel (240 mm deep) | 4.50 |
| Insulation board (100 mm) | 0.02 |
| Plywood sheathing (15 mm) | 0.105 |
| Vinyl flooring | 0.02 |
| Classroom fittings | (varies by floor) |
Material strength properties were taken from the Profideck technical manual. No value was given for the transverse (across panel) bending stiffness of the floor. However the groove and strip panel to panel connection will undoubtedly offer some transverse load distribution and contribute to two way spanning of the panels. To assess this effect both one-way and two-way spanning models were constructed. Predicted natural frequencies could then be compared to measured values to determine whether across panel stiffness is significant for this construction type.
6.2.3. Regression analysis
Once peak acceleration and floor parameters for each walking event had been determined from the processed measured data, the empirical factor K could then be estimated. Non-linear regression analysis was carried out on the proposed model for predicting peak acceleration.
Regression analysis was also conducted between peak acceleration and vibration dose value for the corresponding footfall to see what type of relationship could be formed.
7. Results
In total, 685 footfalls (24 walking events) and 154 heel drops were recorded.
7.1. Parameter prediction
Fundamental natural frequencies and damping ratios were estimated from measured data for each heel-drop. Some tests only excited higher frequency modes and as a result predicted fundamental natural frequencies significantly higher than expected. Furthermore, when frequency peaks were exhibited in close proximity predicted damping ratios were unrealistically large. In order to not skew the results for fundamental natural frequency and damping ratio median values, instead of mean, were calculated.
| Floor | Room | fn (Hz) | (%) |
| a | NE1 | 10.1 | 6.7 |
| b | NF1 | 11.3 | 5.5 |
| c | NG1 | 9.6 | 6.1 |
| NH1 | 11.7 | 10.6 | |
| LAND | 13.3 | 4.0 | |
| d | NI9 | 14.0 | 10.0 |
Fundamental natural frequency and associated modal mass were predicted for each floor using finite element analysis. These results, together with the calculated values for semi-permanent furniture loading are given in Table 7.2Error! Reference source not found..
- Predicted values for natural frequency and modal mass from one-way and two-way spanning finite element models
| Floor | Semi-permanent furniture load (kN/m2) | Total floor mass (kg) | One way spanning FEA | Two way spanning FEA | ||
| fn (Hz) | Mn (kg) | fn (Hz) | Mn (kg) | |||
| a | 0.23 | 9379 | 8.18 | 4689 | 13.65 | 2350 |
| b | 0.30 | 9829 | 7.99 | 4914 | 13.34 | 2462 |
| c | 0.32 | 43025 | 7.71 | 4644 | 8.91 | 3934 |
| d | 0.15 | 8340 | 8.83 | 5519 | 15.60 | 2085 |
The FE predictions of natural frequency can be used to determine whether the floors are one way or two way spanning. In all cases the one-way spanning models under-predict natural frequency, when compared to the measured data in Table 7.1. The two-way spanning models over-predict for floors a, b and d but under-predict for floor c. It is clear that determining the transverse stiffness of each floor is not straightforward, and it is hard to distinguish whether the one-way or two-way models are more appropriate. The modal mass predictions for the two way spanning models have been used for further analysis as it was felt that these models offered a slightly better approximation of reality.
7.2. Data processing and frequency weighting
The acceleration-time output from a continuous walking event (Figure 7.1) clearly demonstrates a transient floor response to loading. Each footfall response has fully decayed before the next begins.
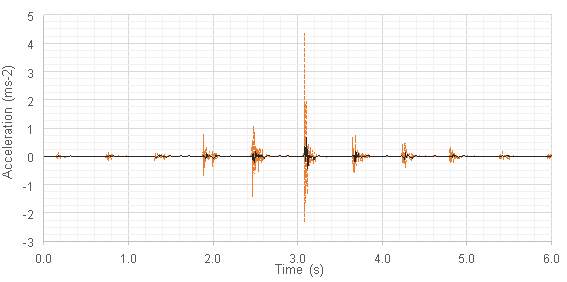
The filtered data (shown in black) shows clear attenuation as a result of the weighting filter applied to the raw signal (orange). It was found that for five walking events the measured peak acceleration (and therefore the VDV) was unexpectedly high, in some cases three times larger than other events measured on the same walking path. This was likely due to a footfall impacting the floor unrealistically close to the receiver. In reality, with a human receiver, the walker is unlikely to step this close. At this close proximity additional damping effects due to the presence of a human receiver would likely attenuate the response in any case.
Two tests also resulted in unexpectedly low readings of peak acceleration. These two measurements were taken in the first room tested (NE1, floor a) and so the error may simply be attributable to tester error; the start of the walking path was very close to the sensor and the tester had not reached final walking speed at the closest point on the route to the sensor. Actual footfall force may therefore have been lower than calculated, resulting in lower than expected peak acceleration measurements. Examination of the response data for these tests shows the walking frequency for the first five steps to be 1.1 Hz, lower than the 1.72 Hz average for the entire event. Data from these events has been excluded from regression analysis. Orange data markers have been used to indicate any outlying results that have been discounted from modelling.
7.3. Regression analysis
To predict a floor’s peak acceleration a non-linear regression analysis was conducted on the relationship proposed in section 4 in order to determine the empirical factor, K and assess initial goodness of fit. The best fit was found when K was taken as 3.21. The upper bound value for the 95% confidence interval is 3.79. This would offer a conservative estimate that could be used for design.
The ANOVA statistics are presented below in Table 7.3. The R2 value was calculated as 0.460. This goodness of fit measure is not considered fully appropriate for non-linear models (Spiess & Neumeyer, 2010) and therefore should be taken with caution. A check of the residual error shows it to be relatively large when compared to the corrected total error, indicating that the model is not sufficient at explaining all of the variance in experimental results.
| Source | Sum of squares | df | Mean squares |
| Regression | 3.256 | 1 | 3.256 |
| Residual | 0.384 | 16 | 0.024 |
| Uncorrected Total | 3.640 | 17 | – |
| Corrected Total | 0.711 | 16 | – |
For each footfall a vibration dose value was calculated and plotted against the maximum weighted acceleration, as shown in Figure 7.3.
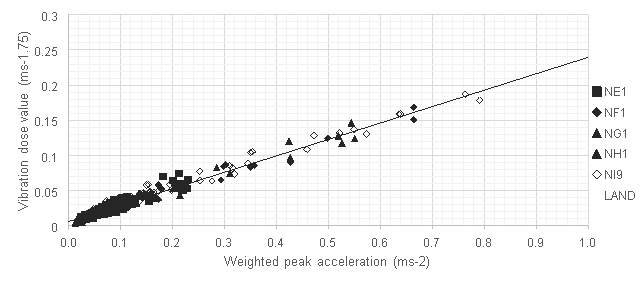
A linear regression analysis was carried out to determine the relationship and the associated goodness of fit. The ANOVA statistics are presented below in Table 7.4. The R2 statistic was found to be 0.979, indicating a good fit to the data.
| Source | Sum of squares | df | Mean squares |
| Regression | 1.747 | 1 | 1.747 |
| Residual | 0.033 | 400 | 0.000 |
| Total | 1.780 | 401 | – |
The predicted coefficients allow vibration dose value to be predicted as follows.
| VDVi=0.234×aw,peak+0.006
≈0.24×aw,peak |
The above sets of results indicate initial promise in the prediction models. However further discussion is required before conclusions can be drawn.
8. Discussion of results
The results have been further examined to assess what conclusions can be drawn.
8.1. Limitations of approach
The experimental method made some simplifications that may limit the deductions that can be made from the results. It is important to keep these in mind when drawing any conclusions. The walking path was a controlled variable, however there was no route marked on the floor for the tester to follow. It is inevitable therefore that the walking path will have varied slightly between each test in a room. It is not expected this will have had a significant effect on results, however if further testing were conducted then the experimental method could be improved by temporarily marking the walking route with tape. In addition, whilst the walking paths were determined based on layout of doors and expected room use, the route chosen may not have accurately reflected day to day use of the space. In turn, the combination of walking route and sensor location may not have been the most onerous, leading to a lower measurement of peak acceleration.
The classrooms were not occupied at the time of measurement and this meant that the floor mass was lower than would be expected in service. The mass of pupils and teachers would not have significantly increased the distributed mass of the floor and this assumption is not expected to have adversely affected results. No consideration of local concentrated mass at the sensor due to the presence of a human receiver may however have resulted in an over-prediction of floor response and this effect could be something that further experiments look to assess.
The experiments were only conducted on one type of floor and therefore no comparison can yet be made between different types of solid wood panel. More tests need to be conducted on different floor types. Likewise, as measurements were only taken on the floor of each room no consideration could be made for vibration transmission to a seated receiver through the frame of a seat.
Total mass of fixtures and fittings in each room could not be predicted, since access to cupboards and drawers was not possible. This means that there is a large error associated with the prediction of modal mass which in turn could lead to inaccurate estimation of the empirical factor, K.
None of the floors exhibited a first order natural frequency greater than 16 Hz and the frequency weighting factor (Wb) was taken as 1 for all predicted peak acceleration values. The model fit to floors with natural frequency above this value could not be determined, nor could the effect of the frequency weighting factor on predicted peak acceleration. Until higher frequency test floors can be found it is not possible to confirm whether the frequency weighting factor is a necessary model term.
8.2. Accuracy of input parameters
The accuracy of the model relies wholly on the accuracy of the input values used. In the experiment described, all terms (with the exception of modal mass) were predicted using measured data. In a design situation this would not be possible and parameters would have to be estimated or extracted from tabulated data. Any predictions made by the model might be heavily influenced by variations in input values and discussion of this effect needs to be made. The error in design criteria is often directly attributable to the assumptions made about a floor’s parameters. Damping in particular poses a problem due to the limited knowledge on how to quantify or measure damping properties (Hu, et al., 2001).
By varying input parameters and comparing the predicted peak accelerations the robustness of the model can be assessed. Figure 8.1 shows the percentage change in predicted peak acceleration when each input parameter is varied while keeping all others constant. The starting values for each parameter where those estimated for floor c in room NH1, since peak accelerations predicted for this floor showed the lowest variance from measured values.
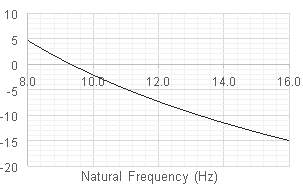
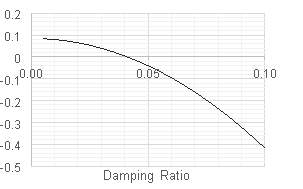
% variation in predicted peak acceleration
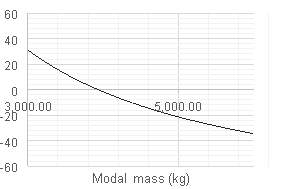
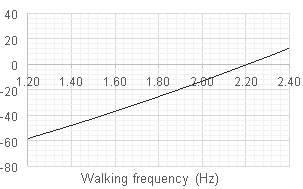
If estimation of fundamental natural frequency is highly inaccurate then resultant errors in predicted peak acceleration could be larger than 20%. To examine the likelihood of such an error the values of fundamental natural frequency from measured frequency domain data have been compared to those from available estimation techniques. The method given in Matilainen and Puttonen (2014) is reproduced from the Finnish design code RIL 205-1:2009 and is based on classic laminate plate theory (CLPT). It is intended for use with CLT floors. The method given in HIVOSS EN02 and appears to be a further simplification of CLPT assuming isotropic properties. EN02 is intended for use with steel and concrete framed buildings. The natural frequencies have also been predicted using the equation given in Eurocode 5 for use with joisted timber floors. The results are shown in Table 8.1.
| Floor | Frequency domain | FE analysis | RIL 205-1 | HIVOSS EN02 | Eurocode 5 |
| a | 10.4 | 13.7 | 9.6 | 14.6 | 8.2 |
| b | 11.4 | 13.3 | 9.6 | 14.3 | 8.0 |
| c | 10.2 | 8.9 | –a | – a | – a |
| d | 14.2 | 13.6 | 10.1 | 23.0 | 10.8 |
| a Method not applicable to multi-span floors | |||||
All prediction methods differ considerably from measured values. It is not surprising that the EC5 method is inaccurate since it is intended for use only with one-way spanning floors. The HIVOSS EN02 method has been formulated for heavier concrete floors and the low mass of the test floors results in large over-prediction of natural frequency. RIL 205-1 comes the closest in its predictions, since the formula is designed for use with timber panel floors. In general the error in prediction is no greater than 4Hz. Inspecting Figure 8.1 shows that prediction of fundamental natural frequency resulting in an error of this magnitude does not result in large variations in predicted peak acceleration, with output values only varying by around 10%. The model seems reasonably robust to expected errors in prediction of natural frequency. Prediction of natural frequency will improve with time as dynamic behaviour of solid timber floors becomes better understood.
Prediction of damping ratio is also difficult, and values are usually taken from tabulated data given in design standards. Table 8.2 is based on a similar table given in Middleton & Brownjohn (2010) and brings together some of the recommended damping ratios given in various design codes.
| Floor construction material | Bare floors or very few non-structural components (%) | Non-structural elements i.e. furniture, fixtures and fittings and cantilever partitions (%) | Heavily partitioned floor with full-height partitions (%) | |
| UK NA to EC 5 | Timber | 2.0 | – | – |
| ISO 10137 | Timber | 2.0 | 2.0-4.0 | 4.0-5.5 |
| SCI 354 | Steel/concrete | 1.1 | 3.0 | 4.5 |
| AISC | Steel/concrete | 2.0 | 3.0 | 5.0 |
| Canadian | Steel/concrete | 3.0 | 6.0 | 12.0 |
The values suggest broad agreement (with the exception of the Canadian design codes). In turn, when compared to the measured values in Error! Reference source not found. there seems to also be good agreement, with the exception of floor c. The damping values in some areas of floor c are twice that expected (10%). This may simply be down to the fact that the floor has multiple spans and is heavily partitioned. Given that high damping is beneficial for vibration serviceability the design standards might deliberately underestimate its effects. Nonetheless the design equation is not affected greatly by changes in damping ratio; the associated error is less than 1% for the range of values given in Figure 8.1.
Variations in predicted excited modal mass do however have a large effect on predicted peak acceleration. Designers should be able to predict the dead weight of the floor construction with reasonably high accuracy. Determining how much of the live load should be considered to be semi-permanent is more difficult however. Existing design standards recommend taking anything from 0% (Eurocode 5) to 20% (HIVOSS EN02, SCI P354) of distributed live load as permanent. Estimated values for each floor (given in Table 7.2) ranged from 5-10%. Various values of semi-permanent live load were applied to the two-way spanning FE models to examine how much this would affect estimation of modal mass.
| Floor | Estimated load | 10% live load | 20% live load | |||
| fn (Hz) | Mn (kg) | fn (Hz) | Mn (kg) | fn (Hz) | Mn (kg) | |
| a | 13.65 | 2350 | 13.34 | 2462 | 11.94 | 3074 |
| b | 13.34 | 2462 | 13.34 | 2462 | 11.94 | 3074 |
| c | 8.91 | 3934 | 8.95 | 3870 | 8.35 | 4854 |
| d | 15.60 | 2085 | 14.81 | 2312 | 13.55 | 2765 |
Modal mass could vary by as much as 33% if 20% of live load is applied at design stage and only 5% is experienced normally in service. This could result in an over-prediction of peak acceleration of nearly 30% according to Figure 8.1. However, the variations in predicted modal mass are much greater between the one-way and two-way spanning models, as tabulated in Table 7.2. This is a more critical decision for the designer to make, as this could lead to far greater errors.
Modal mass can be predicted by hand, and empirical equations (determined by panel support conditions) are given in HIVOSS EN02, a standard intended for design of steel and concrete structures. For a panel simply supported on all four sides, modal mass can be calculated by multiplying total mass by a factor of 0.25. This factor reduced to 0.17 for a fully fixed slab. The predicted modal mass as a percentage of total mass for floors a,b and d ranged from 25.0% to 25.1%, suggesting that for four sided simply supported floors this method is accurate and can be used. The 9.0% of total mass estimated for floor c however does not fit the method. For complicated floor arrangements other methods are needed.
If the errors in prediction of natural frequency, damping ratio and modal mass are combined and used in the same calculation of peak acceleration for floor c then calculated value differs from the measured value by 22.5%. This error will be greater for other floors due to the wider variations in predicted modal mass. The majority of the error can be attributed to poor estimation of this parameter and it is unclear how this can be mitigated as permanent floor mass is so difficult to determine at design stage. Under-estimation of modal mass is clearly favourable from a design perspective, since this will result in a greater predicted peak acceleration and a floor that does not excessively vibrate.
Floor mass also has an effect on observed natural frequency and damping ratio. Since mass is rarely, if ever, uniformly distributed there will always be some variability in observed parameters. Such effect was observed with the measured results for floor c. No design method can ever expect to fully account for this and therefore some variance from the model is not unusual. This effect will have contributed to errors in predicted values for peak acceleration; not all the error can be attributed to errors in test procedure.
Estimation of input parameters clearly has a large impact on the accuracy of the prediction model. However accuracy could also be improved by reformulating the model, as discussed in the following section.
8.3. Prediction of peak acceleration
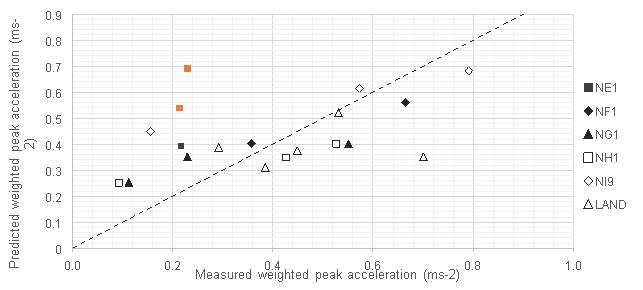 A visual check of the goodness of fit in Figure 8.2 shows the best correlation to be in the range 0.35 to 0.8 ms-2.
For floors with lower measured values the model over-predicts peak acceleration. This could be attributed to prediction of impulsive excitation force. The empirical factors applied to floor natural frequency and walking frequency have been developed for steel framed buildings and may not be suitable for timber floors. Further regression analysis would help to determine if these factors are applicable to timber panel floors.
It is interesting that the empirical factor, K, is much greater than 1 (3.21). The model from which the design equation was adapted did not have such a factor. However this does not mean the accelerations experienced by solid timber floors should be four times greater than those for concrete floors. As mentioned previously the original SCI P354 design method combined the acceleration response from the first three or four natural frequencies. The adapted model used in this paper approximates the floors as a SDOF system and therefore will under predict acceleration if no factor is included. To test this fact testing was carried out in the five storey concrete framed Department of Architecture and Civil Engineering building at the University of Bath. Acceleration response measurements from walking by a single tester are given in Table 8.1.
| Average weighted peak acceleration (ms-2) | ||
| Measured data | Proposed method (K=1) | Proposed method (K = 6.63) |
| 0.0980 | 0.0147 | 0.0974 |
If K is taken as 1 then the model significantly under-predicts floors response. A K value of 6.63 was found to minimise residual error and provide the best fit to the data. The K factor differs considerably from that predicted for the glue-laminated timber floors. The measured data gave the natural frequency of the floor as 20.3 Hz, significantly higher than that measured for the glulam panel floors. In addition, the total mass of the floor was around 10 times the mass of the floors at the primary school. It is not clear whether the difference in predicted K values for the two floors types is a result of the construction type or the large difference in input parameters used. Until the results are compared to data gathered from different floors it is difficult to draw any conclusions on whether the model could be better formulated.
However, prediction of peak acceleration is useless if it cannot be related to some acceptability criterion. Discussion is needed of how vibration dose value can be predicted.
8.4. Prediction of event dose value
The linear relationship exhibited between peak acceleration and vibration dose value is useful, since this stage of the design process does not need to rely on (potentially inaccurate) predicted floor parameters. The R2 value of 0.98 suggests the correlation is strong provided the floor responds impulsively (natural frequency greater than 8 Hz).
However, the vibration dose value for an entire event needs to be determined to make the design method useful. There are uncertainties over how best to approach this and so two potential methods are proposed. Further research will be needed to confirm which approach is most appropriate.
Method 1: Exponential curve fitting
This approach assumes that an exponential curve can be fitted to each side of the weighted acceleration-time plot for the walking event, as in Figure 8.3.
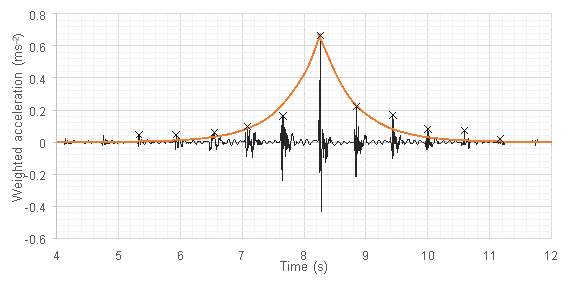
If the peak acceleration and walking frequency are known, then the approximate peaks of the other footfalls can be determined. If it is assumed that the response is symmetrical about the central peak (and therefore the same curve can be fitted to each ‘leg’ of the response) then a simple equation can be formulated to sum each of the peaks and calculate a vibration dose value. Equation [19] could be used for this purpose. It sums the dose values for the first five peaks either side of the main peak, as it is assumed that (for a normal floor) outside this range the dose value for each footstep will be negligible.
| VDV = 0.25 apeak(1+1.16efn)0.25 (ms-1.75) |
It is expected that the shape of the exponential function will be determined by the damping ratio of the floor. The constant value of 0.25 has been taken from [18]. This factor essentially converts the peak acceleration (apeak) into a vibration dose value before being summed by the term in brackets. The measured vibration dose value has been plotted against estimated dose value using equation [19].
In general the fit seems good, although the model does over-predict dose values for larger peak accelerations. Furthermore, this design step does add additional complexity to the calculation process. It’s also not clear if an exponential curve would offer a good fit to all floors and walking paths.
Method 2: Direct linear estimation
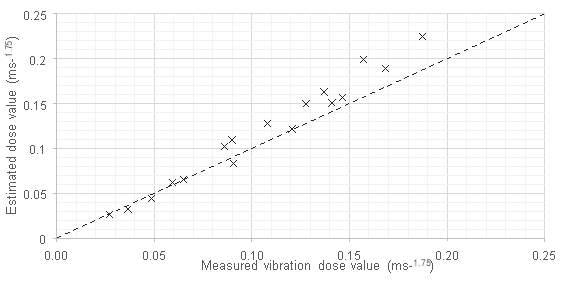
This additional complexity could be removed if peak acceleration could be correlated more simply with event vibration dose value. To test this the two parameters were plotted against each other.
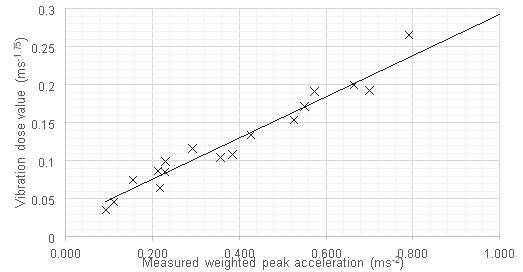
The R2 value of 0.984 indicates the model is a good fit to the measured data over this range. This makes sense, as vibration dose value is highly sensitive to peaks. For transient floor response the main acceleration peak is much larger than the surrounding peaks therefore this has a much greater effect on the result than the surrounding footfalls. Predicting VDV in this way simplifies the design process dramatically, since event dose value can be directly calculated from peak acceleration. This seems a reasonable step to take for the data collected however this might prove an over-simplification when applied to other floor types. Further assessment is clearly needed. For example, relationship may break down when the main peak is closer in magnitude to the other footfall peaks. A human receiver will add additional mass to the floor and likely result in reduction in magnitude of the main peak. This would increase the contribution of the adjacent peaks to the overall dose value, violating the linear relationship between peak acceleration and VDV. Weckendorf and Smith (2012) examined the effect of human occupancy on CLT floors and found in some cases that a single inhabitant could increase damping ratio by as much as 387%. Testing will be required to examine the effect on peak acceleration.
Both methods break down if the source walks past the receiver twice on one walking route, since then there will be two peaks. If a designer identifies this is the case then the walking route could probably be separated into two or more events and VDVs combined as recommended in BS 6472-1. It’s not clear how close to the receiver the source might need to come before a footfall can be considered as a secondary peak. As human stride length usually varies between 1.0 and 1.5 m, if a source is 2.0 m away from the receiver then he or she can reasonably be said to be far enough away to not cause a secondary peak. This criterion was not violated in the experiments detailed and response data seems to confirm this as adequate. Experiments that vary footfall distance from the receiver will be required to establish a more reasonable criterion for this.
9. Conclusions
The use of solid timber panel floors in the United Kingdom will continue to increase as the industry looks to take advantage of this high-speed, high tolerance construction method and the value of the manufactured timber construction sector will undoubtedly grow as a result. As manufactured timber moves to becoming a more mainstream construction material greater focus will also be placed on the design process; both clients and designers will want to have confidence in the product they are constructing. Serviceability conditions will be of particular importance due to timber’s susceptibility to problems with dynamic loading.
Unfortunately existing serviceability criteria have been formulated specifically for joisted timber or concrete slab floors, and the criteria are not suitable for the unusual dynamic properties exhibited by timber panel floors. The empirical derivation of many of these criteria risks designers employing a ‘black box’ approach to vibration design, not fully understanding a criterion’s unsuitability for use with unusual, more innovative, construction types. The wildly different approach to assessment of existing floors has created a situation of great uncertainty. Harmonisation is essential, and since existing assessment criteria (VDV) are said to correlate well with human annoyance it is from this starting point that a design method has been proposed.
The acceleration based approach that has been proposed seemed to correlate well with experimental results, at least for the test floors chosen. Overall, the design method seems to offer valid predictions of floor response to single walking events. The empirical factor (K) of 3.21 used to estimate peak acceleration provides a good fit to the data obtained from the Nucleus Centre building at Hayesfield Girl’s School. Some errors in results indicate how sensitive floor acceleration is to changes in walking frequency or proximity to the receiver. If receiver is very close (within 4-5 paces) of the start of a walking event then floor response will not be as large as if the source had approached from another direction, due to the lower walking frequency observed at the start of the event. Experimental method could have been improved by placing greater control on these variables.
The model seemed reasonably robust to uncertainties in prediction of natural frequency and damping ratios. Issues do remain with prediction of modal mass however. More research and guidance is needed to define what mass should be considered as permanent, particularly in the case of offices or classrooms, where high human occupancy could significantly alter vibration response.
Vibration dose value for a walking event correlates well linearly with peak acceleration, provided the walking path of the source is linear and only passes close to the receiver (within 2.0 m) once on the route to ensure only a single peak in acceleration is observed by the receiver. For more complicated walking paths it is recommended that the event is broken up into several separate events and the results summed according to BS 6472-1. More testing is required to establish if the linear relationship holds for different types of solid timber panel floor. Otherwise it may be more appropriate to pursue an approach that utilises some form of exponential curve fitting.
The work presented in this dissertation has been limited to glulam floors supporting educational spaces, however the design approach has been specifically formulated to allow future testing and application to other types of floor. Experiments in other buildings would yield additional K values as well as helping to refine other aspects of the process, such as the estimation of floor dynamic parameters. Further testing will also help determine if the calculation models need adapting, as the current sample of test floors is limited to a narrow band of natural frequencies.
The major barrier to meaningful use of the design method remains the prediction of input parameters. Some other questions, such as how to determine walking route of the source and position of the receiver are unlikely to ever be resolved, since they vary so freely. These decisions will always be at the mercy of the designer. More information is needed on prediction of natural frequency, damping ratio and modal mass as this will facilitate more confident use of the design equations. Finite element modelling will help to predict these properties in some cases but should not be considered the complete solution. It is important that any design method can be used by hand, without the need for finite element or computer analysis. To encourage uptake of solid timber flooring in the UK design methods must not prejudice against designers not familiar with certain software design packages.
It is felt that a dynamic, acceleration-based approach represents the future for serviceability design of timber floors. Experimental testing has shown initial promise but much more work will be required to reach a satisfactory, usable, design method.
10. Recommendations for future work
The findings presented here have highlighted a need for further research in certain areas. It is hoped this will help to resolve some of the issues experienced during testing, as well as increasing the applicability of the design approach. Primarily, it will be necessary to:
- Develop a design equation for resonant floor response such that design of lower frequency floors could be incorporated into the design method;
- Test other joisted and timber panel floors for alternative construction types. This will enable prediction of a range of K values, as well as helping to confirm the findings given here. In particular, floors outside the range of those currently tested would help to further validate the design method;
- Examine how the presence of a human receiver affects peak acceleration;
- Re-assessment of the vibration dose value limits given in BS 6472 to allow for shorter occupancy periods. The type of test floor (joisted, solid panel) should also be considered to assess whether this has an effect on human response;
- Gather test data of solid timber floors to improve guidance on prediction of dynamic parameters by hand.
11. Flow-chart of design process
The flow-chart below offers a summary of the proposed design method.
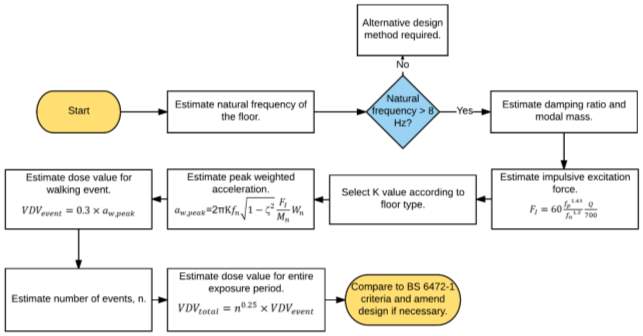
Bibliography
Adhikari, S., 2001. Damping models for structural vibration, University of Cambridge: Doctoral Dissertation.
Al Foqaha’a, A. A., Cofer, W. F. & Frildey, K. J., 1999. Vibration design criterion for wood floors exposed to normal human activities. Journal of structural engineering, 125(12), pp. 1401-1406.
Allen, D. E. & Murray, T. M., 1993. Design criterion for vibrations due to walking. Engineering Journal-American Institute of Steel Construction, 30(4), pp. 117-129.
Atherton, G. H., Polensek, A. & Corder, S. E., 1976. himan response to walking and impact vibration of wood floors. Forest Products Journal.
Blakeborough, A. & Williams, M. S., 2003. Measurement of floor vibrations using a heel drop test. Proceedings of the Institution of Civil Engineers – Structures and Buildings, 156(4), pp. 367-371.
British Standards Insititute, 2002. NA to BS EN 1991-1-1:2002 Eurocode 1. Actions on Structures. General Actions, London: BSI.
British Standards Institute, 1987. BS 6841:1997 Measurement and evaluation of human exposure to whole-body mechanical vibration and repeated shock. London: BSI.
British Standards Institute, 1997. BS ISO 2631:1997 Mechanical vibration and shock – Evaluation of human exposure to whole-body vibration Part 1: General Requirements. London: BSI.
British Standards Institute, 2004. BS EN 1995-1-1:2004+A2:2014 Eurocode 5: Design of timber structures – Part 1-1: General – Common rules and rules for buildings. London: BSI.
British Standards Institute, 2004. NA to BS EN 1995-1-1:2004+A1:2008 UK National Annext to Eurocode 5: Design of timber structures Part 1-1: General – Common rules and rules for buildings. London: BSI.
British Standards Institute, 2005. BS EN ISO 8041:2005 Human response to vibration – measuring instrumentation. London: BSI.
British Standards Institute, 2008. BS 6472-1:2008 Guide to evaluation of human exposure to vibration in buildings Part 1: Vibration sources other than blasting. London: BSI.
Brownjohn, J. M. W. & Middleton, C. J., 2008. Procedures for vibration seviceability assesment of high-frequency floors. Engineering Structures, 30(6), pp. 1548-1559.
Chang, W.-S., 2016. Design of timber floor for vibration: some design and test questions, s.l.: Unpublished.
Chui, Y. H., 1987. Vibration performance of wooden floors in domestic dwellings, Brighton UK: Brighton Polytechnic: PhD Thesis.
Dolan, J. D. et al., 1991. Preventing annoying wood floor vibrations. Journal of Structural Engineering, 125(1), pp. 19-24.
Ellingwood, B. & Tallin, A., 1984. Structural seviceability: floor vibrations. Journal of structural engineering, 110(2), pp. 401-418.
Ellis, B. R., 2000. On the response of long-span floors to walking loads generated by individuals and crowds. Structural Engineer, 78(10), pp. 17-25.
Ellis, B. R., 2001. Serviceability evaluation of floor vibration induced by walking loads. The Structural Engineer, 79(21), pp. 30-36.
Filliatrault, A., Folz, B. & Foschi, R. O., 1987. Finite-strip free vibration analysis of wood floors. Canadian Journal of Civil Engineering, 116(8), pp. 2127-2142.
Foschi, R. O. & Gupta, A., 1987. Reliability of floors under impact vibration. Journal of Civil Engineering, 14(5), pp. 683-689.
Griffin, M. J., 1998. A comparison of standardized methods for predicting the hazards of whole-body vibration and repeated shocks. Journal of sound and vibration, 215(4), pp. 883-914.
Griffin, M. J., 2012. Handbook of Human Vibration. 1 ed. London: Academic Press.
Hu, L. J. & Chui, Y. H., 2004. Development of a design method to control vibrations induced by normal walking action in wood-based floors. Proceedings of the 8th World Conference onf Timber Engineering, Volume 2, pp. 217-222.
Hu, L. J., Chui, Y. H. & Onysko, D. M., 2001. Vibration serviceability of timber floors in residential construction. Progress in Structural Engineering, 3(3), pp. 228-237.
International Standards Organization, 2007. ISO 10137: 2007 Bases for design of structures – Serviceability of buildings and walkways against vibrations. Geneva: ISO.
Jarnerö, K., Brandt, A. & Olsson, A., 2015. Vibration properties of a timber floor assessed in laboratory and during construction. Engineering Structures, Volume 82, pp. 44-54.
Jones, K., Stegemann, J., Sykes, J. & Winslow, P., 2016. Adoption of unconventional approaches in construction: the case of cross-laminated timber. Construction and Building Materials, Volume 125, pp. 690-702.
Kalkert, R. E., Dolan, J. D. & Woeste, F. E., 1993. The current status of analysis and design for annoying wooden floor vibrations. Wood and fiber science, 25(3), pp. 305-314.
Lane, T., 2014. The rise of cross-laminated timber. Building, 3 July.
Lenzen, K. H., 1966. Vibration of steel-joist concrete slab floors. Engineering Journal-American Institute of Steel Construction, 3(3), p. 133.
Lewis, C. H. & Griffin, M. J., 1998. A comparison of evaluations and assessments obtained using alternative standards for predicting the hazards of whole-body vibration and repeated shocks. Journal of sound and vibration, 215(4), pp. 915-926.
Matilainen, J.-P. & Puttonen, J., 2014. Free vibration of CLT plates. Journal of Structural Mechanics, 47(1), pp. 17-33.
Mayer Melnhof Holz, 2013. MM Profideck Laminated Ceiling Elements. [Online]
Available at: http://www.mm-holz.com/en/downloads/mm-brochures/
[Accessed 02 23 2017].
Mayer Melnhof Holz, n.d. Laminated Ceiling Elements [image online]. [Online]
Available at: http://www.gb-legname.com/en/laminated-ceiling-elements/
[Accessed 22 03 2017].
Mettem, C. J., Bainbridge, R. J., Pitts, G. C. & Enjily, V., 1998. Timber frame construction for medium-rise buildings. Progress in Structural Engineering and Materials, 1(3), pp. 253-262.
Middleton, C. J. & Brownjohn, J. M. W., 2010. Response of high frequency floors: A literature review. Engineering Structures, 32(2), pp. 337-352.
Negreira, J. et al., 2015. Psycho-vibratory evaluation of timber floors – Towards the determination of vibration acceptability and vibration annoyance. Journal of Sound and Vibration, Volume 340, pp. 383-408.
Ohlsson, S., 1980. Floor vibrations and human discomfort, Gothenburg, Sweden: Chalmers University of Technology: PhD Thesis.
Ohlsson, S., 1988. Ten years of floor vibration research – A review of aspects and some results. Proceedings of the Symposium/Workshop on Serviceability of Buildings (Movements, Deformations, Vibrations), Volume 1, pp. 435-450.
Ohlsson, S., 1991. Serviceability criteria – especially floor vibration criteria. Proceedings of the 1991 Internation Timber Engineering Conference, Volume 1, pp. 1-58.
Reddy, J. N., 1984. A simple higher-order theory for laminated composite plates. Journal of Applied Mechanics, 51(4), pp. 745-752.
Reiher, H. & Meister, F. J., 1931. The effect of vibration on people. Forschung auf dem Gebiete des Ingenieurwesens, 2(11), pp. 381-386.
Rimell, A. N. & Mansfield, N. J., 2007. Design of digital filters for frequency weightings required for risk assessments of workers exposed to vibration. Industrial Health, 45(4), pp. 512-519.
Smith, I. & Chui, Y. H., 1988. Design of lightweight wooden floors to avoid human discomfort. Canadian Journal of Civil Engineering, 15(2), pp. 254-262.
Spiess, A.-N. & Neumeyer, N., 2010. An evaluation of R2 as an inadequate measure for non-linear models in pharmacological and biochemical research: a Monte Carlo approach. BMC pharmacology, 10(1), p. 6.
Steel Construction Institute, 2009. SCI P354 Design of Floors for Vibration: A New Approach. Ascot: SCI.
Stora Enso, n.d. Stora Enso CLT. [Online]
Available at: http://services.poissonbouge.net/clients/59332f89-95fb-f3f7-562d21d2dd2348ef/images/xl/67e57d62-2590-a75b-bce1bdf3eee84c02.jpg
[Accessed 25 February 2017].
Ungar, E. E., 1973. The status of engineering knowledge concerning the damping of built-up structures. Journal of Sound and Vibration, 26(1), pp. 141-154.
Ungar, E. E., 1992. Structural Damping. In: L. L. Beranek & I. L. Ver, eds. Noise and Vibration Control Engineering: Principles and Applications. New York: Wiley, pp. 451-481.
Weckendorf, J. & Smith, I., 2012. Dynamic characteristics of shallow floors with cross-laminated-timber spines. Proceedings of 12th World Conference on Timber Engineering, pp. 16-19.
Wilford, M., Young, P. & Field, C., 2007. Predicting footfall-induced vibration: Part 2. Structures & Buildings, 160(SB2), pp. 73-79.
Williams, C. S., 1986. Designing Digital Filters. Englewood Cliffs: Prentice-Hall.
Wiss, J. F. & Parmelee, R. A., 1974. Human perception of transient vibrations. Journal of the Structural Division, 100(4), pp. 773-787.
X-LAM Alliance, 2017. Cross Laminated Timber. [Online]
Available at: https://www.xlam-alliance.com/design
[Accessed 25 February 2017].
X-LAM Alliance, n.d. Cross Laminated Timber Design Guide. [Online]
Available at: https://www.xlam-alliance.com/assets/technical/X_LAM_Tech_Brochure_Nov_23.pdf
[Accessed 25 February 2017].
Floor A
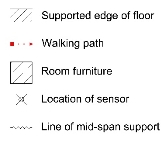
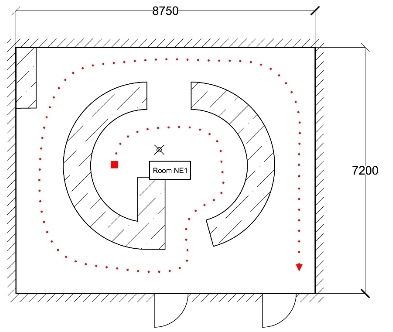
Floor B
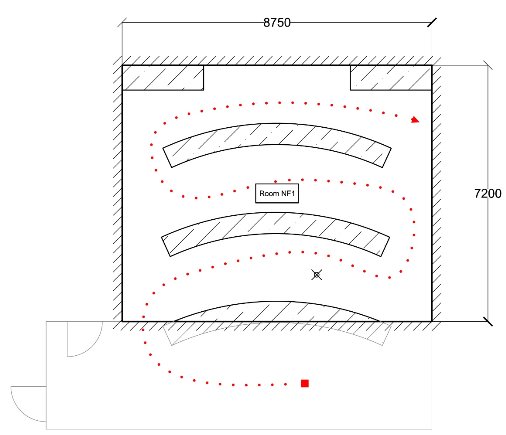
Floor C
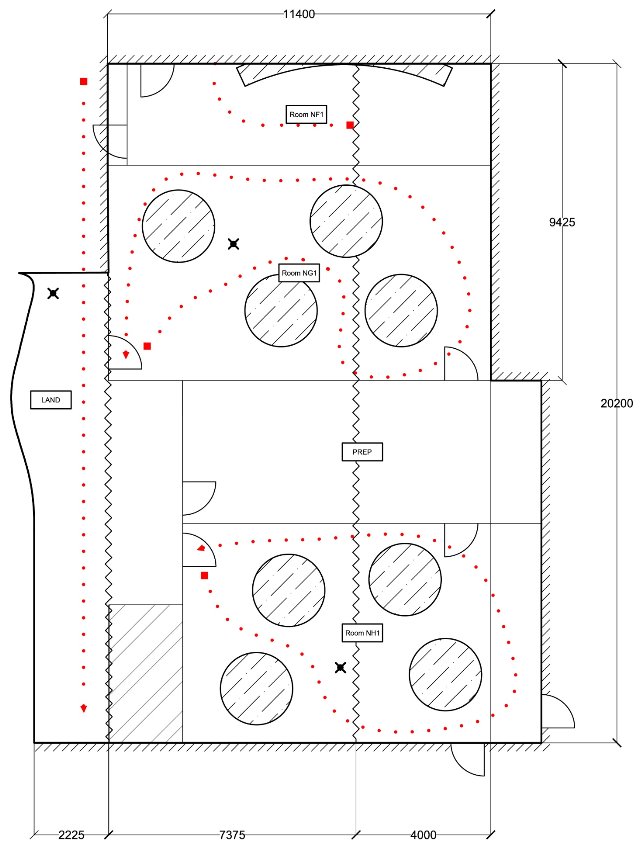
Floor D
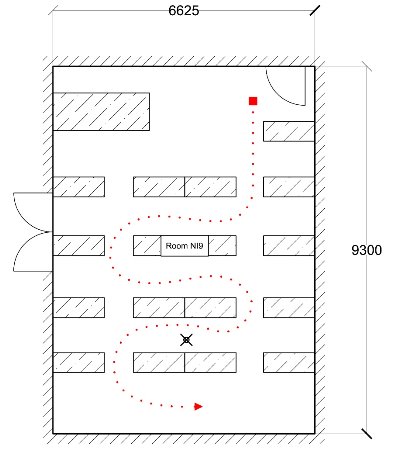
Cite This Work
To export a reference to this article please select a referencing stye below:
Related Services
View all


Related Content
All TagsContent relating to: "Construction"
Construction regards processes involved in delivering buildings, infrastructure and industrial facilities and associated activities including planning, designing, building, and fit out. Construction also covers repairs, maintenance, and demolition.
Related Articles

DMCA / Removal Request
If you are the original writer of this dissertation and no longer wish to have your work published on the UKDiss.com website then please: