The Effect of Layer Bonding on the Strength of 3D Printed Structures
Info: 12449 words (50 pages) Dissertation
Published: 27th Jan 2022
Tagged: ConstructionTechnology
Abstract
3D printing is fast developing into a technique used within the construction industry through methods such as 3D printing of concrete and thermoplastics. Fused Deposition Modelling (FDM) is a commonly used form 3D printing involving the layer-by-layer deposition of a melted filament. The effect of varying parameters of FDM is essential in allowing the technology to be further applied throughout the construction industry.
The effects of layer bonding in FDM structures is poorly understood and the effect that varying layer height and print speed has on layer bonding, and thus the strength of FDMs structures, is relatively unknown. This dissertation examines the effect that the key parameters of print speed and layer height have on the strength of FDM structures.
Other reasons for weaknesses in FDM structures have been examined but there is little research into the effect of layer bonding. The combined use of these two parameters to evaluate layer bonding strength has not been previously proposed and the effect of parameters on behaviour of FDM structures has been not sufficiently covered in previous literature.
The parameters of layer height and print speed were adjusted to determine the effect they had on the strength of FDM structures. A comparison between the two parameters enabled deductions to be made about the effect layer bonding was having on the strength of the specimens.
Specimens with varied layer heights between 0.05mm-0.30mm and prints speeds of 50mm/s-120mm/s printed on the Ultimaker 2+ 3D printer. Specimens of PLA were tested in compression and tension to determine their elastic yield strength, stiffness and ultimate strength.
Layer bonding appears to have a more significant impact of the strength of FDM structures. Increasing layer height results in decreased elastic yield strength in both compression and tensile loading. Increasing print speed results in decreased elastic yield strength and ultimate strength in both compression and tensile loading. The reduction in print time of FDM structures by altering the layer height and print speed parameters comes at the cost of strength of the structure.
Table of Contents
Click to expand Table of Contents
1. Introduction
1.1 History
1.2 Fused Deposition Modelling
1.3 Layer Bonding
1.4 Aims
2. Literature Review
2.1 3D Printed Structures
2.2 Anisotropy of 3D Printing
2.3 Build Parameters
2.3.1 Internal Structure
2.3.2 Layer Height
2.4 Effects on Strength
2.5 Testing
3. Methodology
3.1 Printer
3.2 Test Specimens
3.3 Test Setup
4. Preliminary Testing
4.1 Results
4.1.1 Compression – Layer Height
4.1.2 Compression – Print Speed
4.1.3 Tension – Layer Height
4.1.4 Tension – Print Speed
4.2 Focus moving forward/Discussion
5. Full Testing
5.1 Results
5.1.1 Compression – Layer Height
5.1.2 Compression – Print Speed
5.1.3 Tension- Layer Height
5.1.4 Tension – Print Speed
6. Discussion
6.1 Layer Height
6.2 Print Speed
7. Further Scope
8. Conclusion
9. References
List of figures
Figure 1 – FDM process (Ahn, et al., 2002)
Figure 2 – Ultimaker 2+ 3D printer (Ultimaker, 2017)
Figure 3 – Left to right: preliminary compression specimen, one side of a tensile specimen, full test compression specimen
Figure 4 – Left: Compression testing setup Right: Tensile testing setup
Figure 5 – 50mm/s specimens showing evidence of crushing in clamped region at ends of specimens
Figure 6 – Left: Cross-sections of 0.30mm specimens after loading Right: Cross-sections of 0.05mm specimens after loading
Figure 7 – From left to right: 0.05mm,0.15mm,0.30mm layer height specimens post testing
Figure 8 – Compression Load vs. Displacement plot for variable layer heights
Figure 9 – Specimens two and three of the 90mm/s specimens
Figure 10 – Compression Load vs. Displacement plot for variable print speeds
Figure 11 – 0.05mm specimen with bowing present in specimen
Figure 12 – Left to right: 0.05mm, 0.15mm, 0.30mm specimens after failure
Figure 13 – 0.30mm specimen after further loading to separate two end
Figure 14 – Tensile Load vs Displacement for variable layer heights
Figure 15 – Tensile Load vs. Displacement for variable print speeds
Figure 16 – ASTM D695 compression specimen shape
Figure 17 – 0.05mm specimen cross section deformed by cutting heat
Figure 18 – Row 1: 0.05mm & 0.10mm specimens post testing, Row 2: 0.15mm & 0.20mm specimens, Row 3: 0.25mm & 0.30mm specimens
Figure 19 – Compression Load vs. Displacement for variable layer heights
Figure 20 – Row 1: 50mm/s specimens, 70mm/s specimens, Row 2: 90mm/s specimens, 120mm/s specimens
Figure 21 – Compression Load vs. Displacement for variable print speeds
Figure 22 – Side view of 0.10mm specimen one showing bending present after testing
Figure 23 – 0.25mm specimens post failure with secondary failures circled
Figure 24 – Tensile Load vs. Displacement for variable layer heights
Figure 25 – Tensile Load vs. Displacement for variable print speeds
List of tables
Table 1 Control variables of testing specimens
1. Introduction
1.1 History
3D printing, which falls under the umbrella of Rapid Prototyping technologies, is an additive manufacturing technique that is a relatively recent invention when compared to other construction processes. The first form of 3D printing was patented in 1986 (3D Printing Industry 2016). There are various forms of 3D printing including Stereolithography, Selective Laser Sintering and Electron Beam Melting. For the purposes of this dissertation Fused Deposition Modelling (FDM) will be focused on. This technique has become one of the most popular methods of 3D printing and is the technique used in most commercially available printers.
3D printing was first used in manufacturing industries to reduce costs when producing small scale prototypes. It was a more cost-efficient method than creating injection moulds for a small number of conceptual units (Lim et al. 2012). However, it was still an expensive process which made it inaccessible to the majority of people and could only make small scale objects.
In recent years, 3D printing has been well on to the way to becoming a “mainstream” production method for large scale manufacturing in several industries such as aerospace and medical devices (D’Avanci 2015). This is due to the need to reduce product development time in order to remain competitive (Sood et al. 2010; Lim et al. 2012). It has also become increasingly accessible with the decreasing cost of desktop 3D printers. This has led to a shift from 3D printing being an expensive industry process to a household possibility. 3D printing is also developing into a process that can be used in the construction industry, with experiments taking place into 3D printing concrete on a large scale (Loughborough University 2014). Factors including the reduction in labour and time on site, production costs and an increasing demand for architectural freedom are pushing the construction industry towards automation (Lim et al. 2012). These reasons are generating a large degree of interest in construction scale 3D printing.
There are a large number of benefits to using 3D printing as opposed to conventional techniques. It is a fast technique – models can be built in hours; it allows for design flexibility – unique shapes can be formed without the need for any moulds; it allows for a high degree of control over part microstructure (Galeta et al. 2016).
1.2 Fused Deposition Modelling
FDM involves the generation of an object or structure in a layer by layer process from a Computer Aided Design (CAD) file in a single iteration. The CAD file is sliced into horizontal cross sections using computer software and is printed in layers. The raw material is fed into the printer and melted; it is then extruded through the print head and deposited onto the print bed. The material cools and solidifies and sticks to the surrounding material (Casavola et al. 2016). As the structure is made up of so many individual layers a significant portion of the strength is expected to come from the layer bonding.
1.3 Layer Bonding
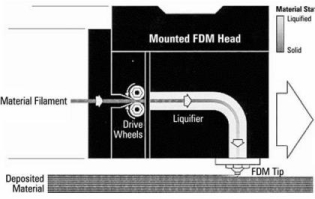
Figure 1 – FDM process (Ahn et al. 2002)
Layer bonding in FDM is the ability of the printed material to form a connection with the layers around it. As the printing of the object in FDM means that each printed strand of material will be at a different temperature when they first make contact, the ability of these different strands to bond is integral to the overall strength of the structure.
While the possibilities for FDM seem vast, there has been relatively little research into the effect that layer bonding has on the strength of these structures. It has traditionally been assumed that the layer bonding creates the biggest weaknesses in the structures.
1.4 Aims
The aim of this dissertation is to investigate the effect that layer bonding has on the strength of FDM structures and to provide guidance on the speed-strength relationship in FDM. This will be done by varying the layer heights and print speed parameters using the Ultimaker 2+ 3D printer (Ultimaker 2016) and Cura slicing software (Ultimaker 2016).
As speed of production is one of FDM’s main benefits these two variables are particularly relevant. These parameters will enable a speed to strength benefit analysis to be performed. They will also enable the different underlying effects that influence strength of FDM structures to be differentiated from the layer bonding strength. Varying the layer height will increase the number of layer bonds in the structure and varying print speed will show the effect that temperature difference between layers is having compared to layer bonding.
2. Literature Review
2.1 3D Printed Structures
Large scale 3D printed structures first appeared in 2014 when the Winsun Engineering Company printed 10 small houses in a day in China (3ders.org 2014). These structures were a composite of 3D printing as well as additions of extra layers of steel reinforcements between the layers and additional cladding used on the roofs. This lay the foundation for commercial construction from 3D printing.
From a homemade printing setup Rudenko (2016) was able to construct a 130m2 villa, including jacuzzi, entirely printed with concrete using steel reinforcing bars. This process has continued to develop with Winsun refining their designs further to create even larger and more refined structures (3ders.org 2016).
3D printing of structures has not been limited to concrete construction. Specially designed thermoplastics are being used to print a canal house in Amsterdam (DUS Architects 2016). Instead of printing the whole structure in a single iteration, smaller interconnecting pieces are printed which can be slotted together. These thermoplastic blocks make up the framework of the structure and concrete has been used in conjunction to aid the strength of the structure. 3D printing of thermoplastics to use as formwork for concrete can be much more effective than traditional methods when unique shapes are required for a low amount of use (Dakhli and Lafhaj 2016); these techniques being used together gain from the benefits of using higher strength concrete and having a more aesthetic finish of the 3D printed thermoplastic. DUS Architects have also printed small temporary cabins entirely out of a bio-based thermoplastic (Dezeen 2016). This project shows the potential to use 3D printing to provide fast temporary shelters which could be especially useful in disaster areas. This situation would only require the short-term use of the structures, eliminating any problems related to creep and durability of the thermoplastics, and the structural material could then be reused in other applications.
The issue with these forms of 3D printing is that they have been so far been completed on a trial and error basis. Due to the relatively recent birth of 3D printing structures, there have not been any standards developed which can be designed to. The concrete structures designed by Winsun are constructed to normal in-situ poured concrete standards (3ders.org 2016), leading to the possibility that they are possibly being over or under designed. This is an even larger problem for structures 3D printed out of thermoplastics as they are not commonly used in the construction industry to act as structural elements. Mechanical properties of these 3D printed structures are extremely important and so studying the influence of different parameters on this strength is essential in understanding how these structures behave (Sood et al. 2010).
2.2 Anisotropy of 3D Printing
Unlike with conventional production methods the strength of 3D printed objects depends on the orientation in which it was printed. Ahn et al.(2002) tested the tensile and compressive strength of 3D printed ABS while varying road width (each strand of deposited filament), raster orientation (direction of roadsof material relative to the loading of the part), air gap and model temperature. They discovered that raster orientation has the largest effect on tensile strength, suggesting that 3D printed materials act in an anisotropic manner. This was confirmed by Lee et al. (2007) during their comparison of compressive strength between different 3D printing techniques. However, there was a much more minimal effect on the compressive strength. This conclusion was confirmed by Casvola et al. (2016) who found the anisotropic nature to be true for PLA as well as ABS. Casavola et al. (2016) also showed that PLA exhibits less orthotropic behaviour than ABS due to the ability of PLA to form better bonds with itself than ABS.
2.3 Build Parameters
2.3.1 Internal Structure
There has been a large amount of investigation into the most optimised internal structure of 3D printed objects. 3D printed structures can have a bespoke design for both their internal and external geometries which can lead to a greatly reduced mass compared to other production methods.
One very efficient internal infill structure has been shown to be a honeycomb shape (Galeta et al. 2016). It is stronger and stiffer than the default rectilinear infill. This is largely due to the ability of a honeycomb structure to bear loads regardless of orientation (Farbman and McCoy 2016). This assists with the problems associated with the anisotropic behaviour of FDM structures and allows for a reduced mass when compared to rectilinear infill. This infill structure is a benefit as it allows for the same strengths to be supported with reduced mass. However, it has significantly longer printing times due to its more complex geometry and so a lattice structure is often a better compromise between speed and strength (Galeta et al. 2016).
Work has been done to help estimate the failure points in 3D printed structures and thus make the most cost efficient use of materials. The use of the finite element method (FEM) has been widely applied in structural weakness detection (Li et al. 2015). However, this process is a very time-consuming for large structures and has been shown to have inconsistencies when compared to experimental results (Farbman and McCoy 2016). This was thought to be caused by the anisotropic nature of the 3D printing process. The complexity of the FEM approach led Umentani and Schmidt (2013) to propose a cross-sectional structural analysis method which controlled print orientation to best optimise the strength of structures in a particular direction. This method also has flaws as it can only optimise structures in a certain direction and so is not applicable to more complex loading (Li et al. 2015). Li et al. (2015) then proposed a method of estimating density distribution and using a mathematical 3D implicit function to generate the internal structure to best optimise the strength and material usage of the structure.
In construction, elements are subjected to loads from multiple directions and so infill raster of 0 and 90 would be unsuitable for use in construction as they leave one plane of the structure much weaker than the other. It has been shown that an infill raster of +45/-45 provides an average strength in both X and Y planes (Casavola et al. 2016; Es-Said et al. 2000). For this reason, a raster angle of +45/-45 will be used within the testing specimens in this dissertation. Ideally, hexagonal infill would be used, however, this is beyond the capabilities of the Ultimaker 2+ printer.
2.3.2 Layer Height
The use of layer heights to optimise the elastic performance of an ABS object showed smaller layer heights gave higher flexural strength within the elastic region (Lee et al. 2005). However, this testing only investigated flexural strength through 20 of bending. The relationship in behaviour of the varied layer heights at ultimate limit states was not investigated. The effect of layer height on flexural strength of ABS, as well as the effect on tensile and impact strength, was examined alongside other variables by Sood et al. (2010). This experiment showed the tensile strength when varying layer height to decrease and then increase. The variation in layer height of these samples was 0.13mm, 0.17mm and 0.25mm and so this dissertation will expand the range of layer heights to confirm if this trend continues over a wider sample range. While this relationship was also noted as part of the experiments conducted Tymrak et al.(2014) in their examination of a desktop printer’s ability to produce commercial strength objects, it was using a set of three larger layer heights and the results were much less conclusive. This suggests that the behaviour across a large range of layer heights still needs to be further investigated and the causes more closely examined.
A trend of increasing tensile strength with decreasing layer height was found by Vaezi and Chia (2011) using the 3D printing technique, suggesting that this could possibly be a trend that occurs across different rapid prototyping technologies. However, this testing only examined two different layer heights and so a trend is very hard to conclusively identify.
An increase in layer height results in a decrease in surface roughness of FDM structures (Vaezi and Chua 2011; Anitha et al. 2001). This can become a significant issue if the FDM structure is being used without an external cladding on top of it. Anitha et al. (2001) also noted that print speed did not have a significant effect on the surface roughness.
During the Ahn et al. (2002) experiments, one of the parameters he investigated was road width. He used this parameter instead of layer height by hypothesising that varying road width would have the same effect as varying layer height. This assumption is not necessarily the case, especially when layer bonding is considered. Increasing road width will increase the surface area on which layer bonding can take place, while increasing layer height increases the volume of material used while not increasing the area for surface bonding. It is therefore expected that the results obtained for varying road width will not correlate with the results from varying layer height.
2.4 Effects on Strength
The formation of layer bonds is driven by the energy within the highly heated extruded filament. The size and amount the adjacent filament interact depends largely on the temperature and convective conditions present within the build chamber (Sun et al. 2008). A better connection of the layers can be made if the temperature of the adjacent roads is extremely high as the polymer strands within the filaments can interact more fluidly (Sun et al. 2008).
There are several issues that affect the strength of FDM printed objects including distortion, de-layering. Warp deformation affects 3D printed objects most greatly in the lower layers and the impact of it is minimised in objects with larger layer heights (Wang et al. 2007). The deformation occurs as a result of inner stresses, accumulated during the object’s cooling phase, being released. Attempts to reduce some of these issues, such as adding a layer of glue on the print bed to prevent warping, can lead to other problems such as generating residual stresses within the parts (Casavola et al. 2017). Alternating heating and cooling cycles which are caused by the roads cooling from their melting temperature to room temperature, while also being reheated as layers are deposited above them, can also generate residual stresses (Sood et al. 2010).
The effect of warping is less prevalent in PLA than in ABS, which was the material used by Casavola et al. (2017) and Wang et al. (2007), as it has a lower coefficient of thermal expansion. Reduction in distortion and the associated accumulated stresses are essential for good strength of FDM structures (Sood et al. 2010). Lee et al. (2007) showed there was a large difference in compressive strength between different 3D printing techniques. This will mean any deductions made during this dissertation will have difficulty being applied to other forms of 3D printing.
2.5 Testing
There are issues with conducting tensile tests on FDM objects using the traditional ‘dog-bone’ shaped specimens. It has been found that the ‘dog-bone’ shape causes large stress concentrations at the radiused corners, which results in premature failures of the test specimens (Ahn et al. 2002). This was an issue also experienced by Farbman & McCoy (2016). The contours in the ‘dog-bone’ shape also meant that there were areas where the roads were not acting solely in tension. This neglected the intent of the standard, which is to calculate pure tensile strength (Ahn et al. 2002). These problems were overcome in Ahn et al. (2002) experiments by using a rectangular test specimens in accordance with ASTM D3039 (ASTM 1997). This ensured that there were no locations of extra stress concentration in the specimens and they failed within the expected areas. Therefore, this dissertation will also use tensile test specimens in accordance with ASTM D3039.
There has been a tendency in studies to only focus on the ultimate load capacities of specimens in tensile or compressive loading (Ahn et al. 2002; Lee et al. 2007). This means these studies have not provided information about the behaviour of the test specimens during loading. Therefore, this dissertation will observe behaviour throughout the elastic and plastic loading regions as well as examining the maximum yield strength and ultimate strengths.
3. Methodology
3.1 Printer
The printer used to manufacture the testing specimens was the Ultimaker 2+. It allows printing of layer heights from 0.05mm up to 0.30mm and variable print speeds of 50mm/s up to 120mm/s. The test specimens were designed in AutoCAD 2016 and exported to Cura, version 2.3.1, where the variables were adjusted and the specimens were sliced automatically in preparation for printing.
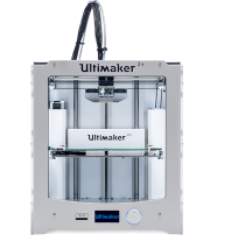
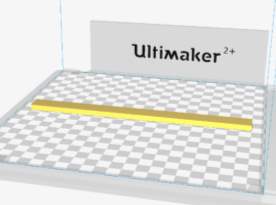
Figure 2 – Left: Ultimaker 2+ 3D printer(Ultimaker 2016), Right: Tensile sample in Cura
3.2 Test Specimens
The specimens used for testing are shown in Figure 3 below. The tensile testing was conducted on specimens 200mm long x 15mm wide x 5mm deep which is in line with dimensions required by ASTM D3039 (ASTM 1997). The compression specimens were 12.7mm diameter x 25.4mm deep. This is in accordance with ASTM D695 (ASTM 2011). The compression specimens used for the preliminary testing were made with a 12.7mm radius instead of diameter. Instead of discarding these specimens, it was decided to proceed with them for the preliminary testing. While making them unable to be compared to other specimens testing under ASTM D695, it was determined that, as they were all the same size, they would still show the variation in results required to inform the full testing. Their larger size will allow them to carry larger loads than the standard specimens, making variations between the independent variables more prominent. Additionally, these specimens could be compared to the standard test specimens to determine if a specimen’s size influences its strength.
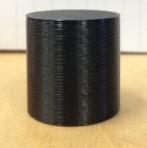
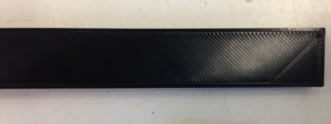
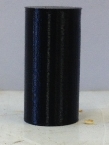
Figure 3 – Left to right: preliminary compression specimen, half of a tensile specimen, full test compression specimen
The control variables for the specimens that were maintained for the specimens is shown below in Table 1. The infill pattern used was linear and the layers were printed at +45/-45 raster orientation on alternating layers, which is the default setting for the Ultimaker 2+.
Table 1 Control variables of testing specimens
| Variable | Setting |
| Wall Thickness | 1.05 mm |
| Top/Bottom Thickness | 0.8 mm |
| Infill Density | 30% |
| Travel Speed | 120 m/s |
| Line Width | 0.35 mm |
| Nozzle size | 0.4mm |
3.3 Test Setup
The testing was conducted on a DARTEC 100kN universal testing machine. The configurations for the compression and tensile testing are shown in Figure 4.
For the compression tests, the specimens were placed in the centre of the base plate and the upper plate was lowered until it was imposing a small load onto the specimen. The test was started, at a rate of 1.5mm/s, and the load and displacement measurements were recorded at one second intervals. The testing was stopped when it was clear that the specimens had reached their maximum load or a significant displacement had occurred for any specimens that had not reached their ultimate strength.
For the tensile testing, 50mm at each end of the specimen was clamped in the jaws of the testing machine and the test was conducted at a rate of 1.5mm/s. The test was continued until the specimens failed.
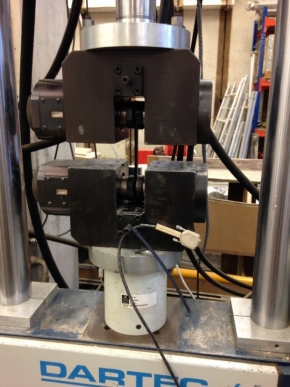
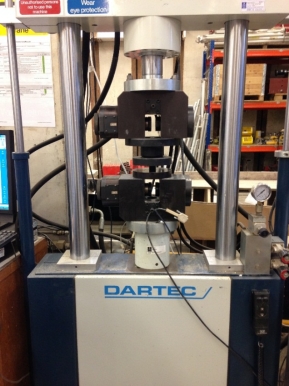
Figure 4 – Left: Compression testing setup Right: Tensile testing setup
4. Preliminary Testing
For the preliminary tests layer heights of 0.05mm, 0.15mm and 0.30mm and print speeds of 50mm/s, 90mm/s and 120mm/s were used. In the specimens where layer height was varied a print speed of 70mm/s was set and for specimens where print speed was varied a layer height of 0.20mm was set. These variables were chosen as they cover the whole range which the Ultimaker 2+ is capable of producing. This enables an initial outline of the expected results to be presented in order to inform the more in detail testing. Three specimens of each variable were tested.
During the tensile testing the first specimens with 50mm/s print speed failed prematurely within the clamping jaws, shown in Figure 5. This occurred due to the jaws crushing the specimens, from the pressure being used to hold them in place, making them weaker within the gripped areas. To prevent this from happening emery cloth was placed between the specimens and the jaws. The initial thickness of ………. Did not prevent the specimen being crushed and as a result one of the 90mm/s specimens failed prematurely, however, a thickness of ……….. provided sufficient compressive resistance to prevent the specimens being crushed as well as enough grip to prevent the specimens from slipping in the grips during testing. The only premature failure during the period in which the emery cloth was being used was with the first 0.05mm specimen.
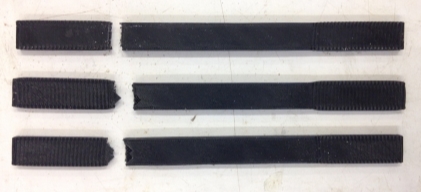
Figure 5 – 50mm/s specimens showing evidence of crushing in clamped region at ends of specimens
4.1 Results
4.1.1 Compression – Layer Height
The load-displacement graph for the test is shown in Figure 8 below. The elastic yield points for layer heights of 0.05mm and 0.15mm are very similar. The difference between the two is within a small enough range that it is not definitive. One of the 0.15mm specimens yielded elastically at 7.1kN which suggests it should be retested, however, it then sustained a higher peak load than the other two specimens. Alternatively, the 0.05mm specimens yielded elastically at almost identical values but all had a minor deviation at 6kN of force being applied. This deviation was not sufficient to suggest plastic deformation had begun but this needs further investigating.
The 0.30mm specimens provided a significantly lower elastic yield values, around 40% lower than the other two layer heights. Unlike the other layer heights, the 0.30mm specimens did not reach a maximum peak load before the testing was stopped at 9mm displacement. It is evident that there is an increase in gradient of load/displacement at 6.5mm displacement for these specimens suggesting that other effects were starting to take place at this point, 6.5mm being a significant level of displacement compared to the height of the specimens. It is suspected that during significant compression the layers would no longer be acting as they were at the start of the test but would begin to bond with the layers below and above them. This should not affect the specimens during elastic loading, but would potentially become an issue for all specimens.
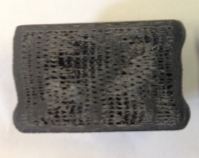
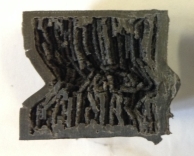
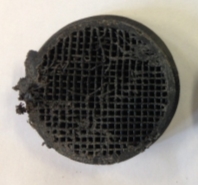
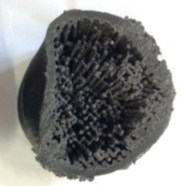
Figure 6 – Left: Cross-sections of 0.30mm specimens after loading Right: Cross-sections of 0.05mm specimens after loading
To assess the behaviour of the layers within the specimens after the compression test had taken place, a 0.30mm and 0.05mm specimen were cut open as shown in Figure 6. Due to the low melting temperature of PLA, the specimens deformed slightly from the heat generated by the hacksaw used cut them open. This means that not an ideal view of the internal geometry of the specimens can be seen, however, sandpaper was used to remove the worst of the deformation, leaving a representative example of the cross-sections for the specimens. The 0.30mm specimens has become much denser than its original shape. However, the roads are all intact resulting in an apparent increased infill percentage for the specimen.
As was shown by (Decuir, et al., 2016) increasing the infill percentage (density) will increase the strength of FDM printed specimens which would explain the continuously increasing ultimate strength of the 0.30mm specimens. In contrast, the infill of the 0.05mm specimen has largely collapsed, in part due to the buckling of the specimen, explaining the continuing deformation under reduced loading of the specimens. As the 0.15mm specimens showed behaviour in the plastic region to be between the 0.05mm and 0.30mm specimens it is hypothesised that this is an effect which becomes more prevalent with increased layer height. The increasingly ductile behaviour is also evident externally on the specimens as shown in Figure 7. Cracks begin to form between the layers in the 0.05mm specimens, whereas the 0.15mm and 0.30mm specimens appear to squash without cracks forming between the shell layers.
These results suggest that layer heights of 0.05mm and 0.15mm can take similar loadings in the elastic region but layer heights of 0.15mm can continue to take additional load past the initial plastic deformation while layer heights of 0.05mm do not act as perfectly plastic but reach an ultimate yield strength quickly before rapidly decreasing in strength. Layer heights of 0.30mm can only withstand a much lower load in the elastic region but withstand a much larger proportion of loading in the plastic region and do not reach their ultimate strength until a large amount of deformation has occurred.
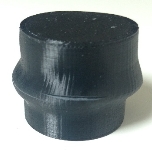
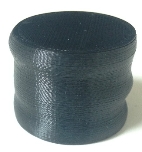
Figure 7 – Left to right: 0.05mm,0.15mm,0.30mm layer height specimens post testing
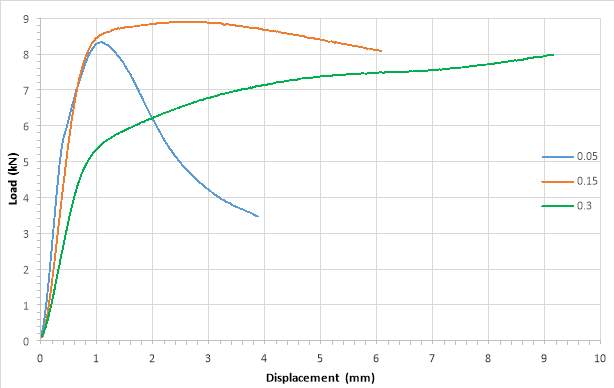
Figure 8 – Compression Load vs. Displacement plot for variable layer heights
4.1.2 Compression – Print Speed
The results from these specimens are more inconclusive due to the number of issues with the printing and testing of them. The first specimens tested from the 50mm/s group showed a section of much lower stiffness at the start of its loading which does not correspond with the other specimens. This suggest that there was incorrect loading occurring during the start of this test. The other two specimens acted very similarly with an elastic yield point around 7.5kN and peak load around 8.4kN.
All the specimens printed at 90mm/s exhibited inconsistencies in their results. The first specimen acts as expected initially, however, it has an elongated and inconsistent transition between elastic and plastic behaviour. Specimen two acts as expected in the transition, however, has an initial region of low stiffness at the start of loading. This is the same for specimen three which has an even longer period of low stiffness at the start of loading. These issues could be explained by the print inconsistencies with these two specimens. Both contained large globules of foreign material in them as shown in Figure 9. It seems these globules were of a lower stiffness than the rest of the specimens and compressed before the PLA began to compress which would explain the lower stiffness in the elastic region as shown in Figure 10. All the specimens did reach similar peak loads around 8.1kN. Retesting of these specimens is needed to provide reliability to these results due to their unexpected performances.
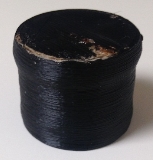
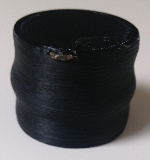
Figure 9 – Specimens two and three of the 90mm/s specimens
The first 120mm/s specimen exhibited a low initial stiffness before performing almost identically to the other two specimens. They have a slightly lower stiffness than the 50mm/s specimens and reach their elastic yield point at around 7.3kN, less than the 50mm/s specimens. The 50mm/s specimens are also able to take a higher peak load.
In both the compression tests for layer height and print speed, there is an initial period of lower stiffness at the start of the test for all the specimens. It is hypothesised that this occurs due to the structure of the specimens. There is a very brief period when the load from the testing machine has not yet been properly distributed across the whole cross section of the specimen. It is unlikely to be a result of printing errors in the specimens as it is present in every specimen printed.
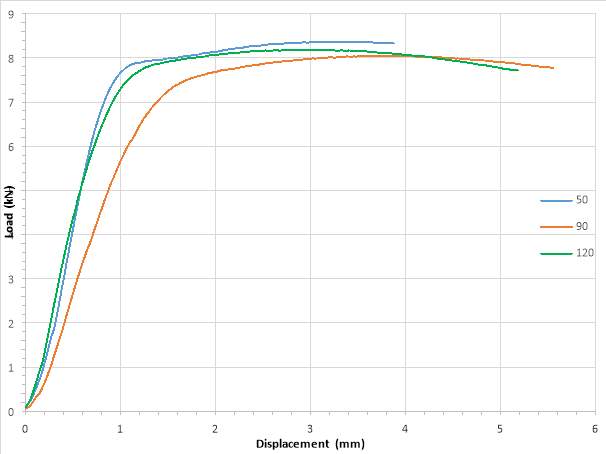
Figure 10 – Compression Load vs. Displacement plot for variable print speeds
4.1.3 Tension – Layer Height
The specimens which failed prematurely (by failing in the gripped area) during the tension tests have been excluded from the results as they are not representative of the correct specimen dimensions. However, it should be noted that there was only a minor variation in the behaviour of the 0.05mm specimen that failed prematurely compared to the other two 0.05mm specimens. This resulted in an increased peak load of 0.02kN.
The difference in behaviour of the two successful 0.05mm specimens is unnoticeable apart from the second specimen deforming 0.1mm further than the third specimen before failing. They both had a peak load of 1.74kN and reached their elastic yield points at 1.71kN. However, both specimens had slight curves in their shape along their longitudinal axis as shown Figure 11. This meant that the specimens were not performing to their full tensile capacity. As a result, retests should be expected to show 0.05mm specimens with a higher strength than currently shown in Figure 14.
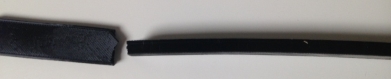
Figure 11 – 0.05mm specimen with bowing present in specimen
All three 0.15mm specimens behaved as expected and reached peak loads between 1.71kN and 1.72kN and yielded elastically at 1.68kN.
The 0.30mm specimens behaved very differently to the other layer heights. Each specimen had the same stiffness through the elastic region, however, the elastic yield points were spread over the range of 1.32kN to 1.42kN and had peak loads between 1.38kN to 1.47kN. The 0.05mm and 0.15mm specimens failed suddenly with clean breaks across the shell and infill. However, the 0.30mm specimens’ shells broke cleanly but not all the infill failed as shown in Figure 12 & 13, leaving the bottom and top sections of the specimen connected. This is shown by slower failure of the specimens in Figure 14.
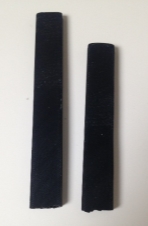
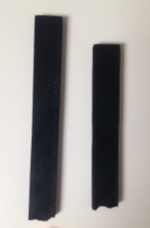
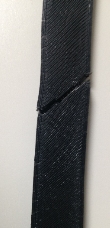
Figure 12 – Left to right: 0.05mm, 0.15mm, 0.30mm specimens after failure
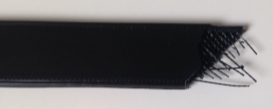
Figure 13 – 0.30mm specimen after further loading to separate two end
These results correlate with the results of the compression tests varying layer height. It suggests that layer heights of 0.05mm and 0.15mm have similar elastic yield points and peak loads, however, layer heights of 0.30mm have lower stiffness, elastic yield points and peak loads. A possible explanation for the poorer performance of the 0.30mm specimens is in their print quality. The second and third specimens were bowed meaning that during testing there would have been some bending moments acting on them as well as the axial loading, helping to lead to a lower failure load.
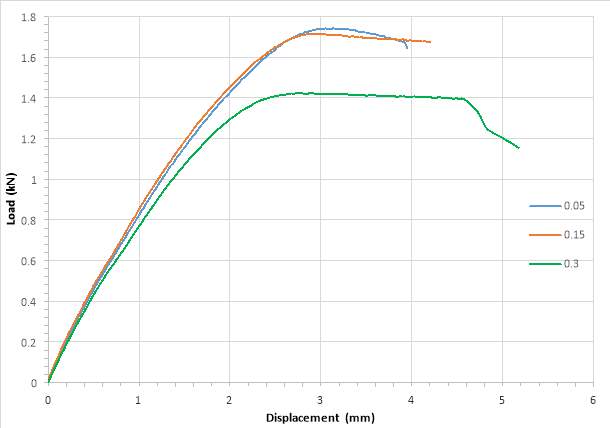
Figure 14 – Tensile Load vs Displacement for variable layer heights
4.1.4 Tension – Print Speed
None of the 50mm/s specimens can be considered as they all failed within the gripped area in the testing machine. This was also the case with the first of the 90mm/s specimens which has been excluded from the results. This means making deductions from the results of varying the print speed is much more difficult from the preliminary testing.
The comparison of the 90mm/s and 120mm/s specimens does show that they have almost identical stiffness while they are acting within the elastic region but the 120mm/s specimens have a lower elastic yield point of 1.40kN as opposed to 1.46kN for the 90mm/s specimens. The peak load of the 90mm/s specimens was also greater at 1.54kN compared to peak loading for the 120mm/s specimens of 1.48kN. More of these specimens will need to be tested to ensure accurate deductions can be made about varying print speed.
Even though the 50mm/s specimens cannot be directly compared to the 90 and 120mm/s specimens, they have been plotted on Figure 15. As expected they have a different stiffness to the other specimens, however, the peak loading is very similar. This suggests that the layer height of the specimens is the significant factor in determining the tensile strength of the specimens.
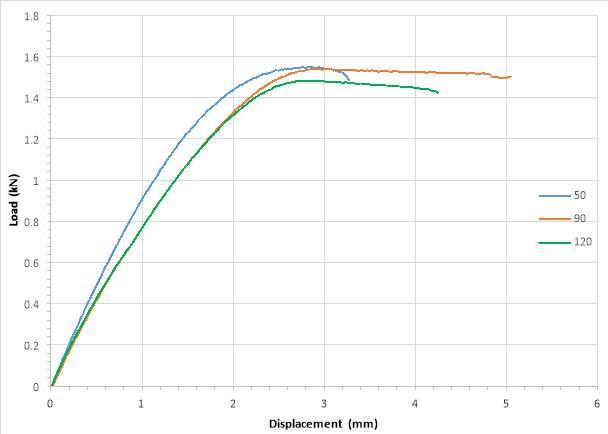
Figure 15 – Tensile Load vs. Displacement for variable print speeds
4.2 Focus moving forward/Discussion
From the preliminary testing, altering the layer height of the specimens has a much greater effect on both the compressive and tensile strength than altering the print speed. There is largest variation within the layer height compressive specimens, with different behaviour occurring within the plastic regions. To further investigate this varying behaviour additional layer heights shall be tested.
There is a much smaller discrepancy in the specimens with varying print speeds. From these preliminary results, there is no obvious current trend in print speed variations. The further testing should be able to confirm if this is the case.
5. Full Testing
For the full testing, layer heights of 0.10mm, 0.20mm, and 0.25mm were added to the current heights to investigate if the trend of increasing layer height and decreasing elastic limit continued to develop. In order to comply with ASTM D695, all the compression specimens were retested with a specimen size of 12.7mm diameter and 25.4mm height as shown in Figure 16. Five specimens for each change in variable were tested to ensure reliability of the results. By utilising the specimen layer height of 0.20mm, the layer height specimens could also be used to add 70mm/s as a variable for the print speed data.
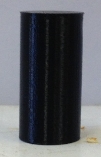
Figure 16 – ASTM D695 compression specimen shape
For the tensile specimens, layer heights of 0.10mm, 0.20mm, and 0.25mm were added and specimens were reprinted for all the anomalous specimen results. The 0.20mm specimen was also used to test 70mm/s print speed.
5.1 Results
5.1.1 Compression – Layer Height
Upon testing the variable layer heights in compression, the trend of behaviour became much more apparent. It is clear from these tests that increasing the layer height will reduce the stiffness and elastic capacity, as shown in Figure 19.
The 0.05mm specimens all withstood a significantly higher load than the 0.15mm specimens compared to the preliminary testing where both sets of specimens experienced similar maximum compressive loads. In the preliminary testing, the 0.05mm specimens experienced a reduction in stiffness at around 5.8kN. It is now presumed that this is when the cracks between the layers, shown in Figure 7, started to form; accompanied with the failure of the infill, this failure of the layer bonding caused a reduced compressive strength. This implies that the 0.05mm specimens from the preliminary testing were not behaving elastically for as long as assumed. The 0.05mm specimens from the full testing did not exhibit any signs of cracks forming, as shown in Figure 18, and exhibited a compressive elastic yield load 14% higher than the 0.15mm specimen.
The 0.05mm specimens all had a maximum elastic capacity between 3.8kN to 4.0kN. However, within the plastic deformation zone there was a larger variation in results with stiffness of the specimens varying over the same displacements. This is less significant for the 0.05mm specimens as their ultimate strengths occur before the specimens begin acting perfectly plastically. The larger range within the plastic zone is likely due to the differing places where the specimens buckled, causing them to behave differently. In four of the specimens there was evidence of an increased load being carried after about 5mm displacement.
It is presumed that this is due to the layers squashing and increasing in density, allowing them to carry more load. This was unexpected in the 0.05mm specimens due to their more brittle failure in the larger sized specimens from the preliminary testing. An attempt was made to view the internal structure of the specimens but all the specimens that were cut open were too deformed by the heat generated in the hacksaw during the cutting process, as shown in Figure 17. The smaller cross sections of these specimens left less area undamaged during the cutting and, even after cleaning, it was not possible to see what had happened to the layers and infill of the specimens.
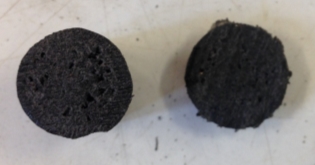
Figure 17 – 0.05mm specimen cross section deformed by cutting heat
The 0.10mm specimens were, on average, able to carry 0.4kN less in maximum compressive force than the 0.05mm specimens. However, they were only able to carry 0.1kN more than the 0.15mm specimens. This was not in line with the rest of the layer heights which averaged a difference of 0.3-0.4kN. The 0.10mm specimens experienced maximum compressive forces within 0.1kN of each other and all behaved as expected apart from the third specimen which showed an anomalous spike within the plastic region. Due to the immediate nature of the spike and then the quick return to expected results this anomaly was registered as a data logger error and the readings for the third specimen were excluded from the results. As with the 0.05mm specimens, the results as the displacement continued into the plastic region became more spread. Again, this is likely caused by the different buckling of each specimen.
The 0.15mm specimens behaved almost identically to how they behaved in the preliminary testing. Their yield strengths were marginally exceeded by their ultimate strengths. However, this was not the case for all the specimens, with specimens two and five experiencing their ultimate strength at their yield points. A layer height of 0.15mm should be considered as the layer height where the specimens begin to behave perfectly plastically within the plastic region.
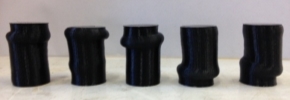
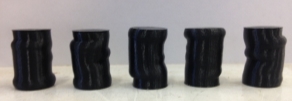
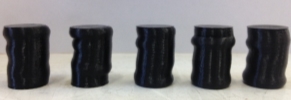
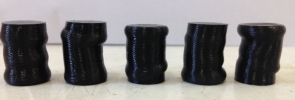
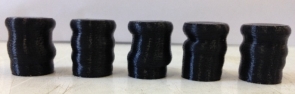
Figure 18 – Row 1: 0.05mm & 0.10mm specimens post testing, Row 2: 0.15mm & 0.20mm specimens, Row 3: 0.25mm & 0.30mm specimens
At 0.20mm layer height all specimens experienced an ultimate strength higher than their yield strength, which occurred around 2.7mm displacement. The average elastic yield strength was 0.3kN lower than the 0.15mm layer height average and 0.35kN higher than the 0.25mm average, which was 0.4kN higher than the 0.30mm average. This suggests a non-linear relationship between the reduction in maximum elastic strength and an increasing layer height. The 0.20mm specimens began to show a slight increase in stiffness again, having dropped down after reaching their ultimate strengths, at 5mm displacement.
This effect is due to the increased density of the specimens as they compressed and the effect is exacerbated in the 0.25mm and 0.30mm layer height specimens. Indeed, the 0.25mm and 0.30mm specimens did not reach their ultimate strengths before testing was stopped. Both of these sets of specimens maintained much more consistency throughout the tests, with deviations between the individual specimens only appearing to differ after 5mm displacement. This enhances the theory that specimens with increased layer heights are more capable at supported loads while acting plastically. They also continue the trend of increased layer height resulting in lower elastic yield strengths and higher ultimate strengths.
It is important to note though, that even after almost 9mm displacement and a 45% increase in strength from the elastic yield strength the 0.30mm specimens still had not reached the elastic yield strength of the 0.10mm specimens; as well as being over 0.5kN below the elastic yield strength of the 0.05mm specimens.
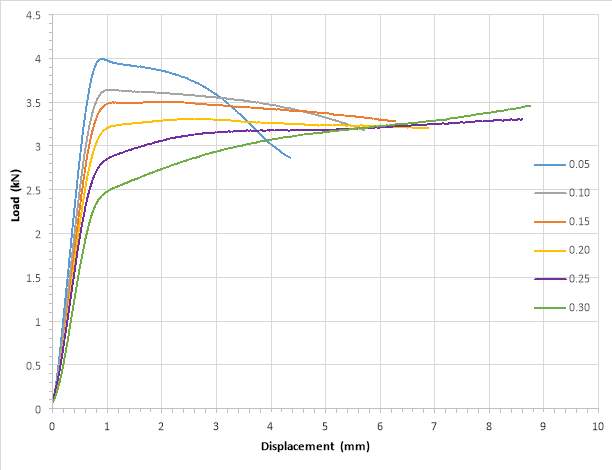
Figure 19 – Compression Load vs. Displacement for variable layer heights
An interesting observation is that the specimens tended to fail near the top or bottom of the specimen. Few specimens experienced deformations in their centres, as shown in Figure 18. This could indicate possible issues with the printing of the specimens where weaknesses were introduced at certain points by the printer. The same STL file was used for the shape of the specimens so inconsistency would be the same throughout all the specimens and should not affect the behaviour of layer heights in relation to each other. However, this issue is less prevalent in the specimens as the layer heights increase and helps to explain the more consistent results of these specimens during plastic behaviour.
5.1.2 Compression – Print Speed
The variation in results from these specimens, shown in Figure 21, was much smaller than for the layer height specimens. Changing the print speed did not show any change in stiffness of the specimens through the elastic region.
The 50mm/s specimens performed consistently and as expected. All the specimens had an ultimate strength greater than yield strength. This is in line with the performance expected from a specimen with a layer height of 0.20mm from the previous section. After the ultimate strength peak the specimens became more inconsistent in their performance. As stated above, this is due to the difference in the deformed shapes of the specimens behaving in different ways.
The 90mm/s specimens had indistinguishable elastic limits and yield points within 0.1kN of each other. However, there was a larger variation within the plastic region. Specimens two and three experienced their ultimate strength at their yield points, whereas the other specimens experienced ultimate strengths after 2.5-3mm displacement. As can be seen in Figure 20, specimens two and three experienced much more deformation at the end of the specimens compared to the other specimens which could explain their slightly different behaviour in the plastic region.
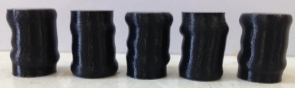
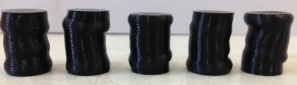
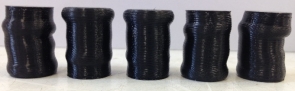
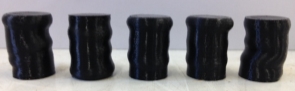
Figure 20 – Row 1: 50mm/s specimens, 70mm/s specimens, Row 2: 90mm/s specimens, 120mm/s specimens
The 120mm/s specimens experienced a marginally lower elastic yield strength than the other specimens. The range between the five specimens was 0.1kN at the elastic limit and all specimens experienced ultimate strengths within the plastic region. The one anomaly was the fifth specimen which had a large strength drop off after its ultimate strength was reached. This was in contrast to the other specimens whose strength only slightly decreased after reaching ultimate strengths.
The 50mm/s specimens had an elastic limit 0.1kN greater than the 70mm/s specimens which were the closest other variable. However, the variation between the 50mm/s specimens’ elastic limits was 0.15kN. Furthermore, the strongest 70mm/s specimen had an elastic limit 0.05kN higher than the average 50mm/s elastic limit. This was also the case with the strongest 120mm/s specimen. Figure 21 initially appears to show a trend that increasing print speed slightly reduces the elastic yield strength and ultimate strength of the specimens. While this is the case, the small differences between the results suggests that there is a minimal effect on the layer bonding and thus compressive strength of the specimens by varying print speed, especially when compared to the effect that the layer height has on the compressive strength.
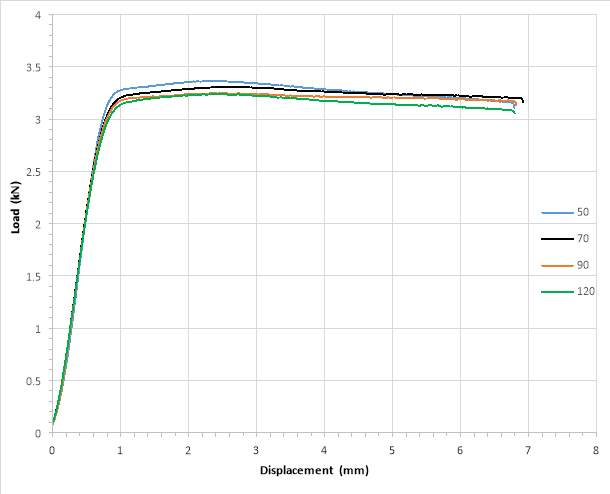
Figure 21 – Compression Load vs. Displacement for variable print speeds
5.1.3 Tension - Layer Height
The 0.05mm specimens were thought to have performed well after the preliminary testing. However, due to the results of the compression testing showing the 0.05mm layer heights having more strength than the 0.15mm specimens it was decided to retest the 0.05mm layer heights to see if this was also the case for the tensile strength. As shown in Figure 24, this the strength of the retested 0.05mm specimens was higher than in the preliminary testing. As the 0.05mm specimens were the first tested, it is assumed that their previous poorer performance was due to the test procedure having not been perfected. The stiffness of the retested specimens was higher than during the preliminary testing and the ultimate tensile strength rose from 1.74kN to 1.83kN.
The 0.10mm specimens had the second lowest stiffness of all the tested variables during elastic loading, only above the 0.30mm specimens. The first specimen experienced bending during testing, shown in Figure 22, which resulted in a lower maximum tensile strength than the other two specimens and thus was excluded from the results. The other two specimens performed identically reaching maximum tensile strengths of 1.78kN. The 0.10mm specimens displaced 0.2mm more than the 0.05mm specimens before reaching ultimate tensile strength.
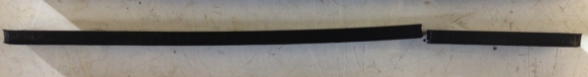
Figure 22 – Side view of 0.10mm specimen one showing bending present after testing
The ultimate tensile strength of the 0.15mm specimens was only marginally higher than the ultimate tensile strength of the 0.20mm specimens. This did not conform to the trend of the 0.05-0.15mm specimens which reduced in strength as the layer height increased. The 0.20mm specimens performed identically throughout the elastic region and had small deviations in ultimate tensile strength of 0.04kN. This meant the strongest 0.20mm specimen carried a higher ultimate tensile load than the average for the 0.15mm specimens.
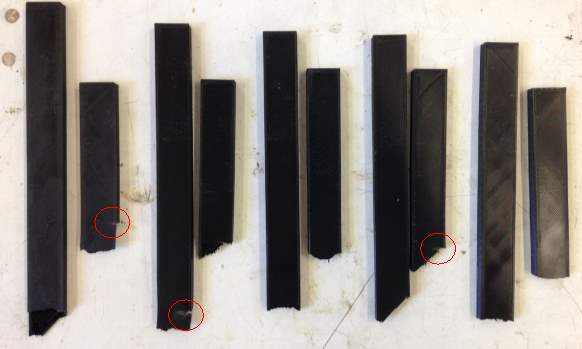
Figure 23 – 0.25mm specimens post failure with secondary failures circled
The 0.25mm specimens reversed the previously expected trend and withstood the highest ultimate tensile strength of all the variables. These specimens had stiffness than all but the 0.05mm specimens and averaged a maximum tensile strength 0.03kN greater than the 0.05mm specimens. There was some inconsistency with the failure modes of these specimen, as was previously experienced with the 0.30mm specimens in the preliminary testing. Specimens one, two and four suffered prolonged failures instead of sudden breaks. This was due to the specimens not failing across one plane but having secondary failures occur near to the eventual failure locations, as shown in Figure 23. This meant there was a 1mm variation between the displacements of the specimen at failure.
To ensure that the results of the 0.30mm specimens tested in the preliminary testing were reliable another 0.30mm tensile specimen was tested. This specimen had an ultimate tensile strength 0.04kN above the previous average which was considered to be within the allowable range. It also experienced a slow failure with the layers in the shell separating and some of the infill not failing across the main failure plane.
The results from the tensile testing of the layer height specimens, shown in Figure 22, do not appear to show an overall trend in behaviour. The trend of decreasing tensile strength with increasing layer height is not followed by the 0.20mm and 0.25mm specimens
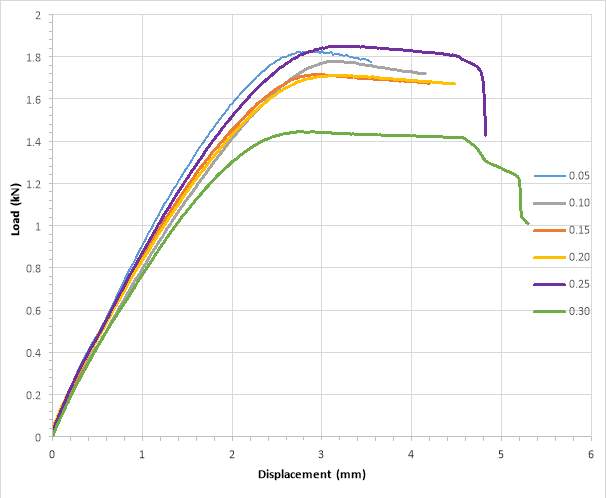
Figure 24 – Tensile Load vs. Displacement for variable layer heights
5.1.4 Tension – Print Speed
The 50mm/s specimens that failed within the clamping jaws were retested with the emery cloth in place. This resulted in their stiffness matching the 90mm/s and 120mm/s specimens within the plastic region. The specimens behaved identically and failed in the same locations with maximum tensile strengths 0.5kN higher than the 90mm/s specimens.
One 90mm/s and one 120mm/s specimen were tested due to the anomalous results obtained from the preliminary testing. Both these specimens performed along the lines of the data used in the preliminary tests and therefore validated the results.
Along with being out of line with the layer height results, the 70mm/s specimens do not match up with the other print speed specimens. As shown in Figure 25, the 70mm/s specimens had an increased stiffness and much higher maximum tensile strength than the other specimens. Due to the stark contrast of the 70mm/s results to the other variables, it would be suitable to ignore these results and make conclusions off the 50mm/s, 90mm/s and 120mm/s specimens. They show a trend of increasing print speed resulting in a reduced maximum tensile strength.
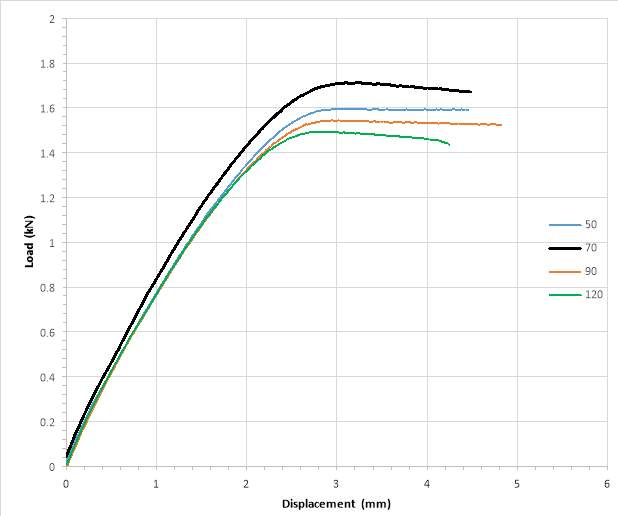
Figure 25 – Tensile Load vs. Displacement for variable print speeds
6. Discussion
6.1 Layer Height
From the experiments conducted, it is clear that increasing the layer height of FDM printed objects reduces their elastic yield strength. As the layers are deposited they begin to cool from the material’s melting point. The deposition of the layer above will then cause this layer to heat up slightly again before cooling resumes. Smaller layer heights mean that more layers are required. This results in more heating and cooling cycles within the structure and each layer will cool down at a different rate. Each cycle results in an increase in the residual stress accumulation. This would lead to the less ductile behaviour of the smaller layer height specimens and is exemplified by the failure of the infill in the preliminary 0.05mm specimens compared to the preliminary 0.30mm specimens in Figure 6.
When more layers are present, there is an increased temperature gradient towards the bottom of the specimens. This will increase the diffusion between the adjacent layers which will increase the strength of the specimens.
The interlayer bonding has been previously thought to be the weakest point in 3D printed objects. This testing has shown that specimens with more layers and, thus, more interlayer bonds are in fact stronger than specimens with fewer interlayer bonds. This is the case for all compression tests but is not conformed with by the 0.20mm and 0.25mm specimens from the tensile testing. These two sets of specimens were tested on a different day to other the variables and the environmental conditions were not controlled. Conditions were not considered to be vastly different on the days of testing, however, it is possible that the difference in temperature between tests could have made an impact. It is unlikely that these layer heights were behaving differently due to a change in effect of the above-mentioned factors due to the performance of the 0.30mm layer height specimens. These specimens were printed and tested on several different days and still conformed to the trend of decreasing in strength with increased layer height. It is assumed that the printing and testing of the 0.20mm and 0.25mm layer heights introduced inconsistencies which resulted in their higher strengths.
The tensile specimens for the 0.25mm and 0.30mm layer heights failed slowly due to their infill layers not failing at the same point as the specimens’ shell did. This suggests that the ultimate strength of these samples was being dictated by the strength of the shells. This is due to the shells being printed in long lines that stretch the whole length of the specimen while the infill rasters are much shorter due to their angles meaning they only span between the shells at 45.
Comparison of the preliminary compression specimens and full testing specimens suggest a non-linear relationship between the strength of the 0.30mm specimens and the 0.15mm specimens. The 0.15mm specimens were able to take a higher proportion of the compressive load of the 0.30mm specimens at the elastic limit point in the preliminary testing. This trend could become an important issue if it continues into larger samples, making large samples with larger layer heights much less viable when they are required to carry compressive loads.
6.2 Print Speed
With the Ultimaker 2+ the speed at which the specimens were produced was more greatly affected by adjusting the layer heights than by adjusting the print speed variable. The results of the print speed testing had a very small impact on the results in the compression testing. As a percentage of the overall strength, there was a larger effect within the tensile tests, however, there was still a much smaller variation than were seen in the layer height experiments. The whole range from 50mm/s to 120mm/s was only 3.7% of the highest load in the compression tests, whereas the range across the tensile loading was 6.3% of the highest load.
It was expected that increasing the print speed would increase the strength of the specimens as there would be a lesser difference in temperature of each layer as they were deposited. In fact, the opposite was the case; print speed increased and ultimate strength and elastic yield strength decreased in both the compression and tensile tests. A possible explanation for this is that the higher print speeds meant that layers in the specimens had not hardened and bonded with the layers below them as well as when lower print speeds were used. The subsequent addition of more layers could cause deformation of the lower layers due to the additional loads being applied before enough hardening had taken place to give them sufficient strength to resist the loads.
The higher stiffness of the 70mm/s specimens in Figure 25 compared to the three sets of other samples suggests that there were errors present in the printing or testing of the specimens. This lends weight to the theory that the 0.20mm and 0.25mm specimens from the layer height testing were not representative of the tensile behaviour of those layer heights in Figure 24.
7. Further Scope
The behaviour of the 0.20mm and 0.25mm tensile specimens need to be further investigated to confirm if they are behaviour anonymously as predicted or not. If they continue the same behaviour then further investigation is needed to explain the sudden spike in strength between 0.15mm and 0.30mm layer heights.
Due to the findings of a non-linear relationship between the preliminary compression specimen strengths and the full testing compression specimen strengths, an investigation should continue into the effect that size of shell relative to infill area has on the strength of FDM structures. For taller structures, the effect of temperature variation across the layers should also be further investigated to the effects that residual stress from heating and cooling cycles has.
The tests should also be confirmed across other types of printers to see if the same results hold for models other than the Ultimaker 2+. As many different types of printer are available, this could have a large effect on the relevance of this dissertations findings.
The effect of shell width on the strength of the specimens should be investigated. This is due to the evidence of shell failure occurring before infill failure in the large layer height samples during tensile testing.
8. Conclusion
The variation of layer height and print speed have been tested and the effect on the compressive and tensile strength of FDM specimens has been assessed. It has been shown that increasing layer height causes a reduction in compressive elastic yield limit and ultimate tensile strength. However, it also results in a higher proportion of load being carried within the plastic behaviour region. After a large amount of displacement, greater layer heights are able to carry larger compressive loads than smaller layer heights. This is due to the increased ductility observed with larger layer heights.
It has also been shown that increasing print speed will decrease both the compressive and tensile strength of the specimens. However, the effect of print speed is much smaller than the effect of layer height. This shows that the temperature difference between layers and the severity of the heating and cooling cycles has a small effect on the strength of FDM printed structures. However, it is also evident that interlayer bonds form a significant part of the strength in these structures. It has been shown that structures with more layer bonding have higher strengths than structures with fewer layer bonds.
This testing has also shown that FDM, using PLA, results in structures with much higher compressive strength than tensile strength. Therefore, when FDM is being used to build much larger structures reinforcement should be placed in areas where the structure is going to undergo tensile loading.
When considering construction of structures using FDM, a balance must be maintained between the speed of construction and the strength of the structure. Increasing the speed by increasing the layer height or the print speed will result in a structure with a much lower strength then if smaller layer heights and slower print speeds were used. As print speed has less of an effect on the strength of the structure, it would be ideal to increase this parameter before increasing layer height to speed up build time.
9. References
3D Printing Industry, 2016. History of 3D Printing [Online]. Available from: https://3dprintingindustry.com/3d-printing-basics-free-beginners-guide/history/ [Accessed 12 October 2016].
3ders.org, 2014. 10 completely 3D printed houses appears in Shanghai, built under a day [Online]. Available from: http://www.3ders.org/articles/20140401-10-completely-3d-printed-houses-appears-in-shanghai-built-in-a-day.html [Accessed 28 October 2016].
3ders.org, 2016. WinSun 3D prints two gorgeous concrete Chinese courtyards inspired by the ancient Suzhou gardens [Online]. Available from: http://www.3ders.org/articles/20160331-winsun-3d-prints-two-gorgeous-concrete-chinese-courtyards-inspired-by-the-ancient-suzhou-gardens.html [Accessed 6 December 2016].
Ahn, S., Montero, M., Odell, D., Roundy, S., and Wright, P.K., 2002. Anisotropic material properties of fused deposition modeling ABS. Rapid Prototyping Journal, 8(4), pp.248–257.
Anitha, R., Arunachalam, S., and Radhakrishnan, P., 2001. Critical parameters infuencing the quality of prototypes in fused deposition modelling. Journal of Materials Processing Tech., 118, pp.2–5.
ASTM, 1997. Standard Test Method for Tensile Properties of Polymer Matrix Composite Materials. Standard Test Method for Tensile Properties of Polymer Matrix Composite Materials, 3.
ASTM, 2011. Standard Test Method for Compressive Properties of Rigid Plastics 1. Annual Book of ASTM Standards, 8(April 2003), pp.1–7.
Casavola, C., Cazzato, A., Moramarco, V., and Pappalettera, G., 2017. Residual stress measurement in Fused Deposition Modelling parts. Polymer Testing, 58, pp.249–255.
Casavola, C., Cazzato, A., Moramarco, V., and Pappalettere, C., 2016. Orthotropic mechanical properties of fused deposition modelling parts described by classical laminate theory. Materials and Design, 90, pp.453–458.
D’Avanci, R., 2015. The 3-D Printing Revolution. Harvard Business Review, (May 2015), pp.40–48.
Dakhli, Z. and Lafhaj, Z., 2016. Experimental and numerical prototyping of a complex cement column formwork for construction. Architectural Engineering and Design Management, 13(2), pp.1–19.
Dezeen, 2016. 3D-printed micro home in Amsterdam [Online]. Available from: https://www.dezeen.com/2016/08/30/dus-architects-3d-printed-micro-home-amsterdam-cabin-bathtub/ [Accessed 2 March 2017].
DUS Architects, 2016. 3D Print Canal House [Online]. Available from: http://3dprintcanalhouse.com/about-the-3d-print-canal-house [Accessed 2 March 2017].
Es-Said, O.S., Foyos, J., Noorani, R., Mendelson, M., Marloth, R., and Pregger, B.A., 2000. Effect of Layer Orientation on Mechanical Properties of Rapid Prototyped Samples. Materials and Manufacturing Processes, 15(1), pp.107–122.
Farbman, D. and McCoy, C., 2016. Materials Testing of 3D Printed ABS and PLA Samples to Guide Mechanical Design. ASME 2016 11th International Manufacturing Science and Engineering Conference, Vol 2, pp.1–12.
Galeta, T., Raos, P., Stojšić, J., and Pakši, I., 2016. Influence of structure on mechanical properties of 3D printed objects. Procedia Engineering, 149(June), pp.100–104.
Lee, B.H., Abdullah, J., and Khan, Z.A., 2005. Optimization of rapid prototyping parameters for production of flexible ABS object. Journal of Materials Processing Technology, 169(1), pp.54–61.
Lee, C.S., Kim, S.G., Kim, H.J., and Ahn, S.H., 2007. Measurement of anisotropic compressive strength of rapid prototyping parts. Journal of Materials Processing Technology, 187–188, pp.627–630.
Li, D., Dai, N., Jiang, X., and Chen, X., 2015. Interior structural optimization based on the density-variable shape modeling of 3D printed objects. The International Journal of Advanced Manufacturing Technology, pp.1627–1635.
Lim, S., Buswell, R.A., Le, T.T., Austin, S.A., Gibb, A.G.F., and Thorpe, T., 2012. Developments in construction-scale additive manufacturing processes. Automation in Construction, 21(1), pp.262–268.
Loughborough University, 2014. 3D concrete printing | Working with business | [Online]. Available from: http://www.lboro.ac.uk/enterprise/case-studies/3d-concrete-printing/ [Accessed 23 November 2016].
Rudenko, A., 2016. 3D Concrete House Printer [Online]. Available from: http://www.totalkustom.com/ [Accessed 17 October 2016].
Sood, A.K., Ohdar, R.K., and Mahapatra, S.S., 2010. Parametric appraisal of mechanical property of fused deposition modelling processed parts. Materials and Design, 31(1), pp.287–295.
Sun, Q., Rizvi, G.M., Bellehumeur, C.T., and Gu, P., 2008. Effect of processing conditions on the bonding quality of FDM polymer filaments. Rapid Prototyping Journal, 14(2), pp.72–80.
Tymrak, B.M., Kreiger, M., and Pearce, J.M., 2014. Mechanical properties of components fabricated with open-source 3-D printers under realistic environmental conditions. Materials and Design, 58, pp.242–246.
Ultimaker, 2016a. Cura 3D Printing Slicing Software [Online]. Available from: https://ultimaker.com/en/products/cura-software [Accessed 15 November 2016].
Ultimaker, 2016b. Ultimaker 2+ 3D Printer [Online]. Available from: https://ultimaker.com/en/products/ultimaker-2-plus [Accessed 8 October 2016].
Umentani, N. and Schmidt, R., 2013. Cross-sectional Structural Analysis for 3D Printing Optimization. SIGGRAPH Asia 5, pp.1–4.
Vaezi, M. and Chua, C.K., 2011. Effects of layer thickness and binder saturation level parameters on 3D printing process. International Journal of Advanced Manufacturing Technology, 53(1–4), pp.275–284.
Wang, T.M., Xi, J.T., and Jin, Y., 2007. A model research for prototype warp deformation in the FDM process. International Journal of Advanced Manufacturing Technology, 33(11–12), pp.1087–1096.
Cite This Work
To export a reference to this article please select a referencing stye below:
Related Services
View all


Related Content
All TagsContent relating to: "Technology"
Technology can be described as the use of scientific and advanced knowledge to meet the requirements of humans. Technology is continuously developing, and is used in almost all aspects of life.
Related Articles

DMCA / Removal Request
If you are the original writer of this dissertation and no longer wish to have your work published on the UKDiss.com website then please: