Topology Optimisation for Additive Manufacturing
Info: 10028 words (40 pages) Dissertation
Published: 9th Dec 2019
Tagged: Manufacturing
TABLE OF CONTENTS
2 CHAPTER TITLE (USE HEADING 1)
2.1 Section Heading (use Heading 2)
2.1.1 Subsection Heading (use Heading 3)
2.3 Inserting captions in the main document
2.3.1 Referring to captions for figures, tables etc
2.4 Updating Tables of Contents, Lists of Figures and Captions
3 CHAPTER TITLE (USE HEADING 1)
3.1 Section Heading (use Heading 2)
3.1.1 Subsection Heading (use Heading 3)
4 CHAPTER TITLE (USE HEADING 1)
4.1 Section Heading (use Heading 2)
4.1.1 Subsection Heading (use Heading 3)
5 CHAPTER TITLE (USE HEADING 1)
5.1 Section Heading (use Heading 2)
5.1.1 Subsection Heading (use Heading 3)
6 CHAPTER TITLE (USE HEADING 1)
6.1 Section Heading (use Heading 2)
6.1.1 Subsection Heading (use Heading 3)
7 CHAPTER TITLE (USE HEADING 1)
7.1 Section Heading (use Heading 2)
7.1.1 Subsection Heading (use Heading 3)
8 CHAPTER TITLE (USE HEADING 1)
8.1 Section Heading (use Heading 2)
8.1.1 Subsection Heading (use Heading 3)
9 CHAPTER TITLE (USE HEADING 1)
9.1 Section Heading (use Heading 2)
9.1.1 Subsection Heading (use Heading 3)
10 CHAPTER TITLE (USE HEADING 1)
10.1 Section Heading (use Heading 2)
10.1.1 Subsection Heading (use Heading 3)
Appendix A Appendix Title (Use Heading 7)
LIST OF FIGURES
| IT | Information Technology |
1 Introduction
This report documents research that was undertaken from May to August 2017. It represents the assessment portion of the Individual Research Project module which contributes towards 40% towards the degree of Master of Science.
1.1 Aims & Objectives
This research document within this report was conducted by the author with the support of Aircraft Research Association(ARA). The research topic was suggested by ARA. ARA has endeavoured to research the advantages of the exciting and emerging technologies of Additive Manufacturing(AM), coupled with the complex structural design optimisation theory.
The overall aim of the project was to perform a practical study of a topologically optimised metal structure. In order achieve this, number of objectives were set out:
- Perform a comprehensive literature review of previous research in topology optimisation[TO] for additively manufactured parts.
- Investigate potential applicataions of topology optimisation for ARA components considering for example potential for reduction in manufacturing cost/lead time/weight/part-count. Also possible the integration of systems routing with structural parts.
- Identify a case study part for the project in collaboration with ARA
- Assess the current part design using standard methodology
- Redesign the part using TOSCA topology optimisation
- Compare the two parts with regards to cost, functionality, strength, etc
1.2 Report Structure
This report contains the following sections:
Literature Review – Gives the reader an overview of the subject reader. Topics discussed include:
- The development of the research of topology optimisation, and how it arose.
- Further advancements made within this design theory and the benefits for pursuing it further.
- Practical limitations of this theory.
- The implementation of further theory as constraints within TO
- Synergy with AM
2 Literature Review
This section breaks down the development of the theoretical as well as empirical background of the development and advancements of the two key areas of Topology Optimisation and Additive Manufacturing.
First, the approach of the design creation by topology optimisation methods is discussed. Afterwards, the areas of additive manufacturing are discussed.
2.1 Optimisation
Before delving straight into the area of topology optimisation, it is important to understand what optimisation inherently is.
The concept of optimisation is something which we all strive towards in our daily lives. For example, to be the fastest runner, to be the best debater or to aim to increase profits in a company can all be targets that one may aim to achieve by some means. In engineering, we would aim to “produce the best quality of life possible with the resources available”[1]. It is, however, subject to the application what is defined as the ‘best’. In general, this will either tend towards a maximum, or a minimum. This concept of approach is termed unconstrained optimisation, where there is only an objective. In practice, unconstrained optimisation is not possible, as there will most undoubtedly be other factors involved. Thus, the problem introduces constraints.
A general optimisation problem contains the following elements[3]:
Objective function (f): This represents a mathematical response from the particular problem we are trying to optimise. The response will be dependent the design variables, x, and state variables, y. The objective will either be to maximise this response or minimise. An example could be weight or even displacement.
Design variable (x): This can be either a function or a vector. This represents, in mathematical form, the model parameters that create the overall model. As a structural example, the model parameters, x, could be thickness parameters of a model of a wing skin, and the objective function, f, could be as an example, the weight.
State variable (y): The state variable is a variable that represents a response to the structure, similar to the objective function. The state variable however, is not the variable being optimised. Usually, these are defined as constraints within the problem, usually being mathematically implemented into a nested formulation[3]. Examples of state variable can be strain, weight or even volume.
| SO minimise fx,ywith respect to x and ysubject tobehavioural constraints on ydesign constraints on xequilibirum constraint | (2.1) |
The general form of a structural optimisation problem is represented as follows:
It is important to note however, that unlike (2.1), multiple objective functions may also exist. For example, in a design, one may wish to minimise both strain and weight. Thus, very rarely will there exist a design which will minimise all objective functions in a multi-criteria optimisation problem. In such a problem, Pareto-optimality is aimed to be achieved; this is when no other design exists that satisfies all the objectives better. For the purposes of this report, multi-objective functions are not considered.
In (2.1), it can be seen that the optimisation is subject to three types of constraints.
- Behavioural constraints on y
- Constraints on responses of the structure
- Commonly represented as a function g(y).
- Example: Constraints on the max displacement, max stress, etc
- Design constraints on x
- Limitations of the actual structural model
- Can similarly be represented as a function
- Examples: Maximum thickness, minimum thickness, package space, material properties
- Can be combined with behavioural constraints via nested formulations
- Equilibrium constraints
- Equilibrium condition which must be kept in line with physical laws. For structural problems through FEM, this is typically the relation:
- Kxu=fx, where, Kxis the stiffness matrix of the structure u is the displacement vector Fxis the force vector
- Equilibrium condition which must be kept in line with physical laws. For structural problems through FEM, this is typically the relation:
For equilibrium constraints in structural optimisation tasks this is typically the stiffness equilibrium constraint. A more general term that is used in optimisation that encompasses the equilibrium constraint is ‘state problem’.
2.2 Structural Optimisation
Now that a general optimisation problem and its constituent elements has been discussed briefly, this section will delve more specifically on structural optimisation. In general, there are three predominant types of structural optimisations problems: sizing, shape and topology optimisation. These are discussed briefly below.
2.2.1 Sizing Optimisation
In general, this type of optimisation focuses primarily on local parameters such as thickness. The design variable, x, is designated as encompassing a multitude of these thickness, which would encompass everything that is being optimised. This type of optimisation is currently most prominent in the aerospace industry due to many parts build up using shell configurations. In addition, this is also the type of optimisation that is the most simplest to implement at the later design stages. This is shown in figure 2.2.1 below:
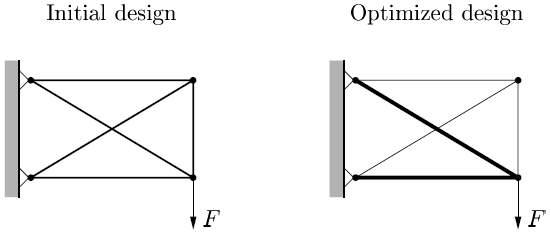
Figure 2.2.1: Size Optimisation[3]
2.2.2 Shape Optimisation
Shape optimisation delves into a more broader sense of optimisation. The design variable, x, for optimisation, takes the form of some contour, or structural boundary which dictates the shape of the object being analysed or designed. This is depicted in figure 2.2.2 below:
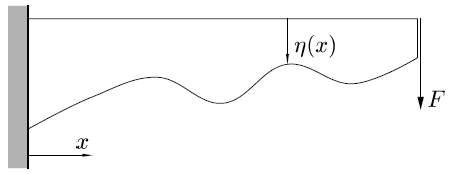
Figure 2.2.2: Shape optimisation[3]
2.2.3 Topology Optimisation
Topology optimisation takes yet another direction in generalising the structural optimisation. In essence, topology optimisation is the most effective method of optimisation for structural optimisation problem, followed by shape, and size optimisation. Figure 2.2.3 depicts a sample topology optimisation problem:
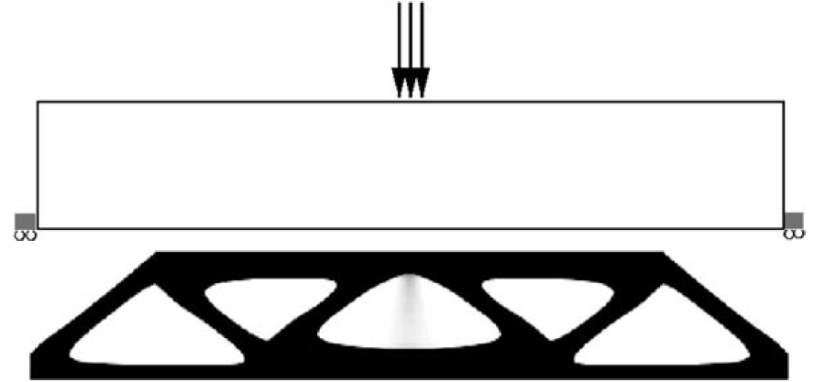
Figure 2.2.3: Topology optimisation sample problem. Top indicated initial design with load, bottom figure indicates the final result of the optimisation, indicating the most optimal load path locations to maximise stiffness[3]
2.3 Topology Optimisation
From all three types of optimisation, topology optimisation is the type which is most effective in a design, with potential for maximum returns; yet it is also the type least implemented in the aerospace industry. The reasons for this are more managerial and political than anything else. As can be seen the description of the preceding types of optimisations, we can deduce that implementation of each types of optimisation becomes more and more difficult to implement in latter stages of the stage[4], this is because each progressive type of optimisation requires more radical changes in the design. While it is still possible to implement topology optimisation, as well as shape optimisation in latter stages, there exist 2 deficiencies. Firstly, the effectiveness of the optimisation is vastly reduced. Secondly, the difficulty in implementation also becomes difficult, whereby the resistance created in design teams in latter stages means that implementation would add further cost to the project. The primary reason for this is that topology optimisation changes the way that loads diffuse through the structure. This can affect surrounding structures, and thus optimisation in latter stages can adversely affect overall design progress as re-design may be required. Thus, for these reasons, Taylor[4] suggests that the main benefits of topology optimisation are reached as an optimum load-path finding tool when implemented early in the design phase, far before detailed design.
2.3.1 Homogenisation Method
In general, a structures topology is its’ most basic geometric form[5]. Topology optimisation is the computation of the best geometric configuration of a structure [6,7]. The geometric computation of this ‘best’ type of structure is generally done through Finite Element Method(FEM) calculations, providing the most efficient way to deduce optimum results. While sizing optimisation has been performed for hundred of years, it was only since around the 1960s that complex shape optimisation techniques were rigorously developed. Nevertheless, shape optimisation reached a level of maturity giving it viability in many aerospace, automatic, and other applications. It was only in 1988 when topology optimisation was given birth. The homogenisation method[8] is the method used for topology optimisation widely in almost all topology optimisation applications. This method was developed by Martin Bendsoe and Noboru Kikuchi. Of whom, Bendsoe has made further considerable advancements in the field of Topology Optimisation.
In the development of a topology optimisation problem, generally, a design region is specified, with loads and boundary conditions defined, where material fills the entire design region. Within this design region, an objective of maximum stiffness, or minimum compliance is specified. The optimisation aims to provide the optimal distribution of material in order to maximise this stiffness. In essence, the optimisation provides the optimal load paths which provide the basis of structural members and others to be placed. In the optimisation, the non-design region is also part of the package space[9].
The final design produced shows the location where varying amount of loads can pass through, but in addition, shows where ‘intermediate’ levels of loads can pass through, which is given through densities. The entire design space is cut up into ‘finite elements’ and then assigned ‘material densities’ based
2.3.2 SIMP method
While the homogenization method provides useful results, the initial results of the method produces intermediate density values which are not very practical in an industrial application. While density values of close to 1 and 0 can be interpreted as integers which represent either solid material or holes, intermediate density values of 0.3, 0.5, or 0.7 provide difficulty in deducing the final design. This is because a material with intermediate density cannot be normally produced. Although advancements in this area are being made in the case of lattice structures and meshes[10][11], the areas of intermediate densities are further evaluated to provide more meaningful structures.
As the requirement for black-and-white(0 and 1’s) designs increased, methods were developed by Bendsoe. Originally, a ‘penalization’ method, introduced by Bendsoe in 1989[12], and coined the SIMP method by Rozvany[13]. The method works by introducing a penalisation parameter, p. In essence, this penalisation parameter is used to ‘penalise’ the design variable, x, of which may have intermediate densities based on the particular stiffness/compliance optimisation problem, causing intermediate design variable densities to either tend towards 0, or 1.
This is represented mathematically as follows:
K ρx= ∑enηKρexK̂e
In this formulation,
K ρxrepresents the global stiffness matrix, which is assembled from the solid material element stiffness matrices
K̂e. e represents the e-iteration of the particular design variable, x, and n is the total number of design variables.
ρxis the density which is a function of the design variable, x.
The SIMP penalisation function is given as:
ηKρex=ρexp
In the above equation, p is our penalisation factor, which must be greater 1.
Having a penalisation factor too low tends to given higher residual intermediate densities remaining in the problem formulation, whereas utilising much higher values of penalisation factor tends to give very thin structural members. This is also of particular problem within structural optimisation as there exist failure criteria which topology optimisation does not consider. One such failure criteria is buckling[15][16] and also fatigue[17]. These failure criteria are discussed in further sections. The penalisation factor, p, is usually set to 3, where much previous research has proven to work quite well[14].
2.3.3 Constraints
Up until now we have discussed the optimisation problem and its methods. However, there in the optimisation problem, there also exist constraints. Without these constraints, the optimisation result would simply be nonsense. Depending on what the application would be, these constraints could be stress, strain, displacement, fatigue, geometric constraints, volumetric constraints, and so on.
2.3.3.1 Stress constraints and their implementations
Of the many constraint within topology optimisation, stress constraints have been the most rigorously researched, and rightly so. The stresses throughout a structure dictate the viability of its application. If even local stresses become too high, there can be catastrophic structural failure. Thus, much research has endeavoured to implement these stress constraints into the problem formulation in order to prohibit failure via criteria such as Von Mises, etc.
The problem formulation for stress constraints has been particularly problematic, due to practical limitations of computer ability. Ideally, stress constraints defined locally for every design variable would provide the most accurate result, however this is very computational expensive. Conversely, global approach would be inaccurate. The local approach effectively applies one stress constraints to each stress evaluation point in the model(local), whereas the global approach one stress constraint to the entire model[18][19].
A method developed by Holmberg et al.[14] provides a middle ground via a stress cluster approach. The stress cluster approach is less computationally expensive than a local stress constraint model, yet more accurate than a global stress computation model. The stress cluster approach applies stress constraints to groups of stress evaluation points. This approach provides versatility in that the number of stress clusters can reduce to the point of providing a global approach, or increase, to the point of it simulating a local approach. This method can then be tailored depending on the design application, and resources available. Finally, in order to apply an appropriate stress measure to the stress cluster, a modified p-norm approach is used to either allow the p-norm measure to tend towards a local value, or the maximum in the stress cluster.
Holmberg et al. also introduce a means to penalise the solid material stress vector in order to provide suitable stress evaluation points within the problem. This is of particular importance due to stress singularities being created in some problems, especially where intermediate densities tend towards zero, and there still exists stress in these areas.
Finally, in the optimisation for this particular stress-constrained optimisation, the stress clusters are re-clustered for a defined iteration frequency, i.e. re-cluster appropriate to new stress distribution of intermediate optimised designs. Allowing reclustering provides the best result for optimal compliance, conversely no reclustering provides the worst result. The choice between these is dependant upon resources available, and reclustering is also particularly computationally expensive. Thus, re-clustering after pre-determined iterations, say 50, may provide a middleground.
2.3.3.2 Fatigue constraints and their implementations
Implementation of fatigue is of particular difficulty within optimisation. The reason being is that cyclic-loading analysis is of itself particularly expensive. Coupled with topology optimisation, the problem is further exacerbated.
One example of fatigue implementation[17] is where stress clusters are combined with fatigue analysis in order to reach an optimised result. Figure 2.3.3.2 below shows this:
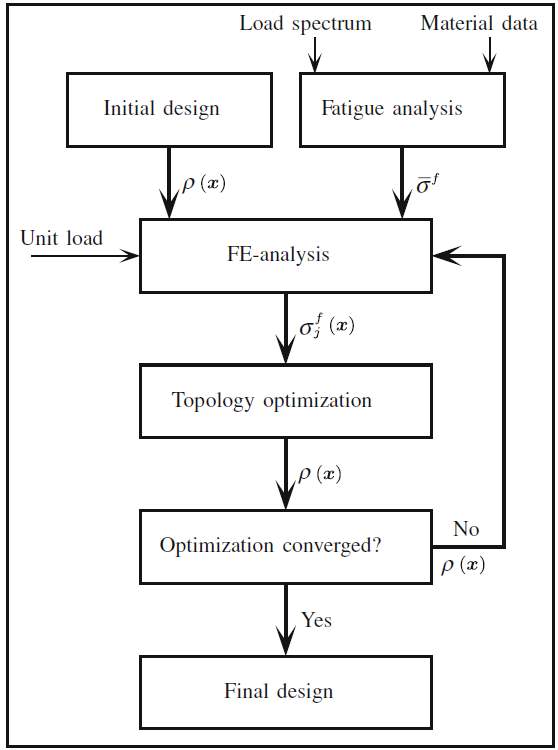
Figure 2.3.3.2: Fatigue TO Analysis Cycle
In essence, the fatigue optimisation with stress constraints will be an iterative method where analysis is made in each step.
2.4 Manufacturing Constraints
2.4.1 Standard Manufacturing Constraints
One of the many beauties of topology optimisation is that it provides overall structural models that are of the most optimal design, and natural. We see examples of optimal designs in many aspects of nature and biology. The skeleton of the human body is designed to be structural efficient to bare all the loads applied upon it on a day-to-day basis. This structural efficiency has allowed mankind to thrive from a primordial age in hunting, and other survival aspects. The natural shape of trees and their roots also dictate and optimal synergy with the ground below so that it is perfectly rooted to the ground with minimal mass.
Similarly, topology optimisation produces natural structures which are most prevalent in nature. These structures however, are difficult for us humans to produce through conventional means. Manufacturing methods are designed in order to produce specific shapes and sizes. Thus, the output from a topology optimisation must adhere to the limitations of such constraints.
There exist generally two ways that a topology optimised problem can be tailored towards manufacturability:
- Using results of topology optimisation in order deduce optimal load paths, and then alter the model in some CAD system, ready for manufacture.
- Topology Optimisation based upon manufacturing constraints from the outset
Option 1 is quite commonly used in industry today, however, many methods are being developed in order to provide robust methods for manufacturing constraints[20]. These research methods are being robustly implemented in computer software packages such as SIMULIA Tosca[21], Altair’s Hyperworks package which includes the Optistruct[22] optimisation module.
An example is for example a rail with extrusion requirements, presented by Zhou[20]. Figure 2.4.1.1 shows the original model of the rail, whilst figure 2.4.1.2 shows the topology optimisation without constraints and 2.4.1.3 shows the topology optimisation with extrusion constraints:
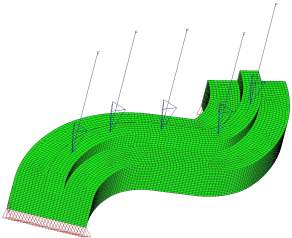
Figure 2.4.1.1: FE model of a rail under moving loads[20]
Figure 2.4.1.1 shows an FE model of a rail under expected loading conditions. This is analysed and optimised based on no manufacturing constrains. The resulting topology provides the most optimal distribution of topology. Unfortunately, this is not able to be produced using conventional technology, and must be subject to the limitations of manufacturing.
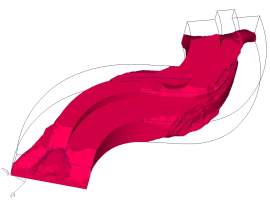
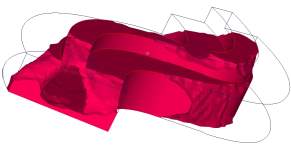
Figure 2.4.1.2: Topology of the rail without extrusion constraints[20]
Figure 2.4.1.3 below shows the resulting topology optimisation based upon extrusion constraints. This provides a smooth extrusion-based result which is able to be produced. A final note to mention on this type of constraint, is that many structures produced through conventional manufacturing techniques have conventional shapes. Such shapes are well known, and their stress distributions are also well researched. Unconstrained topology optimisation does have the hazard of producing a result which may fail in other failure criteria, which a designer may not normally consider, due to factors such as stress concentrations, etc.
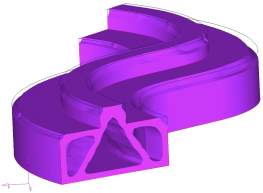
Figure 2.4.1.3: Topology of the rail with extrusion constraints[20]
2.4.2 Additive Manufacturing Constraints
As discussed in section 2.4.1, manufacturing constraints limit the potentials of topology optimisation. Typically, it is subtractive manufacturing methods which provide the greatest disadvantage. Additive Manufacturing(AM) methods, such as selective laser melting(SLM) provide the least constraints for the topology optimisation. Nevertheless, there are still constraints inherent within AM methods which we must consider.
AM techniques are wide and many. As a result, there exist specific AM restrictions to all types of technologies. As this research is being undertaken at Aircraft Research Association, which uses a Renishaw AM250 printer, SLM processes constraints are mostly discussed. In fact, the vast majority of applications are actually focused towards two types of AM techniques, which are vastly similar. These two techniques are Direct Metal Laser Sintering(DMLS) and Electron Beam Melting(EBM). DMLS processes are the most dominant form used for laser based Power Bed(PB) AM, whereas EBM is the most dominant form used for electronic beam based PBAM. As these two technologies represent the vast use of modern AM in use today, it is justified to focus on constraints of these two for now[23].
Muir[23] outlines three main limitations of AM technologies:
- Surface Roughness
- Geometric Distortion
- Build Economics
For most people, the most clear disadvantage for AM is the surface roughness present in AM parts. This is as a result of the concept of layer-by-layer manufacturing techniques by a high-energy source used in AM.
The second, geometric distortion may normally not be visibly clear to the naked eye, but on closer examination, this does become prevalent.
These three main limitations are now discussed in further detail.
2.4.2.1 Surface Roughness & Overhanging Surfaces
One major source of surface roughness(SR) can be overhanging surfaces. This is in effect the angle between a surface of the part being produced and the XY plane. This problem is inherent within all AM processes due to the process of layer-by-layer manufacturing. Figure 2.4.2.1 demonstrates how varying layer thicknesses and angles can provide various saw-tooth like surfaces which dictate the surface roughness.
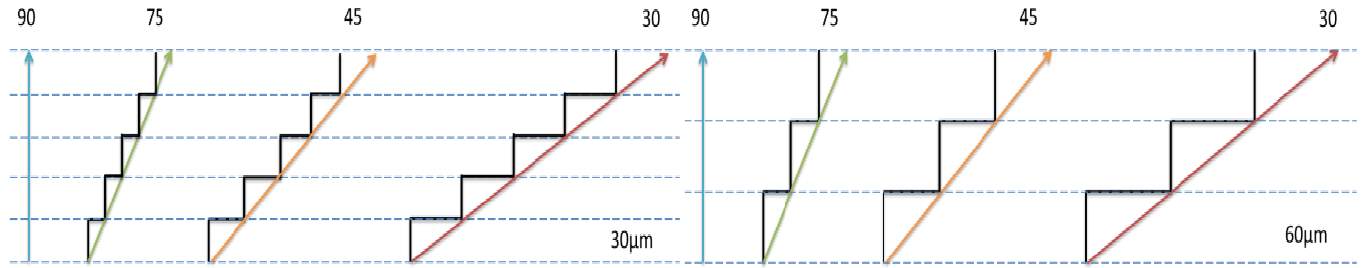
Figure 2.4.2.1: Effects of layer thickness and overhanging angle on surface roughness
Figure 2.4.2.1 demonstrates the effects of the overhang angle and the layer size and how they can compound to produce surface roughnesses.
In addition to the surface roughness, an overhanging surface does also commonly require support structure in order to reduce geometric distortion. On the removal of such support structures, there may be residual surface roughness dependant on the post-processing technique implemented. Much research has focused on the use of support-structures[25][26] however research into their detrimental effects on SR and how to decrease it is not much researched[23].
2.4.2.2 Geometric Distortion
Geometric Distortion is where the resultant model that is built does not accurately represent the model originally designed. This can be caused due to various material-based behaviours of the AM process.
DMLS and EBM are very similar processes, however their vary in the fact that DMLS is a cold process, with energy input, whereas EBM is a hot process, where the chamber is pre-heated in advance between each layer, then an electron beam used to melt the cross-section of that particular layer. EBM processes produce a result that has less distortion as not only is the part kept within a vacuum, but since layers are preheated, the microstructure is vastly different to that of DMLS processes. The main problem in the microstructure of the DMLS process is that there are residual stresses (RS) leftover. These residual stresses are also highly geometric dependant.
A solution whereby these geometric distortions are minimised is by using further support structure. Such support structure also has a negative effect as discussed in section 2.4.2.1 is that it leaves further surface roughness. Additionally the support structure increasing area needed for post-processing, increasing build time, money, and part waste.
2.4.2.3 Build Economics
In general, build economics is an optimisation strategy whereby Muir[23] explains the aim is to reduce the overall cost of the AM process by optimisation techniques. The factors associated with this are many, but a few main areas are highlighted. The aim should be to minimise any factors which may contribute towards a build failure, as this incurs unnecessary cost. This build failure can be as a result of excess geometric distortion, or also surface roughness. In addition, the build economics optimisation constraints would also include build time, and powder, as these add further cost. A final point is that build time is usually proportional to the build height.
2.5 Applications of Topology Optimisation
2.5.1 Airbus Application
One of the first applications of topology optimisation in the aerospace industry in the UK was on the A380 Droop Nose Ribs[26].
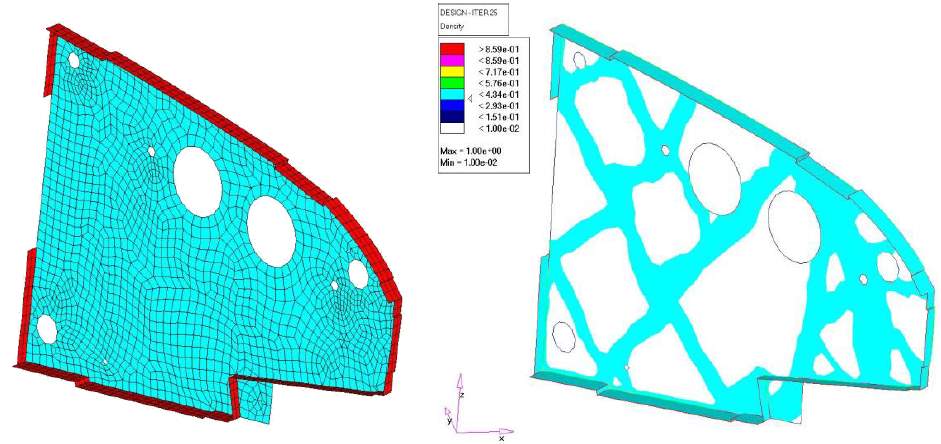
Figure 2.5.1.1: Airbus A380 Leading Edge Droop Nose Ribs; FE Mesh & TO[26]
Initially, the design was meshed as can see in figure 2.5.1.1. As we can see, this mesh is a shell element mesh, as is common in many aerospace applications. Following this, a topology optimisation is done in order to deduce the most optimal load path, shown in the figure to the right in figure 2.5.1.1. Based on this optimisation, the load path result was dissected and sectioned as can be seen in figure 2.5.1.2 below.
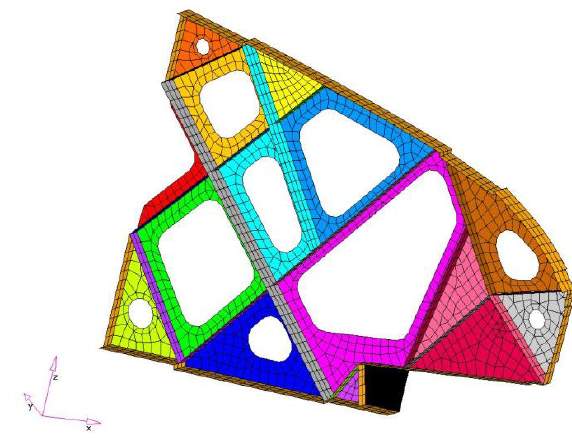
Figure 2.5.1.2: Initial Design for Sizing and Shape Optimisation created by interpreting the Topology Optimisation Result
Once the above section was produced, each section(highlighted in various colours) was assigned to various design teams. These sections were then optimised further using size and shape optimised to produce final values.
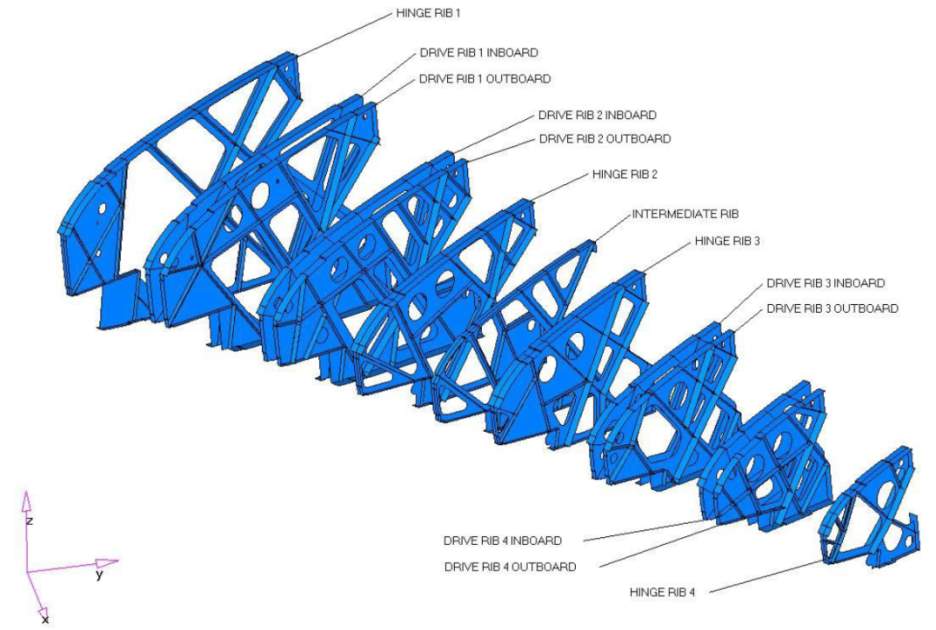
Figure 2.5.1.3: Final A380 Nose Leading Edge Droop Nose Ribs
It is important to mention that after the initial topology optimisation of the overall nose ribs, when the size and shape optimisation was undertaken for the various sections, buckling and fatigue calculations were also performed at this stage. Hand calculations as well as computer calculations were performed to verify the design. Krog, Tucker & Rollema[26] also make remarks that it is particularly important for designers to be aware of the changing load situations as a result of the topology optimisations. Additionally, care should be taken as load definitions generally continuously change as the design of an aircraft structure matures. It is for these reasons is recommend to select applications where loads are very accurately known and defined.
Finally, whilst this particular example is not additively manufactured, it is nevertheless a strong application of TO. The overall weight saving using TO in this way resulted in a saving of over 500kg per A380 aircraft, indicating the massive benefits of utilising topology optimisation as early as possible in the design stage.
2.5.2 Aircraft Wing Sample
Walker et al. have undertaken a study showcasing the potentials for utilising the potentials of TO inside a wing structure. Firstly, a 2D optimisation was undertaken as shown in figure 2.5.2.1 below:
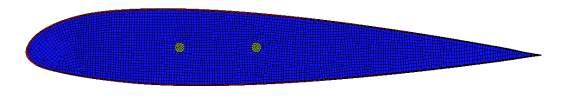
Figure 2.5.2.1: Topology Optimisation Design Space for 2D airfoil
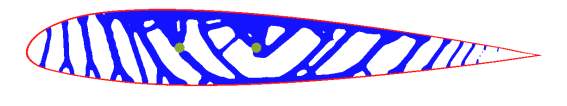
Figure 2.5.2.2: Topology Optimization Design results for simple 2D airfoil
In Figure 2.5.2.1, the design space is depicted in blue, the non-design space which represents the airfoil skin is in red, and a green region which is also designated as non-design which represents fixed supports. Again, as described earlier, we see a natural-like topology produced for the internal structure. This optimisation is then carried in 3-dimensional, giving the following result:
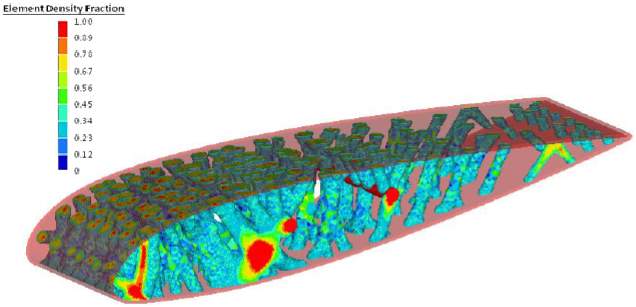
Figure 2.5.2.3: 3D- topology optimisation of an airfoil section
Figure 2.5.2.3 represents a 3-dimensional TO result. We can see that there are well defined members in here, which would provide a good basis for structural strength. It is important to note the many areas that are blue, which indicate intermediate densities. As these parts will be produced in solid section, it indicates the final product may be over-designed. Further penalisation would improve this design, but this is not undertaken in this design study[27]. The overall weight savings compared to baseline in this case was an 18.7% reduction, with stress and buckling constraints equal or better. The optimisation objective here was minimum compliance, with volume fraction constrained to 30%.
2.5.3 Lattice-Reinforced Penetrative Warheads
In previous TO examples, we see how we the penalisation functions are used in order to penalise intermediate densities to produce final designs which tend towards a black-and-white solution. In reality, research is being produced which aims to address intermediate densities directly, through solutions of lattice-based structures. One factor to remember, however, is that lattice designs are many, and the stress distribution and structural behaviour will depend upon the type of lattice employed.
Richards and Liu[29] employ TO techniques towards structural design of a penetrative warhead. The design space and non-design space is shown in figure 2.5.3.1 below:
Figure 2.5.3.1: Design space(blue), and non-design space(red) of a penetrative warhead
By varying various parameters of the warhead, Richards & Liu[29] were able to produce varying design of warhead as indicated in figure 2.5.3.2 below.
Result a) indicates a very well defined optimisation result, as structural members are very clearly defined. The exception is to the rear of this warhead as the member is very thin. This can present problems later in other failure criteria, such as buckling.
Result b) represents a very poorly defined problem. The optimisation was largely unconstrained. Richards & Liu comment that although the result of b) has a well defined tip section, the remaining structure is very unclear due to the wide varying intermediate densities. This produces a very poor structure. However, it should also be mentioned that the intermediate densities can in this case, be compensated via a mesh-like structure.
Result c) is produced by imposing additional constraints and also increasing penalisation parameters. As we can see, this vastly reduces intermediate densities, and also additionally produces very clearly defined structural members. We also have, however, a high concentration of various intermediate densities of 0.2-0.7 in the nose of the penetrative warhead, and also some around the truss-like members produced rearwards. It can be seen that these can be presented by some mesh designs.
Figure 2.5.3.2: Intermediate Densities of various TO optimisations of warhead
Figure 2.5.3.3: Sample Model Produced by TO results. a) indicates main structural members, b) indiciates inclusion of lattice to address some intermediate densities, but also to add additional strength
In figure 2.5.3.3, we see the implementation of a mesh-like design which provides an interesting advancement in TO-designed components.
2.6 Additive Manufacturing
Additive Manufacturing(AM), as its name suggests, is manufacturing by the addition of material. It is the converse of subtractive manufacturing, whereby parts are created by the reduction of material. There are many various processes of additive manufacturing, however this section will focus primarily on powder based(PB) AM processes.
PB processes were first developed at the University of Texas, Austin, USA. Selective Laser Sintering(SLS) was the first commercialized PB fusion process[30].
In general, PB processes all work by the same mechanisms. This is summarised as:
- One or more thermal sources for inducing fusion between powder particles
- Method for controlling powder fusion to a prescribed region of each layer,
- Mechanisms for adding and smoothing powder layers.
As SLS was the first produced PB processed, all other processes are generally compared to it, as a modification.
Figure 2.6.1 below shows a schematic of the basic AM SLS process:
Figure 2.6.1: Schematic of the SLS process
The counter-rotating powder levelling roller spreads a thin layer of powder over the build area. The SLS process then fuses thin layers of powder which been placed on the build area. This is done by the CO2 laser beam, which is directed by the X-Y Scanning Mirrors. The building process is done in a closed area with nitrogen gas to reduce oxidation and degradation of the material. The Infra-Red heater keeps the powder at the build platform at an increased temperature. This helps reduce geometric distortion due to residual stresses. In addition, this pre-heating also reduces the power requirements of the laser. Sometimes pre-heating is done using resistive heaters around the build platform.
2.6.1 Powder Fusion Mechanisms
2.6.1.1 Solid-state Sintering
In this type of fusion mechanism, generally, particles are heated to above one and half of the absolute melting temperature. This gives increased necking between particles, reducing material porosity.
2.6.1.2 Chemically-induced Sintering
In this type of sintering, thermally-activated chemical reactions between two types of powders and/or powders and the atmospheric gases to produce a by-product to bind the powders together. This process is typically used for ceramic materials. A common problem of this type of sintering is there is high porosity material. To remedy this, post-processing to increase the density may be required.
2.6.1.3 Liquid-phase Sintering and partial melting
This type of mechanism is when some particles remain solid, while other particles become molten. The molten particles act as a glue to join the entire powder structure together.
2.6.1.4 Full melting
This type of mechanism is commonly used in engineering and high-strength alloys and semi-crystalline polymers. This type of mechanism uses an energy beam which provides sufficient thermal energy to melt the entire current layer cross-section required as well as the previous layer. Thereby, it provides a very effective way to create a well-bonded, high-density structure from engineering metals and polymers.
For metal PB processes, the materials that are typically used are Titanium, Stainless Steel, Cobalt Chrome, etc, the metals are typically fully melted providing optimal properties. In addition, the way that these powders are melted provide unique material properties which can be quite desirable.
2.7 Summary of Literature Review
In summary, the literature review presents a background of the core techniques and ideologies involved in topology optimisation. It presents the literature involving the development of the implementation of constraints involved for structures as well as specifically additive manufacturing.
The author has no real interest to delve into the mathematical formulations of the nested formulations that such constraints take. Instead, these formulations are already implemented in optimisation software such as SIMULIA Tosca and Altair Optistruct. An overview of the topic areas allows the author an understanding for practical use of topology optimisation. The next chapter deals with the methodology that was undertaken, and details the types of analysis and parameters that will be conducted, with a view on what results to expect.
3 CHAPTER TITLE (USE HEADING 1)
3.1 Section Heading (use Heading 2)
3.1.1 Subsection Heading (use Heading 3)
Heading styles 1-6 should be applied to the headings throughout the main body of your thesis as they are the basis for the Table of Contents and caption numbering. Headings 7-9 have been modified specifically for use in the Appendices. The appearance of the headings can be changed by modifying the relevant Heading styles.
There is no need to leave blank lines between paragraphs as the Normal style (in addition to 1.5 line spacing) automatically incorporates spacing between paragraphs. The style Table Text can be applied to tables to reduce the line spacing.
3.1.1.1 Referring to Headings
To create a cross-reference to a heading:
- Click on the References tab on the Ribbon
- Select the Cross-reference command to open the Cross-reference window
- Under Reference Type choose Heading
- Under For which heading choose your heading
- Under Insert Reference To choose Heading Number and click Insert. Repeat to insert the Heading Text
- Click Close
3.2 Section Breaks
This document relies on section breaks to control page layout, page numbering and so on. It is recommended that you work with the non-printing characters visible at all times to minimise the risk of accidentally deleting the section breaks. The Show/Hide button is located in Paragraph group on the Home tab of the Ribbon.
3.3 Inserting captions in the main document
Captions should be used whenever you insert a graphic, table or equation – to add a caption choose Insert Caption from the References tab on the Ribbon. Specify whether the label should be Figure, Table or Equation or create a new caption of your own.

| Heading | Heading | |
| Label | Detail | Detail |
| Label | Detail | Detail |
Equations and their captions can be placed ‘side-by-side’ by moving the equation and the caption into the cells of a borderless, 2 column x 1 row table as shown below. Simply copy and paste this table as many times as you need to for all subsequent equations, but remember to periodically highlight and update the equation captions by pressing the F9 key (or right-click and select Update Field from the shortcut menu).
| a2+b2=c2 | (3‑1) |
For information on inserting captions in appendices see Appendix A.
3.3.1 Referring to captions for figures, tables etc
Use a cross-reference when you want to insert text similar to ‘… as shown in Figure 5.1, below’
- Click on the References tab on the Ribbon
- Select the Cross-reference command to open the Cross-reference window
- In the Reference Type drop-down list choose the appropriate label
- Under For which heading choose your figure
- Under Insert Reference To choose Only label and number and click Insert. Repeat to insert either above/below or page number if required
- Click Close
3.4 Updating Tables of Contents, Lists of Figures and Captions
Your table of contents, lists of figures and caption numbers will update automatically whenever you re-open the document, however you can ‘force’ an update at any time by highlighting the table or text and pressing the F9 key (or right-click and select Update Field from the shortcut menu). To update all fields in a document press Ctrl+A then F9.
3.5 Inserting Landscape Pages
It is often preferable to use a landscape page to display tables of data, charts or diagrams. Before changing an existing page from portrait to landscape it is necessary to enclose the page within a pair of next page section breaks. It may also be necessary to modify the page number format to ensure that page numbering continues from the previous section.
To insert a Next Page Section Break:
- Click to place the insertion point where you would like to switch from portrait to landscape page orientation.
- Go to the Page Layout tab on the Ribbon
- Select the Breaks command and choose Next Page from the drop down list
- Repeat steps 1-3 to insert a second Next Page Section Break at the point where you wish to switch back to portrait orientation
- Click somewhere between the 2 new section breaks and use the Orientation command on the Page Layout tab to change page orientation from portrait to landscape.
4 CHAPTER TITLE (USE HEADING 1)
4.1 Section Heading (use Heading 2)
4.1.1 Subsection Heading (use Heading 3)
5 CHAPTER TITLE (USE HEADING 1)
5.1 Section Heading (use Heading 2)
5.1.1 Subsection Heading (use Heading 3)
6 CHAPTER TITLE (USE HEADING 1)
6.1 Section Heading (use Heading 2)
6.1.1 Subsection Heading (use Heading 3)
7 CHAPTER TITLE (USE HEADING 1)
7.1 Section Heading (use Heading 2)
7.1.1 Subsection Heading (use Heading 3)
8 CHAPTER TITLE (USE HEADING 1)
8.1 Section Heading (use Heading 2)
8.1.1 Subsection Heading (use Heading 3)
9 CHAPTER TITLE (USE HEADING 1)
9.1 Section Heading (use Heading 2)
9.1.1 Subsection Heading (use Heading 3)
10 CHAPTER TITLE (USE HEADING 1)
10.1 Section Heading (use Heading 2)
10.1.1 Subsection Heading (use Heading 3)
11 CHAPTER TITLE (USE HEADING 1)
11.1 Section Heading (use Heading 2)
11.1.1 Subsection Heading (use Heading 3)
[1] Garret N.Vanderplaats, ‘Numerical Optimization Techniques for Engineering Design: With Applications’, McGraw-Hill Series in Mechanical Engineering, 1984
[2] Erwin Kreyszig, ‘Advanced Engineering Mathematics’, 10th Ed., John Wiley & Sons(Asia) Pte Ltd, 2011
[3] Christensen, Klarbring, ‘An Introduction to Structural Optimization’, Springer Science, 2008
[4] Taylor, ‘The Role of structural optimisation in the design phase’, Lockheed Martin Aeronautics Company, 25TH INTERNATIONAL CONGRESS OF THE AERONAUTICAL SCIENCES, 2006
[5] Kenneth H. Huebner, ‘The Finite Element Method for Engineers’, 4th Ed, Wiley Inter-Science, 2001
[6] M.P. Bendsoe, ‘Optimization of Structural Topology, Shape, and Material’, Springer-Verlag, Berlin, Germany, 1995.
[7] G. I. N. Rozvany, M.P. Bendsoe, and U. Kirsch, “Layout Optimization of Structures”, Appl. Mech Rev., Vol. 48, No. 2, February 1995, pp. 41-119.
[8] Bendsoe, ‘Generating Optimal Topologies in Structural Design using a Homogenization Method’, Computer Methods in Applied Mechanics and Engineering 71, 197-224, 1988, North-Holland
[9] Barnes, ‘Topology Optimisation of Aircraft parts for Additive Manufacturing’, Cranfield University, 2015
[10] Richards, ‘Topology Optimization of Additively-Manufactured Lattice-Reinforced Penetrative Warheads’, 56th Structures, Structural Dynamics, and Materials Conference, 2015
[11] Ha, Guest, ‘Topology Optimization of 3D Woven Micro-lattices using a Projection-based Ground Structure Approach’, 17th Multidisciplinary Analysis
and Optimization Conference, 2016
[12] Bendsoe, ‘Optimal shape design as a material distribution problem’, Structural and Multidisciplinary Optimization, Vol. 1, No. 4, pp. 193-202, 1989
[13] Rozvany, Zhou, Birker, ‘Generalized shape optimization without homogenization’, Structural Multidisciplinary Optimisation, 1992
[14] Holmberg, ‘Stress constrained topology optimization’, Structural Multidisciplinary Optimisation, 2013
[15] Zhou, ‘Topology Optimization for Shell Structures with Linear Buckling Responses’, Computational Mechanics, WCCM VI in conjunction with APCOM’04, Sept. 5-10, 2004, Beijing, China, Tsinghua University Press & Springer-Verlag, 2004
[16] Schramm, ‘Topology Layout of Structural Designs and Buckling’, 10th AIAA Multidisciplinary Analysis and Optimization Conference, 2004
[17] Holmberg, ‘Fatigue constrained topology optimization’, Structural Multidisciplinary Optimisation, 2014
[18] Duysinx, Bendsoe, ‘Topology Optimization of continuum structures with local stress constraints’, Int J Numer Methods Eng 43(8): 1453-1478, 1998
[19] Duysinx, Sigmund, ‘New developments in handling optimal stress constraints in optimal material distribution, 7th AIAA/USAF/NASA/ISSMO symposium on multidisciplinary design optimisation, AIAA Paper 98-4906, pp1501-1509, 1998
[20] Zhou, ‘Progress in Topology Optimization with Manufacturing Constraints’, 9th AIAA/ISSMO Symposium on Multidisciplinary Analysis and optimization, Atlanta, Georgia, 4-6 September 2002
[21] TOSCA User’s Manual
[22] Altair University, ‘Practical Aspects of Structural Optimization – A Study Guide, 2nd Edition, 2015
[23] Muir, ‘Rules, Precursors and Parameterization Methodologies for Topology
Optimized Structural Designs Realized Through Additive Manufacturing’, 10th AIAA Multidisciplinary Design Optimization Conference’, 2014
[24] Baufield, Biest, Gault, ‘Additive manufacturing of Ti-6Al-4V components by shaped metal deposition: Microstructure and mechanical properties’, Materials & Design, 2010
[25] Kruth, et al., ‘Rapid Manufacturing of Dental Prostheses by means of Selective Laser Sintering/Melting’, Bio-Materials and Prototyping Applications in Medicine, 2009
[26] Krog, L., Tucker, A., & Rollema, G. (2011). Application of Topology, Sizing and Shape Optimization Methods to Optimal Design of Aircraft Components. Retrieved from Altair: http://resources.altair.com/pdd/images/en-US/CaseStudy/Airbus-Application-of-Topology-Sizing-and-Shape-Optimization-Methods.pdf
[27] Walker et al., ‘Topology Optimization of an Aircraft Wing’, 56th AIAA/ASCE/AHS/ASC Structures, Structural Dynamics, and Materials Conference, 2015
[28] Walker et al., ‘Wing Design Utilizing Topology Optimization and Additive Manufacture’, 57th AIAA/ASCE/AHS/ASC Structures, Structural Dynamics, and Materials Conference, 2016
[29] Richards, Liu, ‘Topology Optimization of Additively-Manufactured, Lattice-Reinforced Penetrative Warheads’, 56th AIAA/ASCE/AHS/ASC Structures, Structural Dynamics, and Materials Conference, 2015
[30] Gibson, Rosen, Stucker, ‘Additive Manufacturing Technologies’, Springer, 2010
Whilst Heading 1 to Heading 6 can be used to number headings in the main body of the thesis, Heading styles 7–9 have been modified specifically for lettered appendix headings with Heading 7 having the ‘Appendix’ prefix as shown below.
If you have chosen to include chapter numbers in your captions then follow the instructions given here to apply the same format to the captions in your appendices. This section explains how to caption the figures and tables in your Appendices, assuming that Heading 7 is numbered “Appendix A” and that the Figures and Tables are going to be labelled ‘Figure A-1’, ‘Figure A-2’, ‘Table B-1’ etc.
You will have to create new, separate labels that look like the ‘Figure’ and ‘Table’ labels you used in the main body of your thesis.
- Select the References tab on the Ribbon then click on Insert Caption
- Click New Label. Type Figure_Apx then click OK
- You now have two labels for figures, called Figure and Figure_Apx
Repeat for table captions. - In the Caption box, type your caption text
- Click Numbering. Tick Include chapter numbering and choose Heading 7 from the drop-down list of styles and click OK twice
- Your caption should look something like this:
Figure_Apx A‑1 This is the caption text for a Figure in the Appendix
- Delete the extraneous ‘_Apx’ from the caption label so it reads:
Figure A‑1 This is the caption text for a Figure in the Appendix
TIP: Instead of deleting each ‘_Apx’ individually use Find & Replace to modify all the labels at once.- Creating Lists of Figures and Tables for Appendices
This template already includes a List of Figures and a List of Tables, however you will have to create two new lists for the ‘Figure_Apx’ and the ‘Table_Apx’ labels.
- Place the insertion point on a blank row after the existing List of Figures
- Select the Insert Table of Figures command on the References tab of the Ribbon
- Set the Caption Label box to ‘Figure_Apx’ and click OK
Note: Word will put a single blank line between the original and new lists preventing it from appearing as one seamless list. However if you select the blank paragraph between the tables you can hide it by opening the Font dialog box from the Home tab and selecting Hidden. - Click after the List of Tables and repeat for the Caption Label ‘Table_Apx’
Cite This Work
To export a reference to this article please select a referencing stye below:
Related Services
View all


Related Content
All TagsContent relating to: "Manufacturing"
Manufacturing describes the process of using raw materials to produce goods. Manufacturing involves workers making use of heavy machinery, tools, and other resources throughout the process.
Related Articles

DMCA / Removal Request
If you are the original writer of this dissertation and no longer wish to have your work published on the UKDiss.com website then please: