Comparison of Traditional and Behavioural Finance
Info: 17547 words (70 pages) Dissertation
Published: 10th Dec 2019
Tagged: Finance
Tremendous amount of research work and real life events have completely wiped out any doubt of the existence of behavioural finance. It is clear that the proponents of traditional finance failed to acknowledge or explain some pricing anomalies that were identified and explained by the proponents of behavioural finance.
“In contrast to traditional finance, which examines how people should behave in order to maximize their wealth, behavioural finance investigates how people actually behave in a financial setting”
(Nofsinger, cited in Kourtidis et al. 2011: 548)
Traditional finance believes that decision making utilizes all available information and that investors are rational when making investment decisions. Behavioural finance theory on the other hand believes that psychological factors are the drivers of investment decision making.
Events of the Dutch Tulip craze of the 17th century that resulted in the great depression of 1929 revealed that when it comes to investing, people generally follow their emotions, not their reasoning.
Does behavioural finance impact investors’ stock returns negatively, resulting in the mispricing of stock?
Do investors really ignore common sense and base their investment judgment on the market trend?
“Experimental evidence in social psychology on the behaviour of individuals in groups suggests that individuals abide by the group decision, even when they perceive the group to be wrong”
“…. Herds are characterized by individuals who suppress their own beliefs and base their investment decisions solely on the collective actions of the market, even when they disagree with its predictions”
(Christie and Huang, 1995:31)
Can herding predict future mispricing and guide investors against it? These are interesting questions that require further research for the benefit of current and prospective investors.
This study will give a better understanding of the pricing anomalies and will also identify the factors responsible. The research questions are also interesting in the sense that; it will enlighten us on the underlying reasons and biases that cause some people to act irrationally even when it is against their best interest. In addition, understanding both the market and the market participants will help financial planners’ better advice their clients about the less obvious risks and pitfalls associated with their irrational impulses and personality traits.
A better understanding of behavioural finance and its consequences can aid better management of expectations and enhance the construction of strategies that incorporate insights about irrational investors’ behaviour. Above all, the knowledge acquired during the course of this research will help investors make well informed investment decisions in future.
The capital market is a very busy one with numerous activities, the market may be favourable to some and unfavourable to others while some play safe in the middle (i.e. they neither gain nor lose). The actions of the participant considering the situation of the market at a particular time determines the category they fall in. Many individuals find investments to be enthralling because they can participate in the decision-making process and see the results of their choices. Unfortunately, not all investments will be profitable, as investors’ whims not always result in fruitful returns. Activities in the capital markets affects individuals such that they make irrational and unexplained decisions which expose them to higher risk that may result in investment loss. Various scholars have documented evidences to show how psychological biases and personality traits impact stock returns negatively.
Scholars identified that behavioural finance evolves from two building blocks: cognitive psychology and the limits to arbitrage. “Cognitive psychology refers to how people think, while limits to arbitrage refers to predicting in what circumstances arbitrage forces will be effective, and when they won’t be” (Ritter 2003: 429).
There is a huge psychology literature documenting that people make systematic errors in the way that they think. Verma et al evidence concluded that “investors’ error is a significant determinant of stock returns” (Verma et al 2008: 1303)
Cognitive psychologists have documented patterns that enabled the classifications of individuals into different personality traits and the study of these traits also revealed its effects on investment decision making. Some of the personality traits exhibited by investors are heuristics (or rules of thumb), overconfidence, risk tolerance, herd behaviour, etc. These behaviours are said to create distortions in investment decision making and in most cases impact stock returns negatively. It is also said to result in stock mispricing which may be left unchallenged as a result of the limit to arbitrage activities.
In principle, any example of mispricing is immediate evidence of behavioural finance. If investors truly are rational and decision making utilizes all available information, then mispricing wouldn’t have occurred in the first instance. Situations like the early 2000 stock market bubble burst and the 2008 housing bubble burst in the United States are typical examples of behavioural finance grave consequences.
The growth of behavioural finance research has been mainly fuelled by the inability of traditional finance to explain many empirical patterns, including the stock market bubbles mentioned earlier.
Most research work focused mainly on the likely patterns exhibited by investors, how these patterns can be detected and the consequences and impacts of these psychological biases on stock returns. While the factors mentioned above can alleviate biases to some extent, there is little evidence that they wipe them out altogether as the result of learning is often limited by errors of application. When the bias is explained, people often understand it, but then immediately proceed to violate it again in specific applications. Expertise too is often a hindrance rather than an asset; as experts, armed with sophisticated models, have been found to exhibit more overconfidence than laymen. The application of the knowledge derived from the study and effect of behavioural finance have only been explored by few scholars. This area should be richly explored as knowledge without implementation is a waste. Researchers should extensively carry out research work that will enable the incorporation of behavioural finance knowledge into investment decision making strategies. In addition, they should also extensively explore the possibility of predicting future mispricing.
The objective of this research is to complement existing literature by examining the cognitive psychology of investors when making investment decisions and then relate it to the Nigerian capital market. This helped in identifying some of the factors responsible for an inefficient capital market in the country. It also revealed, through the administration of structured questionnaires to investment managers and the analysis of findings, how the psychological biases identified in the literature search impacts stock returns.
This research further tested the presence of herd behaviour in the Nigeria capital market by examining the daily data of stock returns of fifty listed companies in the Nigeria capital market from January 2006 to March 2016. These companies were selected from ten major sectors as follows; banking, brewery, building, conglomerate, beverage, construction, food, insurance, health care and oil majors. To test for the presence of herd behaviour in the Nigeria capital market, Christie & Huang (1995) and Chang et al. (2000) approaches will be adopted. Details of the procedures and measurement are described in the methodology section.
Lastly, in the event of herd detection on the empirical analysis, a supervised machine learning model will be developed to check if the presence of herd behaviour can predict future mispricing thereby guiding investors into making well informed investment decisions. Otherwise, the studies will conclude on findings and suggest other research areas.
Findings from the research revealed statistically significant impact of heuristics, overconfidence and herd behaviour biases on investor’s stock returns in the Nigeria capital market. Risk tolerance however does not significantly impact stock returns amongst Nigeria investment managers. This simply implies that investment managers in Nigeria are less risk averse, they are more risk tolerant and will be willing to take risk for long term benefits. Also, evidence of herd behaviour was not found in the stock returns of the entire portfolio. This may be attributed to insufficient data and would probably yield a different result if evaluation covered the stock returns of all the companies in the Nigeria capital market.
In section 2, I will review existing literature and examine the cognitive psychology of investors when making investment decisions and the subsequent effect this has on price and stock returns, relating this to the Nigerian financial market. This will help in understanding some of the factors responsible for an inefficient financial market in the country. In section 3, I present the data gathering, methodology and the estimation model for the empirical test carried out to identify the presence of herd behaviour of listed firms in the Nigeria capital market. Section 4, will present the analysis of data, interpretation of findings and check the possibility of using the existence of herd behaviour to predict future mispricing. And lastly, in section 5, the study will summarize, conclude and suggest further research areas.
CHAPTER TWO
LITERATURE REVIEW
Although behavioural finance is just emerging, the amount of research work and studies that have been carried out in this area is unbelievable; this emphasizes how important it is.
Studies have revealed that human psychology impacts on decision making which may result in deviations in price from fundamental value and consequently impacting on returns. Scholars, such as Kahneman and Tversky (1979), believed that
“the study of psychology and other social science theories can shed considerable light on the efficiency of financial markets, as well as explain many stock market anomalies, market bubbles and crashes”
(Kourtidisa et al. 2011: 548)
Although the relevant literature suggests that there are many factors that influence investment decisions, this search will however explore 4 important psychological biases and personality traits and their respective impacts on stock returns.
2.0. Theoretical Model


Heuristic Bias
Overconfidence Bias
Risk Tolerance
Herd Behaviour


Stock Mispricing
Investment Decisions


Stock Returns

2.1. Heuristic Bias
According to scholars, heuristic biases are mental shortcuts or rules-of-thumb which people apply to solve complex problems which simplifies the decision making. Although this type of mental process sometimes leads to satisfactory decisions, for example, a gambler on a winning streak, however, “complete reliance on heuristic judgment can result in bias or mistaken judgments thereby resulting in severe and systematic errors” (Taversky and Kahneman 1974: 1124).
Study revealed that most people approach investment decisions by diversifying their portfolio; that is they share their capital equally among investment options; this approach is referred to as the 1/N heuristics. Benartzi and Thaler (2001: 79-98) observed retirees and how they invested their retirement savings, result revealed that they spread their contributions evenly across investment options irrespective of the particular mix of options in the plan. Although diversification is beneficial and it is considered as the strategic approach to mitigate risk, however the choice of the wrong asset allocation may result in grave consequences on stock returns. Investors apply this approach even without reviewing the investment options to determine the most profitable one. People believe that portfolio diversification is enough to manage risk. Harry Markowitz, a pioneer in the development of modern portfolio theory acknowledged that he used the rule. He justified his choice on psychological grounds:
“My intention was to minimize my future regret, so I split my contributions fifty-fifty between bonds and equities”
(Zweig, cited in Benartzi and Thaler 2001: 80)
unfortunately, this may not work out as anticipated.
The 1/N heuristics is still in use till date even by the professionals. My personal portfolio manager advised me to diversify my investments without giving any portfolio selection advice; this I did blindly out of naivety and at the moment my total portfolio has declined by over a 60% margin.
Kahneman and Tversky (1974: 1127) researched on the availability biases approach adopted by investors when judging the likelihood of an event occurring, they argued that people often search their memories for relevant information. Rather than weighing all potential information equally, investors have a propensity to rely on information that might more easily come to mind. According to research, not all memories are retrievable or available and the emotional connection that one has with the memory of a particular event may interfere with judgment. For example, a recent event will weigh and distort judgment more than an event one can barely remember.
Studies revealed how investors associate high levels of press coverage about companies with continued strong performance. Da Silva et al. (2008: 78-94) examined the investment approach adopted by business students in Australia and found that availability heuristic drove portfolio formation decisions. That is the more news stories that appeared in the national press about a company the more likely that company’s stock would be included in the students’ respective portfolios. They found that the availability heuristic explains portfolio formation decisions than firm size. Lakonishok et al. (1994: 1541-1578) studied and compared the performance of the stocks of the firms’ investors considered to be bad against those they considered as strong as a result of their respective publicity; they found that the average total return over a five-year period was 81.8% for strong firms and 143.4% for firms considered bad.
Gadarowski (2002: 1-42) examined how the level of news count predicts expected returns by analysing US stocks; his findings revealed that persistently mispriced firms tend to have high levels of press coverage due to investors’ availability heuristics bias. In addition, his findings further revealed that high news count predict lower subsequent returns, in other words, stocks of such firms were overvalued and did not reflect the true market price hence investing in such stocks resulted in lower returns. This confirms the adverse effect availability heuristics could have on investors’ returns.
The representativeness heuristic bias is another approach used when making judgments about the probability of an event under uncertainty. Like other heuristic approaches, it may also lead to bad choices. According to Kahneman and Tversky (1974: 1124) “people rely on representativeness heuristics when making probabilities judgment, they estimate probability by the degree to which ‘A’ reflects the characteristics of B”. This hypothesis was tested in an experiment where prior probabilities were manipulated and provided to two different groups of respondents where each group was availed two different probability values. They were asked to assess individuals based on some descriptions and give probabilities that they belong to one of the two specified professions. It was observed that the two groups produced the same probability judgments considering that their prior probability values were different. Respondents evaluated the probability that a particular description belonged to a profession by the degree to which this description was represented, without considering the prior probabilities of the groups or their respective sample sizes. However, investment decisions based on representativeness bias may have severe implications on returns. For instance, investors may consider recent past returns of a stock to be representative of what to expect in the future and therefore buy stocks that have recently increased in price which may later go bad. De Bondt and Thaler (1985: 793-805) showed how stocks tagged as losers based on past performance outperformed stocks tagged as winners by a margin of 30%.
Dhar and Kumar (2001: 2-40) investigated the impact of price trends on the trading decisions of more than 40,000 households and found that both buying and selling decisions of investors are influenced by short term price trends. Their studies revealed that investors prefer to buy stocks that had recently enjoyed some positive returns. This is consistent with the thinking that the past price trend is indicative of the future price trend.
Chen et al. (2007: 425-451) used brokerage account data and found evidence that investors considers recent past returns to be representative of what to expect in the future. In a country like Nigeria where the opportunities are limited, using representativeness to make judgment is highly unrealistic; profession or career doesn’t reflect personality as opportunities are limited. Relating this to a financial setting, using representativeness as a base of probability measure in determining one’s personality trait based on the profession will definitely yield an error. The fact that the stock returns in an industry is abating does not necessarily mean that all the stocks of various companies in that industry will be affected. Some companies stock will still be performing well. An example is the current banking sector stocks in Nigeria which have been continuously declining daily; about two of the companies in the same industry have stocks that are appreciating. Representative heuristics if applied in this case will give a false estimate.
2.2. Overconfidence Bias
Overconfidence is
“an overestimation of the probabilities for a set of events”
(Mahajan 1992: 330).
Extensive evidence shows that people are overconfident in their judgments. Scholars such as Barber and Odean 1999, Chean et al 2004, Kahneman, Slovic and Tversky 1982, Yates et al. 1989, etcetera all have documented evidences to show that human beings are overconfident about their skills, and future prospects.
Roland Benabou (2013: 431) argued that “overconfidence occurs when people make insufficient use of available information”. Akerlof and Shiller (2009: 155-157) on the other hand deduced that after processing information, in most cases people still act against the findings of the information. In fact, research revealed that information plays little or no role in many financial decisions. Information is said to be considered when it is consistent with the investors preferences and ignored when it is not; consequently, investors may remain optimistic in spite of negative signals. Taylor and Brown (1988: 193-210) concluded in their studies that “people hold unrealistic positive self-evaluations hence they become more susceptible to unpleasant surprises”.
Overconfidence may stem from two biases; self-attribution bias and hindsight bias.
Self-attribution bias
“is a tendency among individuals to attribute successes or good outcomes to their abilities, while putting the blame for failures or unfavourable outcomes on circumstances beyond their control or plain bad luck”
(Miller and Ross 1975: 218).
A lot of people think highly of their investing ability, they believe they can be accurate in timing and in selecting the right stock. Naturally stocks do well when the economy is favourable or when the market is rising including those selected by investors, most of these investors will take this as a confirmation of their skills. Conversely, when their stock drop in price, they attribute failure to external factors.
Gervais and Odean (1999: 1-54) examined how traders learn about their ability using their respective level of successes and failures and how this knowledge instigates some irrational behaviour. They found that the traders attributed success to their skills and took too much credit for individual successes hence become overconfident. Their studies further revealed that overconfidence does not lead to greater profits, but rather greater profits leads to overconfidence; as the level of success increases, investors tend to be more overconfident ascribing success to personal capabilities.
Hoffmann and Post (2014: 23-28) empirically tested self-attribution bias among brokerage clients using a combination of survey data and matching trading records of a sample of clients from a large discount brokerage firm, they found that
“the higher the returns in a previous period are, the more investors agree with a statement claiming that their recent performance accurately reflects their investment skills and vice versa”
(Hoffmann and Post 2014: 23)
Hsu and Shiu (2010: 217-239) analysed the investment performance of 6,993 investors bidding in 77 discriminatory IPO auctions in the Taiwan stock market between January 1996 and April 2000, and found that the first few bids of frequent investors typically exhibit good investment performance. However, their performance deteriorated as the number of bids placed increased. Their study concluded that frequent investors succeed in their first few bids, leading them to improperly revise their beliefs and become overconfident. In other words, frequent investors are excessively optimistic about investment prospects, causing them to bid more auctions and more aggressively than rational investors. Self-attribution bias prevents investors from weighing risk properly and then become more susceptible to negative surprises.
Hindsight bias is the tendency of people to believe, after an event has occurred, that they predicted it before it happened.
“The human mind is said to be a pattern-seeking device, and it is strongly bias to adopt the hypothesis that a causal factor is responsible for any notable sequence of events”
(Kahneman and Riepe 1998: 6)
Whereas in the real sense people can hardly reconstruct their initial evaluation of an event, after the event has occurred. This brings in to question how people can possibly believe that they predicted the future when they can hardly remember their past evaluation. This bias results in overconfidence as it makes investors believe that they can predict the future hence they are not surprised by new information as they think they knew it all along. It therefore hinders information processing and prevents optimal usage of new information thereby resulting into sub-optimal decision.
Danz et al. (2013: 2-38) conducted an experiment during the FIFA World Cup 2010 to show how hindsight bias affects delegation of decisions. They asked participants to predict outcomes of the on-going World Cup and to recall their assessments after the outcomes had been realized. Their answers were used to measure and control for hindsight bias for each participant in the experiment. Participants were further asked to make choices in a delegation game, and their findings revealed that participants earlier identified with hindsight bias trait failed to delegate optimally than participants without hindsight bias. In a financial setting, this bias result in the formation of sub-optimal portfolio.
In another study that tested how hindsight bias hinders learning under uncertainty by Biais and Weber (2009: 1018-1029), subjects were informed of the current prices of several assets and were expected to predict the price of these assets one week later; when asked to recall their prediction after being informed of the actual price, subjects underestimated volatility. Another experiment involving investment bankers, revealed that more biased agents have lower performance. This is consistent with Barber & Odean (2001) and Chuang & Lee (2006) studies which argue that overconfident investors underestimate risk and trade more in riskier securities. In addition, the knowledge of this bias does not eliminate it. Hindsight bias impedes learning from the past; it prevents investors from recognising that their view of the market was wrong hence cut their losses when it is optimal to do so.
Gilovich et al. (1985: 295-314) studies illustrated the hot hand fallacy of professional basketball players as an illusion. They investigated the origin and validity of “the hot hand” and “streak shooting” by observing basketball players and fans who believed that a player’s chance of hitting a shot are greater following a hit than following a miss on the previous shot. Conversely, detailed analyses of the shooting records showed no evidence of positive correlation between the outcomes of successive shots. Relating this to finance, the same
“psychological quirk causes investors to perceive trends where none exist, and to take action on these erroneous impressions”
(Gilovich et al. 1985: 6).
All these experimental results revealed that investors are likely to detect patterns in stock prices even if stock prices follow a random walk. Hindsight bias promotes overconfidence because it makes investors overrate their knowledge about the value of a security.
Overconfidence materializes in a number of ways such as; excess trading activity. Researchers such as Deaves et al. (2005), Grinblatt and Keloharju (2009), Daniel et al. (2001), Hirshleifer and Luo (2001), Wang (2001) and Scheinkman and Xiong (2003) have evidences to show that overconfidence result in excess trading. Odean (1998: 1775-1798) showed that overconfidence investors trade more than rational investors and that doing so lowers their expected utilities. Barber and Odean (2001: 261-292) in a subsequent research empirically tested this by partitioning investors on gender and using account data for over 35,000 households from a large discount brokerage, they documented that men trade 45% more than women and trading reduces men’s net returns by 2.65% points a year as opposed to 1.72% points for women. The analysis of Yenshan and Cheng is also consistent with this empirical evidence; as their results revealed that the net return of “infrequent bidder is 9.36%, whereas the return for an average frequent bidder is 4.48%; a reduction of over 50%” (Yenshan and Cheng 2010: 228).
John and Dimitris (2007: 531-577) examined whether acquisitions by overconfident managers generate superior returns, using two alternative measures of overconfidence; high order acquisition deals and insider dealings, their findings revealed that overconfident bidders realize lower returns than normal bidders.
Minimal diversification in investors’ portfolios is another indication of overconfidence. Overconfident investors are plagued by the tendency to invest only in stock they are familiar with. A higher percentage of Nigeria investors invest only in local stocks, even though it is bad from a diversification standpoint. Research shows that people invest way too much in the stock of the company that they work for; since they work for the company, they believe they know all the information pertaining to the company and can use it to their benefit hence they become overconfident.
In behavioural finance, overconfidence has been established as a prevalent psychological bias, which can make markets less efficient by creating mispricing in the form of excess volatility. The housing bubble in the United States in 2008 is a consequence of overconfidence with investors believing that mortgage securities are stable and are risk free since it is a tangible security. The bubble was an eye opener that no security is beyond volatility.
2.3. Risk Tolerance Bias
This is defined as the
“maximum amount of uncertainty that someone is willing to accept when making a financial decision”
(Grable 2000: 625).
Even though people’s degree of tolerance to risk varies, research revealed that we are all affected by some biases that make us susceptible to wrong decisions under uncertainty.
Kahneman and Riepe (1998: 10) have evidences to show that people place different weights on gains and losses and on different ranges of probability. Individuals are much more distraught by prospective loss than they are happy by equivalent gain. Their findings revealed that people weigh possible loss 2.5 times more heavily than possible gain. For instance, people consider the loss of $1 dollar twice as painful as the pleasure derived from a $1 gain; as a result of this fear, investors are willing to take more risks to avoid loss than to increase gains. This bias is referred to as the “Disposition Effect”
“a marked reluctance of investors to realize their losses”
(Kahneman and Riepe 1998: 13).
People naturally avoid actions that create regret and seek actions that promote pride even though the action at the long run may not be favourable.
Benartzi and Thaler research designated a term called “myopic loss-aversion which refers to the tendency of decision makers to weigh losses more heavily than gains; losses hurt roughly twice as much as gains feel good. They added the adjective ‘myopic’ because even investors with long-term horizons appear to care about short-term losses hence are susceptible to this bias” (Benartzi and Thaler 2007: 94).
Chen et al. (2007: 425-451) evidence used brokerage account data from China to study investment decision making in an emerging market, they found that Chinese investors made poor trading decisions as the stocks they purchase underperform those they sell, in addition, they tend to sell stocks that have appreciated in price, but not those that have depreciated in price consistent with the disposition effect failure to acknowledge losses.
Finance literature finds that investors often sell stocks that have performed well so that they can feel good about themselves. At the same time, investors tend not to sell their poorly performing stocks because they are not ready to acknowledge that they made a mistake and because they are afraid the stock might start appreciating after they may have sold it at a loss. This bias drives Kahneman & Tversky (1979) research on prospect theory that stipulates that “faced with sure gain, most investors are risk-averse, but faced with sure loss they become risk-seekers” (Kahneman and Tversky 1979: 268).
Scholars also found that individuals will respond differently to equivalent situations depending on their perception of the situation; that is how the situation is framed. For instance, if investors are faced by two different equivalent choices where one is perceived/framed in terms of gain and losses and the other in terms of the final wealth, the context in which these are perceived will determine the decision the investor will make. This according to Richard Thaler is referred to as mental accounting “where the mind keeps track of gains and losses on each stock held rather than at the portfolio level” (Thaler 1999:183). Investors usually use stock purchase price as the reference point and take the decisions to trade particular stocks, based on the difference between the current price and purchase price; i.e., reaction to changes in price is determined by the initial purchase price. If the difference between purchase and current price is high and positive, they sell the stock, but if the difference is small or negative, they continue to hold the stock in their portfolio. What this implies is that when investors need funds, they prefer to sell stocks that have shown an increase in value even if the expected increase may continue in future and they avoid selling stocks that have decrease in value. In other word investors are more inclined to sell stocks the moment there is an increase in price but will rather hold-on to the stock with a price drop and continually hope the price appreciates.
Research however revealed that a rational investor will analyse the opportunity based on the final wealth, while an irrational investor will decide based on the gain and losses. Scholars considered the final wealth consideration as broadly framed while gain and loses are considered to be narrowly framed.
2.4. Herd Behaviour
Herding simply put is mimicking the actions of others. According to scholars, an individual is said to herd if his/her decision is determined by the actions of others. That is
“if s/he would have made an investment without knowing other investors’ decisions, but does not make that investment when s/he finds that others have decided not to do so”
(Bikhchandani and Sharma 2000: 280).
Herding is more likely during forecasting of earnings. Since earnings are the primary interest of investors, the need to have an objective forecast is very essential. If forecasts are affected by herding, estimates can become bias and may lead to suboptimal investment decisions.
There are evidences that indicate the reason people herd, some of them include information-based, reputation-based, preference for conformity, etc.
Bikhchandani et al. showed how “people herd and cascade information and once a cascade starts, individuals ignore or abandon their private information. Their findings revealed that if the respective private information available to investors were to become public knowledge, information would reflect the true position of the investment opportunity” (Bikhchandani et al. 1992: 1000).
Asch Solomon in his experiment revealed our people acquire information by observing actions of others in their group. One of the subjects in his experiment was quoted thus
“to me it seems I’m right, but my reason tells me I’m wrong, because I doubt that so many people could be wrong and I alone right”
(Asch 1952: 464).
In addition, Morone and Samanidou also revealed through their study that in “a sequential game, where the first two players have chosen the same action, player 3 and all subsequent players will ignore their own information and start an irreversible herd” (Morone and Samanidou 2008: 639-646). This further strengthens previous findings that investors really do ignore their personal signals and follow the crowd because they believe that their information is inadequate and other investors have better knowledge of the opportunity which they reflect through their actions. Hence investors ignore their own information which may however result in a more profitable decision, to adopt the information of others.
Keynes argued that “investors will follow the herd if they are concerned about how others will assess their ability to make sound judgments” (Keynes, cited in Scharfstein and Stein 2000: 465), they are reluctant to act according to their own information and beliefs due to the fear that their decision may fail which will in-turn damage their reputation as sensible decision makers. In other words, investors, would welcome failure if it’s peculiar to everyone in the market rather than nurture the chance of succeeding alone.
Cote and Sanders (2001: 20) used a field experiment to empirically test for herd behaviour. Their subjects were drawn from a population of professional investors who combine assets to construct a jointly managed equity portfolio. The subjects were given information about a specific company, including a consensus analysts’ forecast, and were asked to generate earnings predictions. Their findings indicated that forecasters who highly valued their reputation among their peers engaged in herding behaviour.
Trueman (1994: 97) also argued that the desire to avoid being labelled as a noise trader motivates investors to engage in herding behaviour. In Trueman’s experiment, he showed how analysts exhibited herding behaviour by releasing forecasts similar to those previously announced by other analysts, even when the information doesn’t justify their forecasts.
According to the theories of opinion conformity, majority opinion can influence an individual’s private beliefs. Investors whose opinions deviate from the majority are quick to search for an explanation for the deviation. If the majority opinion source is considered credible, the investor will discard her private opinion. Asch (1952: 467) carried out social experiments and showed how people tend to follow others, and neglect evidence and available information. In Asch’s most famous experiment, subjects became very upset by the discrepancy between their perceptions and those of others, and most of them succumbed to the pressure to conform. Recently this experiment was repeated in different countries and “between 20% and 40% of the subjects in all of the countries tried to adapt their views to others’ answers” (Sunstein 2002: 10).
Investors may find it easier to follow the crowd and buy a popular stock, in the event of a price drop, it can be rationalized and termed as an unusual outcome or a case of bad luck. Going against conventional wisdom is harder since it raises the possibility of feeling regret if the decision proves incorrect. An example is the ‘who wants to be a millionaire show’ when the lifeline of ‘ask the audience’ is used by the contestant, the option that amassed the highest vote is often picked irrespective of the contestant private information. Since herding cannot be detected until after it has occurred, investors do not have the opportunity to have a rethink of their decision, they just move with the trend to avoid regret and if they do not succeed they can at least justify their actions by consoling themselves that the loss was general.
When market participants herd around the market consensus, asset price deviates from economic fundamentals. Consequently, assets become mispriced and do not reflect its true value thereby resulting in bubbles and sudden crashes.
According to existing studies, herding impact on the capital market is measured by level of dispersion between investors’ stock return and the market stock return. So, when individual returns stray away from market returns, then herding is absent. But when stock returns do not diverge from market returns, herding is present.
The belief that investors herd during the periods of extreme market movement conflicts with the predictions of rational asset pricing model, the latter shows empirical evidence that during extreme market movement there is increase in dispersion level between investors’ stock return and the market return due to the difference in sensitivity between investors stock and market return. Result from same research also “revealed that dispersion increases much more in the upper market than the lower market” (Christie and Huang 1995: 31-33). This result can be compared with another research which tested herding in developed and developing financial markets under the same extreme market movement condition but “found evidence of herding only in the developing financial market” (Chang et al. 1999: 1668-1672) thereby confirming the presence of herd behaviour. Judging from this contribution, it implies that herd behaviour is more prominent in a developing market.
Tan et al. (2008: 61-77) examined herding behaviour in dual listed Chinese A and B share stocks and found evidence of herding within both the Shanghai and Shenzhen A-share markets that were dominated by domestic investors, and also within both B-share markets dominated by foreign investors. Herding was also found to occur in both rising and falling market conditions. Another study carried out by Chiang and Zheng (2010: 1911-1921) also linked presence of herd to extreme market conditions. They examined herding behaviour in eighteen countries using daily data from May 1988 to April 2009 and found that herding exists in advanced stock and Asian markets, with evidence suggesting that crisis triggers herding activity in the crisis country of origin and then produces a contagion effect which spreads the crisis to neighbouring countries.
Chang et al. (1999: 1651-1679) in their research however linked herd formation to macroeconomic activities. They examined investment behaviour of market participant within different international markets and found no evidence of herding in US and Hong Kong, partial evidence in Japan and statistical significant evidence in South Korea & Taiwan. They observed that macroeconomic information rather than firm-specific information tends to have more significant impact on investors market behaviour which exhibit herding and that the rate of increase in stock return dispersion in relation to the aggregate market return is higher in up market in comparison to down market thereby corroborating existing findings.
One of the challenges associated with the approach described above is that it requires the definition of extreme returns. In practice, investors may differ in their opinion as to what constitutes an extreme return, and the characteristics of the return distribution may change over time. In addition, herding behaviour may occur to some extent over the entire return distribution, but become more pronounced during periods of market stress, and the Christie and Huang method captures herding only during periods of extreme returns.
Although most existing studies ascribed psychological factors as the drivers of investors’ irrational tendencies, but some studies revealed that non-psychological factors could equally prompt irrational tendencies. For instance, information asymmetries and interpretation disparities may also induce irrational biases. Elena Ranguelova (2001: 27-29), found evidence that disposition effect is nonexistence in the lower decile stocks as the propensity to sell losers is higher than the propensity to sell winners. This evidence challenges the current literature of the disposition effect. Certainly, this requires further research to establish a more generalized finding that is independent of market size and structure.
In addition, most literature focused on individual behavioural biases and there were little or no studies from the institutional perspective; observing behavioural tendencies from an institutional perspective may reveal surprising findings that may challenge existing literature. Furthermore, earlier studies concluded that herding is absent in developed capital market and more likely to occur in developing and emerging capital market, could this be as a result of the developed market accessibility to more and experienced analyst than a developing or emerging market? this will be an interesting question that require further research.
Finally, all the irrational biases discussed earlier have the potential to influence asset prices, for instance, the tendency to refrain from selling losers may slow the rate at which negative news is translated into price, so also is the tendency to buy stocks with recent high performance could cause winners to overshoot. Hence, the need for investors to be fully knowledgeable on the pitfall of these biases is essential.
CHAPTER THREE
DATA AND METHODS
3.0. Introduction
The objective of this study was to observe investment managers and identify different psychological biases and personality traits that they exhibit, and then examine if there is a relationship between these biases and stock returns, test hypothesis and quantify if investors really suppress their own beliefs and base investment judgment on the market trend and finally, if herd behaviour is detected, check if it can be used to predict future mispricing thereby guiding investors against it.
3.1. Research Design
The study adopted a quantitative research design using survey and longitudinal data of daily stock return from November 2006 to March 2016 making a total of 2,213 observations each for 50 listed companies in the Nigeria capital market.
3.2. Data collection method
The data for the study was gathered using primary and secondary approach. The primary method made use of a structured questionnaire targeted at individuals that actively invest in the Nigeria stock market to capture and identify individuals’ investment behaviours. The questionnaire (see appendix) was structured based on existing studies such as Kahneman and Riepe (1998), Tversky and Kahneman (1974 & 1979), Kourtidisa et al. (2011), Mittal and Vyas (2009), Nagy and Obenberger (1994), Bhandari and Deaves (2006), Shiller (1998), Tversky and Thaler (1990) to identify different psychological biases exhibited by investment managers. Before the questionnaire was distributed, an extensive pretesting was initially carried out with few selected investment managers to review and improve the format of the questions to enable easy understanding, and was thereafter distributed via an online survey platform, while the link to access the platform was communicated via email to investment managers who worked in various investment and securities company all over the country. The respondents are registered dealers with Nigeria Stock Exchange (NSE) and their addresses were gathered from the NSE’s website. A total number of 217 registered investment and security companies were contacted via mail with the directive that the link to the survey be forwarded to only investment and portfolio managers within each company.
Several proponents of behavioural finance assessed individual investment behaviour through questionnaire survey. Scholars such as Dimitrios et al (2007: 32-50) used mixed approach adopting both questionnaire survey and a series of interviews to examine the methods and techniques used by various Greek investors when making stock investment decisions. They also analysed the consequences of these methods on investors’ performance.
Kourtidisa et al. (2011: 548-557) carried out their research through a structured questionnaire that were distributed to individuals who make stock transactions and grouped them using cluster analysis into different segments based on their psychological biases and personality traits. They thereafter examined how these biases and traits drive their investment behaviour. Chandra and Kumar (2012: 141-158) also used survey data of individual investors to confirm the psychological biases that motivates individual investors’ behaviour in India and the extent to which they are influenced by select psychological biases.
Prior studies in this research area formed the basis of the use of survey in this study to group investors according to their respective behavioural responses to the four different biases earlier mentioned. This study will examine how these biases interrelate, and finally measure the relationship between these biases and stock returns. The online survey approach allowed easy accessibility and enabled maximum geographical distribution. It also ensured easy data gathering and prevented loss of data.
The secondary approach in this study adopted the use of daily price data from November 2006 to March 2016 to analyse herd behaviour amongst Nigeria stock investors. The data was collated from the Central Securities Clearing System Limited database which is the centralized depository, clearing and settlement infrastructure for the Nigerian Capital Market. Some companies’ daily price data were incomplete and inconsistent hence they were omitted and the data collected covered the daily stock prices of 50 listed companies out of the 174 listed companies in the Nigerian capital market a total of 2,213 trading days. To get a well-represented sample, the 50 companies were selected across all sectors in the Nigerian economy. This data was used to empirically test for the presence of herd behaviour in the Nigeria capital market. The data gathering approach is in-line with existing studies who also adopted similar data type to empirically test for herd behaviour. For example, scholars such as Chang et.al (2000: 1651-1679) examined investment behaviour of market participants within different international markets using daily stock price data that were gathered between different periods with the earliest period ranging from 1963-1997.
Chang and Zheng (2010: 1911-1921) also examined herd behaviour in global markets by applying daily market price indices data for 18 countries ranging from May 25, 1988 through April 24, 2009.
Tan et al. (2008: 61-77) examined herding behaviour in dual-listed Chinese A-share and B-share stocks and Christie & Huang (1995: 31-37) examined if equity returns indicate the presence of herd behaviour on the part of investors during periods of market stress; they used daily and monthly market returns data of firms with shares. These methods formed the use of stock returns data in the study.
3.3. Data Analysis Technique
This study will start by conducting a multiple corresponding analysis using the primary data collected via the online survey platform to examine relationships and associations between levels of psychological biases on 2 principal axes. Multiple corresponding analysis is a similar approach to principal component analysis, the difference between both is the data type; where the former is used to analyse categorical data type, the latter is used for continuous data. The choice of this approach is based on its suitability as it reveals the natural orientation of the survey response and it is also in-line with previous studies, such as Capon et al. (1994: 17-25), Kolenikov & Angeles (2009: 128-165), and Chandra & Kumar (2012: 141-158) who adopted similar approach.
I will proceed by clustering respondents to homogenous groups using K-means clustering analysis in-line with Kourtidis et al. (2011: 548-557) who used K-means cluster analysis to group both individual and professional investors into different segments based on their psychological biases and personality traits. And finally, separate investors into two groups; rational and irrational investors based on the multiple corresponding analysis results. Afterwards, I will use ANOVA (Analysis of Variance) approach to test hypothesis of the difference in mean between both groups and lastly quantify the effect of psychological biases on stock returns. My choice of approach is informed by Barber and Odean (2001: 277) studies that also separated investors into two groups; those more and less prone to overconfidence bias and proceeded by using ANOVA to test whether more overconfident investors have lower returns.
The secondary data will be analysed using existing model by scholars. Two different methods of detecting herd behaviour were proposed by scholars; both used portfolio stock returns dispersion rate from the market return to detect the presence of herd. Christie and Huang adopt the use of the cross-sectional standard deviation (CSSD), which is expressed as:
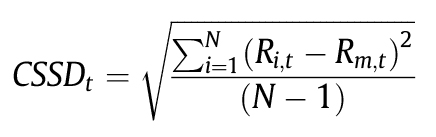
Where N is the number of firms in the portfolio, Ri,t is the observed stock return of industry i at time t, and Rm,t is the cross-sectional average stock of N returns in the market portfolio at time t. The CSSD measures the dispersion rate between individual returns to the realized average market return and it argues that the presence of herd behaviour among investors will result in “an increase in dispersion at a decreasing rate or may lead to a decrease in dispersion when herding is severe” (Chang et al. 2000: 1654), simply put, stock returns will not deviate too far from the overall market return when herding is present.
Christie and Huang suggest that the presence of herding behaviour is more prevalent during extreme market movements as individuals are most likely to suppress their own beliefs and follow the market consensus. This however contradicts the rational asset pricing model theory which predicts an increased level of dispersion during period of extreme market movements
“because individual assets differ in their sensitivity to the market return”
(Christie and Huang 1995: 32).
The conflicting information formed the basis of Christie and Huang empirically test on stock return to reveal the effect of extreme market movements on the level of dispersion.
By applying the formula; 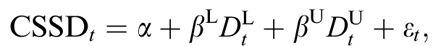 ——-model (1)
Where DtL = 1 if the market return on day t lies in the extreme lower tail of the return distribution and equal to zero otherwise, and
Dtu = 1 if the market return on day t lies in the extreme upper tail of the return distribution and zero otherwise.
They used 1% and 5% of the observations in the upper and lower tail of the market return distribution to define extreme price movement’s days.
The coefficient of β in the formula captured the differences between the two theories; while rational asset pricing model predicts a statistically significant positive coefficient for βL and βu, the presence of herding predicts a statistically significant negative coefficient.
CSSD is however “sensitive to outliers due to the squared return deviations” (Chiang and Zheng 2010: 1912).
Another method was proposed by Chang et al. in later study to refined Christie and Huang method since it only captures herd behaviour during extreme market movement whereas herding may occur over the entire return distribution and to avoid the subjective definition of extreme market movement. Hence this allows “the detection of herd behaviour over the entire distribution of the market return”. (Tan et al (2008: 63).
Through the application of cross-sectional absolute deviation (CSAD) model, which is expressed as:
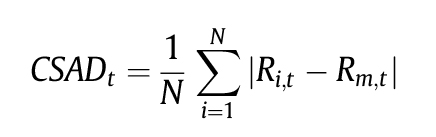
where CSADt is a measure of return dispersion which is measured by the cross-sectional absolute deviation. To detect herd behaviour over the entire distribution of market return, Chang et al. specification was modified to:
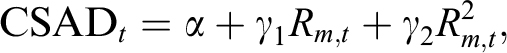 ——–model (2)
where Rm,t is the value of an equal-weighted average stock return in the portfolio at time t, and |Rm,t| is the absolute term. Similar to the Christie and Huang method, the detection of a statistical significant negative coefficient of R2m,t would indicate the presence of herd behaviour.
This study will use both methods to examine the presence of herd behaviour, this is to ensure that the empirical evidence discovered remains consistent irrespective of the approach used.
Stock returns for all the companies were estimated using:
R,t = 100 * (log(Pt) – log(Pt-1)) where Rt is the daily stock return, Pt is the closing price on day t and Pt−1 is the closing price on day t−1, (that is the closing price of the previous day). This is in-line with Chang and Zheng (2010), Tan et al. (2008) who adopted the same formula in estimating daily stock returns and extreme market movement was measured at 1% and 5% also aligning with previous studies. For robustness, to eradicate the effect of outliers on the response variable, the study also used CSAD to check for herd during extreme market movements.
CHAPTER 4
ANALYSIS AND RESULTS
4.0. Survey Response Statistics
The primary data returned 117 respondents yielding a 54% medium response rate which is representative enough as scholars such as Nagy and Obenberger (1994: 64) recorded lower response rate of 27.4%.
4.1. Multiple Correspondence Analysis
Figure 1 reports the result of the multiple correspondence analysis projected onto the two principal axes. The result shows the cloud of categories of the nine attributes that identified the four psychological biases present in the sampled investment managers. The nine attributes were assessed as follows:
- Representativeness and misconception of chance were used to measure heuristic bias amongst respondents in the survey data.
- Familiarity, hindsight, trading frequency, self-attribution and pattern seeking were used to measure over confidence bias.
- Risk averse and disposition effect were used to measure risk tolerance bias.
- And information cascade was used to measure herd behaviour amongst respondents in the survey data.
Figure 1, identified distinct separation from respondents categorized as rational investors and those categorized as irrational investors. Most of the responses that identified irrationality appeared to cluster in the middle with high level of association while responses that identified rationality are in the upper section and extreme corners of the cloud.
Analysis of the association of the heuristic bias, starting with representativeness which recorded right as response for those who do not exhibit representativeness trait and wrong as response for those who do. Results shows a clear distance between both responses where the right response is in the rationality section and wrong (people who exhibit representativeness) is in the middle, confirming that investors who exhibit representativeness bias are irrational.
Response to misconception of chance which was also used to identify pattern seeking attribute in overconfidence investors is represented as HTHTHT and HHHTTT in figure 1, where response of HTHTHT will signify the presence of this bias and HHHTTT an absence of the bias. Result placed the presence of the bias in the middle and the absence of it in the far right, also confirming the presence of this bias in the irrational section.
Analysis of over confidence bias will start by observing familiarity in terms of stock that respondents traded. This was represented in 3 different level; “local stock”, “international stock” and “both market” where interest in local stock will signify the presence of familiarity bias. Result placed local stock in the middle consistent with irrationality section while international stock is seen at the far right and both in the uppermost section implying that “both” has the highest level of rationality.
Hindsight provided response to respondents who believed they can predict the capital market. A “yes” response will signify the presence of this attribute and “no” will indicate absence. The result showed a clear separation between both response, placing “yes” in the mid-left and “no” in the upper right section. Result is consistent with earlier observations.
Response to capture trading frequency seemed to be equally distributed across figure 1. Mid-high and medium frequency are consistent with irrationality while low and mid-low are consistent with rationality. High frequency on the other hand is at the farthest lower section implying that it has the highest level of irrationality. This finding is consistent with existing studies that over confident managers are irrational and are heavy traders.
The last measure of over confidence, “self-attribution” is represented by “mistake” and “bad-luck” in figure 1, where bad-luck indicates the presence of self-attribution and mistake indicates an absence. The result placed bad-luck in the irrationality section with strong association with other irrational measures. The admittance of bad investment choice as a mistake is in the rational section consistent with existing findings.
Analysis of risk tolerance association start by examining the position of risk averse in figure 1. Risk averse is represented by “RA” and the presence of this attribute will indicate that investors sell winners too quickly while the absence is represented in figure 1 as “NRA” meaning not risk averse. Result placed “RA” in the irrationality section and “NRA” in the rational section. Findings is consistent with existing studies which classified risk averse managers as being irrational.
The second measure of risk tolerance used disposition effect to measure how investors act when faced with loss. It is represented in figure 1 as “RS” meaning risk seekers and “NRS” non-risk seekers, where the presence of “RS” will confirm irrationality and “NRS” rationality. The result shows a clear separation from both responses, however, the respondents of the survey are not susceptible to this bias as “RS” is seen in the rational section implying that the investors in the survey data are not reluctant to realize their losses.
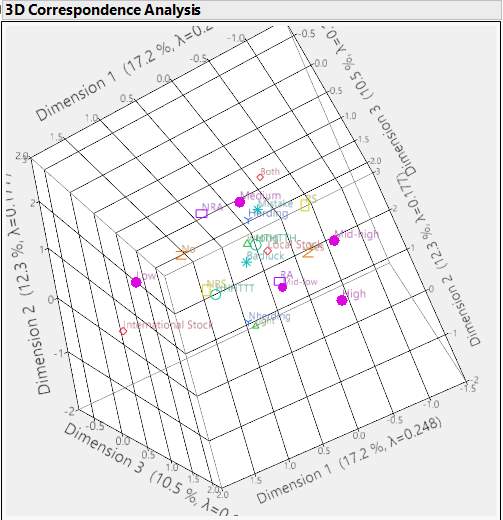
Analysis of the association of the Herd behaviour is represented in figure 1 as “Yherding” indicating the presence of herd behaviour and “Nherding” will indicate an absence. Figure 1 placed “Yherding” in the irrationality section consistent with existing literature that herd behaviour is an irrational psychological bias. The 3D image of the multiple corresponding analysis is captured in figure 2 and this gives a clearer picture of the strong association that exists amongst irrational response to the behavioural attributes. The irrational responses can be seen clustered together in the middle while rational responses are seen at the outer layer of the 3-dimension image.
FIGURE 1
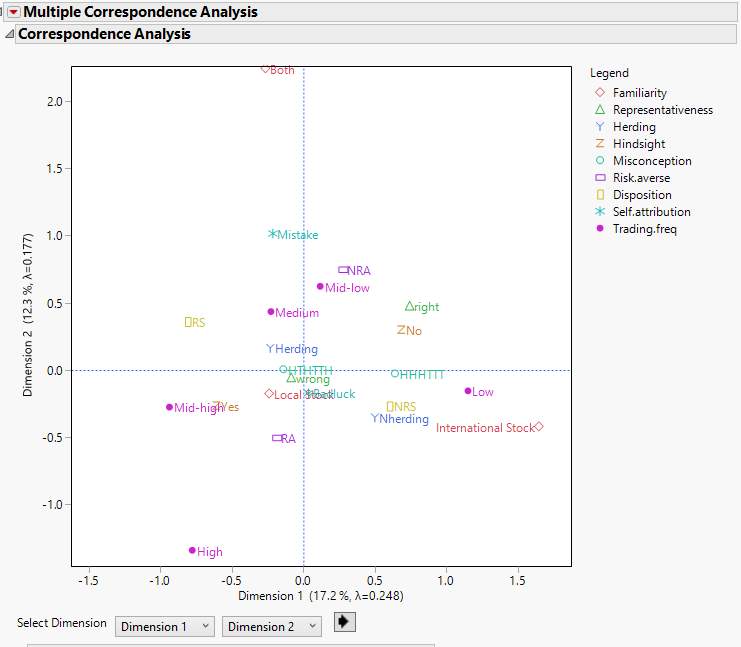
FIGURE 2
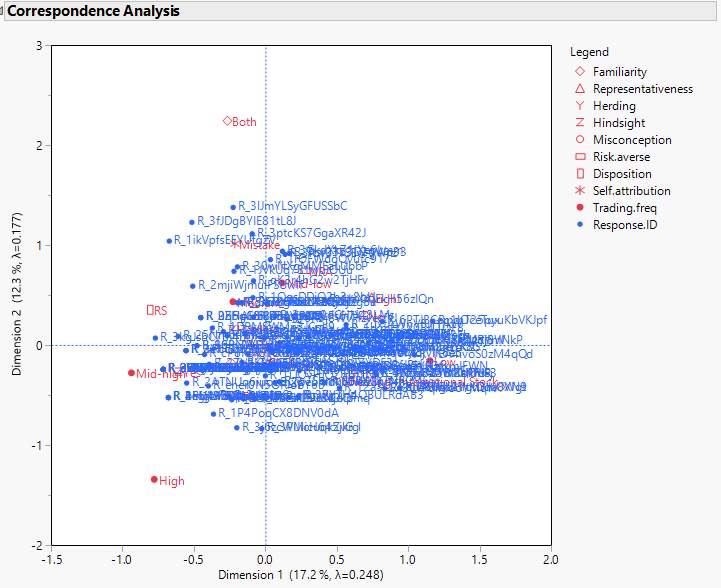
Results of the projection of individual investment manager on the 2-dimension space is reported in figure 3. Each blue point represents an individual, and the middle section that represents irrationality section is highly dense to the point that one can hardly make out the respondent IDs. The denseness fades out gradually as we approach rationality. Therefore, it is safe to conclude that majority of the respondents exhibited irrational biases as reported by the analysis.
FIGURE 3
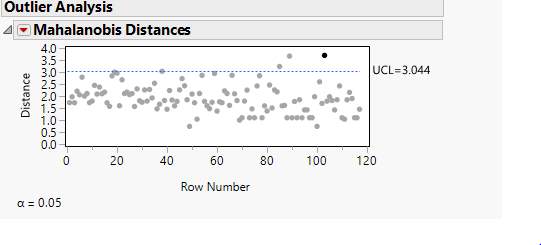
4.2. Outlier Analysis
An outlier analysis using Mahalanobis distance was conducted before running cluster analysis. This is to ensure that clusters formed are not distorted by outliers. The upper control limit of 3.044 revealed a negligible value of outlier, hence none of the data points were excluded from the cluster analysis.
4.3. Cluster Analysis
This study proceeds by conducting K-means cluster analysis to identify homogenous group and measure how each group responds to psychological traits. All variables were standardized to nullify the effect of different measurement scale and cluster analysis was performed on the scaled data sets. A range of 2–5 clusters were tested and the optimal cluster choice with homogeneity amongst the groups was provided by a 3-cluster solution. This suggests that 3 significant subgroups exist within the survey data, each with different level of psychological and personality traits. Table 1 reports the cluster mean and standard deviation of each group, the identified groups were labelled as follows: arrogant managers, modest managers, and naïve managers.
According to Kahneman and Riepe “only two groups of professionals are well calibrated in estimating probabilities and predictions; meteorologists and handicappers at race tracks and that is because they face similar problems every day and that when these conditions are not met, overconfidence should be expected for both experts and non-experts” (Kahneman and Riepe 1998: 3). As shown by the result, all 3 groups have significant level of overconfident bias, however, arrogant managers have the highest degree relative to the other two groups and they also diversify less. This finding is consistent with existing literature that suggests “minimal diversification in overconfident investors’ portfolio” (Barber and Odean 2001: 286). In addition, the arrogant managers are most susceptible to risk tolerance bias in the group, this is also consistent with previous research that “overconfident investors underestimate risk and trade more in riskier securities” (Chuang and Lee 2006: 2500).
Trueman in his study also stated that “overconfident investors are more susceptible to herd behaviour because of the fear of being labelled a noise trader” Trueman (1994: 98), and this can also be confirmed from the cluster analysis result in this study.
Modest managers scored the least in overconfidence and heuristic biases but exhibit risk and herding biases moderately. Naïve managers on the other hand exhibit the highest degree of heuristic bias and are less risk tolerant probably because they trade less frequently. Kourtidis et al (2011: 551) in their research used “K-means cluster analysis to group respondents into 3 groups namely high profile, moderate profile, and low profile investors”; the resulting profiles from their cluster analysis matches the profiles created from this study.
Table 1
Cluster Analysis Profiles
| Psychological Biases | Average
n = 117 |
Arrogant Managers
n= 52 |
Modest Managers
n= 28 |
Naive Managers
n=37 |
||||
| Mean | St.D. | Mean | St.D. | Mean | St.D. | Mean | St.D. | |
| Overconfidence | 9.21 | 1.31 | 9.94 | 0.97 | 8.32 | 1 | 8.84 | 1.35 |
| Heuristic | 4.62 | 1.24 | 0.17 | 0.77 | -1.14 | 0.7 | 0.62 | 0.73 |
| Risk Tolerance | 2.83 | 0.71 | 3.3 | 0.57 | 2.5 | 0.57 | 2.4 | 0.54 |
| Herding | 2.2 | 0.89 | 2.75 | 0.51 | 2.46 | 0.82 | 1.22 | 0.41 |
4.4. Analysis of Variance (ANOVA)
The survey data identified few of the respondents as rational investors based on their responses to specific behavioural questions, the multiple corresponding analysis results affirms this finding as shown in figure 3 where few of the investors lie in the rational section. Hence two groups of investors were created from the survey data; the “rational” and the “irrational” investors. I proceed by using analysis of variance to examine if there is statistically significant evidence that psychological biases impact stock returns and subsequently quantify the variability of returns between the two groups.
I will conduct a two-way hypothesis test with the assumption that behavioural bias does not impact stock return. If this assumption holds, then one would expect that the returns of the irrational investors will be the same as the returns of the rational investors. Where this does not hold true, it will imply that psychological biases truly impact returns and the difference in average returns of the two groups will quantify the impact psychological bias has on stock returns. A positive value will indicate that psychological bias has a positive effect on returns and vice-versa.
4.4.1. Hypothesis Result of Overconfidence Bias
The null and alternative hypotheses are defined below as Ho and Ha respectively.
Ho: Overconfidence bias does not impact stock returns, hence there is no difference in average returns of investors who exhibit overconfidence bias and investors who do not.
In statistical notation: μoc – μN = 0, where μoc represents overconfident investors and μN normal investors.
Ha: Overconfidence bias impact stock returns, hence there is some difference in average returns of investors who exhibit overconfidence bias and investors who do not.
(μoc – μN ≠ 0).
Table 2
Overconfidence Hypothesis Test Result
| Count | Mean | Standard Deviation | P-value | |
| Overconfident Investors | 96 | 3.026292 | 1.384278 | |
| Normal Investors | 21 | 6.986468 | 4.364833 | |
| Difference in mean | -3.96018 | 0.001 |
The result of the hypothesis test revealed that the returns for overconfident investors was 3.96 lower than normal investors and the probability value was statistical significant at 0.001, hence we have statistically convincing evidence to reject the null hypothesis. Therefore, we conclude that overconfidence bias has a negative impact on stock returns as there is difference in average returns of investors who exhibits overconfidence bias and investors who did not. The result is consistent with the predictions of overconfidence models; Barber and Odean results documented evidence that “men are more overconfident than women and that this bias reduces men’s net returns by 2.65 percentage points a year as opposed to 1.72 percentage points for women” Barber and Odean (2001: 261).
4.4.2. Hypothesis Result of Heuristic Bias
Ho: Heuristic bias does not impact stock returns, hence there is no difference in average returns of investors who exhibit heuristic bias and investors who do not.
In statistical notation: μH – μN = 0, where μH represents heuristic investors and μN normal investors.
Ha: Heuristic bias impact stock returns, hence there is some difference in average returns of investors who exhibit heuristic bias and investors who do not. (μH – μN ≠ 0).
Table 3
HeuristicHypothesis Test Result
| Count | Mean | Standard Deviation | P-value | |
| Heuristic investor | 105 | 2.896387 | 2.43 | |
| Normal Investor | 12 | 4.876861 | 1.6 | |
| Point Estimate | -1.98047 | 0.01 |
The result of the hypothesis test revealed that heuristic investors’ returns on the average is 1.98 lower than normal investors with a significant probability value of 1%, hence confirming statistical convincing evidence to reject the null hypothesis. We can therefore conclude that heuristic bias has a negative impact on stock returns as there is difference in average returns of investors who exhibits heuristics bias and investors who did not.
4.4.3. Hypothesis Result of Risk Tolerance Bias
Ho: Risk tolerance bias does not impact stock returns, hence there is no difference in average returns of investors who exhibit risk tolerance bias and investors who do not.
In statistical notation: μRT – μN = 0, where μRT represents risk tolerance investors and μN normal investors.
Ha: Risk tolerance bias impact stock returns, hence there is some difference in average returns of investors who exhibit risk tolerance bias and investors who do not. (μRT – μN ≠ 0).
Table 4
Risk Tolerance Hypothesis Test Result
| Count | Mean | Standard Deviation | P-value | |
| Risk Tol Investor | 70 | 2.600623 | 1.513701 | |
| Normal Investor | 47 | 2.637152 | 1.497991 | |
| Point Estimate | -0.03653 | 0.5 |
Even though the result of the difference in mean revealed a negative value; approximately 0.04 reduction on the returns of risk tolerance investors relative to normal investors, we fail to reject the null hypothesis as the probability value at 50% is insignificant. The lack of statistical evidence to prove the effect of risk tolerance amongst Nigeria investors’ does not nullify the danger of this bias on stock returns as there are several documented evidences that have proven beyond doubt the effects and dangers of this bias on returns. The result of the hypothesis test implies that we have insufficient evidence to conclude that risk tolerance bias has a negative impact on stock returns and the findings may yield a different result if the sample size is increased or if the survey is conducted at a different time.
4.4.4. Hypothesis Result of Herd Behaviour
Ho: Herd behaviour does not impact stock returns, hence there is no difference in average returns of investors who herd and investors who do not.
In statistical notation: μH – μN = 0, where μH represents investors who herd and μN normal investors.
Ha: Herd bias impacts stock returns, hence there is some difference in average returns of investors who herd and investors who do not. (μH – μN ≠ 0).
Table 5
Herd Behaviour Hypothesis Test Result
| Count | Mean | Standard Deviation | P-value | |
| Herding Investor | 80 | 2.492122 | 1.265115 | |
| Normal Investors | 37 | 2.881623 | 0.8 | |
| Point Estimate | -0.3895 | 0.05 |
The result of the hypothesis test revealed that herding bias reduced returns of irrational investors on the average by 0.39 approximately with a significant probability value of 0.05. Hence there is statistical convincing evidence to reject the null hypothesis. This result is consistent with documented evidences that shows reduction in stock returns of irrational investors who exhibit herd behaviour. We therefore conclude that herd bias has a negative impact on stock returns.
Consistent with the research theory, the difference in mean between the irrational and rational investors is negative across the observed psychological traits and majority of the hypotheses tests are statistical significant except for the risk tolerance bias. Considering that the hypothesis test provided convincing evidence, it is safe to conclude that investors’ irrational psychological biases impact returns negatively.
4.5. Empirical Result of the Test for the Presence of Herd Behaviour in the Nigeria capital market
Table 6
4.5.0. Descriptive Statistics of Stock Returns
| Statistics | Market Return | CSSD | CSAD |
| Minimum | -6.264565664 | 0.8681625 | 0.38654906 |
| Maximum | 6.303572554 | 43.6076684 | 20.3449142 |
| Mean | -0.023578832 | 3.05231233 | 2.02828963 |
| SD | 0.681275861 | 2.04479933 | 1.01536571 |
| No. Obs. | 2213 | ||
| No. of companies | 50 | ||
Table 6 summarizes descriptive statistics of the number of trading days, minimum, maximum, mean, and standard deviation values of the market return, cross sectional standard deviation and the cross sectional absolute deviation of 50 companies in the Nigeria capital market. The variation between the minimum and maximum values for all variables are high with the cross-sectional standard deviation (CSSD) having the highest range. This is probably due to the effect of outliers the CSSD estimate is susceptible to. In addition, the CSSD values are larger than the cross-sectional absolute deviation (CSAD) values. The mean of the market return is in the negative implying that the daily return distribution across companies experienced more periods of negative market returns.
4.5.1. Evidence of Herding: CSSD Method
Table 7
Regression coefficients estimated at 1% and 5% market stress level CSSD method
| Criterion for extreme market movement at 1% | Criterion for extreme market movement at 5% | |||||||
| Independent Var. | α | βᴸ | βᵁ | Adj. R² | Α | βᴸ | βᵁ | Adj. R² |
| Coefficients | 2.90792 | 5.90881 | 8.615647 | 0.254 | 2.83526 | 2.13427 | 2.19319 | 0.1003 |
| P-value | 2.2e-16 *** | 0.0038 ** | 0.00015 *** | 2.2e-16 *** | 4.85e-06 *** | 5.75e-05 *** | ||
Notes: the Newey-West heteroscedasticity and autocorrelation consistent standard errors are used for hypothesis testing. ∗∗∗, ∗∗, and ∗ indicate statistical significance at 0, 0.001, and 0.01 respectively.
To check for the presence of herd, I ran a linear multivariate regression analysis on the dependent variable (CSSD) at 1% and 5% criteria of the lower and upper tail of the market return distribution. These two criteria were adopted because the definition of extreme market movement is subjective and examining extreme returns at two different levels will check for consistency across both levels and thus eradicate uncertainty. In addition, I conducted Breusch-Pagan hypothesis test for heteroscedasticity in order to ensure that probability values are accurate and results unbiased, the result revealed the presence of heteroscedasticity, consequently, Neway-West consistent covariance matrix was used to remove heteroscedasticity and ensure reported results are unbiased (Newey and West 1987: 703-708).
Table 7 reports the regression results of model (1), which are statistical significant and consistent with prior research. All the coefficients of βᴸ and βᵁ for both criteria, are positive implying no evidence of herd behavior meaning that the Nigeria capital market traded away from the market consensus during the period under study. Dispersions were higher on days characterized with upper market swing in comparison to days with downturns. These results align with the findings of Christie and Huang who “examined the presence of herd in the U.S. market using the same method and found no evidence of herd formation” (Christie and Huang 1995: 34). Chen empirical result in the global stock markets “using the CSSD method also found no evidence of herd behavior” (Chen 2013: 236).
In addition, the 1% criterion produced larger dispersion estimates than the 5% criterion, i.e. the shorter the interval of the extreme return period, the higher the dispersion estimate. This imply that individual assets are more sensitive when extreme return interval is shorter than when the period is prolonged.
Christie and Huang empirical evidence had similar result “with dispersions increasing significantly during periods of large absolute price changes and much more dramatic increase during up markets relative to down market. Their result also shows higher estimates for the 1% criterion relative to the 5%” (Christie and Huang 1995: 34).
Chen empirical evidence of the global market analysis using the CSSD approach also revealed “no evidence of herd behaviour during periods of huge market swings, he found return dispersions to be most prominent in the frontier markets and least prominent in the developed market” (Chen 2013: 236). This finding is practical in the sense that developed markets have better information processing infrastructure with highly skilled analyst, hence any form of change will reflect faster in the price of stocks in a developed market relative to a frontier market.
Although the cross-sectional standard deviation of return is a good measure for detecting the presence of herd behavior, the estimates from this measure is however sensitive to outliers. To test for robustness, the CSSD in model 1 was replaced with CSAD. The results from the analysis are reported in table 8.
4.5.2. Evidence of Herding: CSAD Method
Table 8
Regression coefficients estimated at 1% and 5% market stress level CSAD method
| Criterion for extreme market movement at 1% | Criterion for extreme market movement at 5% | |||||||
| Independent Var. | α | βᴸ | βᵁ | Adj. R² | Α | βᴸ | βᵁ | Adj. R² |
| Coefficients | 1.95932 | 2.85679 | 4.08106 | 0.2341 | 1.95932 | 2.85679 | 4.08106 | 0.2341 |
| P-value | 2.2e-16 *** | 0.0006491 *** | 0.0001565 *** | 2.2e-16 *** | 0.0006491 *** | 0.0001565 *** | ||
Notes: the Newey-West heteroscedasticity and autocorrelation consistent standard errors are used for hypothesis testing. ∗∗∗, ∗∗, and ∗ indicate statistical significance at 0, 0.001, and 0.01 respectively.
Results from table 8 are statistically significant and it remained consistent with the CSSD estimates. Also, estimating dispersion’s coefficient at 2 different criteria is irrelevant using the CSAD method as the coefficient for both criteria are the same. This finding strengthens Tan et al. studies who proposed “that CSAD method allows the detection of herd behaviour all through the entire market distribution” (Tan et al. 2008: 63).
The explained variance (Adj. R²) estimates from the CSSD and CSAD are low and may be attributed to the use of few independent variables (DL & DU) in the regression model.
4.5.3. Evidence of Herding: Non-linear Approach
Table 9
Evidence of herding non-linear approach
| Independent Var. | α | γ₁ | γ₂ | Adj. R² |
| Coefficients | 1.712213 | 0.32325 | 0.35274 | 0.5422 |
| P-value | 2.2e-16 *** | 5.414e-05 *** | 5.278e-12 *** |
Notes: the Newey-West heteroscedasticity and autocorrelation consistent standard errors are used for hypothesis testing. ∗∗∗, ∗∗, and ∗ indicate statistical significance at 0, 0.001, and 0.01 respectively.
This study further constructed a non-linear model with the intent of checking for consistency and at the same time reduce bias by improving the explained variance estimates. Table 9 reports the regression results of model (2).
Recall that this approach detects the presence of herd over the entire market distribution and a negative value of γ₂ will signify the presence of herd behaviour. The results remain consistent as the estimate of γ₂ is positive revealing no herd detection. In comparison to earlier results, the dispersion estimate of the non-linear approach is smaller. Even though herd was not detected, the effect of the squared market return on asset returns is minimal. Neway-West consistent covariance matrix was used to remove heteroscedasticity and as reported, the probability values are statistically significant. The explanatory power (Adj. R²) improved significantly in comparison to earlier findings and this is because of the
“non-linear model specification which is believed to better capture the interdependence between asset returns and the market return”
(Chang et al. cited in Chen 2013: 238).
The descriptive analysis of the Nigeria capital market revealed a greater percentage of volatile period, it is surprising that the same market has no evidence of herd behavior. This may be attributable to unavailability of sufficient data since only a sample of the total companies in the Nigerian stock market were observed, a different composition of companies may yield a different result. “Tan et al. (2008) empirical evidence of the Chinese stocks differs from that of Demirer and Kutan (2006) who observed the same market and found no evidence of herd on daily data, the difference in the sample of firms accounts for the difference in results” (Tan et al. 2008: 66).
In addition, the Nigeria capital market is a developing market and not as active as the advanced and developed markets, this may be the reason herd behaviour was not detected. Tan et al. (2008) “accounted for trading volume in their model specification and observed that low volume states coefficients were statistically non-significant” (Tan et al. 2008: 69), they also may not have detected the presence of herd behavior if their model did not account for trading activities or if the analysis only covered low volume states. Also, Chen empirical findings using the CSAD non-linear method found no evidence of herd in the Kenya market which is homogeneous to the Nigeria capital market (Chen 2013: 238).
The empirical test may yield a different result if the model accounted for the volume of trade or the data had higher transaction activities.
Herd behavior may have a significant effect on stock returns but singly using it to measure irrationality of investment managers may not be sufficient as clearly shown from the estimates of the unexplained variance. Some research controlled for macroeconomic factors in the estimation of their respective models. For example, Cakan and Balagyozyan “controlled for global financial crisis, treasury bill and earnings yield, etc.” (Cakan and Balagyozyan 2014: 77). Chiang and Zheng also adjusted their model because they believe that “an integrated global financial market with high-tech devices and efficient information processing will likely influence investment activities worldwide, hence they include the US market squared return in their model since it is believed to play a significant role in financial transactions across the global markets” (Chiang and Zheng 2010: 1915). The inclusion of US market squared return in their model however did not change their prior findings but it improved the variance explained. The result of this research may differ if some of these measures were accounted for in the model specification.
CHAPTER FIVE
CONCLUSION
5.0. SUMMARY
Traditional finance assumes we behave with total rationality and decision making utilizes all available information; but, we do not and our deviations from rationality is systematic. Behavioural finance contradicts these assumptions and argued that psychological factors are the drivers of decision making. Some of these psychological factors responsible for deviating from rationality are heuristic bias, overconfidence bias, risk tolerance bias and herd behaviour. Prior studies of the effects of these biases on returns are detrimental, they are found to have negative effect on the returns of investors who are susceptible to them.
This study used survey data to examine, identify and quantify four major psychological biases exhibited by active investment managers in the Nigeria capital market when making investment decisions. Also, the study measured the effects of these biases on investors’ returns, and further used secondary data from 50 listed companies across all major sectors in the Nigeria capital market to evaluate daily stock returns over a 10-year period from January 2006 to March 2016. The daily return data was further used to test for the presence of herd behaviour in the Nigeria capital market.
The empirical analysis adopted used a variant of methodologies applied by scholars in the behavioural finance field. The survey data was first analysed using multiple corresponding analysis to establish and examine relationships and associations between levels of psychological biases, the analysis revealed a high level of association between psychological biases implying that it is highly probable to exhibit multiple biases during investment decision making. Analysis also revealed distinct separation between respondents that exhibit irrational biases and those that do not implying that not all investors in the survey data are susceptible to irrational behaviours. Furthermore, the proportion of investors found to be irrational decision makers, is much higher than rational investors.
The research proceeded by using K-means clustering analysis to group investors / respondents to homogenous groups in relation to the varying degrees of psychological traits that are present in each individual group. The clustering result yielded 3 groups with the presence of psychological biases in varying degree. The first cluster was found to contain the highest degree of overconfidence and the lowest level of diversification. These findings agree with existing overconfidence models that found overconfidence investors portfolio to be devoid of diversification. In addition, the first cluster had the highest degree of risk tolerance bias and herd behaviour which are also consistent with existing models that overconfidence investors will underestimate risk and trade more in riskier securities and herd because of the fear of being labelled a noise trader.
The second profile had minimal degree of all 4 biases, this cluster is probably the profile of the rational decision makers identified in the multiple corresponding analysis. This implies that even though they are considered rational investors, they still exhibit psychological biases albeit in minimal degree. The 3rd cluster was found to exhibit the highest degree of heuristic bias – naïve diversification and lowest degree of risk tolerance bias.
Finally, the research used analysis of variance to quantify the effect of psychological biases on stock return by conducting hypothesis test of the difference in mean between the group identified as irrational investors and the group identified as rational investors. The results revealed a statistically significant evidence for overconfidence, heuristic and herd behaviour biases, and these biases were found to reduce the returns of irrational investors compared to the returns of rational investors. Risk tolerance bias however did not provide a statistically significant evidence, although the result did reduce the returns of irrational investors.
The second part of the analysis used the Christie & Huang (1995) cross-sectional standard deviation method to test for the presence of herd behaviour during periods of prevalent market stress in the Nigeria capital market. The result revealed no evidence of herd behaviour as dispersion increased significantly during periods of large average price changes. This implies that individual returns increasingly deviate from the market returns during periods of market stress thereby providing evidence against the presence of herd behaviour.
To strengthen the findings and check for consistency, Chang et al. (2000) cross-sectional absolute deviation method which detect herd behaviour over the entire market distribution was further used since the first approach only detect herd behaviour during period of market stress. The empirical result remained consistent as no evidence of herd behaviour was found in the Nigeria capital market. However, individual returns deviate from the market returns at a much slower rate in comparison to the Christie & Huang (1995) estimates.
5.1. Theoretical Implications
Behavioural finance has since gained increasing popularity over the years after the traditional finance failure of explaining pricing anomalies and bubble burst in the financial market. Although being fully aware of behavioural biases may not completely wipe out its existence and grave consequences, but, continuous research work in this field can provide better insight on how to conquer or supress these psychological biases. This study contributed to existing literature and empirical evidences by educating on the underlying reasons and biases that cause some people to act irrationally even when it is against their best interest. Furthermore, it facilitated better understanding of the financial market, its participants and the unseen risk that are usually caused by the participants’ irrational impulses. A better understanding of this unseen risk will aid better management of expectations, and enhance the construction of strategies that incorporate insights about irrational investors’ behaviour.
This study further established that Nigeria investment managers exhibits these psychological biases, and are likely to be vulnerable to multiple biases. Being aware of vulnerability to these biases, will help Nigeria managers to be cautious especially when making investment decisions, to acknowledge their mistakes and try to prevent future occurrences. It will also enable them to rely less on price as negative news may not easily reflects in the price of stocks and be more analytical by making data driven decisions rather than diversify naively or herd towards the market. In addition, knowing that psychological biases reduce returns significantly, will help investors make well informed investment decisions in future.
5.2. Practical Implications
As noted by existing research and further proven by this study, the implications of behavioural finance cannot be over emphasised. All the four psychological biases reviewed are distorting information in one or multiple ways, for instance, availability bias that stems from heuristic behaviour cause investors to process only information they considered as relevant while they neglect every other information that may impact the stock market. Overconfidence cause investors to partially or completely ignore information; believing that every loss is a case of bad luck, investors fail to lean from the past, also believing that they can forecast the future, they ignore new information. This in totality hinders information processing. Risk tolerance bias also indirectly distorts information, the tendency of holding on to stocks that have depreciated indirectly distorts information and consequently slows down the rate at which information is processed in the stock market. Lastly, herd behaviour distorts information because it makes investors ignore information and follow the market concession. The implication of distorted information is that price will deviate from economic fundamentals since information is not accurately processed. Consequently, the market projection will be wrong and assets mispriced thereby resulting in bubbles and sudden crashes. Since the financial market information integrity can only be determined by market participants, it will be in investors’ best interest to always be objective and fully utilize information before making investment decisions.
Another factor investors should be wary of is the combination of stock in their portfolio as the wrong choice of portfolio allocation without applying any optimization strategy may erode the capital invested. Investment managers should utilize the principle of hedging during portfolio allocation to mitigate risk and optimize portfolio.
5.3. Limitations
One of the major limitations of this study is the unavailability of sufficient data, the data that was used to test for the presence of herd behaviour comprises only 50 firms when there are 174 listed firms in the Nigeria capital market. The reason only a sample of the listed firms was used for analysis is because the omitted firms do not have records for the periods observed and this are the periods with the most consistent records hence why it was used for this study. The result may change if the data analysis considered all the firms listed in the Nigeria capital market. Another limitation encountered during this research is securing a high response rate to the survey data. The survey data only recorded 54% respondents, a higher response rate may have a significant effect on the results. Lastly, the data analysis for the test of herd behaviour did not account for other factors such as trading activities, macro economy factors, etcetera in its model specification. A more robust model would have accounted for all these factors as this may have significant effects on the reported results.
5.4. Recommendations
Although, significant progress has been made in the behavioural finance field, there are still a whole load of work that needs to be done for a more stable financial market. Seeing that most psychological biases are inter-related with information usage, processing, availability, the lack of it or excessiveness, I believe it will be very productive if further research can be conducted on how to ensure that complete and accurate information is always available in the financial market. It will also be interesting to know if information completeness can be measured. In addition, it will be nice to research on how to expedite information processing and quantify the processing time in the financial market. Even though this will not eradicate behavioural biases, it will at least improve market inefficiencies and reduce mispricing.
5.5. Reflections
This study has been a very interesting and an eye-opening experience, it successfully identified four psychological biases exhibited by Nigerian investment managers, showed that these biases are present in varying degrees in managers, that investment managers have the tendency of exhibiting multiple biases and finally showed that these biases causes mispricing and consequently reduce the return of investment managers. The study however did not proceed to build a model that predicts stock mispricing because the empirical test for the presence of herd behaviour in the Nigeria capital market revealed no evidence of herd behaviour.
Knowing how erratic the Nigeria capital market is, coupled with the knowledge of it being underdeveloped and the poor state of information processing, it was surprising not to have detected the presence of herd behaviour in the financial market. However, the outcome of the effects of psychological biases on returns is as expected.
Getting the investment managers to respond to the survey was very challenging and I had to result in to personally calling respondents, visiting them at their place of work and sending multiple reminders before I could get some of the questionnaires completed. The deficiency in sound analytical knowledge constituted a greater challenge as this research empirical analysis is statistically intensive. This challenge however created a learning experience as I had to suspend the research analysis and obtained a degree in analytics which enabled an in-depth and proper data analysis.
Some of the many lessons learnt during the course of this study is that psychological biases affect even the best of investment managers and having conscious knowledge of the effects of these biases can help investment managers to be cautious during decision making. Furthermore, these biases can easily be unnoticed until after it has created pricing anomalies in the financial market, negatively impacted the returns of investment managers or in worst case, resulted in sudden market bubbles and crashes. In addition, it is best to base investment decisions on data driven solutions.
Considering the experiences, I have acquired during this research study, I would have loved to improve on the quality and quantity of data gathered for analysis; by conducting a new survey and choosing a larger audience. In addition, collect additional data that will account for more factors in model specification for the empirical test of herd behaviour.
Cite This Work
To export a reference to this article please select a referencing stye below:
Related Services
View all


Related Content
All TagsContent relating to: "Finance"
Finance is a field of study involving matters of the management, and creation, of money and investments including the dynamics of assets and liabilities, under conditions of uncertainty and risk.
Related Articles

DMCA / Removal Request
If you are the original writer of this dissertation and no longer wish to have your work published on the UKDiss.com website then please: