Development of a Validated Turbocharged Twin Cylinder Engine Simulation Model
Info: 24594 words (98 pages) Dissertation
Published: 3rd Jan 2022
Tagged: Automotive
ABSTRACT
This report aims to show the development of a validated turbocharged twin cylinder engine simulation model to act as a development tool for the University of Hertfordshire’s Formula Student team UH Racing. Simulation and development of the turbocharged system was carried out using Ricardo WAVE engine simulation software. Extensive research was conducted into the principles of turbocharging four stroke engines, as well as the reliability and limitations of Ricardo WAVE. A simulation model of a naturally aspirated twin cylinder engine was created and validated against dynamometer data for the engine. The team’s conceptual turbocharger system was then implemented onto the validated naturally aspirated simulation model and conclusions on validity were made, enabling further development and optimisation of the system.
TABLE OF CONTENTS
Click to expand Table of Contents
GLOSSARY
1. INTRODUCTION
1.1 BACKGROUND
1.2 AIMS AND OBJECTIVES
1.2.1 AIM
1.2.2 OBJECTIVES
1.3 PROJECT MANAGEMENT
1.4 THE FORMULA STUDENT COMPETITION
1.5 ENGINE SIMULATION WITHIN FORMULA STUDENT
1.6 REPORT STRUCTURE AND ORGANISATION
2 SUBJECT REVIEW
2.1 FOUR STROKE SPARK IGNITION ENGINE PRINCIPLES
2.2 FOUR STROKE SPARK IGNITION THERMODYNAMIC PRINCIPLES
2.3 TURBOCHARGING FOUR STROKE SPARK IGNITION ENGINES
2.3.1 TURBOCHARGER BASICS
2.3.2 TURBOCHARGED ENGINE OPTIMISATION
2.4 ENGINE SIMULATION
2.4.1 FLUID MODELLING
2.4.2 THERMODYNAMIC/COMBUSTION MODELLING
2.4.3 ENGINE FRICTION MODELLING
2.4.4 ENGINE HEAT TRANSFER MODELLING
2.4.5 ENGINE SIMULATION SHORTCOMINGS
2.4.6 ENGINE SIMULATION SOFTWARE
3 RICARDO WAVE ENGINE SIMULATION SOFTWARE CHOICE AND VALIDATION
4 SIMULATION OF THE UH19 N/A AND UH20 TURBOCHARGED CBR500R
4.1 UH19 AND UH20 ENGINE SUBSECTION
4.1.1 ENGINE GEOMETRY
4.1.2 ENGINE COMBUSTION MODEL
4.1.3 ENGINE HEAT EXCHANGE MODEL
4.1.4 ENGINE FRICTION COEFFICIENT INPUT
4.2 UH19 NATURALLY ASPIRATED CBR500R MODELLING
4.2.1 UH19 INTAKE SUBSECTION
4.2.2 UH19 EXHAUST SUBSECTION
4.2.3 UH19 SIMULATION MODEL OVERVIEW
4.2.4 UH19 SIMULATION CONSTANTS
4.2.5 UH19 SIMULATION GLOBAL PARAMETER SETTINGS
4.3 UH19 SIMULATION OUTPUT
4.4 UH19 CBR500R EMPIRICAL TEST DATA
4.4.1 ENGINE DYNAMOMETER RESULTS
4.4.2 ENGINE SOUND EMISSION RESULTS
4.5 COMPARISON AND VALIDATION OF THE UH19 CBR500R MODEL
4.5.1 BRAKE ENGINE POWER AND TORQUE
4.5.2 MEAN EFFECTIVE PRESSURES ANALYSIS
4.5.3 EMITTED SOUND LEVEL dB(c)
4.6 UH20 TURBOCHARGED CBR500R MODELLING
4.6.1 UH20 TURBOCHARGED ENGINE SUBSECTION
4.6.2 UH20 INTAKE SUBSECTION AND INTERCOOLER
4.6.3 UH20 EXHAUST SUBSECTION
4.6.4 UH20 COMPRESSOR MODELLING
4.6.5 UH20 TURBINE MODELLING
4.6.6 UH20 TURBOCHARGER BEARING MODELLING
4.6.7 UH20 BOOST CONTROLLER IMPLEMENTATION
4.6.8 UH20 SIMULATION MODEL OVERVIEW
4.6.9 UH20 SIMULATION CONSTANTS
4.6.10 UH20 GLOBAL PARAMETER SETTINGS
4.7 UH20 SIMULATION OUTPUT
4.8 UH20 MODEL VALIDATION
5 UH20 OPTIMISED TURBOCHARGED SIMULATION
5.1 OPTIMISATION PROGRAM
5.2 MODIFICATIONS UNDERTAKEN
5.3 SIMULATION RESULTS AND COMPARISON
6 CONCLUDING REMARKS
6.1 FURTHER REMARKS
6.2 PROBLEMS DURING PROJECT
6.3 PROJECT WORK REFLECTION
REFERENCES
BIBLIOGRAPHY
APPENDIX A – INITIAL GANTT CHART
APPENDIX B – INITIAL TIMING PLAN
APPENDIX C – REVISED GANTT CHART
APPENDIX D – REVISED TIMING PLAN
APPENDIX E – SELECTION OF SUPERVISOR MEETING MINUTES
APPENDIX F – HONDA CBR500R ENGINE DATA
APPENDIX G – ENGINE VALVE DATA SIMULATION INPUT
APPENDIX H – UH19 SIMULATION CONSTANTS
APPENDIX I – UH19 CBR500R SIMULATION CANVAS
APPENDIX J – UH19 SIMULATION OUTPUT DATA
APPENDIX K – SIMULATION MICROPHONE POSITION
APPENDIX L – UH19 HONDA CBR500R DYNAMOMETER ENGINE TESTING
APPENDIX M – UH20 GT06 TURBO DATA
APPENDIX N – UH20 CBR500R SIMULATION CANVAS
APPENDIX O – UH20 SIMULATION CONSTANTS
APPENDIX P – UH20 SIMULATION OUTPUT FILE
APPENDIX Q – UH20 OPTIMISED SIMULATION MODIFICATIONS
LIST OF FIGURES
Figure 1‑1 UH19 Vehicle and UH Racing’s 2016 Team [1]
Figure 1‑2 UH19 at FSG Skid Pad Event [2]
Figure 1‑3 Engine Development Graph using Ricardo WAVE Simulation Software [3]
Figure 2‑1 The Four Stroke Engine Cycle [4]
Figure 2‑2 Theoretical Otto Cycle Described on a P-V Diagram [9]
Figure 2‑3 Modified Theoretical Otto Cycle Described on a P-V Diagram [9]
Figure 2‑4 Turbocharger Schematic [12]
Figure 2‑5 Cylindrical Fluid Flow Representation [18]
Figure 2‑6 Fluid Flow through a Tapered Pipework [18]
Figure 2‑7 Wiebe Function Combustion Start, End and 50% Mass Fraction Burn Point
Figure 3‑1 Ducati 900SS Motorcycle Previous Generation
Figure 3‑2 Ducati 900SS Motorcycle Revised Model using Ricardo WAVE Software
Figure 4‑1 UH19 Chassis’ Honda CBR500R Powertrain Unit
Figure 4‑2 UH20 Chassis’ Honda CBR500R Turbocharged Powertrain Unit
Figure 4‑3 Ricardo WAVE Engine Subsection Model
Figure 4‑4 Corresponding Engine Subsection CAD Image
Figure 4‑5 Measuring Connecting Rod Dimensions
Figure 4‑6 Calculating Connecting Rod Length
Figure 4‑7 Measuring Valve Diameters
Figure 4‑8 Measuring Head Parameters
Figure 4‑9 Input of Cylinder 2 Data into the WAVE Canvas (Bore and Stroke)
Figure 4‑10 Valve Timing and Lift Data for CBR500R Curtesy of UH Racing
Figure 4‑11 FMEP Coefficients within the Simulation Engine
Figure 4‑12 UH19 Intake Setup Translated onto the WAVE Canvas
Figure 4‑13 Throttle Butterfly Valve, Named ‘ThrottleBody’ Above
Figure 4‑14 Rear Restrictor Section ‘duct3’ Single Aluminium Section
Figure 4‑15 Right Intake Runner ‘duct16’ Aluminium Section with Injector
Figure 4‑16 UH19 Exhaust Setup Translated onto the WAVE Canvas
Figure 4‑17 ‘Duct41’ Dual Material Bend After the Collector Section
Figure 4‑18 ‘Duct32’ Showing the Dual Material Property Input
Figure 4‑19 Exhaust Silencer Input from Measured Values
Figure 4‑20 UH19 Simulation Global Parameter Settings
Figure 4‑21 Ricardo WAVE Powertrain Sound Emission from UH19’s CBR500R
Figure 4‑22 Ricardo WAVE Simulation Results for UH Racing’s UH19 Powertrain Setup
Figure 4‑23 DynoDynamics Dynamometer Data from UH19’s CBR500R Engine
Figure 4‑24 Comparison Graph between Empirical and Simulation Power and Torque
Figure 4‑25 UH20 Intake Setup Translated onto the WAVE Canvas
Figure 4‑26 ‘Intercooler’ Core Section Modelled as Square Ducting
Figure 4‑27 Intercooler Effectiveness against Inlet Charge Mass Flow Rate
Figure 4‑28 Intercooler Pressure Loss against Inlet Charge Mass Flow Rate
Figure 4‑29 UH20 Exhaust Setup Translated onto the WAVE Canvas
Figure 4‑30 Ricardo WAVE Generated Compressor Map for the Simulation Model
Figure 4‑31 Turbine Efficiency against Pressure Ratio
Figure 4‑32 Turbine Dimensionless Mass Flow against Pressure Ratio
Figure 4‑33 WAVE Turboshaft Input Panel
Figure 4‑34 Turbo Wastegate Actuator with Instantaneous Bandwidth
Figure 4‑35 Inlet Plenum Pressure Sensor with Instantaneous Bandwidth
Figure 4‑36 PID Controller Values from Input Sweep and Step Response
Figure 4‑37 UH20 Simulation Global Parameter Settings
Figure 4‑38 UH20 Turbocharged CBR500R Simulation Results
Figure 4‑39 UH20 and UH19 CBR500R Simulation Result Comparison
Figure 4‑40 Inlet Plenum Total Pressure Over Engine Speed Range
Figure 4‑41 Turbocharger Speed against Engine Speed
Figure 4‑42 Turbo Wastegate Actuator Values against Engine Speed
Figure 5‑1 UH20 Powertrain Layout Showing Tight Space Constraints
Figure 5‑2 Comparison between UH20 Optimised and Standard Simulation
GLOSSARY
| UH19 | UH Racing’s 2016 completed vehicle |
| UH20 | UH Racing’s 2017 prospective vehicle |
| N/A | Naturally Aspirated |
| FSUK | Formula Student United Kingdom competition |
| FSG | Formula Student German competition |
| TDC | Top dead centre of the engine, where the piston reaches its absolute maximum height within the engine cylinder |
| BDC | Bottom dead centre of the engine, where the piston reaches its absolute minimum height within the engine cylinder |
| Compression Ratio | Ratio of maximum to minimum volumes within an engine |
| Charge | Air-Fuel mixture entering the engine |
| Crank Shaft | Engine shaft that converts reciprocating motion to rotational motion |
| Camshaft | Shaft containing cams, which when rotated converts the rotational motion to reciprocating motion on the engine valves |
| CFD | Computational fluid dynamics |
| 1D | One dimensional |
| 3D | Three dimensional |
| CAD | Computer aided design |
| FEA | Finite element analysis |
| VVT | Variable valve timing |
| ISO | International organization for standardization |
| ECU | Engine control unit |
| Bore | Engine cylinder diameter |
| Stroke | Engine piston travel within the cylinder (from TDC to BDC) |
| FMEP | Friction mean effective pressure |
| IMEP | Indicated mean effective pressure |
| BMEP | Brake mean effective pressure |
| Duct | Simple passage for fluid flow |
| Y Junction | Volume where two of more ducts enter or leave |
| PMax | Maximum in cylinder pressure |
| rpm | Engine speed, in revolutions per minute |
| Knock | Engine condition where combustion occurs uncontrolled |
| PID | Proportional, integral and derivative |
| Wastegate | Turbo orifice to expel exhaust gasses away from the turbine |
| WAVE | Ricardo WAVE 1D engine simulation software |
| WAVEPOST | Ricardo WAVE post-processing software |
1. INTRODUCTION
The focus of this report was to present the creation and validation of a turbocharged twin cylinder four stroke spark ignition engine simulation model. The twin cylinder engine model investigated within this report was the Honda CBR500R, in collaboration with the University of Hertfordshire’s Formula Student team UH Racing. Empirical data from UH Racing’s naturally aspirated CBR500R engine was compared against a simulation model for the engine configuration, identifying potential shortcomings from engine simulation techniques. Upon the compared, calibrated and validated results from the naturally aspirated engine simulation model, a validated turbocharged model was created using part geometries outlined by the UH Racing team. Further optimisation of the turbocharged system through simulation was also carried out to provide the team with further modification concepts to improve engine performance. Thus improving vehicle performance for current and future iterations of the CBR500R based vehicles from UH Racing.
1.1 BACKGROUND
Similarly to common practices within the automotive and motorsport industries, for reasons such as weight saving and efficiency, UH Racing in recent years has shifted from large displacement four stroke gasoline powertrains (599cc Yamaha YZF R6) to smaller displacement engines. Most recently the UH Racing team have opted to use the Honda CBR500R 471cc unit. Alike to the automotive and motorsport industries, to meet the power requirements to remain competitive at the Formula Student competitions, UH Racing was required to heavily modify the CBR500R unit to give dramatically higher specific power outputs. Remaining compliant with Formula Student regulations (such as a 20mm air intake restrictor and fuel choice) the UH Racing team of 2016/17 ran two parallel development programmes, a turbocharger development programme and a high compression naturally aspirated development programme. The basis of the development programs were the engine simulation models. Validated simulations for both development programmes allowed for the direct comparison of the pros and cons for each concept, allowing for the most appropriate choice to be implemented on the vehicle chassis UH20. This project shows the progression and development of the turbocharged CBR500R engine simulation, which in this application has not previously been accomplished within available literature.
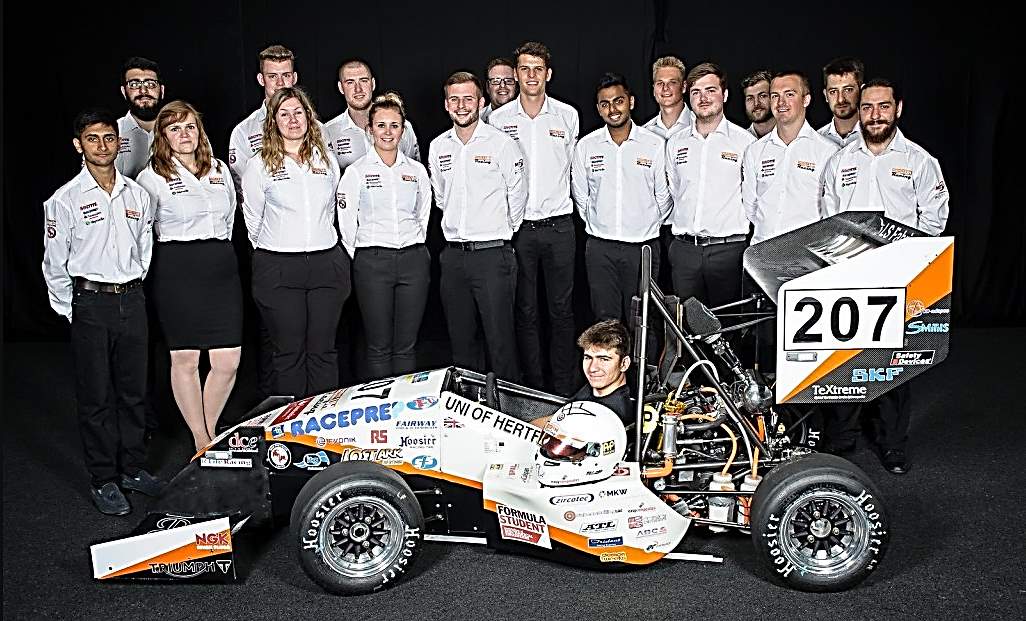
Figure 1‑1 UH19 Vehicle and UH Racing’s 2016 Team [1]
1.2 AIMS AND OBJECTIVES
1.2.1 AIM
To create, both a reliable and accurate engine simulation model of a turbocharged Honda CBR500R to provide the UH Racing team with a development platform, to validate the use of a turbocharger for the UH20 chassis.
1.2.2 OBJECTIVES
- Research and collate data with regards to Ricardo WAVE, how the software simulates an engine, the drawbacks and limitations, and comparison to similar software. Ensuring that Ricardo WAVE’s simulation technique is appropriate for this application.
- Find specifications or physically measure engine parameters to produce a model in Ricardo WAVE of the CBR500R in its current state (chassis UH19). Develop an accurate and reliable engine simulation of the existing CBR500R engine configuration from the UH19 chassis. Validate the simulation against the engines empirical data and previous real world dynamometer results.
- Develop an accurate and reliable engine model of a suitably turbocharged Honda CBR500R from the validated engine simulation. Validate the turbocharged CBR500R engine model, via simulation and comparison to the existing UH19 engine data. Following this make the data available for the team to use for the design review at competition.
- Develop the turbocharged engine simulation further to suggest modifications to the system to optimise the use of the turbocharger including, but not exclusively, torque delivery and power.
1.3 PROJECT MANAGEMENT
To meet the aims and objective of the project in the timeframe available, a timing plan and Gantt chart were produced to manage resources for the work stages throughout the project. An initial Gantt chart and timing plan were developed at the beginning of the project to ensure the aims and objectives were feasible within the time constraints (see Appendix A and B respectively). These initial Gantt charts and timing plans were updated during the course of the project to more appropriately allocate time for each work stage as initial estimations, particularly for the simulation calibration period were underestimated. The revised Gantt chart and timing plan can be observed in Appendix C and Appendix D respectively, however a brief overview of the major work stages can be observed below:
- Software Familiarisation (16/10/16 – 29/10/16): – Worked through the Ricardo WAVE support manuals and constructed a range of models from the available tutorials. Ran the models as specified to ensure one modelled the simulations correctly when compared to the given information.
- Research Studies (30/10/2016 – 15/02/17): – Research was conducted around many areas around the project title. Initially the four stroke gasoline engine system was researched, progressing through to turbocharging principles and benefits of turbocharging and finally an in depth subject review of engine simulation software was conducted. Thus enabling all of the project aims and objectives to be met.
- Naturally Aspirated Simulation (12/11/16 – 25/11/16): – Collected physical geometric data and material properties for the naturally aspirated engine setup found on UH Racing’s UH19 vehicle. Created and ran the simulation model, comparing results to empirical data.
- Turbocharged Simulation (02/12/16 – 21/01/16): – Collated proposed turbocharged geometries from UH Racing and implemented the system on the naturally aspirated engine model. Ran the simulation model, collected the data and forwarded the information to the Formula Student cohort.
- Turbocharged Simulation Optimisation (17/02/16 – 13/03/17): – Optimised the turbocharged simulation to produce better power and torque delivery, aided by the research conducted previously.
Weekly meetings with both the whole Formula Student cohort and the Formula Student powertrain department meant frequent communication with the team, allowing one to share and receive information easily from the cohort. Alongside this, regular project supervisor meetings meant that issues with the project were captured early and work stage deadlines set in the timing plan were met. Minutes from these meetings can be found in Appendix E, showing the progress throughout the project.
1.4 THE FORMULA STUDENT COMPETITION
The Formula Student competition is a global university based design competition of a single seater formula car, to compete in an autocross or sprint style racing event. Originating from the United States of America under the Formula SAE name in 1978 the competition now spans globally, allowing for competition against universities from all over the globe. Unlike many racing series the Formula Student teams are scored through a series of static and dynamic events meaning outright performance is not the deciding factor of the winning team.
The dynamic events consist of an acceleration event, a figure of eight skid pad event, a single sprint lap time event and finally a 22km endurance event to assess the performance and reliability of the vehicle. Static events consist of a cost analysis, presentation and an engineering design review.
The static events are judged by a panel of engineering professionals from automotive, motorsport and business sectors meaning the competition rewards the most committed and driven students, who have optimised and reasoned every component on their vehicle.
The University of Hertfordshire has a rich history in the competition, competing from the competitions beginning and still competing today at both the Formula Student UK (FSUK) and the Formula Student Germany (FSG) competition. UH Racing has ranked highly for a number of years, most recently the UH Racing team ranked 2nd UK team at FSUK and 1st UK team at FSG using the UH19 chassis. It is imperative, to maintain successful, that the team develops each year upon the previous year’s findings as well as researching new methods and techniques to improve the design of the vehicle to remain competitive.
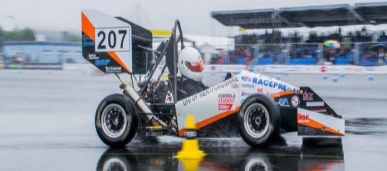
Figure 1‑2 UH19 at FSG Skid Pad Event [2]
1.5 ENGINE SIMULATION WITHIN FORMULA STUDENT
Due to the nature of the competition, requiring the constant progression of concepts year upon year, the typical development time of the vehicle is limited to approximately 18 months. The UH Racing team operates to ensure that this limited time is utilised, whereby the bachelors students begin development of concepts for a vehicle within their final year of study, which can then be fully developed, finalised, manufactured and built into a complete vehicle with progression into their masters year studies. Engine simulation software is of huge benefit to the Formula Student program, as accurate simulation can drive down the development time of powertrain concepts. Thus meaning that more powertrain concepts can be developed and tested theoretically, ensuring the most effective concept can be chosen and manufactured for the competition. The data collated from engine simulation software can be of benefit not only to the development of powertrain concepts, but initial values for power and torque means that tyre choice, transmission and final drive ratios for example can be better developed and optimised for the selected powertrain concept to produce a higher performance vehicle package.
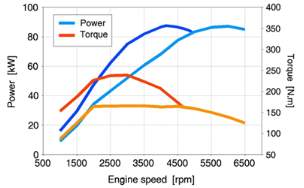
Figure 1‑3 Engine Development Graph using Ricardo WAVE Simulation Software [3]
1.6 REPORT STRUCTURE AND ORGANISATION
The report structure follows the progression of ideas throughout the project to meet the aims and objectives. There are five major working chapters within this report, where conclusions are gathered to allow for further progression with subsequent modelling. The final chapter summarises and concludes the findings of the working sections, to prove the aims and objectives of the project have been met.
Chapter 2 of the report ‘Subject Review’ outlines the basic principles behind the internal combustion engine, turbocharging, engine simulation software’s and their limitations.
Chapter 3 ‘Ricardo WAVE Engine Simulation Software Choice and Validation’ describes why Ricardo WAVE simulation software was chosen and why the use of the simulation is validated for this application.
Chapter 4 ‘Simulation of the UH19 N/A and UH20 Turbocharged CBR500R’ outlines the modelling process behind the naturally aspirated simulation model, including collection of engine geometry data and the selection of heat transfer and combustion models. Results were gathered from the naturally aspirated simulation model allowing for comparison to data collected from the engine dynamometer, meaning a validation of the simulation model could be made. Upon validation of the naturally aspirated model the turbocharged system could be implemented on the foundations of the naturally aspirated model. This included new geometries for the exhaust and inlet system and more importantly the input of manufacturer data for the turbocharger and intercooler components. Finally a validation of the model could be carried out by comparing the modelling techniques, the reliability of the input data and the trends to the torque and power outputs with turbochargers spooling response.
Chapter 5 ‘UH20 Optimised Turbocharged Simulation’ shows the final iterations of the turbocharged simulation model. Ideas and concepts collected within Chapter two of this report were implemented upon the validated turbocharged model to improve the performance of the engine simulation with regards to torque and power. The optimisation program was outlined; focussing on changes that are a possibility within the confines of the Formula Student program. The information gathered from this chapter helped meet the final objectives of the project.
Chapter 6 ‘Concluding Remarks’ contains a summary comment on whether or not the aims and objectives of the project have been met and to what degree of success. The concluding remarks chapter also contains the major obstacles overcome within the project period and comments on any further improvements, modifications or developments that can be made to the simulations.
2 SUBJECT REVIEW
2.1 FOUR STROKE SPARK IGNITION ENGINE PRINCIPLES
The internal combustion engine was developed in the late 1800s and is now considered one of the most influential inventions of the last century [4]. The term ‘internal combustion engine’ is coined for an engine that converts the chemical energy retained within a fuel to useable work in the presence of air within a closed chamber. Technically there are many types of internal combustion engine, including open circuit gas turbines; however it is generally understood that reciprocating internal combustion engines are meant by the term internal combustion engine, and the prefix ‘reciprocating’ is normally omitted [5]. Within the scope of reciprocating internal combustion engines there are predominantly two methods of igniting the charge. Spark ignition where a physical spark ignites the air-fuel mixture and compression ignition where the increase of pressure and temperature within the combustion chamber causes the air-fuel mixture to spontaneously ignite.
The Four Stroke Engine Spark Ignition Cycle
The majority of internal combustion engines produced today function using the four stroke cycle, which requires two rotations of the crankshaft (four strokes of the piston) to produce one power stroke [6]. This is commonly known as the Otto cycle, named after the developer of the four stroke internal combustion engine Nickolaus Otto (1832-1891).
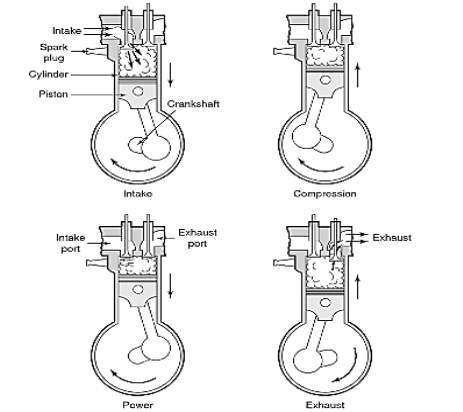
Figure 2‑1 The Four Stroke Engine Cycle [4]
Figure 2-1 describes the four stroke Otto cycle of an engine, an explanation of the cycle processes can be seen below (the four strokes are often simplistically summarised as ‘suck, squeeze, bang, blow’) [7].
First Stroke (Intake)
From the pistons initial position at top dead centre (TDC), the piston moves down the engine cylinder increasing the volume within the combustion chamber. The intake valve is opened during this movement which draws the air-fuel mixture in port injection (or air only in direct injection engines) into the combustion chamber. The piston continues to move down the cylinder until it reaches its final position at bottom dead centre (BDC).
Second Stroke (Compression)
Both inlet and exhaust valves are closed; the piston reverses its direction, compressing the volume of air-fuel mixture (or air) by reducing the volume of the combustion chamber. The piston continues its travel until maximum reduction of the chamber size at TDC. With direct injection engines fuel will be injected into the chamber at a specified point in the pistons motion up the cylinder.
Third Stroke (Power)
Before the piston reaches TDC, the spark plug fires, initiating the combustion of the air-fuel mixture within the combustion chamber. The combustion process continues after the piston reaches TDC, the increase in pressure of the chamber due to heat of combustion forces the piston down the engine cylinder to BDC. It is this motion that is harnessed through the crankshaft as useable work.
Fourth Stroke (Exhaust)
The exhaust valve generally opens before the piston reaches BDC on the power stroke, this allows for all of the combusted gasses from the power cycle to be fully expelled from the combustion chamber as the piston finally reverses its motion and travels finally from BDC to TDC. [8]
Valve Timing
The control of the valves is generally achieved through the use of camshafts or a singular camshaft. The camshaft(s) are linked to the crankshaft of an engine by a toothed belt or chain and are geared to ensure that two rotations of the crankshaft results in a single rotation of the camshaft. Camshaft cam lobes act directly (or through a shaft on single camshaft engines) upon the valves at specified timings in relation to each pistons position in the Otto cycle ensuring optimum gas flow through the engine.
Spark Timing
Spark timing is controlled today predominantly by the engine control unit (ECU), whereas in older style engines a device called a distributor was used. Both methods of controlling the spark timing is determined by the pistons position within the four stroke cycle from the crankshafts position. Tuning methods mean it is possible to provide spark to the charge at the correct position in the engine cycle to produce optimum power at a given engine condition (dependent on ambient conditions, engine load, mixture strength and quality).
Air-Fuel Ratio
Similarly to spark timing, the air-fuel ratio in modern engines is determined by the ECU, however in older style engines, and some specialised builds, a carburettor is used. The ideal air-fuel ratio is known as stoichiometric at 14.7:1, meaning 14.7grams of air to every 1gram of fuel. However again with tuning it may be appropriate to deviate from this ideal value due to engine conditions and engine type to maintain optimum performance.
2.2 FOUR STROKE SPARK IGNITION THERMODYNAMIC PRINCIPLES
As mentioned in Chapter 2.1 the four stroke spark ignition engine follows the thermodynamic principle cycle known as the Otto cycle. A theoretical Otto cycle for a four stroke spark ignition engine can be seen on the P-V diagram Figure 2-2 below.
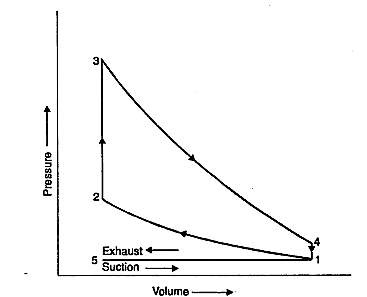
Figure 2‑2 Theoretical Otto Cycle Described on a P-V Diagram [9]
Intake Stroke
The intake stroke described previously is represented by line 5-1, where the charge or air (depending on type of fuel injection) enters the engine. This process is deemed as an isobaric process.
Compression Stroke
The compression stroke is described by the Otto cycle lines 1-2 and continued through to line 2-3. Line 1-2 represents the compression of the charge inside the engine as the piston rises from BDC to TDC and is deemed an adiabatic (and isentropic) process. Process line 2-3 represents the ignition of the charge inside the chamber and shows the isochoric heat transfer to the charge and the burning of the mixture (that raises the pressure dramatically).
Power Stroke
The power stroke is represented by the process line 3-4, as the piston is forced down from TDC to BDC. It is this process in which an engine produces work and is described as an adiabatic and isentropic process. Line 4-1 represents the isobaric process of heat rejection of the charge when the piston is at BDC.
Exhaust Stroke
The final process is where the exhaust gasses are expelled from the engine as the piston rises finally from BDC to TDC. The mass of exhaust gasses are expelled to atmosphere in an isobaric process represented by line 1-5.
In reality, a modification to the Otto cycle outlined above is required to account for pumping losses across the engine for the input of the air-fuel mixture and expelling of the exhaust gasses.
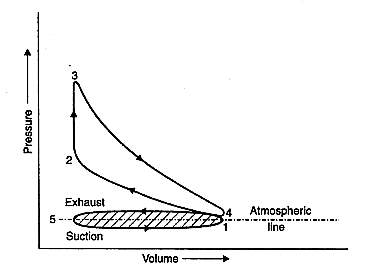
Figure 2‑3 Modified Theoretical Otto Cycle Described on a P-V Diagram [9]
The lines and numbers still represent the four strokes of the cycle; however Figure 2-3 above shows the negative work loop 4-5-1 linked to the pumping losses within the engine. To more accurately calculate the net work produced by the engine in comparison to the standard Otto cycle, the negative area work loop value should be taken away from the positive area loop between points 4-2-3 [10]. This modified Otto cycle is deemed more accurate in regards to actual engine running and it is this cycle that engine simulation software determines for the specified geometry to ensure accurate results.
2.3 TURBOCHARGING FOUR STROKE SPARK IGNITION ENGINES
2.3.1 TURBOCHARGER BASICS
A form of supercharger, a turbocharger or ‘turbo’ as it’s more commonly referred to is a small centrifugal air pump that is driven by the energy of the exhaust gasses expelled from the engine. Alike to a crankshaft driven supercharger, a turbocharger’s main objective is to improve the volumetric efficiency of an engine hence improving the engines performance. The volumetric efficiency of an engine is the ratio of fluid displaced by the engine in relation to its swept volume. An inherent limitation of a naturally aspirated engine is the reliance of the downward intake stroke of the piston to produce an area of low pressure inside the chamber. The pressure difference produced between the combustion chamber and the inlet manifold draws the intake charge into the engine. Therein lies the limitation of the naturally aspirated engine, atmospheric pressure of approximately 1 bar means that there is a ultimate limit of pressure difference, thus airflow entering the chamber for a specified engine [11]. A turbocharger increases the pressure at the intake manifold, hence creating a larger pressure differential between the combustion chamber and inlet manifold. A larger volume of air-fuel mixture is therefore forced into the engine, causing a larger force on the crown of the piston meaning an increase in power and torque.
To produce a pressure increase within the inlet manifold, a turbocharger incorporates three major components; the overall system can be observed in Figure 2-4 below.
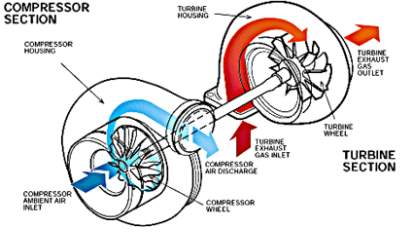
Figure 2‑4 Turbocharger Schematic [12]
Turbine Section
After the combustion process, a large amount of energy still remains within the exhaust gasses in the form of enthalpy due to the temperature of the exhausted gasses. Typical values of exhaust gas temperatures are 820-850°C for diesel engines and 950-1050°C for gasoline engines [13]. The turbocharger harnesses the heat and pressure energy within the turbine section of the turbocharger, which contains the turbine housing and turbine wheel. The turbine housing is affixed to the engines exhaust system, which directs exhaust flow into the turbine wheel. Due to the high pressure differential between the exhaust gas inlet and outlet of the turbine section, the exhaust gas flows through the turbine wheel and expands. It is this expansion of the gas within the turbine wheel which causes the wheel to rotate and produce work [14]. This rotational energy is transferred to the compressor wheel via the turbocharger shaft running between the compressor and turbine wheels.
Compressor Section
The compressor section of the turbocharger produces pressure within the inlet manifold via conversion the rotational work of the turbocharger shaft. The compressor section is isolated from the turbine section of the turbocharger and consists of the compressor housing and compressor wheel. The compressor wheel draws ambient air from the inlet system and compresses it, increasing the pressure of the air dramatically. The air enters the leading edge of the compressor wheel where it is accelerated, turning through 90° where it exits the compressor wheel perpendicular to the turbocharger shaft [14]. When the air leaves the compressor wheel it enters a diffuser which is part of the compressor housing, it is here where the pressure is built. The pressurised air is then fed to the engine via a series of ducts and orifices and normally through an intercooler due to the increased temperature of the air.
Shaft and Bearing Section
The turbocharger shaft and bearing system is extremely important and must support the forces of both the compressor and turbine wheels. The shaft and bearing system must be able to cope with speeds of operation in excess of 100,000 rpm, and remain within extreme geometric tolerances to ensure both wheels do not collide with their housings. There are numerous bearing systems used within turbochargers, which are designed to limit the friction within the system to ensure the highest energy extraction from the exhaust gasses.
2.3.2 TURBOCHARGED ENGINE OPTIMISATION
General optimisation for functionality
From initial concepts, a turbocharged engine will be optimised for the engine specific preferences and targets much the same as a naturally aspirated engine. Inlet plenum volumes will be optimised to ensure the mass air flowing to each cylinder is equalised and runner lengths specified to control the torque and power characteristics of the engine as well as emission control. Similarly, the exhaust geometry will affect the power and torque characteristics by affecting the available scavenging and backpressures. Manufacturers will endeavour to optimise the characteristics to meet specified targets whilst considering turbocharger responsiveness. Factors such as ignition timing and fuel systems will also be specified by manufacturers to meet the demands of a turbocharged engine, in much the same way they would be optimised for a naturally aspirated engine. The following parameters describe the largest variation in design principles between a naturally aspirated and turbocharged engine and should be modified first when turbocharging an originally naturally aspirated engine.
Compression Ratio
Predominantly for knock control within the engine is the compression ratio specified for a turbocharged engine. Generally they will be considerably lower than those observed in a naturally aspirated engine. The compression ratio will vary with many factors including spark plug position, combustion chamber design, backpressure and ignition timing. An example comparison of compression ratios between similar volumetric displacement naturally aspirated and turbocharged engines is between the Honda F20C engine found in the Honda S2000 and the Subaru WRX’s powertrain the FA20. The F20C naturally aspirated 2.0 litre engine has a compression ratio of 11.1:1, whereas the turbocharged FA20 has a compression ratio of 8:1 [15].
Intercooler
The compression of air through the compressor wheel of the turbocharger causes an increase in temperature of the charge, this is not beneficial to the engine system as the charge density decreases. The lower density charge air creates a less efficient Otto cycle for the engine and causes an inherent loss of power. An intercooler is a type of heat exchanger of which there are two major types, ‘air to air’ and ‘air to water’. Both types of intercoolers cool the air leaving the compressor and provide the engine with cooler and therefore denser air [16], meaning more fuel can be mixed with the air and larger useable work production from the engine. An intercooler is not generally used on a naturally aspirated engine because the inlet air temperature, due to lack of compression, remains relatively similar to ambient and therefore retains its charge density.
Cam Timing
In general, cam timing in a naturally aspirated engine contains a period in the crankshafts rotation where both the exhaust valve and inlet valve are open as this improves the volumetric efficiency of the engine. Turbocharged engines generally function better with limited valve overlap as the backpressure in the exhaust generally exceeds the inlet manifold pressure causing a back draw. Secondly the cooling of the exhaust gasses exerts less force on the turbine wheel, therefore producing less work on the turbocharger shaft; hence the spooling of the compressor wheel is compromised. Typically less valve overlap produces faster turbo spooling whereas more overlap produces an increased spool time. However cam timing is dependent on application, engine load and geometries and is individualised for each engine, therefore in some cases increased overlap can benefit power and torque characteristics in turbocharged engines and will be investigated further in Chapter Five of this report.
2.4 ENGINE SIMULATION
The competitive nature of the automotive and motorsport sectors means that case studies and general literature surrounding engine simulation software accuracy, inner workings and applications are limited. Numerous available engine simulation software packages from a range of manufacturers means that details are kept secretive for their specific software to maintain competitive within the market. However as a relatively new technology, the literature surrounding the topic and case specific studies are increasingly being published. From the subject review thus far, it is determined that the concepts behind turbocharging and modification of a twin cylinder naturally aspirated engine are very well documented, and case specific engine simulations are also becoming more readily available. However the lack of specific literature on the simulation of a Honda CBR500R engine in particular for the Formula Student application mean that this project would introduce new ideas and findings for the specific engine.
Looking into engine simulation methods G.P.Blair published a series of books, considering engine simulation as a whole, with “Design and Simulation of Four-Stroke Engines 1999” most applicable for the nature of this report. Blair addresses the entire modelling of engines, from gas flows to frictional losses and includes numerous case studies ranging from a Ryobi hand held chainsaw engine to large displacement V8 engines from Infiniti-Nissan. Throughout these case studies, validation techniques and the accuracy of engine simulation software is emphasised and an insight into the workings behind the software is also described. Günter et al. published a book “Combustion Engines Development 2011” which also outlined the principles behind the inner workings of engine simulation software allowing for further in depth research to be undertaken with regards to the techniques. Considering the main models functioning within engine simulation software as outlined by Blair and Günter et al. it was possible to understand the inner workings of the software without knowing the intricate details for each specific package, these are outlined in the following chapters.
2.4.1 FLUID MODELLING
Fluid modelling within engine simulation software is principally the same as those used in conventional Computational Fluid Dynamic (CFD) software packages, enabling the user to study the characteristics of the charge working through a series of ducts, orifices and volumes within the engine. However engine simulation software generally considers the three dimensional fluid flow within the subsystem as a one dimensional fluid flow, where the fluid in the system is studied in terms of its velocity. There are three main equations acting to generate a solution for the 1D fluid flows; the continuity equation, energy equation and momentum equation.
Continuity Equation
The continuity equation states that during steady flow, the mass flow through a pipework of varying geometry does not change, outlined by Equation 1.1 and 1.2 below:
ρ1∙A1∙v1=ρ2∙A2∙v2
(1.1)
Where:
ρ= Fluid Density
A= Area of section
v= Velocity
Mass flow rate through the system therefore remains constant described in Equation 1.2:
ρ∙A∙v=Constant
(1.2)
Energy Equation
Energy is conserved within the system in regards to fluid flow; this mechanism is captured by Bernoulli’s principle, where at any point within the system the total energy will remain constant. Bernoulli’s equation is an approximate relation between pressure, velocity and elevation of a fluid flow and despite its simplicity, the equation has proved to be very powerful within computational fluid dynamics [17]. The fluid flow within a system can be considered as a cylinder, consisting of a cross sectional area
dA and length
ds. The cylinder will contain a pressure differential of P and
P+∂p∂sds between the upper and lower faces of the cylinder. The cylinder will also have gravitational potential depending on the geometry it is flowing from and to. That needs to be considered by p∙g∙dA∙ds. Figure 2-5 below describes the cylindrical fluid element traveling through an inclined pipework.
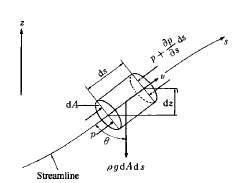
Figure 2‑5 Cylindrical Fluid Flow Representation [18]
By introducing Newton’s second motion law to the element, it is possible to describe the overall energy of the cylinder as Equation 1.3 below:
ρ∙dA∙ds∙dvds=-dA∙∂p∂s ∙ ds- p∙g∙dA∙ds∙cosθ
(1.3)
Where:
ds= Length of cylinder
P= Pressure
g= Acceleration due to gravity
Via manipulation and simplification of Equation 1.3 above Bernoulli’s equation can be reached which is commonly used in fluid mechanics software for steady, incompressible flows [17].
P1ρ+ V122∙g∙z1=P2ρ+ V222∙g∙z2
(1.4)
Where the
V 22 term is the kinetic energy of the fluid, g∙z is the potential energy of the fluid and finally the P ρterm is the flow energy of the fluid.
Momentum Equation
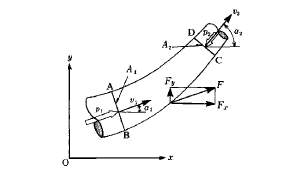
Figure 2‑6 Fluid Flow through a Tapered Pipework [18]
Assuming there is a controlled volume in the fluid flow, a relationship between the change in momentum and force within the volume can be determined using the momentum equation. By taking a curved tapered pipework, of single radius, with initial condition area
A1, velocity
v1 and pressure
P1 and final conditions area
A2, velocity
v2 and pressure
P2 for example (Figure 2-6). The fluid creates a force on the wall of the pipework, hence the wall reacts a force onto the fluid
-Fin addition to the existing pressure acting on the fluid. From this the fluids momentum change through the system can be determined using the momentum Equations 1.5 and 1.6 below (α is the angle of the fluid flow measured from a set neutral axis, m is the mass flow rate of the fluid).
-Fx+A1∙P1∙cosα1-A2∙P2∙cosα2=mv2∙cosα2-v1∙cosα1
-Fy+A1∙P1∙sinα1-A2∙P2∙sinα2=m(v2∙sinα2-v1∙sinα1)
(1.5), (1.6)
Following the extensive usage of engine simulation software within industry, involving a constant strife for further accuracy, ‘bolt on’ 3D fluid flow packages to the standard engine simulation software are becoming more common. For example Ricardo VECTIS the 3D package for Ricardo WAVE engine simulation software allows the user to study individual components such as an intake plenum in further detail using 3D analysis. Whilst leaving the remaining system under 1D analysis. This lowers the computational resources required and increases the speed of the simulations in comparison to full 3D analysis, whilst increasing the accuracy of the overall model. The Navier-Stokes and Eulers equations are utilised when reviewing a 3D analysis and can be observed within T. J. Chung’s book ‘Computational Fluid Dynamics 2010’.
2.4.2 THERMODYNAMIC/COMBUSTION MODELLING
Within engine simulation software, there is one prominent model that is commonly utilised known as the Wiebe model after the man who introduced it Ivanovitch Wiebe 1902-1969. The Wiebe function has become such a common function that the literature surrounding the subject rarely sites the source of the Wiebe function, and in fact there is confusion in the naming conventions of the Wiebe name, often referring to the model as the Weibe, Vibe or Viebe function [19]. The Wiebe function is described by Equation 1.7 below [6]:
xb=1-exp-a θ-θa∆θm+1
(1.7)
Where:
θ
= Engine Crank Angle
θ0= Start of Combustion Crank Angle
∆θ
= Total Combustion Duration
a= Adjustable Parameters to Vary Combustion*
m
= Adjustable Parameters to Vary Combustion*
*Varying the a & m parameters changes the shape of the Wiebe curve dramatically, studies fit empirical mass fraction burnt curves with values a = 5 and m = 2.
The Wiebe function estimates the mass fraction of charge burnt as a function of engine crankshaft position, giving an extremely accurate S-shaped curve typical of the combustion process. The profile grows exponentially from zero (start of combustion indicating 0% mass fraction burnt), to complete combustion at 100% mass fraction burnt. The difference between the start and end point is referred to as the duration of combustion [20]. A typical Wiebe curve can be observed in Figure 2-7 below from a Ricardo WAVE input menu for a single case.
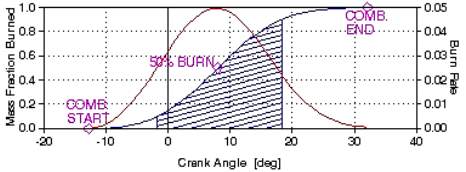
Figure 2‑7 Wiebe Function Combustion Start, End and 50% Mass Fraction Burn Point
Within engine simulation software to accurately model the engine under a specific loading case and engine speed, it is important to input the correct 50% burn point (highest energy release point and where 50% of the charge is burnt), and the combustion duration into the input panel accurately from empirical or measured data. Thus ensuring the model generates a profile similar to what is occurring within the engine.
2.4.3 ENGINE FRICTION MODELLING
Friction within the engine is a hugely important factor that needs to be considered with regards to the torque and power outputs from engine simulation software. Increasing accuracy of fluid and thermodynamic models for engine simulation software meant that an equally accurate model for internal frictions needed to be used. The Chen-Flynn friction model is commonly used within engine simulation software [21] and provides accurate results when compared to experimental data. The Chen-Flynn friction model determines the work done by friction within the engine by considering engine speed, mean piston speed, maximum cylinder pressure and engine compression ratio. The breakdown of the parameters within the model encompassing the above considerations, is a constant term ACF a varying term with peak cylinder pressure, BCF a varying term for mean piston velocity, CCF for hydrodynamic friction and finally a quadratic term for mean piston velocity QCF (for windage losses) [22].The following Equation 1.8 describes the determination of friction losses within the engine known as the friction mean effective pressure (FMEP).
FMEP=ACF+BCFPmax+CCFrpm*stroke2+QCF (rpm* stroke2)2
(1.8)
2.4.4 ENGINE HEAT TRANSFER MODELLING
The main heat transfer mechanisms acting within an engine, from the combustion gasses to cylinder walls, is almost entirely convection with only 5% occurring from radiation [23]. A simple Newtonian model can be used to describe heat loss to the cylinder walls seen in Equation 1.9 below.
Q=h∙A (Tg- Tw)
(1.9)
Where:
h
= Heat Transfer Coefficient
A= Surface Area of Combustion Chamber
Tg
= Temperature of Cylinder Gas
Tw= Temperature of Cylinder Wall
Engine simulation software packages offer numerous solutions to calculate the heat transfer coefficients based on the Nusselt number and Reynolds number of the fluids within the system at each crank angle increment [22]. Most commonly used within engine simulation software is the Annand, Woschni and Eichleberg models, each having own individual merits following extensive research with experimental data to prove and validate the respective model. The Woschni heat transfer model is used more extensively, where the Annand and Eichleberg models tend to be used to compare values attained using the Woschni model. The Woschni model views the charge as having a uniform heat flow coefficient and velocity on all surfaces of the chamber at each crank angle [24]. The Woschni heat transfer coefficient (h) of the system is described in Equation 2.0 below [6].
h=128∙hc∙B-0.2∙p0.8∙T-0.53∙C1∙upm+C2∙Tr∙vvr∙p-pmpr0.8
(2.0)
Where:
hc
= User Specific Multiplier Constant
B= Engine Bore
p= In Cylinder Pressure
T= Temperature of Cylinder Wall
Upm= Mean Piston Velocity
Tr
= Reference Temperature
V= Mean Piston Velocity
Vr
= Reference Volume
Pm= Motored Cylinder Pressure
Pr
= Reference Pressure
C1
= Constant 2.28 for Combustion 6.18 for Scavenging
C2
= Constant 3.24×10⁻³ for a Closed Cycle and 0 before Combustion and Scavenging
2.4.5 ENGINE SIMULATION SHORTCOMINGS
Similar to all specialist simulation software, such as Finite Element Analysis (FEA) and CFD, the main limiting factor is human interaction with the software. The software is limited by the information it receives, from operating constants, to model selection and model geometry inputs. Therefore it is imperative to achieve highly accurate results that the operator ensures the case is input into the software correctly selecting the appropriate models and importing the geometry correctly, as specified by the software manufacturers. Furthermore, modelling techniques for combustion, heat transfer and fluid flow can also lead to inaccuracies due to assumptions made within each model. Although these assumptions are tested and validated and therefore should tend to accuracy.
2.4.6 ENGINE SIMULATION SOFTWARE
There are numerous engine simulation and development software’s available on the market, with varying levels of cost, functionality and availability. Outlined below are the major engine simulation software’s that have been heavily tested, accredited and used globally across a wide range of industries.
AVL BOOST
AVL BOOST was developed in house at AVL’s department for applied thermodynamics [24] and is a 1D engine cycle and gas exchange simulation software that is capable of delivering accurate predictions of engine performance, emissions and acoustics [25]. Although AVL BOOST itself is a 1D engine simulation software, in collaboration with AVL FIRE software, simulation of flow and heat transfer can also be obtained in three dimensions allowing for even greater accuracy. The AVL platform provides the possibility to undertake more in depth and advanced engine simulation and can give extremely accurate results, however it is described as more difficult and less intuitive than other software’s on the market [26].
Lotus Engine Simulation (LES)
Developed in Hethel, United Kingdom by Lotus Engineering Software (LESOFT) as part of a complete vehicle simulation solution, Lotus Engine Simulation has the ability to model both four and two stroke, diesel and gasoline, naturally aspirated and boosted engines [27]. Lotus Engine Simulation can be used to reverse engineer engine geometries to meet target torque curves, such as bore to stroke ratios, valve sizes and cam profiles [28]. The software has been validated within Lotus engineering and by global companies for a range of different engine types and is capable of simulating most existing and projected engine systems [29].
GT-Power
GT-Power is described as the industry standard engine simulation software, and is used by every major engine manufacturer in the design and development of their engines [30]. Similarly to WAVE and AVL BOOST, GT-Power combines the use of both 1D and 3D simulation techniques to promote extreme accuracy for a large range of engine systems. GT-Power has a large testimonial and report portfolio emphasising the accuracy of the software, Trajkovic et al claim an error of less than 5% for a range of variables against measured data for a VVT powertrain system [31].
Ricardo WAVE
Ricardo WAVE “is the technology leader” in engine performance and noise vibration and harshness simulation software [32] and is used throughout many major industrial sectors such as rail, marine, ground transportation and motorsport. Using WAVE software it is possible to simulate virtually any intake, combustion or exhaust system hence meeting the modelling requirements of this project. Using a two-zone model Ricardo WAVE provides time-dependent thermodynamic and fluid dynamic simulation of gasses through a modelled engine system via one dimensional formulation [22]. WAVE analyses the dynamics of pressure waves, mass flows and energy losses through general and complex compressible-flow fluid networks [33]. These networks are representative of the specified engine geometry and are produced using a series of ‘building blocks’ including but not exclusively, constant area or tapered pipework, junctions, termination points and infinite plenums.
3 RICARDO WAVE ENGINE SIMULATION SOFTWARE CHOICE AND VALIDATION
Due to the time constraints and budget allocated to this project, the choice of engine simulation software is limited to company sponsorship with the University of Hertfordshire’s Formula Student team. Fortunately Ricardo Software has been in partnership with UH Racing for a number of years, providing software licences, technical support and tutorials to the team [34]. The product specifically selected to complete the project was Ricardo WAVE 1D engine simulation software.
To meet the aims and objectives of this project, it was imperative to use software that is both accurate and reliable, to ensure a validated turbocharged twin cylinder engine model was produced. Ricardo WAVE is used worldwide and is an ISO accredited 1D engine simulation software package, proving its reliability and accuracy within industry. Major OEMs including Jaguar Land Rover [35] and Ford [36] have used Ricardo WAVE to develop engines from the initial design process, through conceptual phases and even optimising already completed engine designs [37].
An in-depth study carried out by the Ducati Motor S.p.A proved the benefits, reliability and accuracy of Ricardo WAVE software in an application of high relevance to this project. Ducati Motor S.p.A used Ricardo WAVE software to improve engine performance during the evolution of the Ducati 900 SuperSport motorcycle, a twin cylinder naturally aspirated engine powered motorcycle similar to the engine outlined in this project.
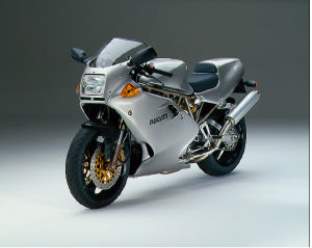
Figure 3‑1 Ducati 900SS Motorcycle Previous Generation
The scope of the Ducati project was to improve the peak performance of the engine by five horsepower, with an additional increase of torque in the lower rpm range. A comparison between the engine simulation data and physically measured data was carried out and proved the accuracy of Ricardo WAVE simulation software. This enabled the validation of the base simulation model, for use as a development platform, to test multiple concepts to meet the performance goals for the revised engine. It was the possible for the Ducati engineers to meet and exceed the performance targets for the new engine, producing a 5-7% improvement in power and a smooth increase in torque, whilst remaining within the tight three month deadline [38].
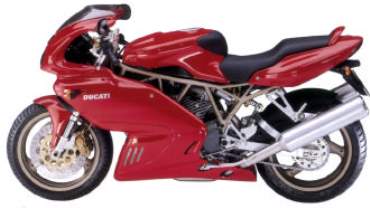
Figure 3‑2 Ducati 900SS Motorcycle Revised Model using Ricardo WAVE Software
From the gathered research regarding the use of Ricardo WAVE simulation software, it can be determined that it was a suitable tool for the production of a valid turbocharged twin cylinder engine model. 1D engine simulation software and the principles behind the inner functions of the software mean that theoretically an accurate engine model can be produced; hence the existing range of engine simulation software on the market. With regards to Ricardo WAVE in particular there is extensive literature written by Ricardo itself promoting the accuracy and reliability of the software. This accuracy is reiterated from numerous research reports for a range of different engine setups. Of particular importance for the validation of the simulation model for this project was the Ducati Motor S.p.A report ‘Application of WAVE in Motorcycle Prototyping’. Within the report extreme accuracy of the simulation data to empirical data of a twin cylinder engine model was stated, hence promoting validation of the models outlined throughout this project [38].
4 SIMULATION OF THE UH19 N/A AND UH20 TURBOCHARGED CBR500R
As stated previously within the report, due to the lack of direct empirical data available for a turbocharged CBR500R engine for comparison, it was deemed necessary produce a validated naturally aspirated CBR500R first. To achieve this, the engine simulation model was divided into three subsections consisting of ‘inlet’, ‘engine’ and ‘exhaust’. This aided the validation of the turbocharged simulation as the entire validated ‘engine’ subsection from the naturally aspirated simulation could be carried forward onto the turbocharged simulation. Comparison between available empirical data for the naturally aspirated configuration enabled one to validate the naturally aspirated simulation with regards to engine specific parameters such as geometry, combustion model, heat transfer model, friction coefficients and mechanical valve timing.
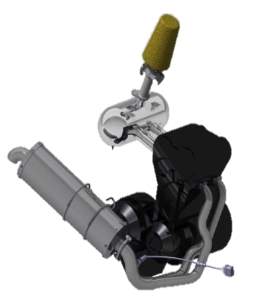
Figure 4‑1 UH19 Chassis’ Honda CBR500R Powertrain Unit |
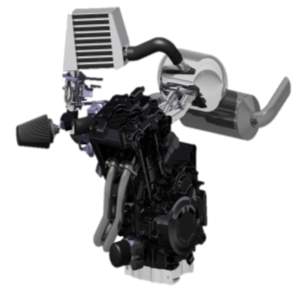
Figure 4 ‑ 2 UH20 Chassis’ Honda CBR500R Turbocharged Powertrain Unit |
4.1 UH19 AND UH20 ENGINE SUBSECTION
The engine subsection modelled within the Ricardo WAVE simulation software canvas can be seen in Figure 4-3 with corresponding Computer Aided Design (CAD) image in Figure 4-4. Detailed within the engine subsection are all parameters from the intake cylinder head port orifices to the cylinder head exhaust port orifices. The engine subsection remained unchanged between the naturally aspirated model and turbocharged model at the request of the UH Racing team allowing one to meet the aims of the project, to produce a simulation model as a development platform for the team.
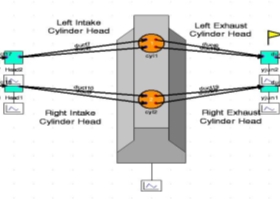
Figure 4‑3 Ricardo WAVE Engine Subsection Model |
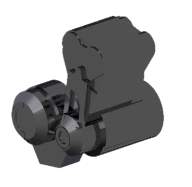
Figure 4‑4 Corresponding Engine Subsection CAD Image |
4.1.1 ENGINE GEOMETRY
Engine geometry was collected for input into Ricardo WAVE simulation software via research and measurement techniques. The Honda CBR500R service manual 2013 outlined many of the essential geometric dimensions required for the simulation shown below [39]:
Engine Cycle: Four Stroke Engine Cycle
Number of Cylinders: 2
Injection Type: Port Injection
Cylinder Orientation: Twin Cylinder 180 Degrees Offset
Bore and Stroke: 67 x 66.8 mm
Displacement 471cm3
Compression Ratio: 10.7:1
Firing order: 1 – 2
The remaining required data such as valve timing, valve size, head geometry, connecting rod length and connnecting rod diameter had to be physically measured from the CBR500R engine. The combination of the data input into the system can be observed in Appendix F, the following figures show a selection of measurements and inputs into the WAVE canvas.
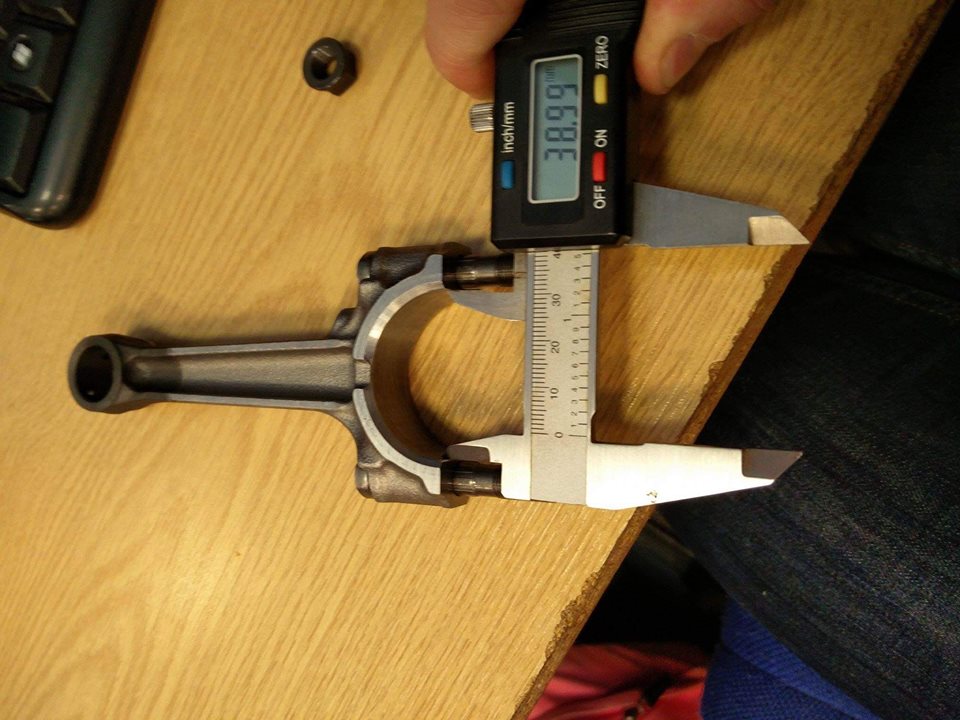
Figure 4‑5 Measuring Connecting Rod Dimensions |

Figure 4‑6 Calculating Connecting Rod Length |
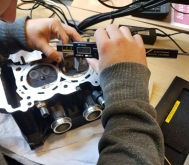
Figure 4‑7 Measuring Valve Diameters |
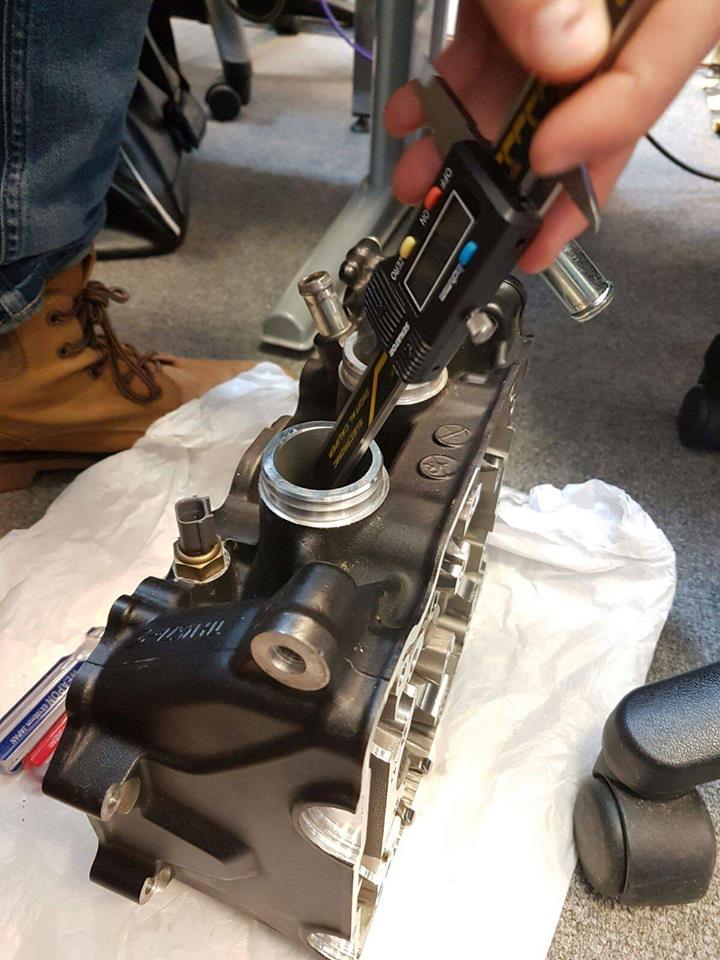
Figure 4‑8 Measuring Head Parameters |
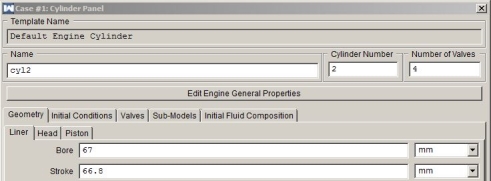
Figure 4‑9 Input of Cylinder 2 Data into the WAVE Canvas (Bore and Stroke)
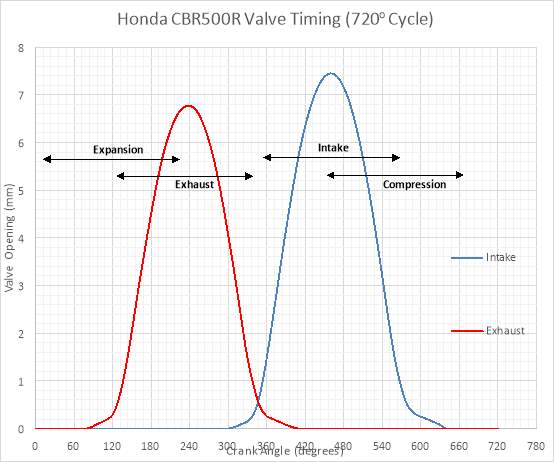
Figure 4‑10 Valve Timing and Lift Data for CBR500R Curtesy of UH Racing
As outlined within Chapter 2.3.2, valve timing is an extremely important factor for an engine to run correctly and to produce its optimum possible performance. Therefore it was essential to input accurate valve timing and corresponding lift data into the simulation model. Figure 4-10 shows the measured values of valve timing and lift for UH Racing’s Honda CBR500R. Measurements were carried out using a dial gauge placed on the valve bucket while the crankshaft was rotated. A measurement of both exhaust and inlet valve displacement was taken at every 10º of engine crank rotation through 720º. Appendix G contains other important valve information that was input into Ricardo WAVE software, separated into exhaust and inlet valve such as valve discharge coefficients.
4.1.2 ENGINE COMBUSTION MODEL
Due to budget and time constraints associated with the Formula Student project, it was not a viable option to measure the mass-burn vs time profile for a range of engine speeds. Therefore a suitably accurate combustion model was used within the simulation, known as the Wiebe model. The Wiebe combustion model as described in Chapter 2.4.2 provides an extremely accurate assumption of the combustion process within the combustion chamber, and is deemed an appropriate combustion model throughout literature and is explicitly recommended by Ricardo Software [33] where measured combustion models are not possible. Combustion start times were evaluated from readings from the ECU for each engine speed case; these can be observed within Appendix H.
4.1.3 ENGINE HEAT EXCHANGE MODEL
The heat exchange model used across the simulation was the Woschni heat transfer model. As described within Chapter 2.4.4 above it is commonly used throughout all engine simulation packages due to its accuracy. The Woschni model ‘views the charge as having a uniform heat flow coefficient and velocity on all surfaces’ [33] and is deemed suitably accurate in this application, both from Ricardo Software and from surrounding literature.
4.1.4 ENGINE FRICTION COEFFICIENT INPUT
An essential input for the simulation to obtain accurate and reliable results was the friction coefficients within the engine. Ricardo WAVE uses the Chen-Flynn friction correlation model described in Chapter 2.4.3 above to calculate the FMEP (Friction Mean Effective Pressure) of the engine from four input coefficients ACF, BCF, CCF and QCF. The inability to measure the FMEP values from the engine due to resource and time constraints meant that coefficients of the Chen-Flynn model needed to be calculated in order to produce an accurate and reliable model. Gordon P. Blair offers an equation to calculate FMEP values for engine sizes similar to the Honda CBR500R [40]. Figure 4-11 shows the values of the input coefficients, the validation of these will be shown in Chapter 4.5.2.
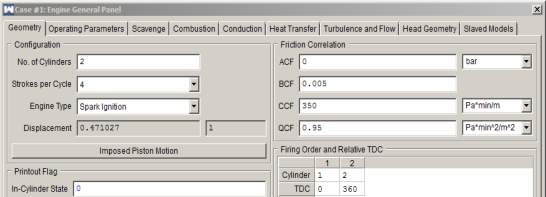
Figure 4‑11 FMEP Coefficients within the Simulation Engine
4.2 UH19 NATURALLY ASPIRATED CBR500R MODELLING
The following subsections show the specific modelling of UH Racing’s naturally aspirated CBR500R powertrain configuration, for which test data allowed for comparison and validation of Ricardo WAVE software, modelling techniques and coefficients used within the simulation.
4.2.1 UH19 INTAKE SUBSECTION
The exact intake geometry and material properties of the intake were provided by the UH Racing team. This enabled the simulation modelling of the intake to be extremely accurate. Physical part and CAD model data measurement allowed the exact dimensions of each component to be replicated within the canvas of Ricardo WAVE software. Figure 4-12 shows the translation of each component onto the simulation canvas.
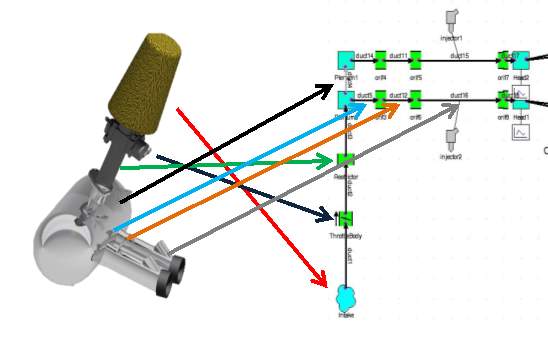
Figure 4‑12 UH19 Intake Setup Translated onto the WAVE Canvas
The following figures show a selection of the more complex intake components modelled within the WAVE canvas shown in Appendix I.
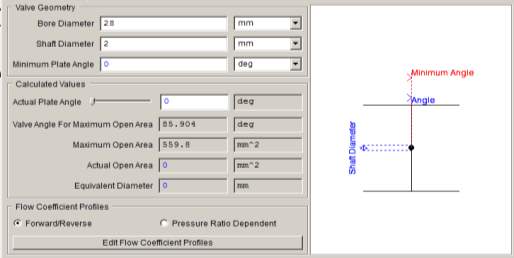
Figure 4‑13 Throttle Butterfly Valve, Named ‘ThrottleBody’ Above
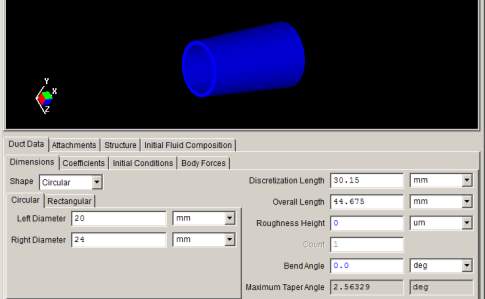
Figure 4‑14 Rear Restrictor Section ‘duct3’ Single Aluminium Section
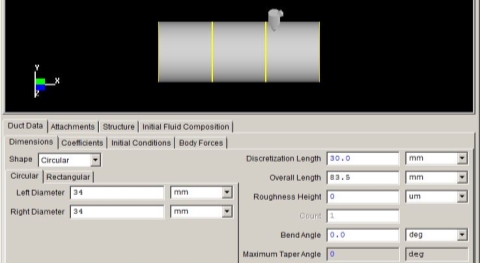
Figure 4‑15 Right Intake Runner ‘duct16’ Aluminium Section with Injector
4.2.2 UH19 EXHAUST SUBSECTION
Similarly to the intake geometry, accurate dimensions were gathered from physical measurement and CAD data for the exhaust subsystem. The exhaust system comprised of mild steel tubing coated with Zircotec© ceramic material. The translation of geometry to the simulation canvas can be observed in Figure 4-16 below.
Figure 4‑16 UH19 Exhaust Setup Translated onto the WAVE Canvas
The exhaust piping was appropriately modelled within Ricardo WAVE using two homogenous layers of different material properties, thus allowing the properties of both the steel and Zircotec© material to be modelled accurately. The silencer component was accurately replicated within the simulation software by use of the silencer tool. The silencer tool creates the geometry of the exhaust by creating a series of connected Y junctions within a wadded duct; this accurately simulates the flow through the perforated tube within the silencer can. The wadding material was carefully selected from the roster, with the most similar properties to those used within the vehicle. The packing density was determined by disassembling the physical exhaust silencer and measuring the mass of wadding within the volume. The following figures show details of the simulation exhaust pipes and silencer can.

Figure 4‑17 ‘Duct41’ Dual Material Bend After the Collector Section |
Figure 4‑18 ‘Duct32’ Showing the Dual Material Property Input |
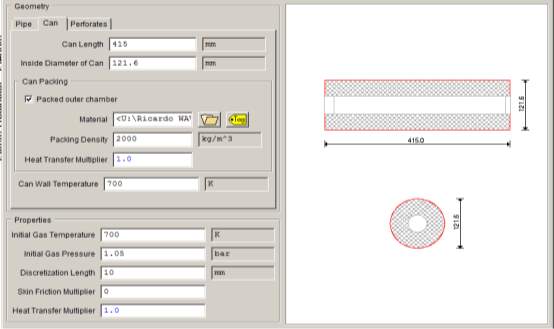
Figure 4‑19 Exhaust Silencer Input from Measured Values |
4.2.3 UH19 SIMULATION MODEL OVERVIEW
The entire simulation canvas model comprising of the ‘engine’, ‘intake’ and ‘exhaust’ subsections can be observed in Appendix I.
4.2.4 UH19 SIMULATION CONSTANTS
Working closely with the UH Racing powertrain department it was possible to extract vital constant parameter information from the dynamometer runs from the vehicles ECU. Using the data collected as simulation constants for initial conditions meant that accuracy to empirical data could be maintained, aiding the validation of the model. By using measured data from the engine and running a large number of simulation cycles, convergence of the model could occur much more quickly and with greater accuracy. Appendix H shows the simulation constants, highlighted in yellow are the constants made available from the engines ECU. Those not highlighted are essential for the simulation to run, so data was used on recommendation from Ricardo Software for this typical engine application. Again the model converges upon the theoretical answer after numerous cycles therefore inaccuracies within the inputted data will be negated through the large amount of simulation cycles.
4.2.5 UH19 SIMULATION GLOBAL PARAMETER SETTINGS
As stated above, convergence onto a final solution is important in obtaining accurate results against empirical data. Ricardo Software suggests a 30 cycle simulation for a naturally aspirated setup, and hence this value was used as shown in Figure 4-20.
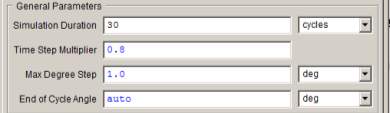
Figure 4‑20 UH19 Simulation Global Parameter Settings
4.3 UH19 SIMULATION OUTPUT
Collating the model canvas, simulation constants and global parameter settings the simulation was ran in the steady state function at 250 rpm increments from 1000 rpm to the engines rev limiter at 10,000 rpm, where convergence occurred across all speed cases. The simulation output file can be observed in Appendix J showing a huge range of measurements. The engine knock model was not run for this output however viewing the maximum in cylinder pressures (PMax values in Appendix J), the limit of 75 Bar stated by Ricardo Software [33] was not met. Unfortunately due to lack of equipment it was not possible to undergo exhaust gas analysis or a volumetric efficiency measurement; however these methods could have been utilised to validate the model if the equipment was available.
For this report engine power, torque and sound emission was focussed on for validation. The simulation output files for these are displayed below in Figure 4-21 and Figure 4-22. Appendix K shows the WAVE microphone location, compliant to Formula Student ruling IN10.2.4-‘Measurements will be made with a free-field microphone placed free from obstructions at the exhaust outlet level, 0:5m from the end of the exhaust outlet, at an angle of 45° with the outlet in the horizontal plane. [41]’
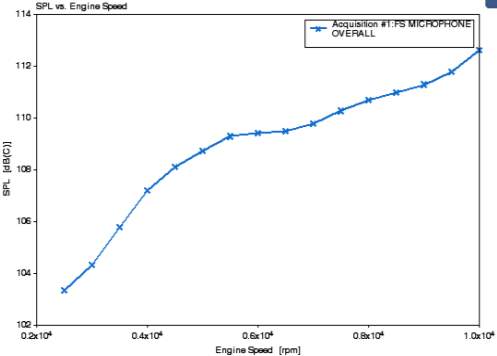
Figure 4‑21 Ricardo WAVE Powertrain Sound Emission from UH19’s CBR500R
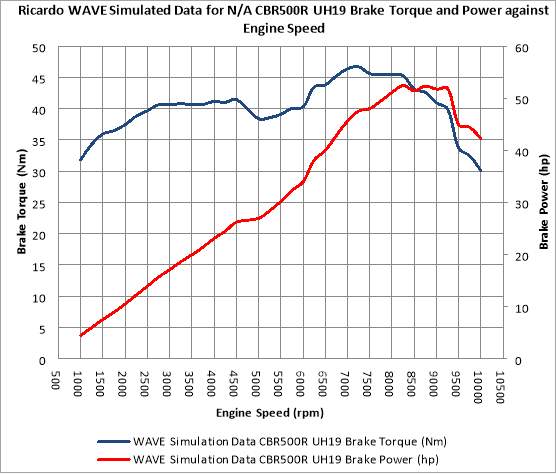
Figure 4‑22 Ricardo WAVE Simulation Results for UH Racing’s UH19 Powertrain Setup
4.4 UH19 CBR500R EMPIRICAL TEST DATA
To obtain empirical data for the engine, the UH19 CBR500R setup was ran on the University of Hertfordshire’s DynoDynamics rolling road facility to obtain torque and power curve data against engine speed. The data obtained allows for direct comparison of power and torque figures for the simulation against the experimental data. Another comparison method between the simulation and empirical is the comparison of sound emission levels from the engine setup to those calculated by Ricardo WAVE.
4.4.1 ENGINE DYNAMOMETER RESULTS
Three dynamometer runs from the UH19 setup were specifically selected, as the ambient conditions for each of the runs were coincident. It was these initial conditions that were input into the simulation constant panel (Appendix H) to allow for direct comparison of data. Three dynamometer runs were chosen to allow averaging of the data to improve the accuracy. The averaged data can be observed in Chapter 4.5.1. An image of the raw DynoDyanmics data for the run can be observed in Figure 4-23. Appendix L shows the vehicle operating on University of Hertfordshire’s DynoDynamics dynamometer where the data was gathered and collected.
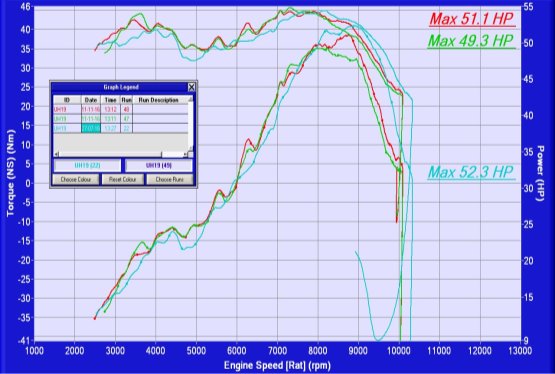
Figure 4‑23 DynoDynamics Dynamometer Data from UH19’s CBR500R Engine
4.4.2 ENGINE SOUND EMISSION RESULTS
From data collected from the Formula Student competition at Silverstone 2016 comparative sound emission data could be collected to allow a secondary validation of the model outside of power and torque values.
Table 1 Vehicle Sound Emission Data Collected from the UH Racing Team
| Engine Speed (rpm) | Measured Engine Noise Emission (dB(C)) | Maximum Allowable Engine Noise Emission (dB(C)) |
| 2000 | 103 | 103 |
| 7000 | 110 | 110 |
4.5 COMPARISON AND VALIDATION OF THE UH19 CBR500R MODEL
Comparison of the data obtained from Ricardo WAVE and the empirical data collected allowed comment to be made upon the validity of the simulation model against the actual engine, allowing the progression to a validated turbocharged simulation model.
4.5.1 BRAKE ENGINE POWER AND TORQUE
Figure 4-24 shows the direct comparison of brake power and torque against engine speed, within this it can be seen that the simulation data indicates an extremely positive correlation against the empirical data. The simulation data follows the drop in both torque and power between the 4500-6500 rpm range, followed by a spike between 7000-9000 rpm then finally toward the engines red-line a drop off in both power and torque. From observing the four plots alone it can be determined that an accurate and validated model has been produced; numerical calculations can confirm the accuracy in Chapter 4.5.2.
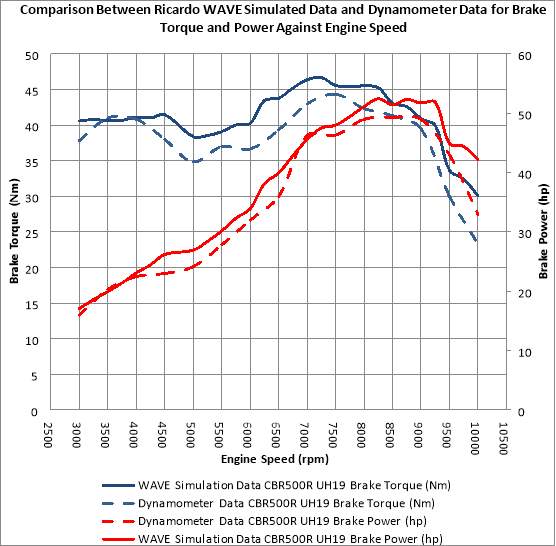
Figure 4‑24 Comparison Graph between Empirical and Simulation Power and Torque
4.5.2 MEAN EFFECTIVE PRESSURES ANALYSIS
Friction Mean Effective Pressure (FMEP)
As described in Chapter 4.1.4 the determination of the FMEP coefficients needed to be estimated due to the lack of resources to measure the internal friction of the engine at the case speeds. Values of ACF, BCF, CCF and QCF were input into the model and iterated until correlation with values obtained within the literature was achieved. Gordon P. Blair offers Equation 2.1 to calculate FMEP values for engines smaller than 500cc and is validated through numerous case studies for a range of
FMEP=100000+100∙500-Swept Vol.+350∙stroke∙rpm
[40]
(2.1)
Table 2 Comparison of Simulation and Empirical FMEP Values
| Engine Speed (rpm) | From Calculation
FMEP (bar) |
From Simulation:
FMEP (bar) |
Percentage Difference (%) |
| 3000 | 0.70 | 0.7555 | 7.56 |
| 4000 | 0.94 | 0.952 | 1.68 |
| 5000 | 1.17 | 1.151 | 1.63 |
| 6000 | 1.40 | 1.408 | 0.30 |
| 7000 | 1.64 | 1.711 | 4.48 |
| 8000 | 1.87 | 1.989 | 6.28 |
| 9000 | 2.11 | 2.268 | 7.73 |
From the comparison of the data above it was determined that accurate input values of ACF, BCF, CCF and QCF have been achieved across the engine speed range obtaining a mean percentage difference of 6.77%. By validating the FMEP values conclusions can be drawn on validity by looking at BMEP and IMEP values for the simulation results.
Brake Mean Effective Pressure (BMEP)
BMEP values from the simulation are available as a value of bar, these can be observed within Appendix J for each individual case. The BMEP values for the physical engine were calculated using averaged torque dynamometer values of the three curves from Figure 4-23 using Equation 2.2 below:
BMEP=2π ∙Torque ∙No. Rev Per Power StrokeVolumetric Displacement
(2.2)
Table 3 Comparison of Simulation and Empirical BMEP Values
| Engine Speed (rpm) | From Calculation
BMEP (bar) |
From Simulation:
BMEP (bar) |
Percentage Difference (%) |
| 3000 | 10.09 | 10.9 | 7.98 |
| 4000 | 10.89 | 11 | 0.97 |
| 5000 | 9.29 | 10.23 | 10.08 |
| 6000 | 9.78 | 10.79 | 10.30 |
| 7000 | 11.47 | 12.28 | 7.04 |
| 8000 | 11.74 | 12.08 | 2.90 |
| 9000 | 10.54 | 10.91 | 3.52 |
As Table 3 describes, the BMEP values from the simulation obtains an extremely positive correlation to those observed from the dynamometer. This coincides with the previous findings showing an extremely accurate model has been created. A mean percentage difference of 6.1% proves the modelling and sub-models selected are valid for the simulation.
Indicated Mean Effective Pressure (IMEP)
The indicated mean effective pressure is simply the FMEP in addition to BMEP values. Again the results were obtained from the output file visible in Appendix J. A comparison of IMEP values shows close accuracy between calculated and simulated values, with an averaged error of 8.5%. From this it again can be determined that a validated engine simulation model has been created.
Table 4 Comparison of Simulation and Empirical IMEP Values
| Engine Speed (rpm) | From Calculation
IMEP (bar) |
From Simulation:
IMEP (bar) |
Percentage Difference (%) |
| 3000 | 10.80 | 11.76 | 8.92 |
| 4000 | 11.83 | 12.07 | 2.02 |
| 5000 | 10.46 | 11.6 | 10.86 |
| 6000 | 11.19 | 12.47 | 11.47 |
| 7000 | 13.11 | 14.36 | 9.53 |
| 8000 | 13.61 | 14.6 | 7.27 |
| 9000 | 12.64 | 13.85 | 9.54 |
4.5.3 EMITTED SOUND LEVEL dB(c)
The final validation may be considered as a trivial comparison and validation method however Gordon P. Blair states within his literature the accuracy and the gravity behind engine simulation software noise simulation capabilities [40]. The measured values from the UH19 vehicle showed high correlation to simulation results, with a maximum percentage difference of 0.5%. Unfortunately only two engine speeds could be compared, however the accuracy observed here again tends to the validation of the model to allow production of the turbocharged model.
Table 5 Comparison of Simulation and Empirical Noise Emmission Values
| Engine Speed (rpm) | Measured Engine Noise Emission (dB(C)) | Simulation Engine Noise Emission (dB(C)) | Percentage Difference (%) |
| 2000 | 103 | 103.2 | 0.19 |
| 7000 | 110 | 109.5 | 0.45 |
4.6 UH20 TURBOCHARGED CBR500R MODELLING
To meet the aims and objectives of the project, arguably the most important factor was to generate a validated UH19 engine model and compare to the empirical data. From this it can be determined the modelling techniques, coefficients and geometries of the engine followed were correct and hence the principles can be carried forward onto the turbocharged model to produce an accurate and valid turbocharged model. Working in collaboration with UH Racing a suitably turbocharged engine concept was created for which accurate data was obtained from manufacturers for components in the system such as the turbocharger and intercooler.
4.6.1 UH20 TURBOCHARGED ENGINE SUBSECTION
The entire validated engine subsection from the naturally aspirated simulation was carried forward to the turbocharged model. This included the geometries (such as valve timing, lift and coefficients), combustion model, heat exchange models and friction coefficients of ACF, BCF, CCF and QCF. Promoting the creation of a valid turbocharged model.
4.6.2 UH20 INTAKE SUBSECTION AND INTERCOOLER
The intake system of the turbocharged simulation was modelled using ducts and orifices, similar to the naturally aspirated model. The specific properties were gathered from UH Racing’s CAD model data, including not only geometric but also prospective material properties. The translation of the data to the WAVE canvas can be seen in Figure 4-25 below. It can be observed that the intake system from the plenum forward has remained the same, this again is at the request of the UH Racing team, to meet the project objective of creating this model as a development platform.
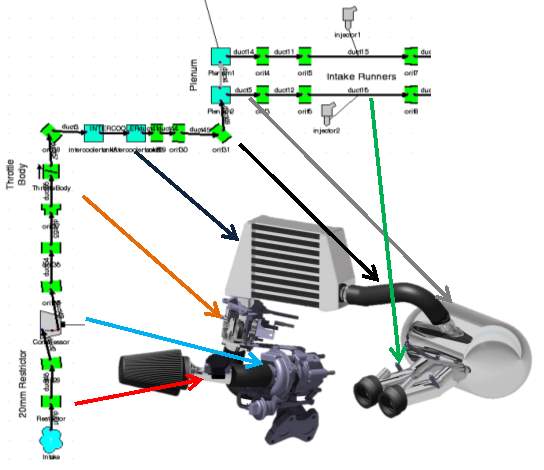
Figure 4‑25 UH20 Intake Setup Translated onto the WAVE Canvas
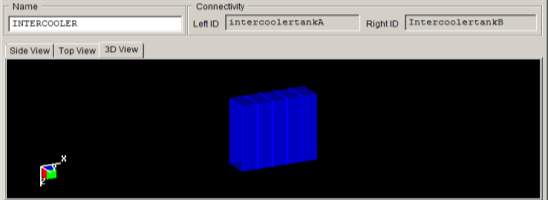
Figure 4‑26 ‘Intercooler’ Core Section Modelled as Square Ducting
The intercooler plays and important role in the turbocharged system keeping inlet charge temperatures down to prevent engine knocking and poor performance. UH Racing have designed a bespoke intercooler in collaboration with Hanon Systems to use on the UH20 turbocharged CBR500R setup. Unfortunately for confidentiality reasons, intricate details of the system cannot be published; however the data provided by Hanon Systems could be manipulated and entered into Ricardo WAVE using the heat exchanger function.
The core of the intercooler section was modelled as a square duct of specified surface area and volume (seen in Figure 4-26); the intercooler tank ends were modelled as Y-Junctions to accurately simulate the volumes within the system. The heat exchanger model encapsulated the entire intercooler section, ‘Intercooler Tank A’, ‘Intercooler Core’ and ‘Intercooler Tank B’. Unlike duct modelling previously observed within the turbocharged and naturally aspirated models, material properties of the intercooler were not applied in the geometry windows. The system was given characteristics for friction and heat losses through the heat exchanger maps shown below from data extrapolated from the raw data supplied by Hanon. This ensured the cooling and pressure drop properties across the intercooler were accurate in regards to the physical system.
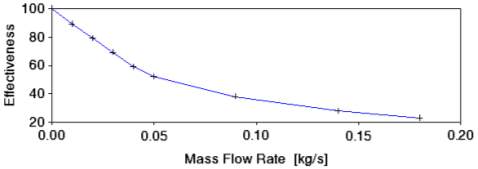
Figure 4‑27 Intercooler Effectiveness against Inlet Charge Mass Flow Rate
Figure 4-27 describes the heat dissipation properties of the intercooler, with an air on face temperature of 25⁰C at a velocity of 8m/s and standard air density.
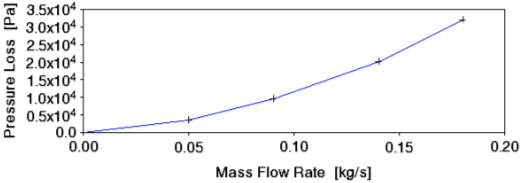
Figure 4‑28 Intercooler Pressure Loss against Inlet Charge Mass Flow Rate
Figure 4-28 describes the pressure drop of the inlet charge within the intercooler due to friction within the entire intercooler system.
4.6.3 UH20 EXHAUST SUBSECTION
Again similarly to the turbocharged intake system the exhaust system was modelled very similar to the naturally aspirated model. The UH Racing team’s CAD provided the geometries of the system including lengths, bends and also the material properties of the system. Like the naturally aspirated system, UH Racing continued use of the Zircotec© coating on the steel tubing and these material properties were continued through to the turbocharged simulation model. The exhaust silencer can was generated within the WAVE silencer tool using the same method described previously. The main difference between the proposed turbocharged model and the naturally aspirated model was an increased pipe diameter throughout the system to promote improved exhaust gas flow.
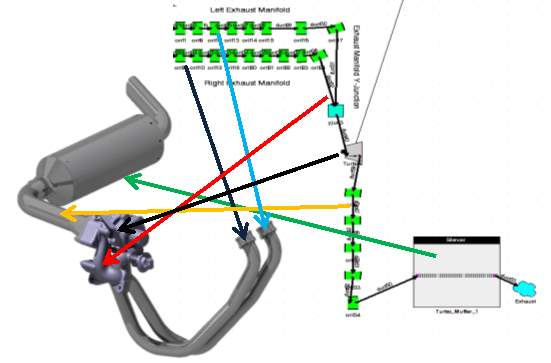
Figure 4‑29 UH20 Exhaust Setup Translated onto the WAVE Canvas
4.6.4 UH20 COMPRESSOR MODELLING
Unfortunately due to the confidentiality agreement between UH Racing and Garrett by Honeywell, raw data for the chosen GT06 turbocharger could not be published with regards to compressor specifics. However a crude compressor map can be observed within Appendix M for reference. From the extensive raw data plots provided to the team, using the TCMAP manipulation tool, it was possible to input the data into Ricardo WAVE software. From the inputted data the software generates an advanced compressor map including surge lines and efficiency contours way beyond the range of what is provided by the manufacturer, observed in Figure 4-30. Hence a turbocharger response can be induced outside of the standard conditions for the turbocharger, allowing engine parameters to be observed under all operating conditions. This allows the model to act as a development platform so variables can be changed to ensure optimum turbocharger response and engine performance.
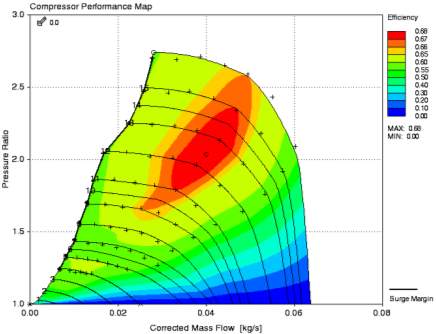
Figure 4‑30 Ricardo WAVE Generated Compressor Map for the Simulation Model
4.6.5 UH20 TURBINE MODELLING
Similar to the compressor data, due to confidentiality, the turbine data from Garrett by Honeywell could not be published directly within this report. Appendix M shows the crude turbine map for the GT06 turbocharger. By selecting the maximum efficiency points from the speed contour lines and inputting the raw data, Ricardo WAVE using the TCMAP tool again, can accurately extrapolate the turbine data for efficiency and mass flow against pressure ratio outside of the manufacturer provided data. Meaning turbine response can be observed over all engine speed ranges, allowing one to optimise engine geometries to increase the engines performance. The extrapolated plots can be observed in Figure 4-31 and 4-32 below.

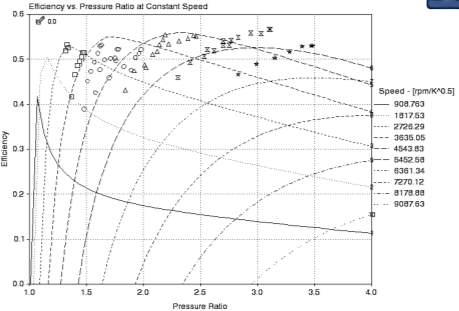
Figure 4‑31 Turbine Efficiency against Pressure Ratio

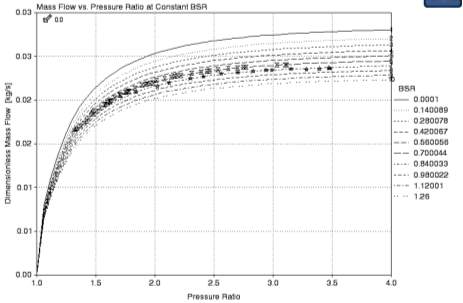
Figure 4‑32 Turbine Dimensionless Mass Flow against Pressure Ratio
4.6.6 UH20 TURBOCHARGER BEARING MODELLING
To accurately simulate the response of the turbocharger within the system, ensuring the exhaust charge pulses act on the turbocharger similar to reality, it was essential to input the accurate data for the GT06 bearing system. Garrett by Honeywell provided UH Racing with accurate moment of inertia data for the turbine wheel, compressor wheel, shaft and bearing system and this was input directly into the ‘Turbo Shaft Panel’. Due to time constraints within the project, physical turbocharger initial speeds could not be measured. To overcome this, a separate simulation was carried out with the turbocharger speed set at 0 rpm at 1000rpm engine speed for 150 simulation cycles. Using such a high number of cycles meant that the simulation would run converging to an extremely accurate result.
Within the WAVEPOST program the converged value for turbocharger speed could be captured and used as an initial value for the simulation across the speed range. The speed option for the turbocharger was set to ‘balanced’ as the GT06 turbocharger has a fixed ratio between the turbine and compressor wheel. WAVE has the capability to input numerous speed types for turbocharger operation such as internally geared or geared from the engines crankshaft. Figure 4-33 shows the bearing inertia input value for the GT06 turbocharger and the speed option selection.
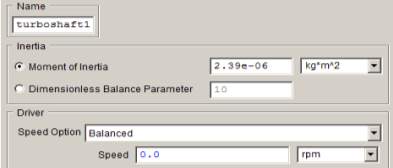
Figure 4‑33 WAVE Turboshaft Input Panel
4.6.7 UH20 BOOST CONTROLLER IMPLEMENTATION
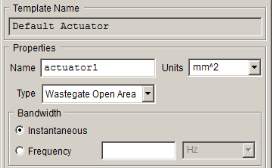
Figure 4‑34 Turbo Wastegate Actuator with Instantaneous Bandwidth |
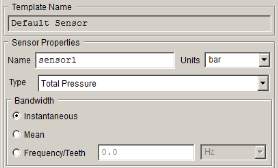
Figure 4‑35 Inlet Plenum Pressure Sensor with Instantaneous Bandwidth |
Without a boost controller within the system, the turbocharger would be able to spool without any control, bringing with it negative impacts such as the compressor falling out of efficiency range, engine knocking and insufficient fuel provided by the injectors for the amount of air supplied to the inlet runners. A boost controller was implemented across the system using a turbo wastegate actuator (Figure 4-34) and a total pressure sensor (Figure 4-35) placed inside the inlet plenum. A total pressure value was set to 1.5 bar by the UH Racing team, as this was deemed suitable with fuelling constraints, intercooler and turbocharger specifications. Appendix N shows the simulation model overview where this can be seen visually.
The controller used to manage the boost pressure within the inlet plenum, via wastegate actuation is known as a proportional-integral-derivative controller (PID controller). A PID controller is a control loop feedback controller, which continually calculates an error value to the target (in this case total pressure in the inlet plenum). From the error it applies a correction to the wastegate open area based on the proportional, integral and derivative terms to meet the required target. Figure 4-36 shows the development of the controller where initially an input sweep was run across the engine speed range. So for each speed case a range of output values could be obtained for the controller for the proportional value.
Running a step response from the input sweep values, utilising the ‘Ricardo No Lag’ method allowed for the production of the integral and derivative terms for the system. The ‘Ricardo No Lag’ is explained in full detail within the ‘WAVE Manual 2015’ visible in the bibliography which explains the theory behind the method which allowed one to obtain the steady state outputs for the integral and derivative values for the system. Figure 4-36 shows the output values across numerous engine speed cases (plot shown for case 9, engine speed 3250 rpm) obtained after running the input sweep and step responses. Using these numbers it was possible to build and maintain a total pressure of 1.5 bar within the inlet plenum. The maximum wastegate open area was obtained by measuring the GT06 turbocharger and was input into the actuator panel to ensure the PID controller would not exceed a value greater than physically possible.
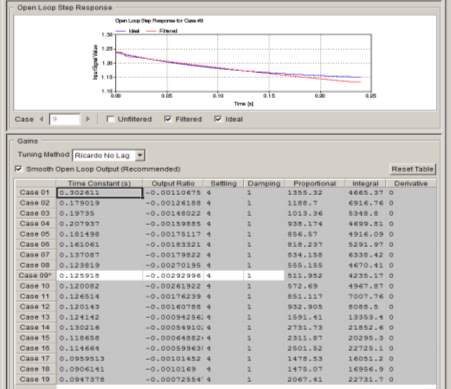
Figure 4‑36 PID Controller Values from Input Sweep and Step Response
4.6.8 UH20 SIMULATION MODEL OVERVIEW
The entire simulation canvas, including all elements such as the controller, actuator, sensor and turbomachinery can be observed in Appendix N. Note that within the canvas the ‘engine’ subsection did not change between the validated naturally aspirated simulation model and the turbocharged simulation model, aiding to the validation of the turbocharged model.
4.6.9 UH20 SIMULATION CONSTANTS
Again limited by time constraints within the project meant that unlike the validated naturally aspirated model, simulation constant data could not be gathered from the engines ECU because a physical powertrain had not been fully developed at this time. Working alongside UH Racing, collating data found within the literature search and recommendations from Ricardo Software it was possible to input suitable values for parameters such as air-fuel ratio for the system. Appendix O shows the constants panel used to run the UH20 turbocharged simulation.
4.6.10 UH20 GLOBAL PARAMETER SETTINGS
As emphasised within the naturally aspirated simulation model, global parameter settings were essential to enable accurate converged results. Ricardo recommends, for a turbocharged simulation, a simulation duration of 50-80 cycles. To promote the most accurate convergence within the model an 80 cycle duration time was chosen to ensure the model results were accurate whilst being produced within a suitable timeframe of less than 24 hours.
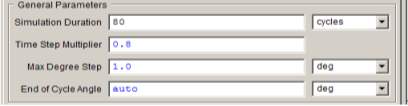
Figure 4‑37 UH20 Simulation Global Parameter Settings
4.7 UH20 SIMULATION OUTPUT
The observed model canvas, global settings and simulation constants were run in the steady state condition; with an increasing engine speed of 250rpm between each case from 1000 rpm to the engines redline of 10000 rpm. Convergence was observed across all engine speed cases meaning accurate results to the input data were obtained. Figure 4-38 below shows the power and torque curves from the simulation result and the raw output data can be observed in Appendix P. For this simulation as mentioned previously no empirical data could be obtained so the focus here was to show the power and torque improvements, to meet the aims and objectives for UH Racing. Figure 4-39 shows the comparison of the UH19 N/A CBR500 and the UH20 Turbocharged CBR500 simulation models. Note that above the engine speed of 4500 rpm the turbocharged model dramatically increases in torque and power, this coincides with the completed spooling of the turbocharger and maintenance of 0.5 bar of boost pressure within the inlet plenum.
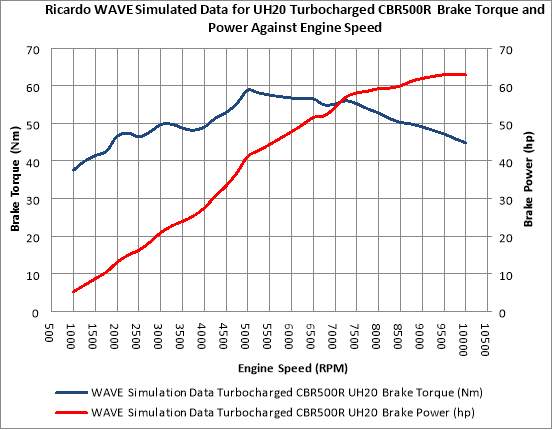
Figure 4‑38 UH20 Turbocharged CBR500R Simulation Results
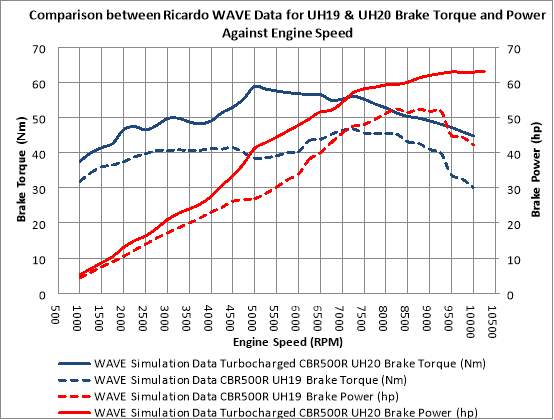
Figure 4‑39 UH20 and UH19 CBR500R Simulation Result Comparison
4.8 UH20 MODEL VALIDATION
To completely validate the model would require a functioning physical UH20 powertrain unit, to carry out a direct comparison to data gathered from the dynamometer. However within the timeframe and resources available this was not a possibility, hence why the aim of this project was to create a turbocharged model as a development tool for the UH Racing team. UH Racing endeavour to have a functioning turbocharged Honda CBR500R twin cylinder engine by June 2017, using this and the subsequent optimised model as a tool to base research and physical testing. However it is important to emphasise that at the time of writing (April 2017) an accurate and validated model was produced in regards to previous findings and input data.
The specific process outlined within this report, by producing a validated naturally aspirated model first, identifying potential downfalls within the software aided the validation of the UH20 turbocharged model. The completed ‘engine’ subsection was carried forward onto the turbocharged model; this included not only the geometries from inlet port to exhaust ports, but the friction coefficients, combustion model and heat transfer model that had previously been validated by obtaining an extremely close correlation to data collected from the dynamometer. Carrying out the simulation of the naturally aspirated model first also ensured that correct modelling techniques were determined and problems encountered with certain modelled geometries were captured early on within the project period. This meant that production of the inlet and exhaust geometries surrounding the turbo equipment were modelled using accurate techniques learnt from the previous simulation.
Furthermore all endeavours were made to acquire accurate data to input to the model with regards to intercooler, turbocharger machinery and material property data. Intercooler data directly from the manufacturer Hanon Systems was directly extrapolated and input into the system as a heat exchanger model. Thus the heat transfer and pressure drop of the charge through the system across the entire engine speed range would remain accurate to measured data. Ricardo Software states an alternative process to recreate an intercooler without creating a heat exchanger model is to use a duct with high friction and heat transfer coefficients to obtain results similar to those seen in component testing.
As this modelling process reduces computing power required for the simulation. However one decided to model the intercooler as a heat exchanger, although more complex and requires more computing power, the accuracy and validity of the simulation is promoted. Close communication with Garrett by Honeywell meant that it was possible to obtain vast quantities of data for the turbine, bearing system and compressor for the GT06 turbocharger that would normally remain disclosed. The benefits of obtaining a vast amount of turbomachinery data meant that the TCMAP program within WAVE had more than the required amount of points to develop compressor and turbine maps. This meant the maps were extrapolated by the program to a pressure ratio of one with extreme accuracy to the turbochargers physical performance, hence meaning accurate turbocharger response across the engine speed range, leading to a validated model.
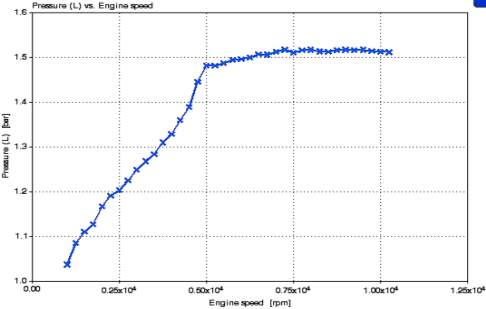
Figure 4‑40 Inlet Plenum Total Pressure Over Engine Speed Range
Viewing the output files for the turbocharged model and comparing the torque and power produced between the naturally aspirated and turbocharged engine (Figure 4-39) can give a final validation for the turbocharged model. In the engine speed range 1000-5000 rpm, the turbocharged model shows a gradual increase in power and torque in comparison to the naturally aspirated model. This is explained with the gradual rise in boost pressure in the inlet plenum volume observed in Figure 4-40, coinciding with the building of turbocharger speed in Figure 4-41 as to be expected from the model.
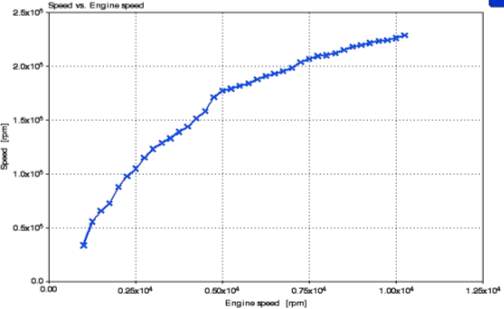
Figure 4‑41 Turbocharger Speed against Engine Speed
Above the engine speed of 5000 rpm, the boost threshold in the inlet plenum was met and a dramatic increase in torque and power was observed. This is explained as the wastegate actuator begins operation seen in Figure 4-42, which stopped the compressor over-spooling keeping the compressor in its most efficient operating window. This caused the maintained increase in torque and power. The wastegate continued to vary its open area to maintain the pressure in the inlet plenum at ≈1.5 bar, however as engine speed increased so did the compressor wheel speed. This explains the reduced rate of power and torque increase as the compressor reduced its efficiency. The characteristics shown are to be expected of the system as the compressor falls out of its efficiency window, hence proving the validity and accuracy of the turbocharged model.
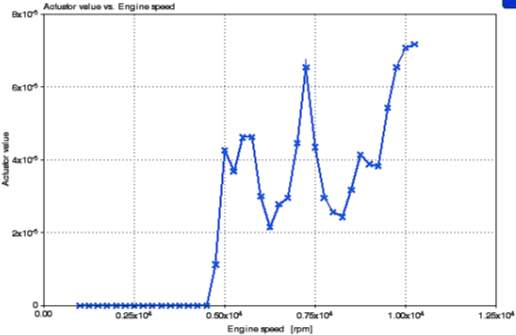
Figure 4‑42 Turbo Wastegate Actuator Values against Engine Speed
5 UH20 OPTIMISED TURBOCHARGED SIMULATION
5.1 OPTIMISATION PROGRAM
Working alongside the UH Racing team an optimisation program was designed to ensure that modifications proposed to the system, using the simulation software, could be implemented upon the vehicle for the 2017 competitions. This meant cost, available space envelopes and component manufacturability were taken into consideration, so dramatic engine modifications such as increasing engine displacement, increasing the boost pressures and change of fuel type were not considered. The focus relied upon adapting the inlet and exhaust geometries and running conditions within the engine to extract the maximum potential from the setup.
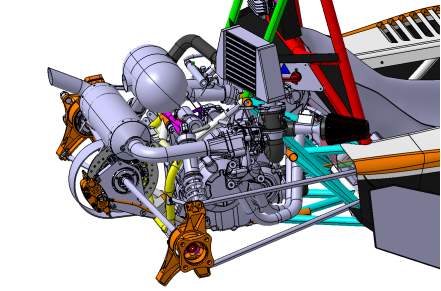
Figure 5‑1 UH20 Powertrain Layout Showing Tight Space Constraints
As visible within the CAD image of UH20 above, there was scope to dramatically change the size of the plenum and size and length of the intake runners. However when considering the exhaust packaging due to the tight confines around the suspension components only the pipe diameter changes were considered a viable option for the setup.
5.2 MODIFICATIONS UNDERTAKEN
The iterative process of improving the platform started by changing the cam timing by introducing more and less valve overlap within the engine. This was achieved by advancing and retarding the exhaust camshaft using a UH Racing designed camshaft sprocket. A trial and error approach was taken by advancing and retarding timing 10 crank angle degrees, in increments of two degrees. An improvement of 1.9 peak horsepower was obtained by retarding the exhaust valve by four crank degrees. Developing on this improvement, viewing the power and torque curves from the optimised engine it was necessary to adapt the naturally aspirated derived engine redline as the power curves continued to increase towards the existing limit. By upping the turbocharged engine’s redline to 11,500 rpm, a further 1.1 horsepower was extracted compared to the standard turbocharged simulation.
The inlet plenum volume was increased incrementally in 0.1 litre increments until peak performance was obtained at a total plenum volume of four litres. This caused a drop in torque and horsepower in the engine speed range of 1000-4000 rpm, however caused a gain in peak performance at 9500 rpm of 1.2 horsepower. This will be beneficial for the Formula Student competition as the engine will remain within the higher engine speeds whilst competing. Inlet runner lengths were changed using a similar iterative process however it was found that the original lengths of 83.5mm obtained the best outright performance for the setup. Exhaust and inlet diameters were changed to improve flow and reduce the restrictions within the setup. The best response was achieved by increasing the inlet runner diameter to 36mm from 34.75mm, exhaust pipework to 50mm from 42mm post turbocharger and 32mm from 29.25mm pre turbocharger. Examples of these changes can be observed in Appendix Q.
5.3 SIMULATION RESULTS AND COMPARISON
The simulation of the UH20 optimised setup was carried out and results compared to the previously obtained standard UH20 turbocharged results (Figure 5-2), showing a peak improvement of 4.2 horsepower (from 62.93 to 67.13 horsepower) equating to 6.67%.
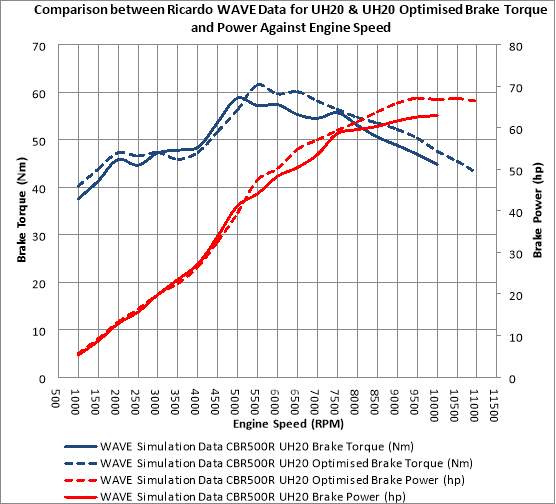
Figure 5‑2 Comparison between UH20 Optimised and Standard Simulation
6 CONCLUDING REMARKS
The aim of the project was to create a reliable and accurate simulation model of a turbocharged Honda CBR500R engine, providing the UH Racing team with a development platform, to validate the use of a turbocharger for the UH20 chassis. To meet this aim, the project work involved following a strict methodology, meeting objectives at each stage to ensure the project was successful. A subject review was undertaken to gain understanding of the principles behind turbocharging four stroke spark ignition engines and the foundations and accuracy of engine simulation software.
Once completed an engine simulation model of UH Racing’s UH19 naturally aspirated Honda CBR500R was developed and compared to empirical data collected from the engine using the University of Hertfordshire’s Dynodynamics rolling road facility. Once it was confirmed that the simulation results correlated to the engines empirical data, it was deemed appropriate to turbocharge the simulation model, using design criteria developed in collaboration with the UH Racing team.
Due to the timeframe and financial restrictions within the Formula Student project a functioning physical turbocharged CBR500R engine was not possible to produce in the project period. Hence to validate the model, careful comparison between the naturally aspirated and turbocharged models whilst considering turbocharger response was undertaken. From this a final optimisation of the system was undertaken considering inlet and exhaust geometries along with cam timing to extract as much torque and power from the unit as possible.
With reference to the aims and objectives of the project, the data collected and stated in this report mean the project can be deemed a success. The production of the UH19 naturally aspirated CBR500R setup was carried out successfully obtaining mean BMEP results within 6.1% of those measured from the dynamometer, hence proving the models validity. Developing on this, successful research and communication with the manufacturers of the intercooler and turbocharger meant accurate data for the components used in the turbocharged setup were implemented into the simulation.
This aided the validation of the turbocharged model, alongside viewing the improvements over the naturally aspirated engine with the turbochargers response. It was deemed that the engine reacted suitably to the turbochargers actions and hence the model was validated. The optimisation process was then carried out on the turbocharged simulation which obtained an increase in peak power to 67.13 horsepower over the 62.93 horsepower obtained with the standard turbocharger model.
6.1 FURTHER REMARKS
As stated within the Chapter 4.8, although a validation has been made against the turbocharged simulation model, an important further development should be made where the physical UH20 engine should be tested and compared against the simulation data. From the physical test data, the validation process can be undertaken similar to the process carried out for the UH19 naturally aspirated model, by comparing BMEP, IMEP and FMEP values.
The completed simulation has been provided to the UH Racing team, meaning if the team continues to use the Honda CBR500R powertrain, the turbocharger development program can be refined further using the data obtained from this project. For example different turbochargers could be implemented; a water to air intercooler instead of an air to air type and alternative geometries with alternative materials could be experimented with, in the search for torque and power gains.
Finally, by introducing further in depth analysis of the WAVEPOST output file from the simulation, data for ignition timing and fuel maps can be determined. These files can then be used to begin the physical mapping of the vehicle’s turbocharged setup.
6.2 PROBLEMS DURING PROJECT
In the initial stages of the project, certain modelling features such as inputting engine valve data and exhaust silencer geometries in particular provided problems within the simulation outputs, where huge anomalies were observed. It took prolonged periods of time to trace and rectify the issues with the input geometry and re-calibrate the model. This meant the initial timing plan needed to be rectified, to allow for more time for simulation modelling for both the turbocharged and naturally aspirated models. The collection of empirical data for the UH19 naturally aspirated CBR500R also provided problems in the project due to the filing structure on the dynamometer computer. The lack of grouped folders on the system meant extended time periods were taken to retrieve data from the dynamometer computer. This was further escalated by having to compare the data to data stored on the vehicles ECU to ensure similar ambient conditions were present, to enable validation of the naturally aspirated model.
6.3 PROJECT WORK REFLECTION
Reflecting on the progress made throughout the project, the goals set and outcomes achieved it can be argued that the project was also a success. The initial timing plan and Gantt chart (Appendix A and B respectively) were modified early in the project period to accommodate for the underestimated process time (mentioned above) using simulation software after one became more familiar with Ricardo WAVE. A revised timing plan and Gantt chart (Appendix C and D) was then produced and one followed these closely to enable swift progress throughout the project. One aim, to provide UH Racing with the simulation data to aid the team for the design review at competition, was therefore achievable by following the timing plan. One made the UH20 turbocharged simulation available to the UH Racing team by uploading the files to the ‘Shared Drive’ before the timing plan deadline of 01/02/17. This meant that the team could use the simulation to validate design choices and adapt certain geometries to promote improved performance for the UH20 vehicle.
REFERENCES
[1] UHRacing, Artist, UH19 – FSG. [Art]. University of Hertfordshire, 2016.
[2] UHRacing, Artist, UH19 – FSG Skid Pad. [Art]. University of Hertfordshire, 2016.
[3] Ricardo Software, “Engine performance,” 2017. [Online]. Available: https://www.software.ricardo.com/Products/WAVE/WAVE-engine-performance. [Accessed 17 February 2017].
[4] C. R. Ferguson and A. T. Kirkpatrick, Internal Combustion Engines, New York: John Wiley & Sons, Inc., 2001, pp. 1,6.
[5] R. Stone, Introduction to Internal Combustion Engines Second Edition, Warrendale: Society of Automotive Engineers, 1993, p. 2.
[6] J. B. Heywood, Internal Combustion Engine Fundamentals, USA: McGraw-Hill, Inc., 1988, pp. 3, 390.
[7] T. Bartlett, Outboard Motors, London: Adlard Coles Nautical, 2011, p. 4.
[8] K. Reif, Fundamentals of Automotive and Engine Technology, Wiesbaden: Springer Fachmedien Wiesbaden, 2016, p. 23.
[9] R. K. Rajput, A Textbook of Internal Combustion Engines, New Dehli: Laxmi Publications, 2005, pp. 70, 71.
[10] R. Stone and J. K. Ball, Automotive Engineering Fundamentals, Warrendale: SAE, 2004, p. 24.
[11] H. Settles, Engine Technology, Delhi: World Technologies, 2012, p. 56.
[12] K. Nice, “”How Turbochargers Work”,” HowStuffWorks.com, 4 December 2000. [Online]. Available: http://auto.howstuffworks.com/turbo2.htm. [Accessed 4 February 2017].
[13] H. Nguyen-Schäfer, Aero and Vibroacoustics of Automotive Turbochargers, Berlin: Springer Berlin Heidelberg, 2013, p. 1.
[14] J. K. Miller, Turbo: Real World High-Performance Turbocharger Systems, Minnesota: CarTech Inc, 2008, pp. 8, 12,.
[15] Honeywell International Inc, “Compression ratio with boost,” Turbo by Garrett, 2016. [Online]. Available: https://turbobygarrett.com/turbobygarrett/compression_ratio_with_boost. [Accessed 28 February 2017].
[16] J. Pope, “Analysis of a Turbocharger System for a Diesel Engine,” Rensselaer Polytechnic Institute, Hartford, 2009.
[17] Y. A. Çenge, J. M. Cimbala and R. H. Turner, Fundamentals of Thermal-fluid Sciences, London: McGraw-Hill, 2012, p. 525.
[18] Y. Nakayama, K. Izawa and R. Boucher, Introduction to Fluid Mechanics, Oxford: Butterworth-Heinemann, 1998, pp. 58, 72.
[19] J. I. Ghojel, “Review of the development and applications of the Wiebe function: A tribute to the contribution of Ivan Wiebe to engine research,” Melbourne, 2010.
[20] J. Worm, J. Nabor, C. Cooney, Y. Yeliana and D. Machalek, “WIEBE FUNCTION PARAMETER DETERMINATION FOR MASS FRACTION BURN CALCULATION IN AN ETHANOL-GASOLINE FUELLED SI ENGINE,” Journal of KONES Powertrain and Transport, vol. 15, no. 3, pp. 567-568, 2008.
[21] E. Pipitone, “A New Simple Friction Model for S. I. Engine,” SAE International, USA, 2009.
[22] K. Chan, A. Ordys, K. Volkov and O. Duran, “Comparison of Engine Simulation Software for Development of Control Systems,” Hindawi Publishing Corporation, London, 2013.
[23] Colorado State University, “Finite Heat Release with Heat Transfer,” Mechanical Engineering Department , [Online]. Available: https://www.engr.colostate.edu/~allan/thermo/page8/page8.html. [Accessed 1 March 2017].
[24] J. A. Caton, An Introduction to Thermodynamic Cycle Simulations for Internal Combustion Engines, Chichester: John Wiley & Sons, Incorporated, 2015, pp. 24, 197.
[25] AVL, “AVL BOOST Virtual Engine Development,” AVL LIST GmbH , Graz, 2017.
[26] A. ALQAHTANI, L. M. Wyszynski and F. Shokrollahi, “Thermodynamic simulation comparison of AVL BOOST and Ricardo WAVE for HCCI and SI engines optimisation,” Birmingham, 2015.
[27] Lotus Engineering Software, “ENGINEERING SOFTWARE,” 2017. [Online]. Available: http://www.lotuscars.com/engineering/engineering-software. [Accessed 12 February 2017].
[28] R. Pearson, M. Bassett, N. Fleming and T. Rodemann, “An Approach to Model-Based Design,” Lotus Engineering Software, Hethel.
[29] Lotus Engineering, GETTING STARTED USING LOTUS ENGINE SIMULATION, Hethel: Lotus Cars Ltd., 2001.
[30] Gamma Technologies, “GT-POWER Engine Simulation Software,” Gamma Technologies, 2015.
[31] S. Trajkovic, P. Tunestål and B. Johansson, “Simulation of a Pneumatic Hybrid Powertrain with VVT in GT-Power and Comparison with Experimental Data,” SAE, USA, 2009.
[32] Ricardo Software, What is WAVE?, Shoreham-by-Sea: Ricardo Software, 2010.
[33] Ricardo Software, WAVE User Manual, Shoreham-by-Sea: Ricardo Software, 2016.
[34] Ricardo Software, “Formula SAE Racing grants,” 2017. [Online]. Available: https://www.software.ricardo.com/Academia/Formula-SAE-Racing-grants. [Accessed 15 January 2017].
[35] R. Cheung, M. Letrich, R. Groselak and M. Brezina, “Exhaust System Structural Vibration & Muffler Shell Noise Prediction due to Gas Pulsations in a 2.0l 4Cyl DI Diesel Engine,” Jaguar Land Rover, Prague, 2015.
[36] Ricardo Software, “Global use of WAVE by Ford,” Detroit, 2005.
[37] R. Gilani, “Engine Simulation Model for a Formula SAE Race Car, Applied Design, Development, Correlation and Optimization,” Luleå University of Technology, Luleå, 2012.
[38] R. Wirtz and D. Mazzoni, “Application of WAVE in Motorcycle Prototyping,” Ricardo Software, Bologna, Italy.
[39] Honda Motor Company, Service Manual CBR500R/RA, CB500F/FA & CB500X/XA, Japan: Honda Motor Company, 2013.
[40] G. P. Blair, Design and Simulation of Four-Stroke Engines, Warrendale: SAE, 1994, pp. 536, 563.
[41] IMechE, Formula Student Rules 2017 Version 1.1, London: IMechE, 2017, p. 100.
BIBLIOGRAPHY
R. Stone, Introduction to Internal Combustion Engines Second Edition, Warrendale: Society of Automotive Engineers, 1993.
K. Reif, Fundamentals of Automotive and Engine Technology, Wiesbaden: Springer Fachmedien Wiesbaden, 2016
T. J. Chung, Computational Fluid Dynamics, Cambridge University Press, 2010
J. B. Heywood, Internal Combustion Engine Fundamentals, USA: McGraw-Hill, Inc. , 1988.
G. P. Blair, Design and Simulation of Four-Stroke Engines, Warrendale: SAE, 1994.
Merker, Günter P., Schwarz, Christian, Teichmann, Rüdiger (Eds.), Combustion Engines Development, Wiesbaden: Springer Fachmedien Wiesbaden, 2012
J. Robinson, Motor-Cycle Tuning (Four-Stroke) Second Edition, Butterworth Heinmann Oxford, 1994
Ricardo Software, WAVE User Manual, Shoreham-by-Sea: Ricardo Software, 2016.
APPENDICES
APPENDIX A – INITIAL GANTT CHART
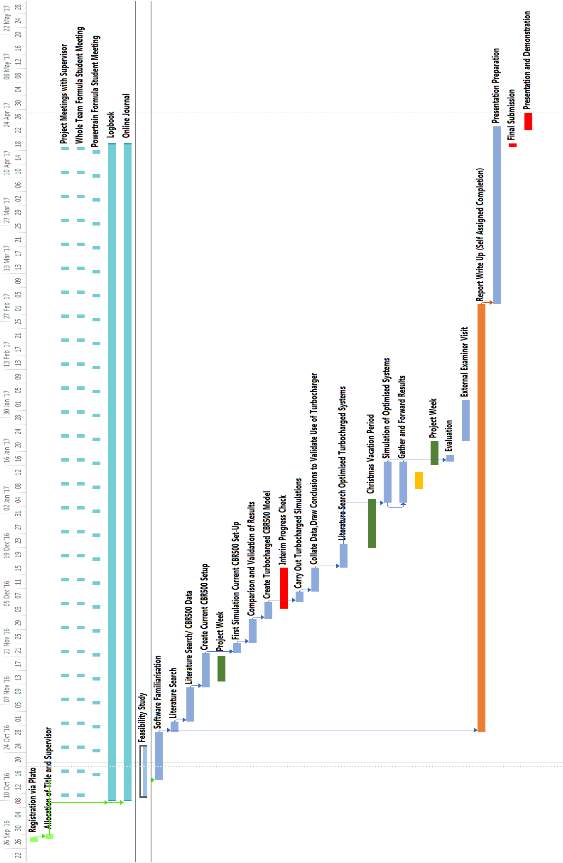
APPENDIX B – INITIAL TIMING PLAN
| Task No. | Task Name | Duration | Start | Finish |
| 1 | Registration via Plato | 1 day | Wed 28/09/16 | Wed 28/09/16 |
| 2 | Allocation of Title and Supervisor | 1 day | Thu 29/09/16 | Thu 29/09/16 |
| 3 | Project Meetings with Supervisor | 190 days | Tue 11/10/16 | Tue 18/04/17 |
| 4 | Whole Team Formula Student Meeting | 190 days | Tue 11/10/16 | Tue 18/04/17 |
| 5 | Powertrain Formula Student Meeting | 183 days | Mon 17/10/16 | Mon 17/04/17 |
| 6 | Logbook | 192 days | Mon 10/10/16 | Wed 19/04/17 |
| 7 | Online Journal | 192 days | Mon 10/10/16 | Wed 19/04/17 |
| 8 | Feasibility Study | 15 days | Tue 11/10/16 | Tue 25/10/16 |
| 9 | Software Familiarisation | 14 days | Sun 16/10/16 | Sat 29/10/16 |
| 10 | Literature Search | 3 days | Sun 30/10/16 | Tue 01/11/16 |
| 11 | Literature Search/ CBR500 Data | 10 days | Wed 02/11/16 | Fri 11/11/16 |
| 12 | Create Current CBR500 Setup | 10 days | Sat 12/11/16 | Mon 21/11/16 |
| 13 | Project Week | 7 days | Mon 14/11/16 | Sun 20/11/16 |
| 14 | First Simulation Current CBR500 Set-Up | 3 days | Tue 22/11/16 | Thu 24/11/16 |
| 15 | Comparison and Validation of Results | 7 days | Fri 25/11/16 | Thu 01/12/16 |
| 16 | Create Turbocharged CBR500 Model | 5 days | Fri 02/12/16 | Tue 06/12/16 |
| 17 | Interim Progress Check | 12 days | Mon 05/12/16 | Fri 16/12/16 |
| 18 | Carry Out Turbocharged Simulations | 3 days | Wed 07/12/16 | Fri 09/12/16 |
| 19 | Collate Data, Draw Conclusions to Validate Use of Turbocharger | 7 days | Sat 10/12/16 | Fri 16/12/16 |
| 20 | Literature Search Optimised Turbocharged Systems | 7 days | Sat 17/12/16 | Fri 23/12/16 |
| 21 | Christmas Vacation Period | 14 days | Fri 23/12/16 | Thu 05/01/17 |
| 22 | Simulation of Optimised Systems | 12 days | Thu 05/01/17 | Mon 16/01/17 |
| 23 | Gather and Forward Results | 12 days | Thu 05/01/17 | Mon 16/01/17 |
| 24 | Exam Week | 5 days | Mon 09/01/17 | Fri 13/01/17 |
| 25 | Project Week | 7 days | Mon 16/01/17 | Sun 22/01/17 |
| 26 | Evaluation | 2 days | Tue 17/01/17 | Wed 18/01/17 |
| 27 | External Examiner Visit | 12 days | Mon 23/01/17 | Fri 03/02/17 |
| 28 | Report Write Up (Self Assigned Completion) | 125 days | Sun 30/10/16 | Fri 03/03/17 |
| 29 | Presentation Preparation | 52 days | Sat 04/03/17 | Mon 24/04/17 |
| 30 | Final Submission | 1 day | Wed 19/04/17 | Wed 19/04/17 |
| 31 | Presentation and Demonstration | 5 days | Mon 24/04/17 | Fri 28/04/17 |
APPENDIX C – REVISED GANTT CHART
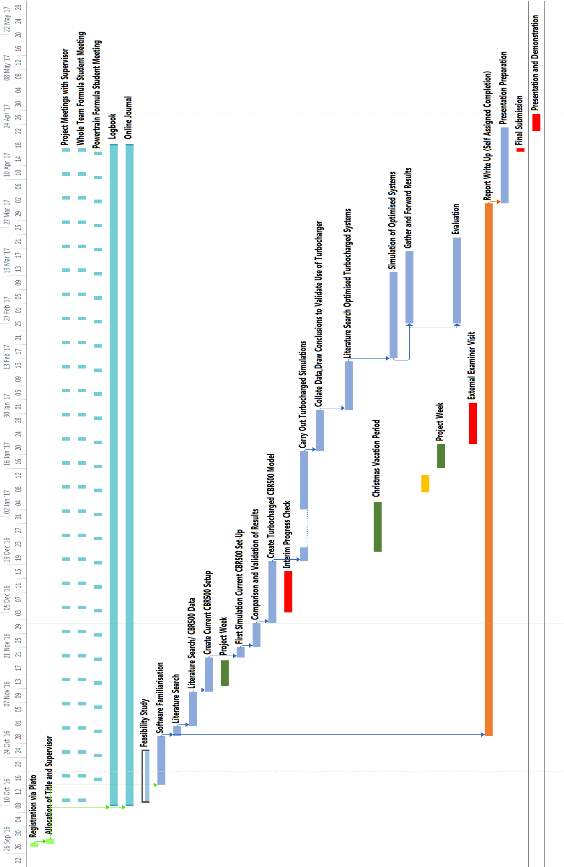
APPENDIX D – REVISED TIMING PLAN
| Task No. | Task Name | Duration | Start | Finish |
| 1 | Registration via Plato | 1 day | Wed 28/09/16 | Wed 28/09/16 |
| 2 | Allocation of Title and Supervisor | 1 day | Thu 29/09/16 | Thu 29/09/16 |
| 3 | Project Meetings with Supervisor | 190 days | Tue 11/10/16 | Tue 18/04/17 |
| 4 | Whole Team Formula Student Meeting | 190 days | Tue 11/10/16 | Tue 18/04/17 |
| 5 | Powertrain Formula Student Meeting | 183 days | Mon 17/10/16 | Mon 17/04/17 |
| 6 | Logbook | 192 days | Mon 10/10/16 | Wed 19/04/17 |
| 7 | Online Journal | 192 days | Mon 10/10/16 | Wed 19/04/17 |
| 8 | Feasibility Study | 15 days | Tue 11/10/16 | Tue 25/10/16 |
| 9 | Software Familiarisation | 14 days | Sun 16/10/16 | Sat 29/10/16 |
| 10 | Literature Search | 3 days | Sun 30/10/16 | Tue 01/11/16 |
| 11 | Literature Search/ CBR500 Data | 10 days | Wed 02/11/16 | Fri 11/11/16 |
| 12 | Create Current CBR500 Setup | 10 days | Sat 12/11/16 | Mon 21/11/16 |
| 13 | Project Week | 7 days | Mon 14/11/16 | Sun 20/11/16 |
| 14 | First Simulation Current CBR500 Set-Up | 3 days | Tue 22/11/16 | Thu 24/11/16 |
| 15 | Comparison and Validation of Results | 7 days | Fri 25/11/16 | Thu 01/12/16 |
| 16 | Create Turbocharged CBR500 Model | 18 days | Fri 02/12/16 | Mon 19/12/16 |
| 17 | Interim Progress Check | 12 days | Mon 05/12/16 | Fri 16/12/16 |
| 18 | Carry Out Turbocharged Simulations | 21 days | Tue 20/12/16 | Fri 20/01/17 |
| 19 | Collate Data, Draw Conclusions to Validate Use of Turbocharger | 12 days | Sat 21/01/17 | Wed 01/02/17 |
| 20 | Literature Search Optimised Turbocharged Systems | 14 days | Thu 02/02/17 | Wed 15/02/17 |
| 21 | Christmas Vacation Period | 14 days | Fri 23/12/16 | Thu 05/01/17 |
| 22 | Simulation of Optimised Systems | 25 days | Fri 17/02/17 | Mon 13/03/17 |
| 23 | Gather and Forward Results | 21 days | Mon 27/02/17 | Sun 19/03/17 |
| 24 | Exam Week | 5 days | Mon 09/01/17 | Fri 13/01/17 |
| 25 | Project Week | 7 days | Mon 16/01/17 | Sun 22/01/17 |
| 26 | Evaluation | 25 days | Mon 27/02/17 | Thu 23/03/17 |
| 27 | External Examiner Visit | 12 days | Mon 23/01/17 | Fri 03/02/17 |
| 28 | Report Write Up (Self Assigned Completion) | 155 days | Sun 30/10/16 | Sun 02/04/17 |
| 29 | Presentation Preparation | 22 days | Mon 03/04/17 | Mon 24/04/17 |
| 30 | Final Submission | 1 day | Tue 18/04/17 | Tue 18/04/17 |
| 31 | Presentation and Demonstration | 5 days | Mon 24/04/17 | Fri 28/04/17 |
APPENDIX E – SELECTION OF SUPERVISOR MEETING MINUTES
APPENDIX F – HONDA CBR500R ENGINE DATA
Honda CBR500R Engine Specifications [39]:
Engine Cycle: Four Stroke Engine Cycle
Number of Cylinders: 2
Injection Type: Port Injection
Cylinder Orientation: Twin Cylinder 180 Degrees Offset
Cylinder Arrangement: 20 Degrees from Vertical
Bore and Stroke: 67 x 66.8 mm
Displacement 471cm3
Compression Ratio: 10.7:1
Firing order: 1 – 2
Wrist Pin Offset: 0mm
Valvetrain: Chain Driven Double Over-Head Camshafts Chain Driven.
Inlet Valve Diameter: 26mm
Exhaust Valve Diameter: 21.5mm
No. Inlet Valves per Cylinder: 2 Valves per Cylinder
No. Exhaust Valves per Cyclinder: 2 Valves per Cylinder
Fuel Type: 98 RON Unleaded Gasoline
Lubrication Type: Forced Pressure and Wet Sump (Student Modified)
Oil Pump Type: Trochoid
Air Filtration System: Viscous Paper/Foam Element
Engine Dry Weight: 52.7 kg
Connecting Rod Length: 95mm
Connecting Rod Type: I Beam Type
Engine Control Unit (ECU):
UH Racing moved away from the standard Honda PGM-FI unit to a custom programmable LifeRacing Unit allowing for student derived fuel and ignition mapping as well as live telemetry and engine parameter data to be observed via a WIFI connection.
Type: LifeRacing Series F88
Important Features:
2x Acoustic Knock Sensor Inputs
2x Wideband Lambda Sensor Input
2x K Thermocouple Sensor Input
24x User Configurable Analogue Sensor Inputs for Hall Effect, Bipolar and Inductive for Options Such as Coolant Temperature, Oil Temperature, Crankshaft Position and Oil Pressure.
APPENDIX G – ENGINE VALVE DATA SIMULATION INPUT
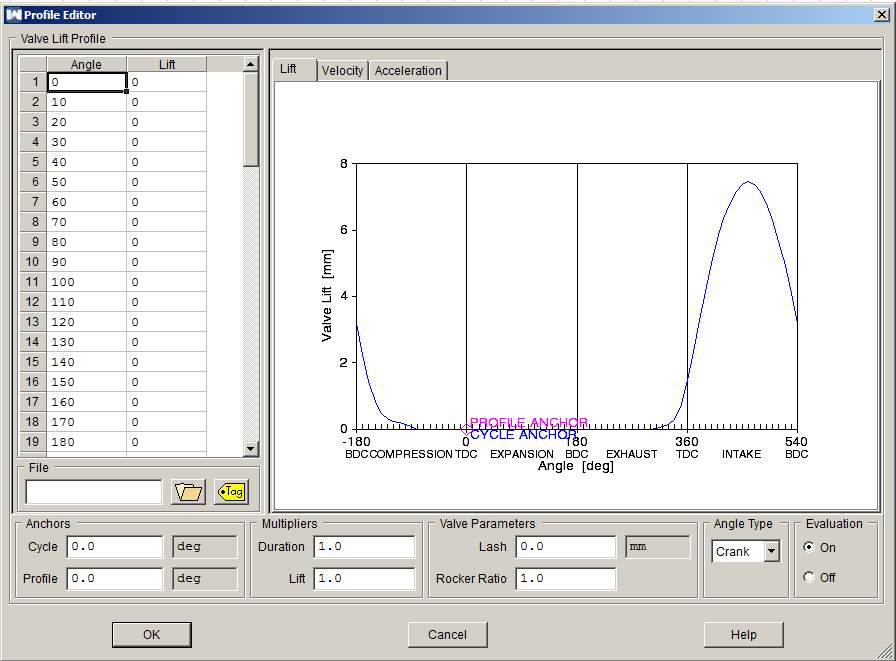
Inlet Valve Lift and Timing Data Input into the WAVE Canvas
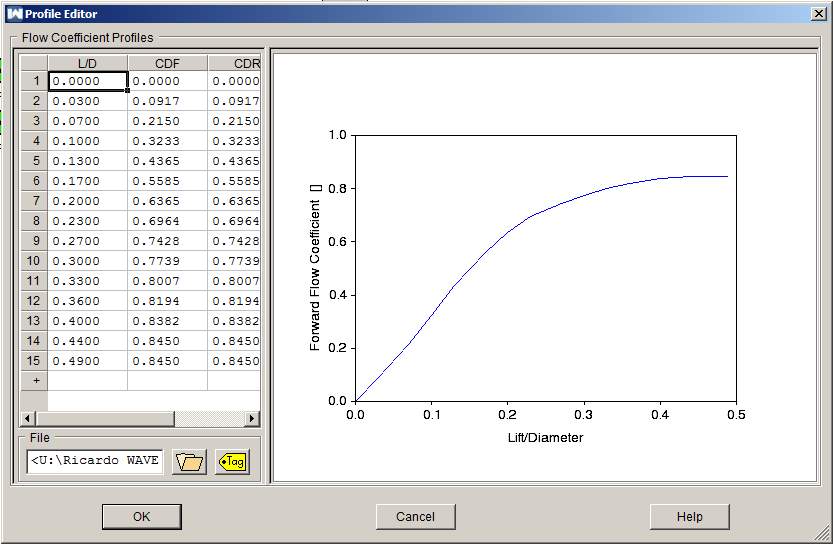
Inlet Valve Flow Coefficient against Lift/Diameter Ratio Input into the WAVE Canvas
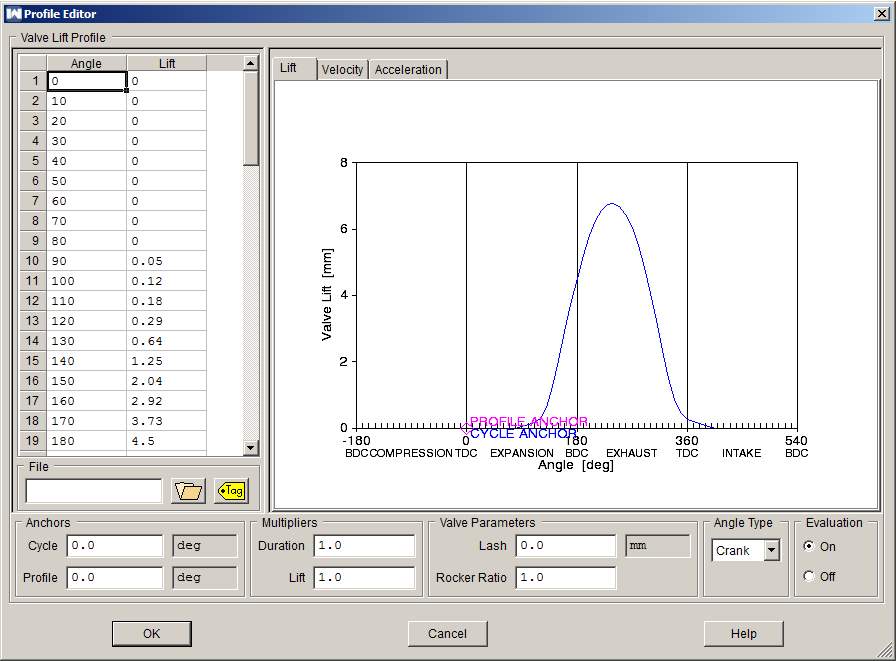
Exhaust Valve Lift and Timing Data Input into the WAVE Canvas
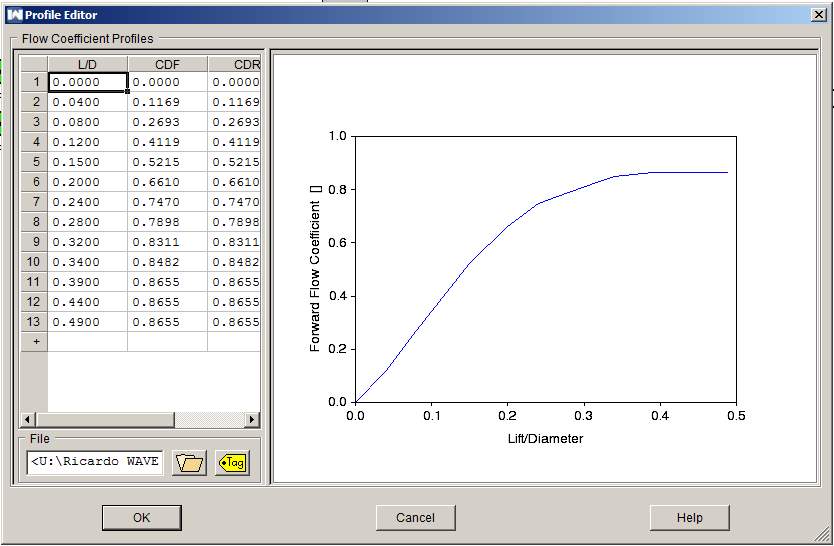
Exhaust Valve Flow Coefficient against Lift/Diameter Ratio Input into the WAVE Canvas
APPENDIX H – UH19 SIMULATION CONSTANTS
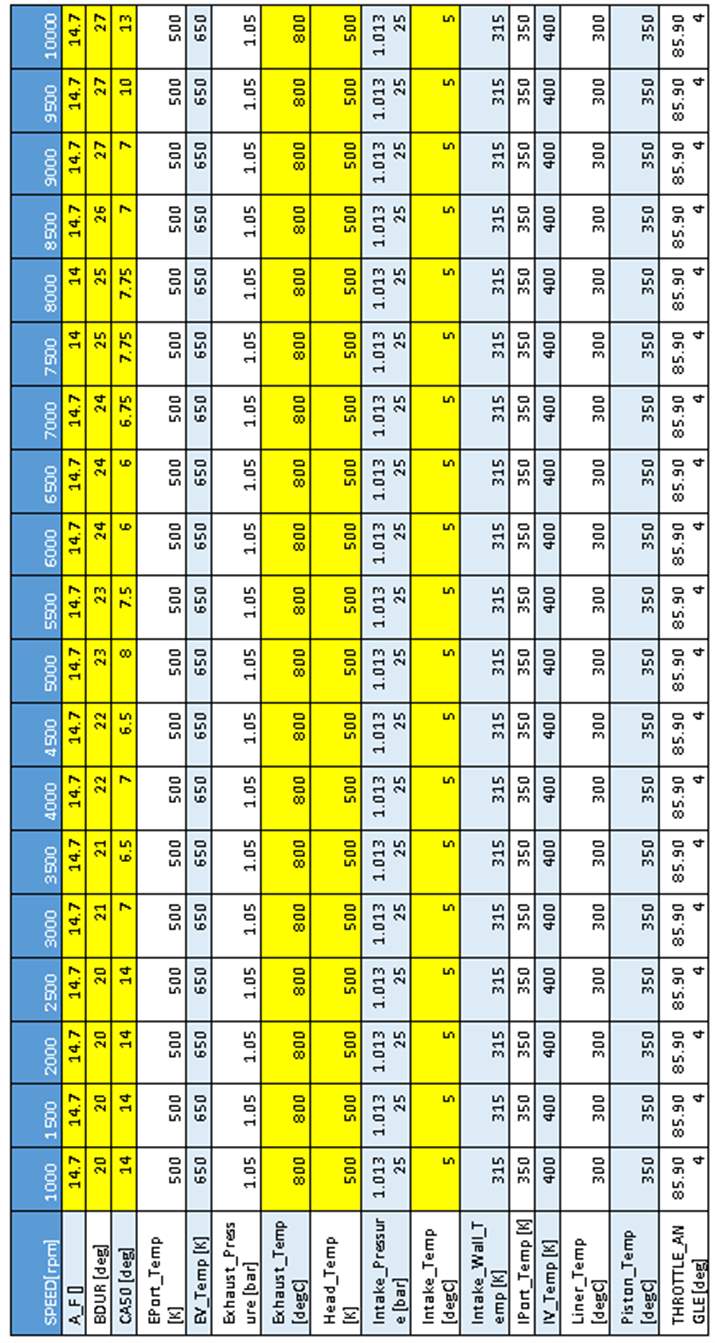
APPENDIX I – UH19 CBR500R SIMULATION CANVAS
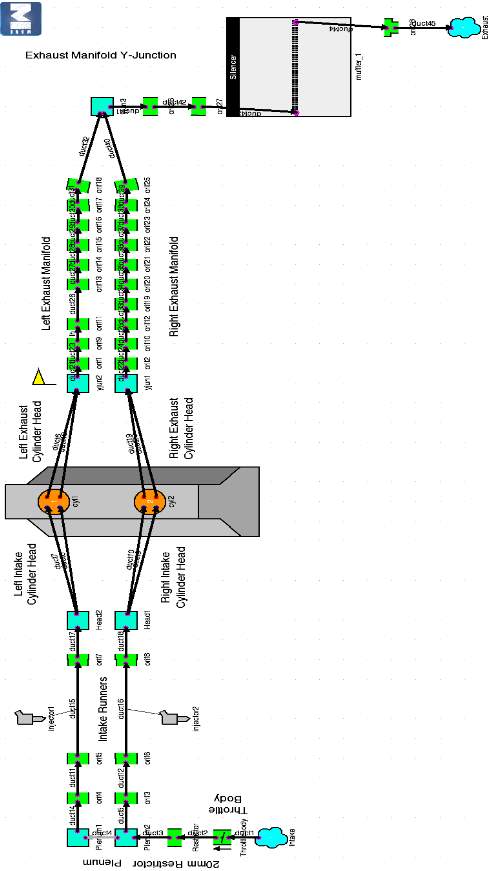
APPENDIX J – UH19 SIMULATION OUTPUT DATA
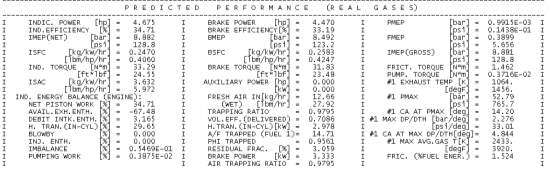
UH19 N/A CBR500R Simulation Predicted Performance at 1000 rpm
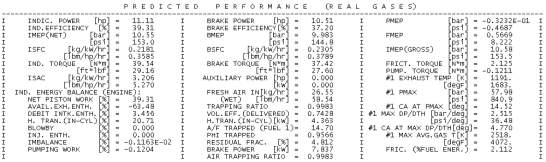
UH19 N/A CBR500R Simulation Predicted Performance at 2000 rpm

UH19 N/A CBR500R Simulation Predicted Performance at 3000 rpm
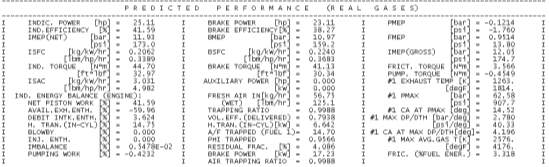
UH19 N/A CBR500R Simulation Predicted Performance at 4000 rpm
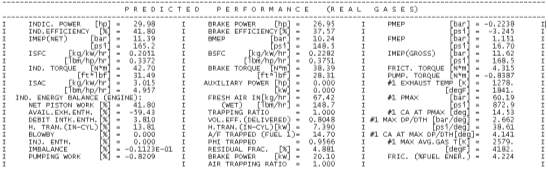
UH19 N/A CBR500R Simulation Predicted Performance at 5000 rpm
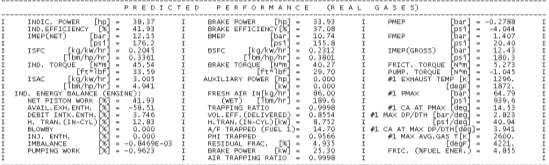
UH19 N/A CBR500R Simulation Predicted Performance at 6000 rpm
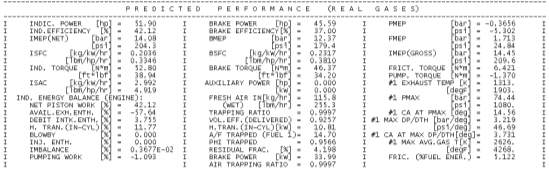
UH19 N/A CBR500R Simulation Predicted Performance at 7000 rpm

UH19 N/A CBR500R Simulation Predicted Performance at 8000 rpm
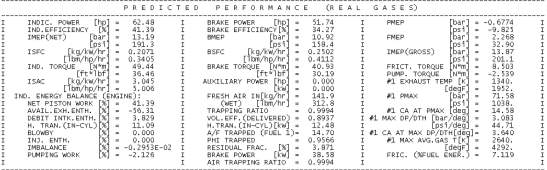
UH19 N/A CBR500R Simulation Predicted Performance at 9000 rpm
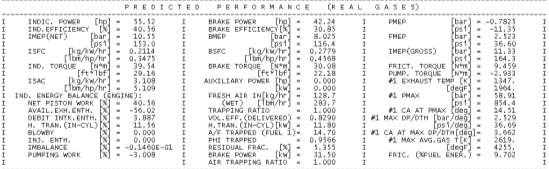
UH19 N/A CBR500R Simulation Predicted Performance at 10,000 rpm
APPENDIX K – SIMULATION MICROPHONE POSITION
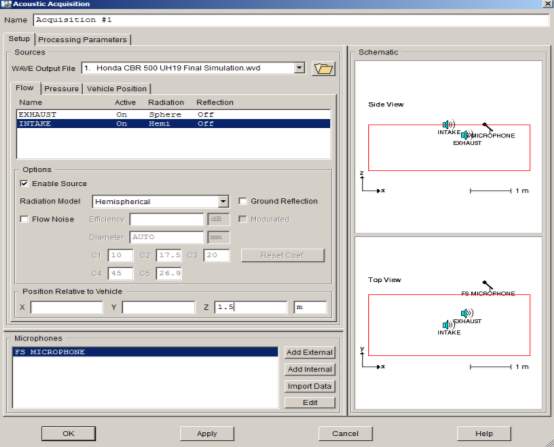
Simulation Microphone Schematic Showing Position Compliance with Formula Student Ruling: IN10.2.4
APPENDIX L – UH19 HONDA CBR500R DYNAMOMETER ENGINE TESTING
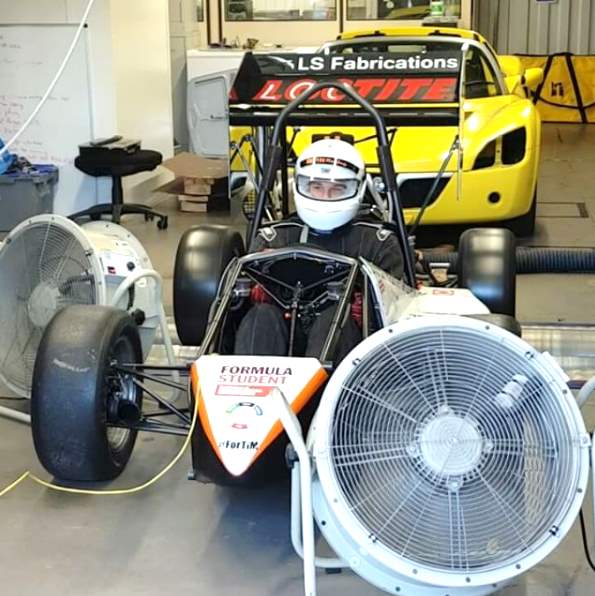
Tristan Tissiman (Team Leader 2016-2017) Testing the Physical UH19 N/A Honda CBR500R Engine on the University of Hertfordshire’s DynoDynamics Rolling Road Facility
APPENDIX M – UH20 GT06 TURBO DATA
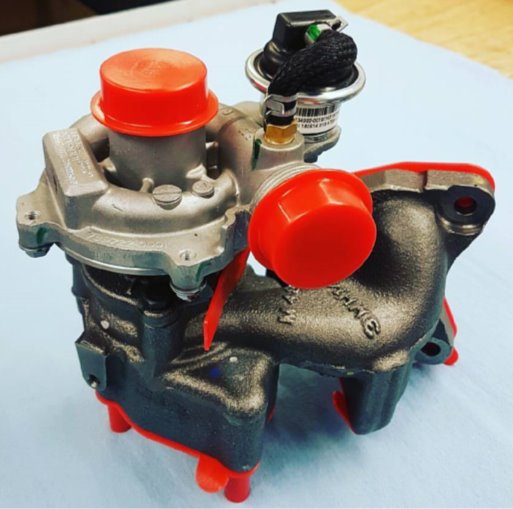
Garrett by Honeywell GT06 Turbocharger (Pictured with Red Protective Caps)
| Turbocharger Specifications: GT06 Garrett by Honeywell | ||
| Compressor Details: | Inducer | 22.63mm |
| Exducer | 32mm | |
| Trim | 50 | |
| A/R | 0.32 | |
| Turbine Details: | Wheel | 30mm |
| Trim | 72 | |
| A/R | 0.18 | |
| Bearing Type: | Journal Type Bearing | |
| Bearing and Shaft Inertia: | 2.39e-06 kgm2 | |
| Control Type: | Internal Wastegated | |
| Cooling Type: | Oil Cooled | |
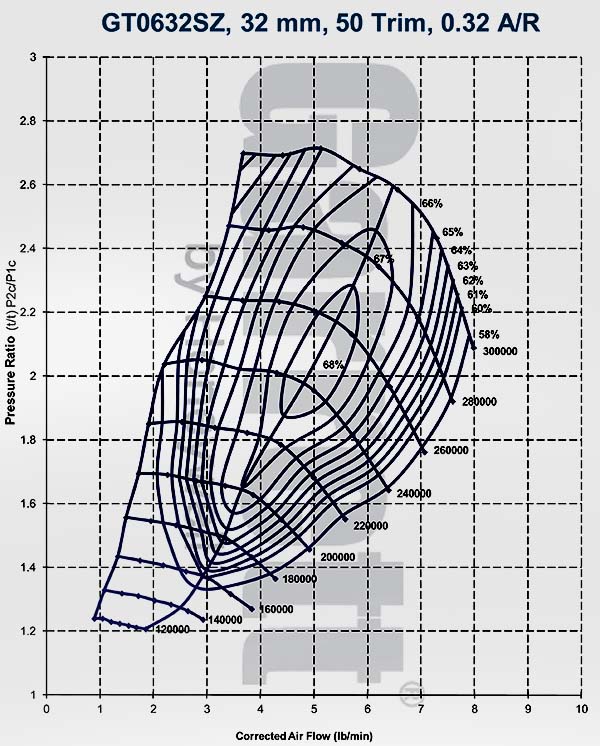
Publishable GT06 Compressor Map Data for Reference
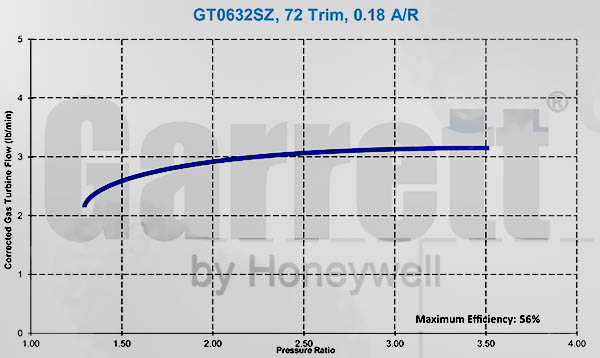
Publishable GT06 Turbine Map Data for Reference
APPENDIX N – UH20 CBR500R SIMULATION CANVAS
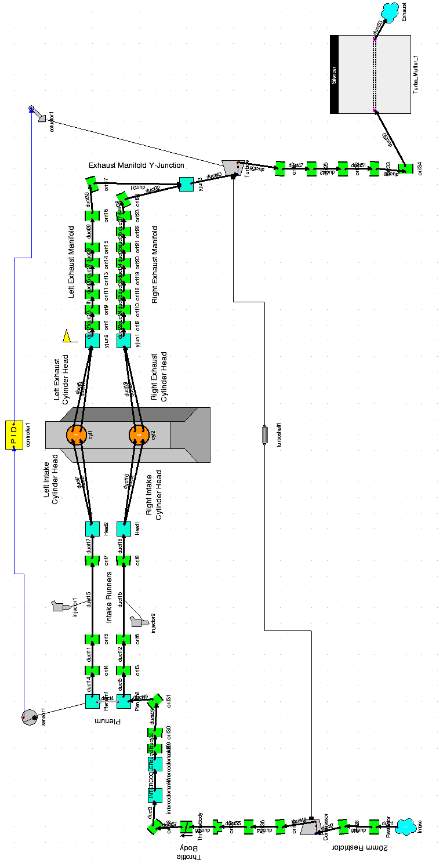
APPENDIX O – UH20 SIMULATION CONSTANTS
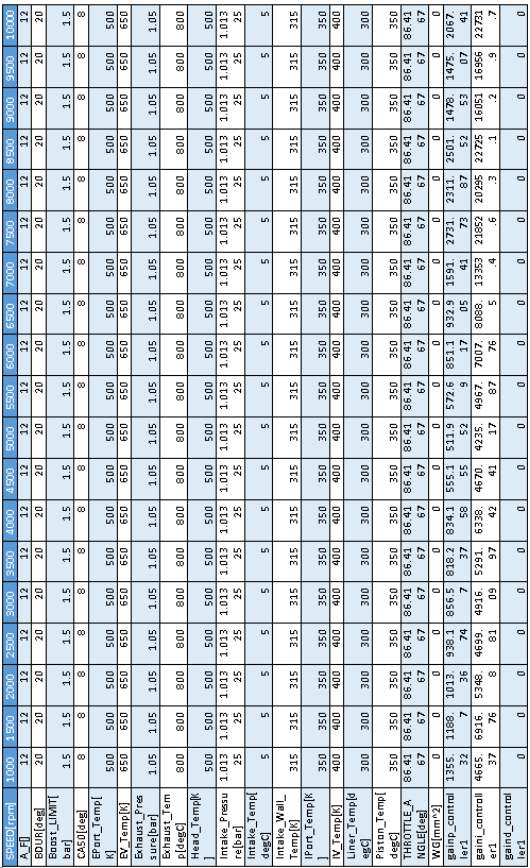
APPENDIX P – UH20 SIMULATION OUTPUT FILE
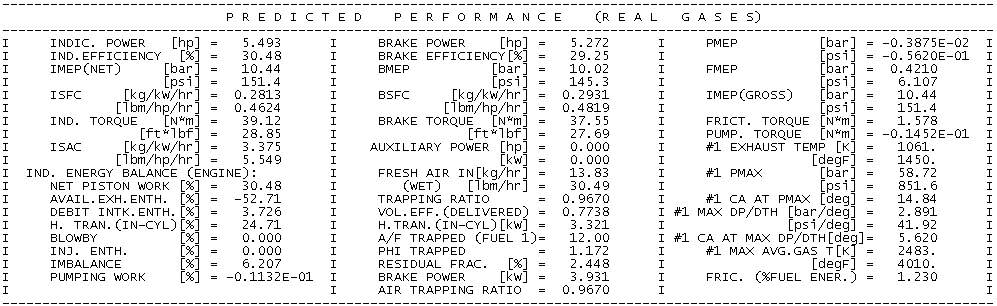
UH20 Turbocharged CBR500R Simulation Predicted Performance at 1000 rpm
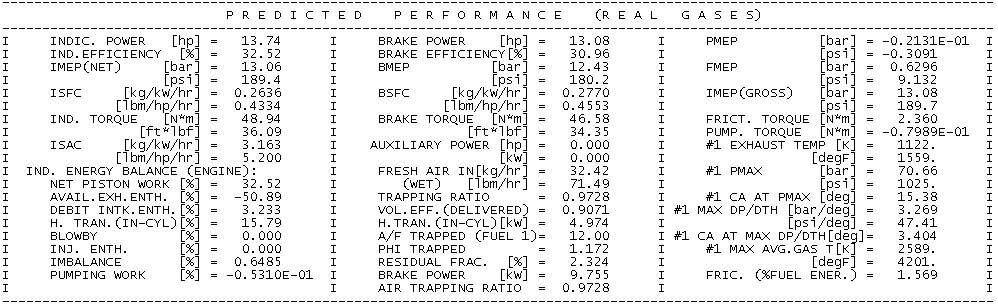
UH20 Turbocharged CBR500R Simulation Predicted Performance at 2000 rpm
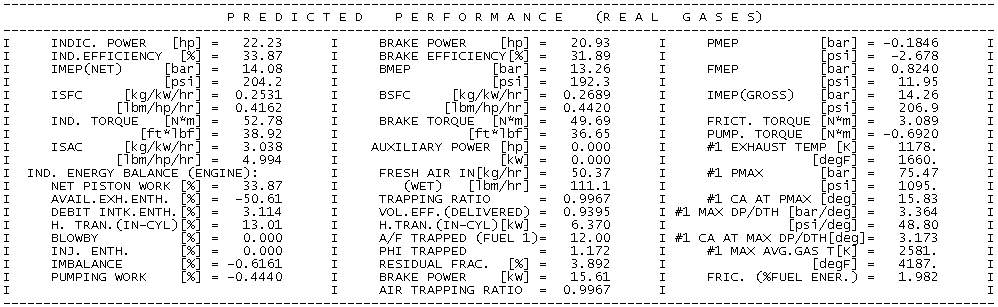
UH20 Turbocharged CBR500R Simulation Predicted Performance at 3000 rpm
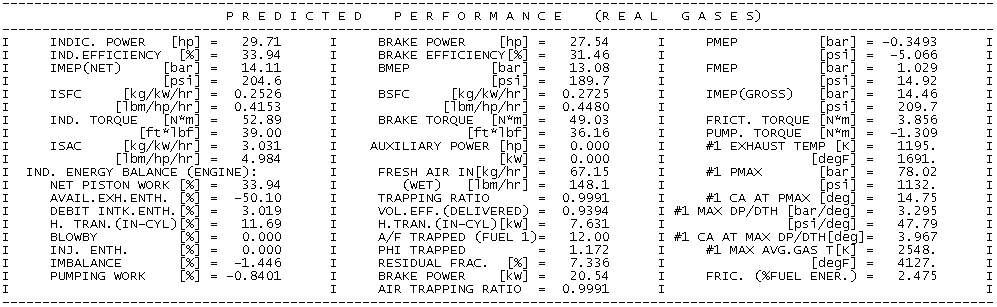
UH20 Turbocharged CBR500R Simulation Predicted Performance at 4000 rpm
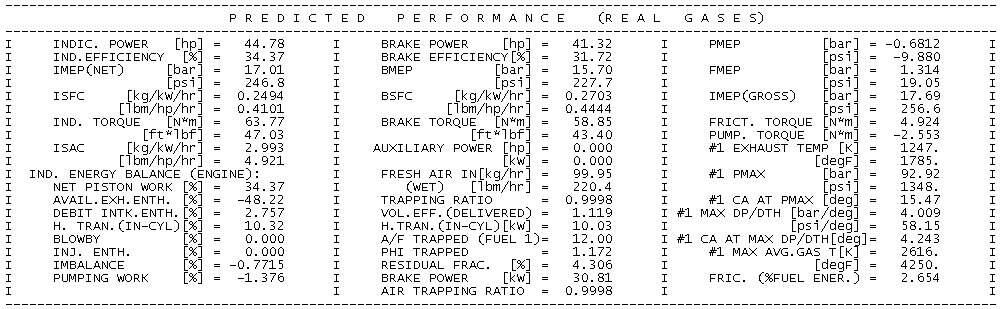
UH20 Turbocharged CBR500R Simulation Predicted Performance at 5000 rpm

UH20 Turbocharged CBR500R Simulation Predicted Performance at 6000 rpm
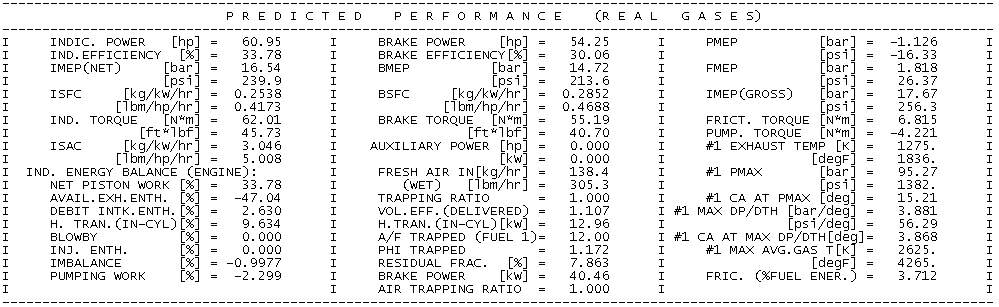
UH20 Turbocharged CBR500R Simulation Predicted Performance at 7000 rpm
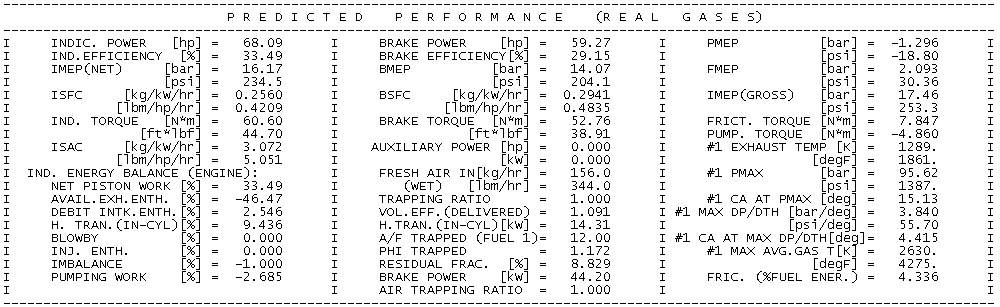
UH20 Turbocharged CBR500R Simulation Predicted Performance at 8000 rpm
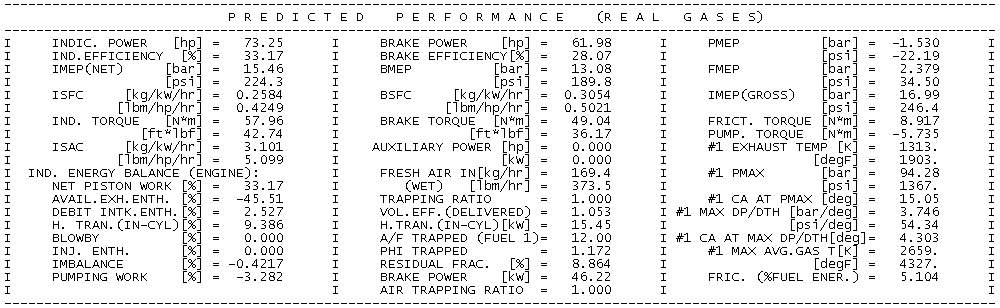
UH20 Turbocharged CBR500R Simulation Predicted Performance at 9000 rpm
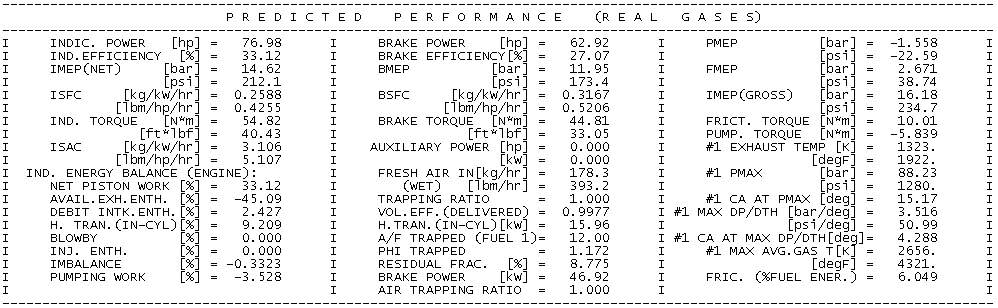
UH20 Turbocharged CBR500R Simulation Predicted Performance at 10,000 rpm
APPENDIX Q – UH20 OPTIMISED SIMULATION MODIFICATIONS
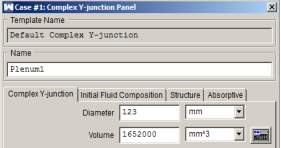 |
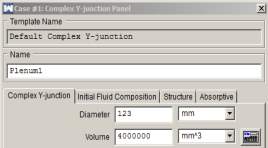 |
| Plenum Volume Change During for Optimisation | |
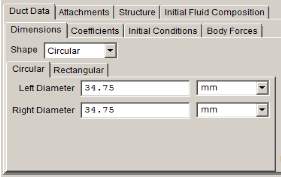 |
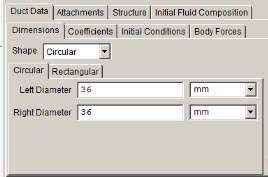 |
| ‘Duct 15’ Inlet Runner Diameter Change for Optimisation | |
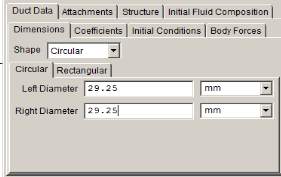 |
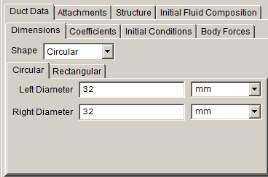 |
| ‘Duct 27’ Exhaust Pipe Diameter Change Pre-Turbocharger for Optimisation | |
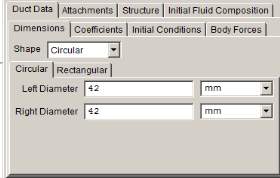 |
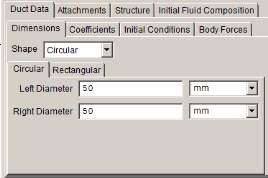 |
| ‘Duct 42’ Exhaust Pipe Diameter Change Post-Turbocharger for Optimisation | |
Cite This Work
To export a reference to this article please select a referencing stye below:
Related Services
View all


Related Content
All TagsContent relating to: "Automotive"
The Automotive industry concerns itself with the design, production, and selling of motor vehicles, such as cars, vans, and motorcycles, and is home to many multi-billion pound companies.
Related Articles

DMCA / Removal Request
If you are the original writer of this dissertation and no longer wish to have your work published on the UKDiss.com website then please: