Exploring Undergraduate Attitudes towards Alcohol
Info: 10272 words (41 pages) Dissertation
Published: 25th Feb 2022
Tagged: PsychologyStudents
Abstract
In view of the well documented adverse effects of alcohol on health, a study was conducted to examine the attitudes of undergraduate students at a university in the South West of England towards alcohol and its consumption. The initial stage of the study used five semi-structured focus groups to obtain qualitative data about the views of drinkers (three focus groups, 20 participants) and non-drinkers (two focus groups, 10 participants) towards alcohol. Recorded transcripts of the focus groups were analysed by Inductive Thematic Analysis (ITA) to identify common themes, and the subsequent development of an online questionnaire. The ITA identified three key themes: factors behind the decision to drink or not to drink; influences on drinking patterns; and the knowledge of the safe use of alcohol. Analysis of qualitative data from the focus groups indicated that most undergraduates have a worrying attitude towards the consumption of alcohol, with many ignorant about the safe use of alcohol.
The questionnaire comprising 37 questions divided into 7 different sections, was completed by 319 respondents. The majority of respondents (87%; n=276), were self-identified as alcohol drinkers. A high proportion of respondents (61%; n=169) admitting to binge drinking at least once in the previous week; with 61% (n=180) of respondents declaring that consumption of alcohol had resulted in their missing a lecture. An association was found (correlation coefficient, R=0.532) between an increase in the frequency of binge drinking and an increase in the probability of missed lectures, indicating that alcoholic excess is likely to have an adverse effect on students’ academic performance. Around one third of questionnaire respondents (32%; n=89) correctly identified the current suggested limits of alcohol consumption for men and women, indicating a lack of education in this area. Most students considered that the University could be doing more to address the issue of alcohol misuse.
1. Introduction
Use of alcohol is the eighth leading risk factor for global deaths (1), and in 2012, approximately 3.3 million deaths or 5.9% of all global deaths were attributable to the consumption of alcohol.(2) Worldwide consumption in 2010 was equal to an average of 6.2 litres of pure alcohol per person, however in the United Kingdom (UK) consumption per person was nearly double that at 11.6 litres of pure alcohol per person, the equivalent of 29 1 litre bottles of 40% vodka per person.(2,3) A more recent survey by the UK Office of National Statistics estimated consumption of alcohol in the UK to be 9.8 litres per capita (persons aged 15 years +) in 2014. (4)Even with this adjustment, UK consumption per capita is still far higher than the rest of the world and consumption of alcohol remains a major social and public health issue.
Alcohol consumption is a causal factor in more than 60 medical conditions with the volume of consumption and patterns of drinking, such as irregular heavy drinking, being shown to determine disease burden. (5,6) Alcohol misuse is defined by the National Health Service (NHS) as the “excessive consumption of alcohol – more than the lower-risk limits of alcohol consumption”.(7) The recommended lower risk limits state that neither men nor women should be drinking any more than 14 units of alcohol regularly each week. In addition, this consumption should be spread out over several days, ensuring a number of alcohol free days are included each week (NHS, 2015). Binge drinking is an alcohol abuse pattern characterised by heavy drinking periods followed by episodes of abstinence and is commonly defined as consuming more than eight units of alcohol in a single session for men and more than six units for women. (8,9)
Binge drinking is a prevalent problem in the UK with 28% of the UK’s population aged greater than 15 years, consuming more than 60 grams (7.5 Units) of pure alcohol in one sitting, on at least one occasion within a 30 day period.(3)The cost of binge drinking was estimated at £4.86 billion in 2014, which included A&E (Accident and Emergency department) visits, road accidents, arrests and the cost of extra number of police officers on duty.(10) Furthermore, a recent report by Public Health England estimated the total annual cost to society of alcohol-related harm to be £21bn with approximately 1 million admissions per annum to A&E due to alcohol related-conditions. This amount also includes the impact of alcohol in productivity and crime. The NHS incurs approximately £3.5bn in costs due to alcohol consumption.(11)
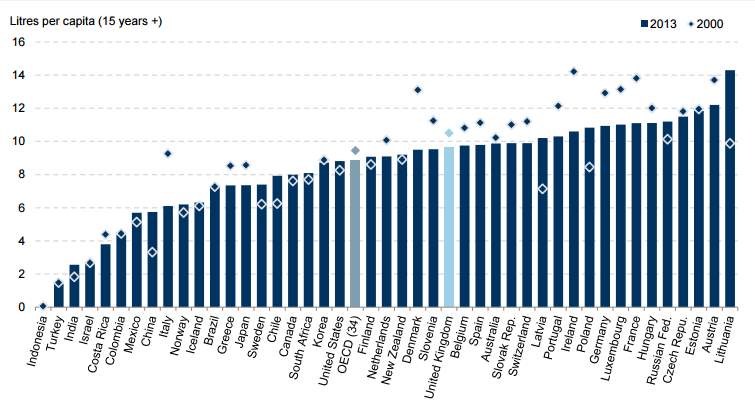
Fig.1 – Drinking Prevalence in adults OECD (Organisation for Economic Co-operation and Development) health statistics 2015. (12)
Figure 1 shows that the UK alcohol consumption is higher than the average for all OECD countries, although a decrease has been observed between 2000 and 2013. Despite this, UK consumption remains higher than the OECD average which suggeststhat the social and health consequences attributed to alcohol may be more prevalent in the UK than many other countries. The problems of binge drinking are clearly recognised by the UK government who state that over half of all alcohol consumed in the UK is consumed whilst binge drinking.(13) In response to this a strategy was set out by the Home Office in 2012 detailing measures such as minimum alcohol pricing and restricted licensing times to help combat binge drinking. These measures, and in particular minimum unit pricing were echoed in the National Institute for Health and Care excellence’s (NICE) recommendations for prevention of alcohol-use disorders.(14)
The UK has historically had a high rate of underage drinking (from the age of 7-18 years) and even with the recent decrease in alcohol consumption by this group, underage drinking remains common.(15) This decrease is the result of government initiatives. This has been achieved through working with local authorities and promoting responsible drinking with some help of the alcohol industry and by supporting individuals to make healthier choices about alcohol. A recent report commissioned by the NHS, demonstrated that around 38% of 11- to 15 year olds have tried alcohol.(15) These statistics are concerning as some studies have linked early-age alcohol use and long-term alcohol use disorders such as alcohol dependence. In support of this one study (16) found that drinking before the age of 15 increased the chances of developing alcohol dependence by four fold.
Alcohol consumption represents an integral part of university culture within the UK, with students who progress to higher education showing an increased consumption relative to their peers in the general population. (17)Cumulative research shows that on average, between 45% and 69% of UK University students admit to engaging in at least one binge drinking session per week. These findings demonstrate that the percentage of alcohol consumption among students is much higher than the national average of 28%, showing that the UK student population is responsible for disproportionate levels of binge drinking.(18) It is apparent that students are at risk of harmful patterns of alcohol consumption, and ‘binge drinking’ or ‘drinking to get drunk’ are common in UK universities. Evidence for this can be found in a report (19) which utilised the AUDIT (Alcohol Use Disorders Identification Test) tool. The study was carried out on a sample group of 770 undergraduate students (65% male, 58% female) from seven universities across England. Among these, 61% scored positive for AUDIT, comprising 40% ‘hazardous drinkers’, 11% ‘harmful’ drinkers and 10% as ‘probably alcohol dependent’. Education has been found to be ineffective in the prevention of alcohol-related harm in students, however, measures like price control and restrictions on alcohol availability and marketing have been shown to be effective.(20)
A study at one Welsh university in 2006 (21) examined the consequences of heavy drinking in students. Results found that students who consumed excessive levels of alcohol were more likely to experience behavioural consequences (fights, blackouts, injury and unplanned sexual activity) and also psychological consequences (irritability, depression, nervousness). Among the 261 students (47% male, 53% female), questioned 37% of females and 32% males admitted that drinking excessively lead to behaviours they subsequently regretted. These findings indicated that students who binge drink are at risk of negative consequences that may detrimentally affect their academic achievement, personal health and have a higher risk of long-term problems such as alcoholism. As the student population continues to increase in size, alcohol related issues are also likely to increase, unless positive action is taken to address harmful drinking patterns.(22) This highlights the importance of universities’ role in addressing potential harmful drinking patterns to safeguard vulnerable student populations.
Whilst there is a large amount of research regarding students’ attitudes towards alcohol consumption, a large proportion of these studies are based in the United States (US).(23-25) It is however important to note cultural differences between UK and US student populations, notably the difference in the legal drinking age, which is 18 and 21 years respectively. For this reason, alcohol may be less of an integral part of university life in the US compared to the UK and any conclusions drawn from these data may not be applicable to UK undergraduates. Furthermore, there is a lack of UK or European studies and therefore a clear need for this to be addressed. (26,27) There is also a lack of studies looking specifically at the impact high drinking levels can have on the health and wellbeing of undergraduate students, illustrating a current gap in the literature.(28)
This study carried out at an English university looked to explore the attitudes of both drinking and non-drinking undergraduates towards alcohol. Consequently the study aimed to achieve the following objectives:
- To determine patterns of alcohol consumption in relation to the demographics of the undergraduate student population.
- To distinguish undergraduate student attitudes towards alcohol and its role in university life,
- To establish current awareness of the dangers of alcohol.
- To investigate student opinions on targeted alcohol awareness and intervention programmes that the university have, or should have in place.
2. Methods
Mixed methods were used to explore the perspectives and behaviours of undergraduate students at a university in South West England. Qualitative data were gathered and used to identify potential themes related to student alcohol consumption, which were then used to aid design of an electronic questionnaire.
2.1 Ethical issues
Ethical approval for the study was gained via the Department of Pharmacy and Pharmacology Research Ethical Review process and approved on the 2nd October 2016. Consent was acquired from each participant at every stage of the study and was obtained through both written and verbal means at each stage of the study. Use of Expression of Interest forms (EOI) (S1) containing information about the study was provided to students who expressed an interest to take part and consent was gained via this form to contact them for participation in future focus groups. Focus group participants were given a full briefing and a participant information sheet (PI) (S2) to read and acknowledge before consent was granted via a consent form(S3). Verbal consent was also taken before any recording devices were switched on and participants were reminded that at any stage of the focus group they could leave without reason, with no obligation to stay. To ensure confidentiality all identifiers were removed from the transcripts and all electronic data was stored in secured locked folders on personal computers only accessible to the research team. All physical data was stored in a locked drawer in the research team’s accommodation.
2.2 phase 1- focus groups
Qualitative data was obtained using four semi-structured focus groups with three focus groups being run for drinkers in 1st, 2nd and final years of study and a fourth focus group being run exclusively for non-drinkers. Abstinence was defined as choosing not to consume any alcoholic drinks for at least the previous six months. The target participation for each focus group was 6-10 participants, however, due to poor participation in the first non-drinkers’ focus group (see table 2 in section 3.1) the non-drinkers focus group was repeated with five focus groups in total. The use of a focus group in exploratory interviewing can provide an open, supportive environment in which sensitive subjects, such as alcohol consumption, can be discussed. The interaction between individuals and detailed participant accounts can lead to novel knowledge or areas of interest to be discovered that may elude researchers if other qualitative gathering methods are used. (27)
University students were recruited on a voluntary basis using varying recruitment techniques, including a poster campaign (S4) posted across the campus with contact details for further information. A PI sheet and EOI form was sent to interested students. Social media posts on the university’s pages were also used and departmental heads were asked to circulate an email detailing information about the study and contact details for possible participation. Recruitment was guided by the need to obtain participants across different years of study and whether participants were drinkers or abstinent. To encourage participation each participant who completed the focus group was rewarded with a £10 Amazon voucher and refreshments.
To provide a basic structure for the focus groups the research team devised a list of issues and areas of interest that would drive the research. This led to the development of a topic guide for use in the exploratory focus groups which was trialled in two pilot focus groups. These were run with volunteers from the Department of Pharmacy and Pharmacology staff which allowed the research team to trial the recording technology, refine the topic area questions and allow the members of the research team to practice the role of facilitating and co-facilitating a semi-structured focus group. The topic guide was then edited to address any concerns raised during the pilot and a final version (S5) produced for use in the student focus groups.
During the qualitative data gathering process in the drinkers’ focus groups the structure of the topic guide and the interaction of the facilitators was minimised, which allowed for flexibility to follow up areas of interest identified by participants. A similar but altered topic guide (S6) was used for the non-drinkers’ focus group. The focus groups purpose was to explore undergraduate’s attitudes and opinions regarding alcohol, their motivations for drinking, and feelings about the role of alcohol in university life. Questions included the effect alcohol has on them and also the effect other alcoholic drinkers have on them. The discussion also aimed to establish the participant’s current awareness of the dangers of alcohol misuse. The focus groups were audio recorded by a digital audio-Dictaphone to be transcribed at a later date. Each focus group was led by a member of the research team whilst another co-facilitated the discussion; the two non-drinkers’ focus groups were led by a member of the research team who did not drink in order to encourage an open discussion where participants would not feel judged and were encouraged to share information.
Recorded data was transcribed by the research team and coded by the lead facilitator for each focus group. The qualitative data codes generated were then analysed by Inductive Thematic Analysis (ITA) to identify common themes. Thematic analysis is a common method for generating codes and themes from qualitative data in relation to a research question. This method of analysis works from the ‘bottom up’ and prevents the personal viewpoints of the researcher impacting upon the analysis. (29) Further reiterative individual ITA then took place for each member of the research teams’ report and final qualitative data results (see 3.1). The patterns and themes identified from these focus groups were used in the development of the online questionnaire.
2.3 phase 2- online questionnaire
Web-based formats have been shown to deliver reliable and valid results and to be useful alternative to traditional written methods (30); also for sensitive topics such as personal alcohol consumption and experiences an online format offers the highest degree of anonymity (29)which will help ensure accurate data collection. A drawback of a web-based survey is the need to have access to a computer to complete the survey, however, as the target population was undergraduate students who all have easy access to computers, the effects of this will be negligible.
Therefore, an online survey was considered to be the most appropriate format allowing the research team to easily target the desired undergraduate student demographic using social media, email and departmental forum noticeboards. All undergraduate students at the University were eligible to complete the survey. Departmental heads were asked to circulate the survey and departments were targeted using posters (S7) and social media posts on departmental groups to prevent bias of results and allow comparison between students of the different departments. To encourage participation each participant who completed the questionnaire was then offered the opportunity to enter in a random prize draw for the chance to win one of four £50 Amazon vouchers.
A short online questionnaire of 37 questions comprised of 7 different sections was developed and mounted online via the Survey-Monkey platform (see figure 2 in 2.3) on the 8/11/2016. Each section asked questions designed to gather a range of both quantitative and qualitative data exploring the respondent’s views on the key themes identified in the inductive thematic analysis of the qualitative data (see results 3.1). Some questions were only applicable to non-drinkers and others to drinkers. In the online-questionnaire for simplification, one alcoholic ‘drink’ was defined as one unit to remove the confounding effect of the respondents’ personal knowledge of alcohol units.
Most questions aimed to gather quantitative data to provide statistical analysis of results. Analysis of the survey was conducted using SPSS. All statistical tests were two tailed tests with a p value of 2 tests were used to compare observed with expected results.
A small pilot of the questionnaire was run as a quality control exercise on a small student population sample. This was done to ensure the survey questions were clear, legible and easily understandable. After pilot completion the survey was amended and finalised (see S8 for full survey) and went live on 15/11/2016 being circulated via methods described above for 22 days before closing on 7/12/16.
| Breakdown of Survey pages and sections | |
|
Pages |
Section |
|
Page 1 |
Introduction and information about the survey and the study |
| Pages 2-3 | 1- Participant demographic questions |
| Pages 4 -5 | 2- Patterns of Alcohol consumption |
| Page 6 | 3- Effects of Alcohol consumption |
| Page 7 | 4- Alcohol’s role in the University |
| Page 8 | 5- Alcohol Advertisement |
| Page 9 | 6- Alcohol Awareness |
| Page 10-11 | 7- University policy and Alcohol misuse |
| Page 12 | Optional contact details entry for prize draw |
Table 1- breakdown of survey design sections and pages
3. Results and discussion of qualitative data
3.1 qualitative data and thematic analysis results
Qualitative data was obtained by conducting five semi-structured focus groups with a total of 32 participants (table 2). Although, four were originally planned one was repeated due to poor participation. Each focus group involved 6-10 undergraduate students; with the exception of the first non-drinkers group (group 4).
Table 2 – breakdown of demographics of focus group participants
| Focus group | Number of participants | Number of males | Number of females |
| 1- 1st year drinkers | 6 | 2 | 4 |
| 2- 2nd year drinkers | 7 | 2 | 5 |
| 3- 3/4th year drinkers | 7 | 2 | 5 |
| 4- Non-drinkers 1 | 2 | 0 | 2 |
| 5- Non-drinkers 2 | 8 | 4 | 4 |
| Total | 30 | 10 | 20 |
The data sets were transcribed and analysed by the lead researcher for each focus group until an appreciation of the data was gained prior to coding. Data was coded and a list of semantic codes were formed for each transcript by a single researcher giving a total of 88 codes across the 5 transcripts (see S9 for full coded transcripts).The research team then met up and through Iterative Inductive Thematic Analysis (ITA), moderated by a project supervisor, the following initial 8 themes were identified as reoccurring across the qualitative data sets and identified as areas of interest for the questionnaire.
Table 3 – 8 themes identified as reoccurring across the qualitative data
| Themes | |
| Factors behind decision to drink/not drink | Awareness of non-drinking events |
| Drinking Culture | Knowledge of safe drink |
| University Policy/support | Influences on drinking quantities |
| Experiential effects of Alcohol | Gender Differences |
Further iterative ITA of the qualitative data and semantic codes developed leading to the establishment of 3 key themes and 11 sub-themes (Table 4) which ‘best-fitted’ the gathered qualitative data from the exploratory focus groups. The key-themes bore some relation to the study’s objectives, with themes 1 and 2 addressing objectives 1 and 2 and theme 3 addressing objectives 3 &4. Qualitative data of interest was presented and discussed under the appropriate key-theme subheadings below.
Table 4 – individual ITA results
| Key-themes | Sub-themes |
| 1. Factors behind decision to drink/not drink (motivation for drinking/not drinking) | 1. Religion
2. Family 3. Society/friendship pressures 4. Long and short term health affects |
| 2. Influences on drinking pattern (what factors impact on an individual’s quantity/frequency of drinking) | 1. Experiential effects of Alcohol
2. Drinking culture 3. Social factors- university events, birthday, sports clubs, friends all occasions for use, interaction with alcohol users |
| 3. Safe use of alcohol
Knowledge of safer drinking levels and support available |
1. Awareness of Lower risk limits and health concerns
2. Awareness of non-drinking events 3. Adverts/information campaigns 4. University Policy/support |
3.1.1 Factors behind decision to drink/not drink alcohol
This theme explored the many different factors reported by participants, for the motivation behind the decision to consume alcohol or not, including total abstinence. Reasons behind the decision taken by individuals were varied and ranged from factors that were personal to the individual (religion or family) to those that were more interpersonal and related to pressures from society, friends or effects on health. For example, the physical effects of alcohol were viewed as both a positive and negative influence on whether to drink.
The decision to drink alcohol was influenced by many different factors. One major factor identified by a large proportion of participants to be behind the decision to be alcohol drinker was the actions of the individual’s family, with participants across all three focus groups identifying the role of siblings and/or parents in their first experience with alcohol. The table below gives these quotes, their context and interpretation. Pressures on the individual from society and friendship groups were common and participants identified an almost herd mentality as a factor behind whether to drink or not.One participant in another focus group also discussed the impact of social groups (see table below).
The decision not to drink was influenced primarily by three factors; Religious beliefs, family and negative physical effects on health suffered by the individual after consumption of alcohol. Some quotes supporting this statement are shown in table 5.
Table 5 Quotes regarding the factors behind the decision to drink/not drink alcohol
| Quote | Participant ID | Reference to the quote | Comment |
| ‘my mum just sort of bought me it’ | Participant 5 in focus group1: p-5, f-1 | Actions of the individual’s family | Parents buying alcohol for the participant |
| I’m the youngest of four and everyone (but me) used to have a bit of wine with dinner, and that made me feel quite un-included’ | p-3 f-1 | Actions of the individual’s family | Indirect influence that family can exert on an individual’s decision to drink even when not being directly involved in the purchase or supply of alcohol |
| ‘It was the normal thing everyone started doing.’ | p-2 f-2 | Pressures on the individual from society and friendship groups | The use of the word ‘normal’ in the previous quote is particularly interesting here as it implies that to not drink alcohol is in some way abnormal and tells us a lot about this student’s attitudes towards alcohol. It would be interesting to see if this opinion is more widely held across the student population. |
| ‘I was with the boys the year above and it was sort of a little bit of being pressured into it initially’ | p-6, f-1 | impact of social groups, in this case the individual’s sports team | Pressures that many teenagers feel from society and friendship groups; may provide a target for future alcohol policy to address |
| ‘The way it makes my body feel, I don’t really like it’. | p-2, f-5 | Negative physical effects | Negative experiential effects |
| ‘it had a really bad effect on me so I didn’t want to do it again really’ | p-1, f-4 | Negative physical effects | Negative experiential effects |
| ‘My dad… he’s quite an aggressive drunk, so I see that and I’m like ‘stay away from that.’ | p-3, f-5 | Negative effects on the family | Actions of a close family member who drinks alcohol can influence an individual not to drink alcohol; contrasts to those in the drinking focus groups who cite family drinking as a major influence to drink |
| ‘Religion. I’m Muslim so my parents don’t drink, I don’t drink’ | p-2, f-4 | Religious beliefs | Religious beliefs were a common factor behind the decision not to drink alcohol |
3.1.2 Influences on drinking pattern
This superordinate theme encompassed those themes and codes which explored an individual’s drinking pattern. In particular, what influences there were which affected the frequency but also the quantity of alcohol consumed in single drinking session There were a large number of codes and themes that emerged from the qualitative data but through individual Iterative ITA three main sub-themes emerged (Table 4) Although some subthemes related to those in 3.1.1, for example, the social pressure from friendship groups, in this section they are presented addressed as an influence on the secondary decision of how much or when to drink, as opposed to the primary decision of to drink or not.
Social occasions such as; parties with friends, sport club events, going to the pub, birthdays, university events e.g. student nights and more were highlighted within and across the three drinking focus groups as an opportunity for alcohol consumption. To consider why alcohol and its consumption is commonplace at many social events, there must be consideration of the role it plays on these occasions and why participants felt the need to consume it. Participants across all three drinking focus groups highlighted the greater personal confidence and sociability due to the alcohol and attributed this to increasing their enjoyment of the occasion. Quotes, with comments, are shown in the table below. This perception was shared by many participants. It’s apparent that these experiential effects of alcohol contribute to its use at social events, and the arrangement of many of these social events may even be directly related to this. It is however, interesting to note that this contrasts with the feelings of participants of the non-drinkers focus groups, the majority of which didn’t feel that non-consumption had a negative impact on their ability to socialise. It’s interesting to consider why this difference may exist and if it does across a wider population sample and it may be due to alcohol drinkers ‘relying’ on the effects of alcohol on their confidence levels to enable them to socialise more so than non-drinkers.
Culture also has a clear impact on many occasions being regarded as drinking opportunities. See table 6 for quotes. It is difficult to determine why British culture developed the perception that alcohol consumption is a useful or even a necessary part of social events and is clearly an area worthy of further research. It can be argued that it’s not just a culture related to Britain but to a human culture as identified by the yearly consumption of 6.2L of alcohol per person worldwide (2). What is interesting is the extent of the pressures that British culture subjects onto individuals to consume alcohol, and the perception of all social occasions/public holidays being an opportunity to consume alcohol could go some way to explaining why British consumption is so much higher at 11.6L per person a year (3).
University culture may also be thought of as a separate micro culture within British culture and examples of this and its influence and pressures on drinking patterns could be found across the data sets. One particularly concerning example of the impact of university culture on student’s attitudes towards alcohol could be found within the focus group 1 data set of 1st year undergraduates. The university employs many volunteers over the induction weeks of university, one particular role is that of ‘fresher crew’; their role is described by the university to be a supportive one to help first year students integrate, find their way around and settle in at the university. However, as the quotes below indicate, some fresher crew appointees view their role differently.
The impact that the first few weeks of university can have on an undergraduate is hard to quantify but the actions of fresher crew encouraging binge-drinking amongst new undergraduate students could be a driver of the ‘normalisation’ of binge-drinking in university culture, and could be a useful target for university alcohol policies to tackle. It raises concerns and supports a call that the university must clearly do more and challenge the actions of its employed volunteers to tackle the binge-drinking that university culture promotes. What can be seen from the gathered data is that the factors and influences behind an individual’s drinking pattern of when, where and how much to drink is very complex and far reaching and may be completely personal to the individual themselves and aspects of their personality.
Table 6 – Quotes regarding the influences on drinking patterns
| Quote | Participant ID | Reference to the quote | Comment |
| ‘Its fun, makes you more confident…more sociable… it just makes everything loads better.’ | p-2, f-2 | Social events, drinkers | Greater personal confidence and sociability due to alcohol; attribution of this to increasing their enjoyment of the occasion |
| ‘It’s not that much of a hindrance.’ | p-6, f-5 | Non-drinkers focus groups | No negative impact of non-consumption of alcohol on the ability to socialise |
| ‘isn’t this weekend a better time because its Halloween’ | p-1, f-1 | Cultural impact of drinking | See below |
| ‘yeah that’s true it’s a drinking weekend’ | p-6, f-1 | Cultural impact of drinking | Reply to comment in the preceding row. An example of the drinking culture existing within British culture as well as to highlight the pressure British culture exerts to drink on social occasions |
| ‘you kind of know you are going to drink when you go to the socials’ | p-8. F-2 | Cultural impact of drinking | |
| ‘We’re here to drink, make you drink and we didn’t leave that room until we went down to the party’ | p-3, f-1 | Cultural impact of drinking; description of the role of the fresher crew at university | This is an alarming quote and it puts the spotlight onto the university and its students it enrols as volunteers |
| ‘it’s normal to get drunk’ | p-8, f-3 | Cultural impact of drinking; impact of the fresher crew at university | The actions of the fresher crew encouraging binge-drinking amongst new undergraduate students could be a driver of the ‘normalisation’ of binge-drinking in university culture |
3.1.3 Safe use of alcohol
This superordinate theme focussed on data exploring participant’s knowledge on the safer use of alcohol through four subthemes. The awareness of: safe limits of alcohol, non-drinking events, and knowledge of university policy on alcohol use and perceptions on advertisements and information campaigns for alcohol. There is some sub-theme cross-over, however this key-theme is distinguished from the others by attempting to establish and qualify what the participants knew about the dangers of alcohol, how they would seek help and participant ideas on what further support may be needed.
It was clear across all focus groups that participant’s knowledge of the reduced risk limits for alcohol was poor. Table 7 below gives examples of selected quotes. This demonstrates there could be a clear gap in the knowledge of students who do not cover alcohol as part of their course studies and this is further investigated in our questionnaire (S8).
As part of the focus group discussion’s participants were asked ‘So are any of you aware of any interventions available to students regarding unsafe alcohol use?’ in all drinking focus groups this was met with silence and only after prompts did any participants offer any answers ranging from no to limited guesses. It was clear from the focus group data that students knew very little/none about what support the university offered to support those struggling with alcohol misuse and this clearly shows that the university must do more to make students aware of the support available. To provide a clearer picture and quantitative data about the issue of the safe use of alcohol a section of the questionnaire was dedicated to gathering information on the subject (see 4.1.3 for results)
Table 7 – Quotes regarding the safe use of alcohol
| Quote | Participant ID | Reference to the quote | Comment |
| ‘none’ | p-1,f-1 | Recommended safe limits for alcohol | |
| Yeah, I wouldn’t have known them | p2,f2 | Recommended safe limits for alcohol | |
| ‘I do but only because I do Biology I think it’s 14 units a week ‘( | p-5,f-3 | Recommended safe limits for alcohol | Correct answers provided by those students who were studying health science based subjects |
| — | So are any of you aware of any interventions available to students regarding unsafe alcohol use? | All drinking focus groups this was met with silence | |
| ‘none of us know where to go’ | p-1,f-2 | Prompt to the above question in focus groups | |
| ‘didn’t the Medical Centre do a questionnaire about alcohol consumption’ | p-7 f -3 | Prompt to the above question in focus groups | Limited guess |
4. Results and discussion of questionnaire
To help address the study’s objectives, the most significant and interesting results have been taken from the online survey and have been presented in the format of each sub-section title being an objective and the findings discussed with reference to current literature. Full survey results can be found in (S8).
4.1. to determine patterns of alcohol consumption in relation to the demographics of the undergraduate student population
There were 319 respondents across the various years of study who completed the survey during its 22 day circulation period (Table 8). The majority (66.46%) of whom were identified as white British (n=212) (see S8 Q3). Of the 319 respondents a large proportion, 87% (n=276), self-identified as alcohol drinkers and 70% (n=217) admitted to drinking within the last week. Despite the research team’s attempt to get equal participation from respondents across the universities faculties a clear majority 70% (n=223) were identified as being part of the science faculty and this is a clear limitation of the data (see S8 Q5).
| Table 8 – respondent’s gender and year of study breakdown. | ||||||||
| Which year of study are you in? | Total | |||||||
| Year 1 | Year 2 | Year 3 | Year 4 | Year 5 | Year 6+ | |||
| Are you? | Male | 21 | 24 | 35 | 40 | 1 | 0 | 121 |
| Female | 36 | 32 | 45 | 82 | 1 | 0 | 196 | |
| Non-binary | 0 | 1 | 0 | 0 | 0 | 0 | 1 | |
| Prefer not to say | 0 | 0 | 0 | 0 | 0 | 1 | 1 | |
| Total | 57 | 57 | 80 | 122 | 2 | 1 | 319 | |
Underage drinking is a known issue in the UK with 38% of UK 11-15 year olds having tried alcohol.(15) The findings of this questionnaire support this with 70% (n=192) of respondents declaring they had tried alcohol by the age of 15. This alarming figure is near double the 38% identified (15) and suggests previous reports may have gravely underestimated the prevalence of underage drinking in the UK. However the small sample size and localized population sample must be taken in consideration as a limitation for this finding.
The literature also acknowledges there is a link with underage drinking and the chances of developing an alcohol use disorder. (16) To investigate the effect underage drinking had on future alcohol use a Kruskal-Wallis test was conducted on the questionnaire population, to determine if there were differences in units drunk in a single session (S8 q30) between groups differing in the age they first drunk alcohol (S8 q 9). A Kruskal-Wallis test was chosen due to the nonparametric characteristics of the dependent variable, as determined by a Shapiro-Wilk test. (p(see S10 for full output)
Distributions of scores were similar for all groups as assessed by visual inspection of a boxplot. There was a statistically significant difference in median units drunk scores between groups, (2 (df=7) = 27.010; p(see S10)
| Table 9 – median units consumed categorised by age of first drink | ||
| What age [years] were you the first time you had an alcoholic drink? | Median units consumed in a single session | N |
| Under 13 | 6.0 | 40 |
| 13 | 9.0 | 24 |
| 14 | 6.0 | 57 |
| 15 | 7.0 | 42 |
| 16 | 5.0 | 37 |
| 17 | 5.0 | 20 |
| 18 | 5.0 | 12 |
| Over 18 | 6.0 | 5 |
| Total | 6.0 | 237 |
The results show that those who started drinking at 13, drink more units in a session than those who began drinking at a more appropriate age (16, 17or 18). This tentatively supports the theory that underage drinking can make a person more likely to develop an alcohol use disorder and it would be an interesting area for further research to see if these results can be replicated in other studies/student populations.
4.2 To distinguish undergraduate student attitudes towards alcohol and its role in university life
Alcohol use clearly has a role in the university life of an undergraduate and students in the majority viewed alcohol consumption as a positive attraction to social occasions with 62% (n=183) agreeing that the alcoholic drink deals makes them more likely to attend a university event (S8 q24). This supports the findings in 3.1.2 that the alcohol consumption is a key motivation in the arrangement of many social events.
A topic of concern raised in the literature is the negative consequences of binge drinking on university students with a high percentage (45-69%) of alcohol drinking university students admitting to engaging in at least one binge drinking session per week. (18, 19) This was supported by the results of the questionnaire,with 61% (n=169) of respondents admitting to binge drinking at least once in the previous 7 days (S8 q32). This finding supports the current literature and is at the higher end of the estimate, and raises concern of the scale of binge drinking occurring at the university which is over double the national average of 28%. (3)The literature (20) identifies the negative consequences of heavy drinking with 32-37% of undergraduates admitting that heavy drinking led to behaviours they regretted. This result is supported by this study’s findings with 68% (n=200) of respondents saying alcohol consumption had led them to doing something they regret, perhaps most concerning is that 29% (n=84) admitted to engaging in unprotected sex due to the effects of alcohol. This is a finding of clear concern and examples a negative effect alcohol is having on the health and safety of the university’s undergraduates and there must be consideration if action from the university can address this issue.
The literature also suggests that students who binge drink may suffer academically (21) and in the studies questionnaire 61% (n=180) (S8 q16) declared that alcohol use had resulted in them missing a lecture, this is of clear concern and shows one way in which alcohol can detrimentally affect students’ academic performance. To further examine the impact binge drinking may or may not have on an undergraduates academic performance a test was run to look for correlation between frequency of binge drinking (S8 q32) and probability of missing a lecture (S8 q16). The two variables were shown to be non-normally distributed data by a Shapiro-Wilk test (p(see appendix 11 for full output). A correlation coefficient, R=0.532 (p(S11), indicating a positive relationship and suggesting that an increase in frequency of binge drinking was associated with an increase in the probability of missed lectures. These findings support the current literature suggesting that binge drinkers are more likely to suffer academically (21) and although the data is limited by use of a non-parametric test, the results strengthen a call for further research into the effect of alcohol on students’ academic performance. This must be a topic of great concern for the university.
4.3 To establish current awareness of the dangers of alcohol
Participants were asked to identify the reduced risk limits of alcohol consumption for both men and women (S8 q32) and only 32% (n=89) of them gave a correctly response suggesting a very poor level of knowledge across the undergraduate population.
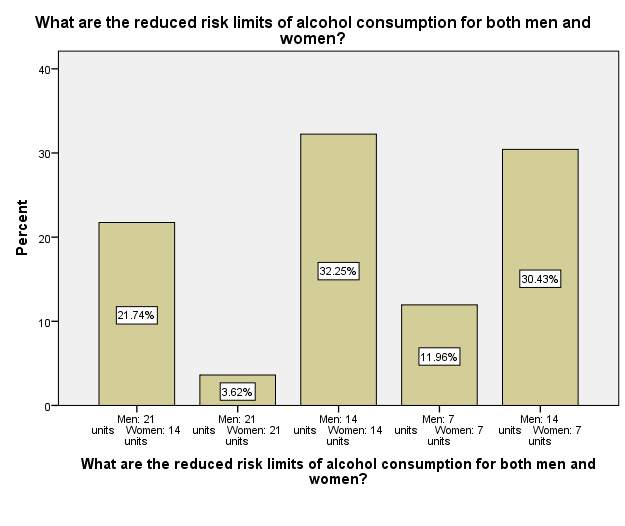
Figure 2 – illustrating respondent’s knowledge of safe use limits of alcohol
Further analysis of this result showed that of the correct respondents 80% (n=80) were identified as being part of the science faculty (see S12). A chi-square test for association was then conducted (S12) between participants’ faculty and selection of what participants thought was the correct risk limits for drinking for both men and women. There was a statistically significant association (2 (df=12) = 30.180; p=0.003). However, not all cell frequencies were greater than five and this invalidates the result. So, any conclusions drawn from it are unreliable and further investigation into this question may provide useful information. If there is a clear difference in knowledge between subjects of different faculties it could help any potential university policies or interventions to be targeted at those who study courses whose syllabus does not cover alcohol education and allow for more effective results.
A concerning finding from this study is that it’s clear that the student population’s knowledge of safe alcohol use is poor. Furthermore, a review of student advice and support policies on the use of alcohol at the University, were seen to be inadequate and incorrect. These showed outdated lower risk drinking limits (University’s Student Union online advice page, 2016). It is important that the university updates and improves its online advice page to reflect current guidelines and promotes its existence and value to the undergraduate population.
4.4 To investigate student opinion on targeted alcohol awareness and intervention programmes that the university have, or should have in place
Respondent use of alcohol services at the University was low with only 3.53% (n=9) (S8 q35) admitting use of a service to help tackle a personal alcohol problem. Whether this is due to a lack of need for the services or a lack of knowledge of their existence is up for debate and is in need of further research.
The final question of the questionnaire optionally asked participants for suggestions for what the university can do to spread awareness about safer alcohol use and the suggestions make for interesting reading (S8 q37). The response was high 85% (n=271) and this demonstrates that the majority of students feel that the University could be doing more to address the issue of alcohol misuse. The overriding theme from the suggestions was for a desire for education about the adverse risks of alcohol and for clear information of how many units is in typical drinks and what this means.
Common suggestions for how to achieve this is; through placement of posters around campus and halls, informational stands on parade handing out leaflets, clearer advice on the Students Union website and also compulsory seminars on alcohol dangers to first year undergraduates. These suggestions should be seriously considered by the university as they are suggestions that have come directly from its own student population.
5. Conclusion
This study demonstrates that alcohol misuse is widespread across the University and it is having an obvious impact on the health, safety and academic performance of its undergraduates. The findings suggest that most undergraduates have a worrying attitude towards alcohol and its consumption, and this may be driven by the poor knowledge of the safe use of alcohol of the undergraduate population. With 9 accidental drowning deaths in 7 years in the river Avon (S13), several of whom were students leaving nightclubs late at night having most likely consumed excess alcohol, the importance of appropriate alcohol advice and support from the University is clear.
The findings of this study echo those previously made by others (22, 27) which call for more to be done to negate the impact dangerous drinking patterns are having as the student population continues to increase. The results of this study must influence the university to update and correct its policy and advice in this area and the suggestions from its own students should be seriously considered and acted upon. The need for further research to provide increased clarity on undergraduate’s attitudes towards alcohol and its consumption is urgent. Further investigation on the effect negative drinking patterns are having on the undergraduate populations across the UK a very important and interesting field/topic that needs addressing.
6. References
1. World Health Organization. Global health risks. 2009; Available from: http://www.who.int/healthinfo/global_burden_disease/GlobalHealthRisks_report_full.pdf
2. World Health Organization. Management of substance abuse Alcohol. 2012;5–6.
3. World Health Organization. Country profiles. 2014; Available from: http://www.who.int/substance_abuse/publications/global_alcohol_report/msb_gsr_2014_2.pdf?ua=1
4. Beasley MJ, Macfarlane TV, Macfarlane GJ. Is alcohol consumption related to likelihood of reporting chronic widespread pain in people with stable consumption? Results from UK biobank. Pain. 2016;157(11):2552-60.
5. Rehm J, Room R, Graham K, Monteiro M, Gmel G, Sempos CT. The relationship of average volume of alcohol consumption and patterns of drinking to burden of disease: an overview. Addiction. 2003;1209–28.
6. Room R, Babor T, Rehm J. Alcohol and public health. Lancet. 2005;365(9458):519-30.
7. Office for National Statistics. Statistical Bulletin Adult Drinking Habits in Great Britain, 2013. 2013;(February).
8. NHS Choices. Alcohol misuse. 2015; Available from: www.nhs.uk/conditions/Alcohol-misuse/Pages/Introduction.aspx
9. Chikritzhs TN, Jonas HA, Stockwell TR, Heale PF, Dietze PM.. Mortality and lifeyears lost due to alcohol a comparison of acute and chronic causes. Med J Aust. 2001;174(6):281-4.
10. Wood K, Patterson C, Katikireddi SV, Hilton S. Harms to ‘others’ from alcohol consumption in the minimum unit pricing policy debate: a qualitative content analysis of UK newspapers (2005–12). Addiction. 2014;109(4):578-84.
11. Public Health England. Alcohol treatment in England 2013-14. 2014; (October).
12. Statistics On Alcohol England, 2016. 1st ed. 2016. Web. 14 Jan. 2017.
13. GOV.UK. The Government’ s Alcohol Strategy. 2012.
14. National Institute for Health and Care Excellence. Alcohol-use disorders: prevention. 2010;(June).
15. Care S, Centre I. Smoking, drinking and drug use among young people in England in 2014. 2014.
16. Grant BF, Dawson DA. Age of Onset of Drug Use and its Association with DSM-IV Drug Abuse and Dependence: Results from the National Longitudinal Alcohol Epidemiologic Survey. 10:163–73.
17. Webb E, Ashton CH, Kelly P, Kamali F. Alcohol and drug use in UK university students. The lancet. 1996 Oct 5;348(9032):922-5.
18. Elliott MA, Ainsworth K. Addictive Behaviors Predicting university undergraduates ’ binge-drinking behavior : A comparative test of the one- and two-component theories of planned behavior. Addict Behav [Internet]. Elsevier Ltd; 2012;37(1):92–101. Available from: http://dx.doi.org/10.1016/j.addbeh.2011.09.005
19. Heather N, Partington S, Partington E, Longstaff F, Allsop S, Jankowski M, et al. Alcohol Use Disorders and Hazardous Drinking among Undergraduates at English Universities. 2011;46(3):270–7.
20. Babor T. Alcohol: no ordinary commodity: research and public policy. Oxford University Press; 2010 Feb 25.
21. Faulkner BS, Hendry LB, Roderique L, Thomson R. A preliminary study of the attitudes , triggers and consequences of hazardous drinking in university students. 65(2):159–69. 2006.
22. Armstrong-Hallam S, Penny GN. Student Choices and Alcohol Matters ( SCAM ): LCOHOL. 2010;
23. Conrod PJ, O’Leary-Barrett M, Newton N, Topper L, Castellanos-Ryan N, Mackie C, Girard A. Effectiveness of a selective, personality-targeted prevention program for adolescent alcohol use and misuse: a cluster randomized controlled trial. JAMA psychiatry. 2013;70(3):334-42.
24. Conrod PJ, O’Leary-Barrett M, Newton N, Topper L, Castellanos-Ryan N, Mackie C, Girard A. Effectiveness of a selective, personality-targeted prevention program for adolescent alcohol use and misuse: a cluster randomized controlled trial. JAMA psychiatry. 2013;70(3):334-42.
25. Lau AS, Guo S, Tsai W, Nguyen DJ, Nguyen HT, Ngo V, Weiss B. Adolescents’ stigma attitudes toward internalizing and externalizing disorders: Cultural influences and implications for distress manifestations. Clinical Psychological Science. 2016;4(4):704-17.
26. Karam E, Kypri K, Salamoun M. Alcohol use among college students: an international perspective. Curr Opin Psychiatry [Internet]. 2007;20(3). Available from: http://journals.lww.com/co-psychiatry/Fulltext/2007/05000/Alcohol_use_among_college_students__an.8.aspx
27. Webb E, Ashton CH, Kelly P, Kamali F. Alcohol and drug use in UK university students. 1996;348:922–5.
28. Wellings K, Branigan P, Mitchell K. Discomfort , discord and discontinuity as data : Using focus groups to research sensitive topics. 2000;1058(December).
29. Braun V. Successful qualitative research : a practical guide for beginners. Clarke V, (editor). London: London : SAGE; 2013
30. Miller ET, Neal DJ, Roberts LJ, Baer JS, Cressler SO, Metrik J, et al. Test – Retest Reliability of Alcohol Measures : Is There a Difference Between Internet-Based Assessment and Traditional Methods? Psychol Addict Behav. 2002;16(1):56–63.
Cite This Work
To export a reference to this article please select a referencing stye below:
Related Services
View all


Related Content
All TagsContent relating to: "Students"
Students are usually defined as someone enrolled in a school, college, or university, for learning or is in training for a particular profession, e.g. a student nurse.
Related Articles

DMCA / Removal Request
If you are the original writer of this dissertation and no longer wish to have your work published on the UKDiss.com website then please: