Development of a Signal Detection Prototype for Wireless Communications
Info: 10112 words (40 pages) Dissertation
Published: 9th Dec 2019
Content
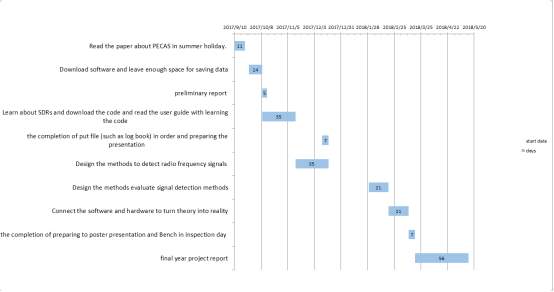
2. Project Specification Report and Gantt Chart
4. Industrial relevance, real-word applicability and scientific impact
Energy detection is aimed for spectrum sensing in cognitive radio because of its simplicity and applicability. Detecting radio frequency signals and evaluating signal detection methods are important in the area of wireless communications. This report shows the classical energy detection and the drawbacks and limitation of it. The appearance of improved energy detection can effectively reduce the misdetection which is resulted in by the classical energy detection. This project is based on the connection between software and hardware. It has two part that transmitter program and receiver program and how to modify the core code of receiver program is the main job. This program run in Ubuntu on Linux system and related configuration parameters are shown in the report. The results about energy values and periods of sensing events are shown. In the case that the results from two programs can match with each other, it indicates that the success of the design of IED scheme. However, this method also has shortcomings and can still be improved in the future. Related Industrial relevance, theory, design, results and discussion are provided in this project report.
A Gantt chart preferable produced by MS Excel
This project is to develop a hardware prototype to detect radio frequency signals and evaluate signals detection methods in the area of wireless communication systems. The systems called Dynamic Spectrum Access/Cognitive Radio can increase the efficiency of spectrum use and employ various techniques to get statistical information on the primary spectrum efficiency [1]. This sensing-based approach has significant advantages such as low cost, complexity, independence and suitability to a wide range of spectrum bands. However, the limited reliability caused by an imperfect detection performance is its main disadvantage [1]. Therefore, this project is asked to make use of language programming to design a low-cost prototype to implement the software and hardware. The proof-of-concept, validation and optimization of algorithms and design have all been considered in this project. The previous work has provided the hardware design and software implementation of the low-cost prototype but at the expense of increased complexity and confined field of applicability [2]. Compared to the classical energy detection scheme, an improved version has been provided but only gives the energy detection algorithm [2]. Therefore, the main work is putting the algorithm into language with the help of the fully function tool, and new language programs that could detect radio frequency signals and evaluate signals detection need to be designed with certain debug. At the end part of the project, all the functions are achieved on the device successfully.
In the previous documents, a systematic overview on CR networking and communications are provided by seeing the key functions of the physical, medium access control and network layers involved in a CR design and how these layers are closed [3]. The studies in this paper shows that the spectrum scarcity is strongly contributed by the inefficient and inflexible spectrum allocation policy, and this result is even worse than the physical shortage of the spectrum. Novel solutions are developed to increase the utilization efficiency of the radio spectrum because of the principle of sustainable development [4]. The spectrum occupancy pattern of primary systems cause the performance of DSA/CR systems and can monitor periodically the occupancy state of licensed channels [5]. Another paper about DSA focuses on the study about spectrum sensing algorithms for spectrum occupancy estimation, the estimation of spectrum occupancy statistics based on spectrum sensing and statistical model for spectrum occupancy [6]. The results of the periodic spectrum sensing decisions can find that the DSA/CR systems can estimate the duration of the channel idle/busy periods and compute relevant statistics. However, it results in inaccuracies on the estimated statistics and the relative impact need more methods to deal with the problem about sensing errors [7]. The relative paper also defines that spectrum sensing is the cornerstone of DSA. After utilizing the radio resources, the presence of Primary Users is sensed by the Secondary Users on the targeted spectral bands. Therefore, the performance of Secondary Users channel selection algorithms can be improved by getting knowledge about the Primary Users traffic statistics [8]. On the other hand, channel occupancy rate which is called COR is the fraction of the time that a channel is occupied. The aim of the improved COR estimation method is to increase the use possibility of high false alarm to improve sensitivity without the overestimation, which is related to high false alarm probabilities [9]. By using Shannon’s sampling formula, the consideration of the sum of the squares of statistically independent Gaussian varieties is reduced by the problem about the detection of a deterministic signal in white Gaussian noise. In the situation that when the signal is absent, the number of degrees of freedom equal to twice the time-bandwidth product of the input because there is a central chi-square distribution about the decision statistic. In the another situation that when the signal is present, the same number of degrees of freedom and a non-centrality parameter equal to the ratio of signal energy to two-sided noise spectral density because the same reason with the previous situation [10]. Therefore, it is necessary to study the improved energy detection tin CR system.
In the area of wireless communication system, software defined radio can make the mobile phone with different kinds of radio frequency standard connect with each other. It can realize the compatibility of various modes. In the technology market, this prototype will have an idealized application prospect in the future because of the fast development of 3rd-Generation and 4th-Gneration [11].
It is also closely related to industry. Because when the programs have been designed successfully, it can work with the connection between a Raspberry Pi (RBPi) and laptop. The machines used in the project are RTL-SDR signal receiver and a PECAS transmitter. Therefore, the transmitter with the functions can be produced in large quantities. In the old-version, sensing-based approach have achieved certain results which is provided before. The old-version can also run in the Matlab. When using C programming to replace Matlab, it can achieve higher levels of efficiency and guarantee real-time operation. So in the industry, it will improve the old mode to become more integrated and widely applicable.
In the market, it will become competitive because of its characteristic that low-cost and comprehensive. As the PECAS paper said, it has shown that the total cost of the presented prototype is 60 pounds [1]. When more advanced mode exists at the market, even the price has not changed, it will attract more customers especially the appliance manufacturers. Because of the mature of RBPi system, it can even create a platform for detecting radio frequency signals and evaluating signal detection. Another point is that the popular RTL-SDR run with the connection of computer, which means for the small device and normal laptop, the function can be realized successfully. It will not occupy space or spare too much manpower or material resources. Software with the core code is its key point. This can help it broaden the market for SDR materials.
In the present society, the existing conflicts between spectrum demand growth and spectrum underutilization can be handled with Cognitive Radio network. The purpose of it is to improve spectrum usage efficiency by allowing some unlicensed users to access in an opportunistic and non-interfering manner some licensed bands temporarily unoccupied by the licensed users. But the recent study [6] found that the resulting probability of detection can only detect some primary signals but lose some other signals, which making some radio technologies more susceptible to interferences under the same operating conditions [6]. Therefore, if the improved energy detection can be designed with the language programming, an ideal spectrum sensing algorithm will be brought into the market that can provide detection performance improvements for any primary signal without incurring in excessive implementation and computational costs.
The prototype for the estimation of channel activity statistics in Cognitive Radio which is also called PECAS has two parts that transmitter part and receiver part. The transmitter must be run on a Raspberry Pi with Raspbian, but the receiver can be run on standard Linux computer with various platforms as well. It can run from a Graphical User Interface or a Command Line Interface. Its operating system can be Xubuntu and Lubuntu which were run live from a USB flash drive. It can also be adapted in different Kernel version of Linux. Even it can run in different kinds of computer with various model of CPU [12]. This is means that its applicability is very wide and after the improved energy detection has been designed, it can be tested and compared in different platforms and give a better choice to the market. Another point is that customers will hope when the energy detection is running, they can normally using browsing, email and other common user applications. In principle, it can run as usual and will have not effects on the real-time operation of the two program parts. Certainly, for decreasing misdetections, less use is necessary. But this point still attracts the market’s attention.
One more point is that if a better improved energy detection has been designed and brought into the practice, engineers only need to install and run the software with the help of user guide and change the core code of the receiver program at Linux system. Few operations of hardware make the whole process convenient and workers can devote all efforts into the design of language programming. The change of energy detection will be accompanied by the growth of version of software and hardware. It is consistent with the important sustainable principle of the market.
The spectrum sensing problem can be materialized into two formulates. Making use of a binary hypothesis testing problem can make the theory clearer. These two hypotheses are followed [2]:
H0:yn= ω n n=1, 2, . . . , N
(1)
H1:yn=xn+ ω n n=1, 2, . . ., N
(2)
In these two hypotheses,
H0is a null hypothesis and it means the received signal samples y[n]. It is equal to the signals that noise samples
ω [n]. Therefore, there is no primary signal in the sensed spectrum band. Compared to
H0, H1shows that some licensed user signal x[n] is present. Therefore, it is equal to the sum of noise samples and licensed user signal. N means in the signal observation interval, the number of samples collected will be calculated. When detecting energy, a missed detection can happen if the primary signal will exist in the sensed band and the hypothesis
H0is selected by spectrum sensing algorithm. This will cause the harmful interference to primary users. When the sensed spectrum band is idle, the hypothesis
H1is selected by spectrum sensing algorithm. At this time, a false alarm will happen. Therefore, two probabilities that the probability of missed detection and the probability of false alarm can summarize the performance of any spectrum sensing algorithm [2]:
The probability of missed detection:
Pmd=pH0H1 (3)
The complementary probability of missed detection:
Pd=1-Pmd (4)
The probability of false alarm:
Pfa= pH1H0. (5)
In the energy detection, large value of
Pdand low
Pfais needed. But it can easily be found from the previous formula that when the value of
Pdis bigger, the value of
Pfawill increase at the same time. Therefore, finding the trade-off point in the experiment is also very important.
The classical energy detection which can also be called CED or radiometric detection has measured the energy received on a primary band in the process of an observation interval:
Tiyi= ∑n=1N| yi[n] |2>λ→H1
(6)
Tiyi= ∑n=1N| yi[n] |2<λ→H0
(7)
Tiyi
is the test statistic computed in the i-th sensing event over the signal vector
yi=yi1, yi2, . . . , yi[N], and
λis a fixed decision threshold to classify between two hypotheses
H0and
H1. This formula means that if the measured energy is bigger than the fixed decision threshold, the principle will declare the current channel state
Sias busy, which is adapted to hypothesis
H1. Or if the measured energy is smaller than the fixed predefined threshold, the principle will declare the current channel state
Sias idle, which is adapted to hypothesis
H0. However, there is a phenomenon that when N=10, it is a short sensing periods that cannot provide reliable estimates of the signal energy [2]. The test statistic values will be variable highly in this period, which cause a large quantity of cases fall below the decision threshold even in the presence of a primary signal. An important number of signal misdetections will be resulted in and a significant detection performance degradation will happen. Even if the received energy remains as the same, the variability of the test statistic decreases with the N increasing, it will cause the probability of misdetecting the primary signal exists the same condition.
So the appearance of Modified Energy Detection (MED) and IED (Improved Energy Detection) is very timely and necessary. Modified Energy Detection can overcome the limitations of the CED scheme. If the misdetections caused by instantaneous signal energy drops could be avoided which has been provided in the previous part, the detection performance might be improved. This is the meaning of the appearance of MED methods. The MED method to the same test statistic calculation as what CED method does, but the difference is that MED methods can maintain an updated list, which contains the test statistic values of the last L sensing events [2]. The L sensing events is made use of to calculate an average test statistic value and the value of L is a configurable algorithm’s parameter.
TiavgTi=1L∑l=1LTi-L+l(yi-L+l)
(8)
TiavgTi
is the average test statistic value computed in the i-th sensing event, which is based on the test statistic vector
Ti=Ti-L+1yi-L+1, Ti-L+2yi-L+2, . . . ,Ti-Lyi-L, Ti(yi). An additional check based on
TiavgTiis performed before deciding the final channel state
Siif the test statistic
Tiyifalls below the decision threshold
λ. The purpose of this additional check is to prevent a busy channel from being declared to be idle when an instantaneous signal energy drop combined with a sufficiently short sensing period. On the base of this check, if an idle channel is reported by a sensing event and at this condition, the test statistic value is smaller than the value of decision threshold, but the average test statistic value of the last L sensing events is bigger than the decision threshold. A signal is presented in the sensed channel and at the same time, an instantaneous energy drops of the received signal combined with a sufficiently short sensing period will cause the test statistic value is smaller than the decision threshold. The result of this condition is that the channel should be declared as busy. In opposite, when the test statistic value and the average test statistic value are both smaller than the decision threshold, the channel is actually idle. Therefore, the purpose of MED scheme is to reduce the number of misdetections when the instantaneous signal energy drops.
However, the MED method also has some drawbacks [2]. When the primary signal stops after some period of activity and it releases the channel, because of the absence of the primary signal there are some sensing events leading the test statistic is smaller than the decision threshold, but at the space where the signal was still present, some average test statistic will be bigger than decision threshold. It will lead to several consecutive false alarms. Therefore, the appearance of IED scheme is necessary to reduce the false alarm ration of the MED scheme instead of perform the upper-bounded of CED method.
To avoid false alarms, the IED scheme provide an additional check about the previous sensing event
Ti-1yi-1. At the condition that if the test statistic is smaller than decision threshold and the average test statistic is greater than decision, judging whether the test statistic of the previous sensing event become an important point in the next few steps. If this test statistic is greater than the decision threshold, the result that the test statistic of the event is caused by an instantaneous energy drop. The principle should declare the hypothesis
H0. Relatively, if this test statistic is smaller than the decision threshold. The result that the test statistic of the event is caused by the channel release. The principle should then declare the hypothesis
H1. However, in case that if both the value of the test statistic and the average test statistic are smaller than the decision threshold, instantaneous energy drop have an influence on the various consecutive sensing events. In this case, there is no difference between MED and IED. Both of them will declare the hypothesis
H1. Therefore, the IED scheme improves the energy detection performance of CED method and at the same time it decreases the false alarm ratio compared with the MED method.
The algorithm of the classical energy Detection (CED) scheme is the fundamental method in this project. In the terminal of input, a positive real number is given to decision threshold
λ. A natural number is given to the number of sensing event N. In the terminal of output, an aggregate only including two results that
H0and
H1is given to a hypothetical aggregate
Si. According to the CED principle, the first step is to define a for loop about the sensing event. The letter I is defined to the number of sensing event. The second step is to assign each value of energy of N samples to each test statistic
Tiyi. The third step is to compared whether the test statistic
Tiyiis greater than the decision threshold. On the base of the theory, if the result is that the previous one is larger than the latter one, the hypothesis
H1is assigned to the output terminal
Si. Oppositely, if the result is that the previous one is smaller than the latter one, the hypothesis
H0is assigned to the output terminal
Si. After all the sensing event has experienced the compared process, the for loop stops automatically [2].
In the language programming design, the sense channel is the core program in this project. It also means that changing and improving this part of program is the main work of the project. The fundamental program is the design of classical energy detection. At the first part, it defined the various local configuration that can be used in the whole program. After the work of definition, it allocates memory to the data buffer. It is important to focus that each complex sample requires two values that I and Q. These are two data that received in PECAS receiver. It should also adjust whether the data buffer or RTL-SDR sample is null or not. After this work, it allocates memory to the vectors that will store the energy values and the detected periods. Because every sensing event need an energy value, it gives one thousand extra space to the length. Every sensing event maximum need a detected period, so in the design of the program, the size of period should be enough whether it is idle period or busy period. After all the work of allocation, resetting period register and resetting plot vector are the next steps. The number 0 is assigned to the meaning that the current period type is idle. The number 1 is assigned to the meaning that the current period type is busy. Initially setting an unknown value -1 to the current period type is a preparatory work. Device’s buffer must be reset before any samples can be read and the value of reset buffer must be greater than zero. The part of warm up is the last part before starting sensing the channel. The purpose of this part is to discard the first few seconds of reception. The warm up time is the value of configuration in the file ‘config.txt’ and can be set before the program runs. Any problem such as the samples lost will lead the program stop and exist immediately.
The next part is the beginning of sensing the channel. The configuration of center frequency and sample rate will be assigned into the program. The value of reception start time will also be assigned respectively to the last-sensing-time, the period-start-time and current-time. If the elapsed-time defined from the reception-start-time to current-time is smaller than the decision configuration of reception-time, the program can run into the while loop. Checking the thing that if a sensing event is required, is the first step and the requirement is that the elapsed time that from last-sensing-time to current-time is greater than the configuration. The debug step is that time error should be less than 1 microsecond in most computer. Checking if the sensing event is delayed by more than 1 microsecond is the step before updating the time of last sensing event. The specific step is to assign the value of current-time to last-sensing-time. It is important to reset the device’s buffer before reading more samples to avoid the situation that the samples from previous sensing event have an effect on the result of the current one. Reading data from the device is the next step. Any problem including sample right might be too high, sample lost or others should be shown and the program should exit at those situations. After that, it can split I and Q streams for further processing and can calculate mean signal value. This is because RTL-SDR provides interleaved samples such as I, Q, I. Q and continuously so on. Each sample is an 8-bit unsigned integer value from 0 to 255 where 127 is zero signal. Therefore, samples should be turned into 8-bit singed integer values from -127 to 128 as well.
The next step is to define the value to calculate the mean value of I steams and Q streams. It should be focused that only the first N samples are needed. After that, the next core step is to compute the energy of the N samples and the mean value is subtracted from each sample to remove. After the calculation, the program then saves the energy value and updates the counter. This process can also be used to check real-time operation. If the result in the test mode, the energy values are plotted. The step to add new energy value to the vector to be plotted and to plot latest history of energy values are both included in the plotted process.
The next step is the core program of this sense channel function. It is the process that determine if the end of the current period has been reached. This part is agreed with the algorithm theory previously mentioned. In this part, the first step is to update current time, which is to define the clock time. The next step is to calculate current period duration in seconds. The next step is to display duration of the detected period. According to the configuration of detected periods, the current period type can be chosen. If the current period type is -1, it will show the current period duration is the unknown period. If the current period type is 0, it will show the current period duration is the idle period. If the current period type is 1, it will show the current period duration is the busy period. After displaying the duration, the next work is to add the period duration to the right vector. The current period type should be chosen. If the current period type is 0, it detected the idle periods. If the current period type is 1, it detected the busy periods. In this step, updating the counter for the next pair of idle-busy periods is also needed done. After the work of add the period duration, the next step is to update the last observed period type. If the current period type is equal to -1. The first period detected is given in this sequence. Otherwise, the new period type should be switched and the timing of new period should be started again. At that time, the current time, also called clock time should be updated again. After this loop work, the next step is to check if operation was in real-time because of the importance of the environment of real time operation. At last, all the channel sensing results should be saved and the work that freeing the memory allocated to the data buffer and I/Q samples should also be noted.
The algorithm of Modified Energy Detection (MED) scheme is the improved version when comparing with the algorithm of CED. Similarly, in the terminal of input, a positive real number is given to the decision threshold
λ. A natural number is given to the number of sensing events. But one more natural is given to the number of last L sensing events. In the terminal of output, it is the same as algorithm of CED that given an aggregate that including two hypotheses
H0and
H1. At the first few parts. It also defines a for loop function for each sensing event and assign the energy of N samples to the test statistic. But the first different point is that it defines value of the average test statistic
TiavgTi. The result of this statistic is assigned from the mean of a series. Each item in series is
Ti-L+l(yi-L+l)and l is from 1 to L. Then if the test statistic is greater than the decision threshold, the hypothesis
H1is assigned to the output terminal. However, if the test statistic is smaller than the decision threshold, it need to compare the size between the average test statistic and the decision threshold. If the average test statistic value is greater than the decision threshold, the hypothesis
H1is assigned to the terminal of output. Otherwise, if the average test statistic is smaller than the decision threshold, the hypothesis
H0is assigned to the terminal of output. After all the sensing event has experienced the compared process, the for loop stops automatically [2]. But as what the previous part said, the MED scheme is the upper bound of CED scheme. This method is not a very perfect improvement of energy detection. The IED method is both of the upper bound and lower bound of the CED scheme. Therefore, in the language programming, the function will not change on the base of MED method.
The algorithm of Improved Energy Detection (IED) scheme is the core algorithm of this project. It is similar with the algorithm of MED scheme. But the difference between these two algorithms is that when comparing the result between the average test statistic with the decision threshold, it need to comparing the result between the previous item of the test statistic with the decision. This purpose is to reduce the misdetection which is shown in the theory part. If the previous item test statistic is greater than the decision threshold, the hypothesis
H1is given to the output terminal. If the previous item test statistic is smaller than the decision threshold, the hypothesis
H0is given to the output terminal. All the other algorithms are in line with the MED method. Because this is the core algorithm, the steps that developing the program can skip the MED method process and directly do the development work about IED scheme. It is significant that all the line in the algorithm should be exactly correspondence with the language programming after the changes.
In the language programming, there is a list of configuration that need to be set before changing the code of CED scheme. These configurations are stored and set in an independent external file. The warm-up-time should be set around 5 to 10 seconds at the beginning and this time do not produce reliable data. The total reception time can be decided by the tester whether the time is long or shot. This value is usually from 3 to 5 minutes. Time elapsed between consecutive sensing event which is also mean the sensing period is set to 0.2s. It should be paid attention that the absolute minimum value of this parameter that allows real-time operation on a Raspberry Pi 3 is 0.006 second. Time spent sensing the channel and capturing signal samples should be as short as possible and its value is set to 0.001 second. The set of the decision threshold is an important difficult work in this part. This is because the changes about other configuration parameters will lead to the change of observed noise statistic. This will cause that in each changing process, the value of decision threshold should be renew. The captured samples which is noise can help determine the value of the decision threshold after running the program. In the process of designing and trying, this value is changing from 10 to
105. The test mode displays a figure with the instantaneous received energy. This configuration parameter helps to find the typical energy levels received for a particular configuration and find a suitable value for the decision threshold. However, when the actual experiment takes place, this should be disabled because it will slow down the receiver and prevent real-time operation. O is set to make the test mode OFF and 1 is set to make the test mode ON. Before the program runs, this value is preset to be 1 and presents the test mode as an ON state. The configuration that displays statistics of the sensed energy values should also be set. This parameter helps to set the decision threshold. The measured energy values will correspond to noise only and the statistics displayed can be used to select the decision threshold. The program also displays the values for the decision threshold that provide a probability of false alarm. 0 is set to display energy statistics, and 1 is set to not display the energy statistic. This value is preset to 1 and present the energy statistics displayed before the program runs. A configuration parameter that saves the captured energy values to a file is needed. If the file exists, it will be overwritten. 0 is set to not save the measured energy values and 1 is set to save the measured energy values to an independent external file. This value is preset to 1 and make every data can be saved into the file before the program runs. The configuration parameter that shows the values of the detected busy or idle periods should also be set before. The operation that printing the durations of the detected periods in the screen will make the program delay and have a certain effect on the ability of the receiver to operate in real-time operation. Therefore, in the final experiment, this option should be stopped if the work about testing or debugging has been finished in the previous experiment. The configuration parameter of center frequency should be agreed with the PECAS receiver’s. This value is set to be 433.92 MHz. The configuration parameter of sample rate is valid from 225001 to 300000Hz and also from 900001 to 3200000Hz. This is also the number of complex I/Q samples per second. Therefore, the maximum value is 3200000Hz and the sample loss is to be expected for rates greater than 2400000Hz. The sample rate is preset to 1000000Hz. The valid range of frequency correction value is from -10000 to 10000 ppm. The default value is 0, so the frequency correction is preset to 0. The configuration parameter that turns the tuner automatic gain control on or off should also be set. When set to on, this property will enable the tuner automatic gain control to provide almost constant amplitude signals. 0 is set to present the automatic gain control state ON and 1 is set to present the automatic gain control state OFF. This configuration is preset to 0 to turn of the tuner AGC. The last configuration parameter is the tuner gain. It applies when the Enable-Tuner-AGC is equal to zero. The valid range and actual values of this parameter depend on tuner chip. The valid range is usually from 0 to 50 and the closet valid gain will be automatically selected. This value is preset to 25 reasonably.
In the design of language programming about IED scheme, the first change is that: 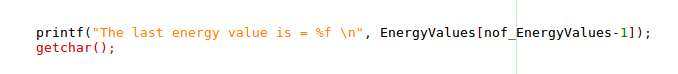
It is to show the value of each last energy value in the process. Getchar is aim to read the next character from standard input. This change is after the step that saving energy value and updating counter. It is convenient to indicate the energy value every time when the energy detection is running and the screen is displaying the images.
The second change is that:
It is to ask the tester the number of last sensing events he wants to do the statistic work. This is the value of L in MED method and IED method. It is used to help calculate the average test statistic. It should be asked before the warm up time and the time starting sensing the channel.
The third change is that: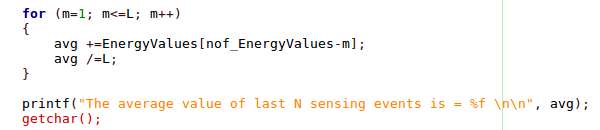
This is the step to calculate the value of average value of last sensing everts. A natural number m is given to count the items. The energy values which has been collected and calculated in the previous steps are assigned into this function. It conforms to the equation 8.
The forth change is that: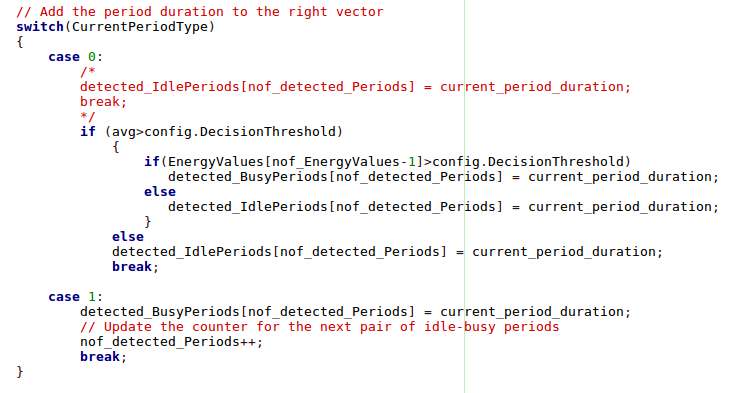
This is the step to add the period duration to the right vector of IED scheme. In the switch function, it defines a hypothetical statement at the condition that the average test statistic value is bigger than the decision threshold. In this sub-function, it defines one more hypothetical statement that comparing the size between energy value of previous sensing event and the decision threshold. If the previous value is greater than the latter value, the program detects the busy period. If not, the program detects the idle period. The value of current period duration is assigned to the result of detection. However, if the average test statistic is smaller than the decision threshold, the current period duration is assigned to detect idle periods. This conforms to the algorithm of IED methods. But in case 1 that the program detects the busy period, there is no change because in this test part there is no difference between IED method and CED method.
The fifth change is that: 
This is the step to display the duration of the detected period. In the switch function, if the choice is zero, which means the current period type is idle, it compares the results between average test statistic and the decision threshold. If the former one is greater than the latter one, it defines another hypothetical statement that comparing the results between the test statistics of previous sensing events with the decision threshold. If the value of statistics is greater than the decision threshold, the output terminal displays the detected busy period as the current period duration. If not, the output terminal displays the detected idle period as the current period duration. On the other hand, if the average test statistic is greater than the decision threshold, the output terminal displays the detected idle period as the current period duration. In other choice, if the case is -1 or 1, the output terminal will still display the period as the CED scheme does. There is no difference between CED method and IED method when the current period type is unknown or busy in the part to display duration.
The equipment required is a RTL-SDR receiver, a laptop with Linux system, a Raspberry Pi, and a PECAS transmitter. The PECAS receiver is based on a very low-cost Software Defined Radio called RTL-SDR. By means of a suitable driver, the received I/Q data can be accessed directly and processed in software from a PC [1]. This implementation employs the most common tuner dongle, which can be used as an SDR receiver, and its frequency covers the 433 MHz ISM band. The receiver tolerates a maximum input power of 10 dBm and features a low-noise amplifier with automatic gain control with the range from 0 dB to 50 dB. The signal at 433.92 MHz is down-converted to an intermediate frequency of 3.57 MHz where it is sampled at 28.8 MHz and decimated to the desired base-band sample rate before being sent to the PC via USB. The receiver can provide 8-bit I/Q samples at a programmable sample rate and the value of its theoretical maximum is 3.2 MS/s, stable maximum is about 2.4 MS/s. When the program runs, the center frequency is 433.92 MHz. The Sample rate is 1 MHz and the tuner gain is 25 dB [1].
The receiver is designed to run on Linux, therefore a functional installation of Linux is required [12]. The receiver program can be installed in Debian or Ubuntu-based distributions. The first step is to install the development package for libusb1.0. Osmocom’s RTL-SDR library depends on the libusb library to communicate with the RTL-SDR radio. The second step is to download Osmocom’s RTL-SDR library code. The third step is to build Osmocom’s RTL-SDR library. The forth step is to test the installation which is to connect RTL-SDR radio to a free USB port of the computer. The next step is to install gnuplot. The test mode of the receiver program requires gnuplot. The final step is to unzip and compile the receiver program.
The hardware of PECAS transmitter is the connected component. It consists of two transmitter which models are AUREL TX-4MDIL and AUREL TX-SAW MID/3V and a Raspberry Pi. The core component is an ON-OFF Keying modulate, which is employed to generate a sequence of ON/OFF periods in the channel. The transmission of the carrier wave can be controlled by setting the modulator’s data pin to a logical one/high or zero/low voltage level, which is controlled by a program running in a Raspberry Pi (RBPi). Both of two modulators operate at a central frequency of 433.92 MHz and their voltage and current levels are compatible with the RBPi capabilities. All components are powered and controlled from a RBPi throught the General-Purpose Input or output (GPIO) pins. Finally, the signal is transmitted by 433MHz helical antennas with 2.2 dBi gain [1].
The transmitter is designed to run on a Raspberry Pi, therefore a functional installation of the Raspbian operating system is required [12]. The transmitter program can be installed in Raspbian. The first step is to install the wiringPi library. The transmitter program uses the wiringPi library to gain access and control the GPIO pins of the Raspberry Pi to which the OOK modulators are connected. If the version of Raspbian include wiringPi by default, it is not required installation but ensuring the latest version of wiring Pi is installed in the system is necessary. The second step is to unzip and compile the transmitter program.
After installing the transmitter program and receiver program into the Linux system, the transmitter and receiver programs can be lunched in a similar way. The first step is to open a terminal. The second step is to change the directory to the folder where the transmitter or receiver program is. The third step is to configuration txt file.
The final step is to coordinating the transmitter and receiver. The first step is to select the desired values for the parameters of the transmitter’s configuration file. The second part is to launch the transmitter. The third step is to select the desired values for the parameters of the receiver’s configuration file especial the value of the ReceptionTime parameter. This indicates for how long the receiver will operate. The next step is to launch the receiver and select yes to start the receiver program. The receiver will start the warm-up phase and show the message. Once the warm-up phase is concluded, the transmitter can now be started. The receiver is sensing at present and ready to detect the transmitter’s activity. In the end, the programs will finish automatically after waiting for a reception time.
Checking real-time operation is also very significant in this method. Because the real-time operation of the transmitter or receiver program is critical to produce valid and accurate experimental data. If all sensing events were scheduled on time with a maximum error, which is lower than the selected sensing period and can be acceptable. If the warning message is displayed frequently, it means that the program is unable to operate in real-time, and the program should be tried to run in various platforms such as GUI or CLI which is shown in section 4.
The core operation in the Linux system is to open the receiver program with geany development software and find the core program named sense channel. Changing the code to realize the IED algorithm replacing CED algorithm is the main job after all the equipment can run successfully.
All programs can run normally at the terminal and the following figures are the display shown in the screen when running the function about sense channel.
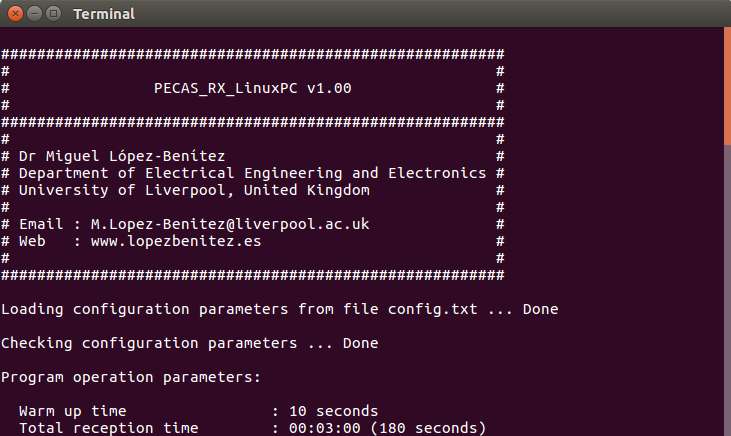
This is the name of the whole program. It showed the name of the developer, the version of the software and the personal information of the developer. At the beginning of the terminal, the program was loading the configuration parameters from the file. These parameters are preset before the debugging and testing work which was shown in the design part. All of these configuration parameters have been checked and has been displayed latter.
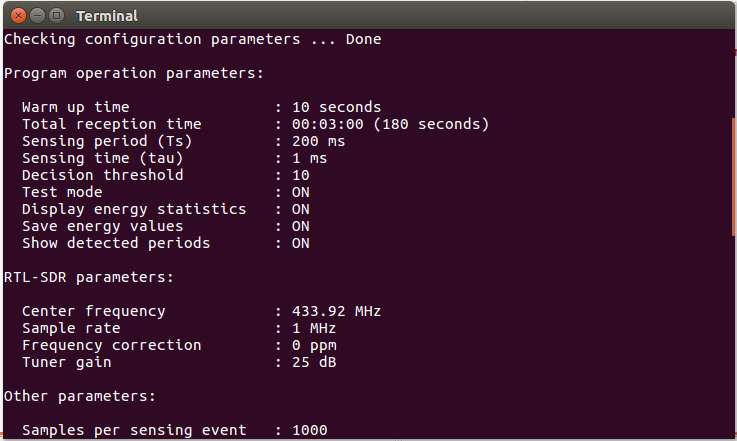
In this screenshot, it showed the program operation parameters before starting the energy detection. The parameters that warm up time, total reception time, sensing period sensing time and decision threshold are fixed without changes once it is set. The parameters that test mode, display energy statistics, save energy values and show detected periods can be changes between state ON and state OFF when the energy are detected. The second part is the RTL-SDR parameters. It shows the essential information about the PECAS receiver including the center frequency, sample rate, frequency correction and tuner gain. These parameters are also preset and need to be agreed with the hardware configuration.
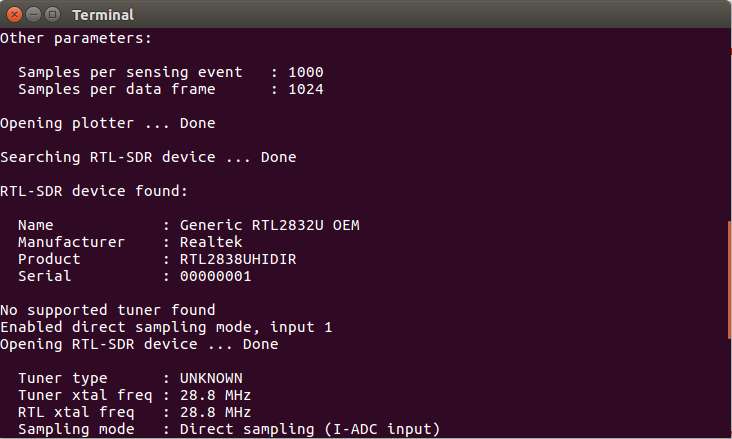
In this screenshot, it showed other parameters that the samples of each sensing event and samples of each data from. The next step was to open the plotter, it will draw the figures and shapes of the history of sensed energy values. The program entered into the process to search RTL-SDR. At present, the RTL-SDR hardware has been connected to the computer, and the device and relative configuration parameters of hardware were found. It displayed the detailed and specific information of the device including name, manufacturer, product and serial.
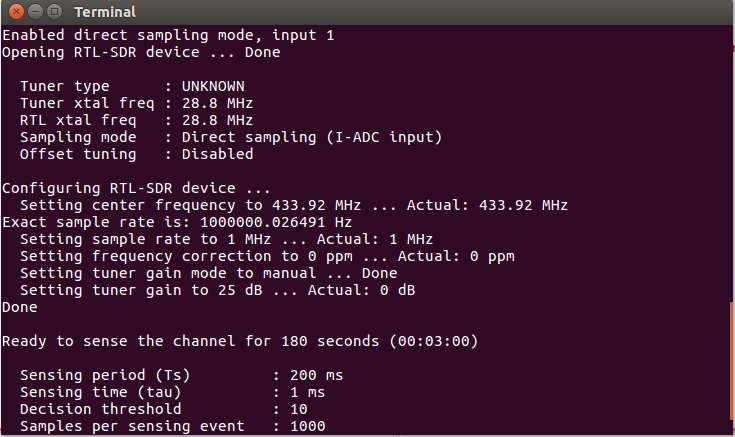
At the next step, the program opened RTL-SDR device and displayed the information about the tuner, including tuner type, tuner frequency, RTL frequency, sampling mode and offset tuning. After that, the program configured RTL-SDR device including set the center frequency, sample rate, frequency correction, tuner-gain mode and tuner gain. It also displayed the actual value of the device to guarantee the data availability. These configuration has been preset before loading from the configuration file.
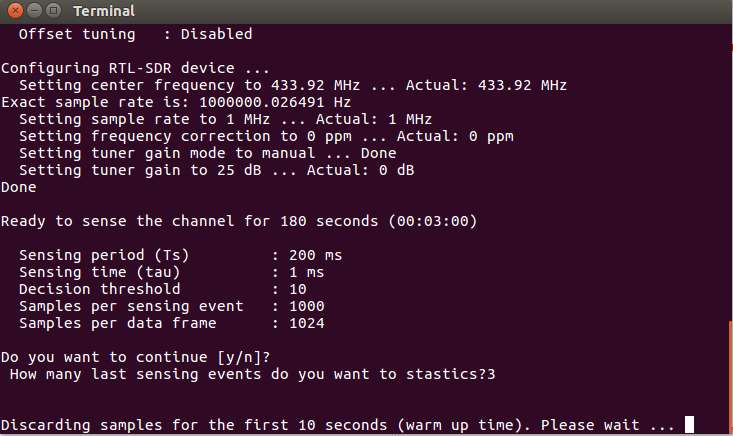
After configuring RTL-SDR device, the program is ready to sense the channel for 180 seconds (3 minutes). The parameters of sensing period, sensing time, decision threshold, samples of each sensing event and samples of each data frame were shown again to play the role of certification and emphasis. Then it is the process to decide whether the tester wants to continue the program to do the energy detection work. Y means to carry on the test and N means to stop the test and exist the program. Before discarding samples in the warm up time, the tester should decide the number of last sensing events he wants to statistics. After the warm up time, the program began to detect the energy and plot the image.
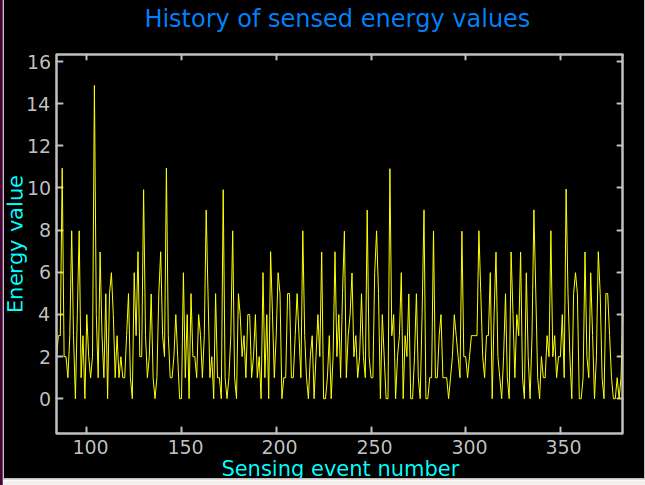
This is the image of the history of sensed energy values. The x vector is the number of sensing event. The range of the x-axis is from 0 to 1800. The y vector is the energy value. It shows the latest data at the right side of the screen with the time changes. The waveform is continuous but with a certain delay in fact. All the energy values are positive and can be analyzed.
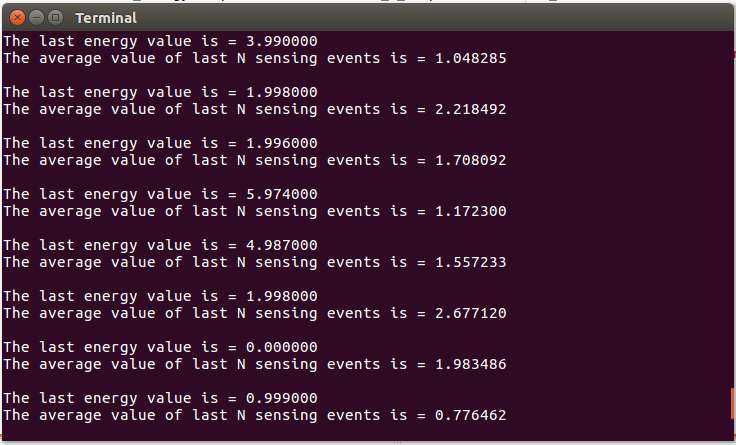
This is the screenshot when the program is running the energy detection work. It displayed the value of last energy and also displayed the average value of last N sensing events and N has been decided before. In fact, to reduce unnecessary program, which could cause the effects on the energy detection such as increasing the delay time or adding the instability factor like misdetections, these code of the function can be omitted. But the main function of it is to verify the correction of the calculation about the average test statistic.
After the program finished the test, all the data of energy values is saved in the file named ‘energy value.txt’. The results and images of one test is shown followed:
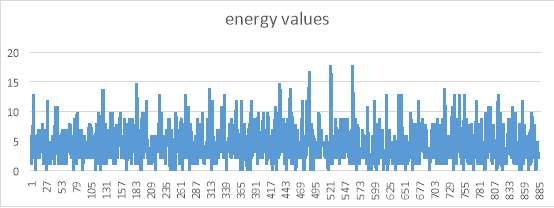
The x-axis is the number of sensing event, and the y-axis is the result of energy values. All the values are positive number and smaller than 15. Most of the values are concentrating between 0 and 10 in this test example.
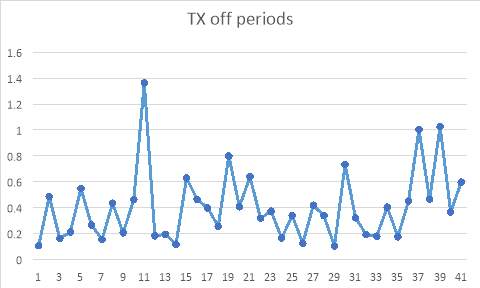
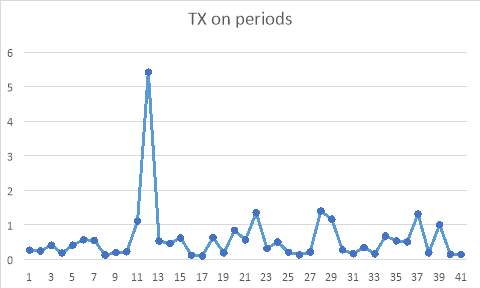
These two figures are the periods to display the periods in the output terminal of transmitter program. The above picture showed the periods when the mode of transmitter is off. The below picture showed the periods when the mode of transmitter is on. The horizontal line is the number of relative periods. The vertical line is the value of relative periods. When the mode of transmitter is on, the values of periods are range from 0 to 1.6. When the mode of transmitter is off, the values of periods are range from 0 to 6 and only one of the data is closed to 6, the rest of the data are range from 0 to 2.
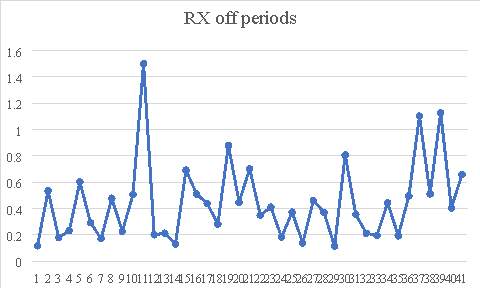
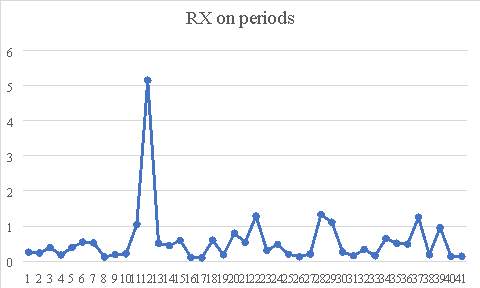
These two figures are the periods to display the periods in the output terminal of receiver program. The above picture showed the periods when the mode of receiver is off. The below picture showed the periods when the mode of receiver is on. The horizontal line is the number of relative periods. The vertical line is the value of relative periods. When the mode of receiver is on, the values of periods are range from 0 to 1.6. When the mode of receiver is off, the values of periods are range from 0 to 5 and only one of the data is over than 5, the rest of the data are range from 0 to 1.5. The results of these two figures are similar with the results in the transmitter program. The reason that shows the comparison of mode ON periods and mode OFF periods from the transmitter program and receiver program is explained in the followed part of discussion.
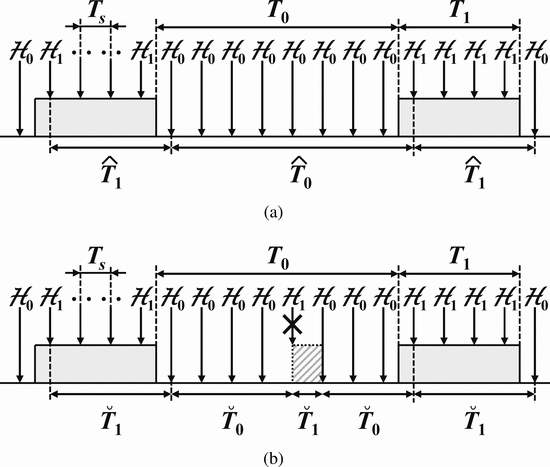
In the previous results of the CED methods, the estimation of the duration of the idle or busy periods of a channel based on spectrum sensing decisions has been illustrated [6]. Dynamic Spectrum Access/Cognitive Radio users sense the channel with a finite sensing period, which is shorter than the minimum period duration. In every sensing event, it made a binary decision on the idle for busy state of the channel. When it changes the observed channel state, the time interval elapsed since the last state change is computed as shown to make an estimation of the real period duration Formula for idle periods, and the individual period durations and the resulting statistics can be estimated within reasonable accuracy levels provided that spectrum sensing decisions are correct. A Perfect Spectrum Sensing scenario can be assumed if it is without sensing errors when the primary Signal-to-Noise Ratio at the DSA/CR receiver is sufficiently high. But an Imperfect Spectrum Sensing performance leads to some occasional sensing errors, which is under the condition of low SNR, which results in incorrectly estimated period durations. As is shown in the followed figure, an idle period may be observed as a sequence of three periods (idle-busy-idle) as a result of a false alarm. Similarly, a missed detection may result in a busy period being reported as a sequence of busy-idle-busy periods. Incorrect period durations Formula may lead to inaccurate estimations of the channel activity statistics. Therefore, the results of the IED methods can reduce the misdetection of CED methods.
In the part of results, the results about the periods detected respectively from receiver and transmitter have been shown. These data have been collected into the external independent file. The purpose to collect these data is that if the periods that collected from the receiver program can match the results that collected from the transmitter program, it means at the sensing periods, these two programs are running synchronously. According to the previous experiment in the CED methods, at the end of the transmission or reception, it computes the sample mean and variance of the idle periods observed at the receiver, and these values are used to estimate the parameters of the generalized Pareto distribution. The comparison between the experimentally estimated distribution and the actual distribution of the transmitted periods could be used to verify the correction of the program design.
But this experiment still has some errors when running the program. Firstly, when running the receiver program and the transmitter program at the same time, the signal cannot be timely and accurately transmitted and received. Secondly, there will be some unknown signal or unnecessary noise signal which will be received and have the influence on others sensing events and the test statistics. If these signals are received, the changes of decision threshold will be inaccurate and the results may be not matched because of this external error. Thirdly, when the program is running in the Linux system, other applications in the system will occupy memory space and delay the test statistics. This will cause the experiment not completely response the results of the energy detection as what is respected before the test. Thirdly, although the physical distance between the receiver and transmitter will have little effect on the test, there is a certain signal interference in the wireless communication.
The future experiment that could be carried is that calculate the standard deviation of the test statistics to find the degree of discretization of the test statistics. The next step can also be comparison between these values with the decision threshold and it can decide the output terminal. Or it can design the algorithm that can completely deal with the problems about the detection performance limitations. The algorithm should expand the signal formats and reduce the disturbance of the unknown signal to the experiment. In terms of hardware, if the transmitter can run the program with receiver in the same equipment or install the virtual software to replace the hardware to run the software, it will reduce lots of external interference factors when debugging and test the energy detection.
The perform of the project has basically reached the target in the description of the project specification. The program designed is able to develop the prototype to detect radio frequency signals and evaluate signals detection methods. But the difference is that the time cost at the process of installing the Linux system and installing the software and running it with the help of user guide is beyond expectation. Therefore, the time that design of the language program about detecting radio frequency and evaluating signals detection has been compressed. The design of the program is insufficiently detailed, and this could also could be improved in the future. In terms of the connection between the software and hardware to turn theory into reality, because the program ran in the disturbing environment and the time of tests is quite few, there is a gap between the ideal results and the experimental results. Making use of the changes of language programming and the update of the hardware to minimize systematic errors and accidental errors as far as possible is also needed to complete if the time is enough or the distribution of time is more reasonable. In the whole process of the project, the most important contribution is to make the algorithm of IED method into the design of language programming and connect the software and hardware to achieve the milestone of the completion of doing the experiment on hardware. It successfully reduces the misdetection of the energy of sensing events comparing to the CED method.
This report has presented the design and implementation of the language program of a prototype to detect radio frequency signals and evaluate signals detection methods in the area of wireless communication systems. It shows the future development if it is applied into the industrial market with strong competitiveness. The sensing-based approach with classical energy detection has shown significant advantages in the area of DSA/CR systems, and the method with improved energy detection can certainly ensure that it will widen the market of estimation of channel activity statistics because it makes up for defects of CED method. On the other hand, the existing methods [6-9] which is mentioned about the estimation of primary channel activity statistics is lack of sufficient realism and accuracy, so in the real-word this design of the method is desirable. This report also presents the theory of the project. It shows the important principle and formulas of the classical energy detection scheme, modified energy detection and improved energy detection. The purpose to put forward the theory of IED method to improved present scheme is also shown, including the main differences among these three methods. The main part of the project is the design of the language program. It shows the algorithm of the IED scheme and the original language programming design of IED. It also shows the configuration parameters of the whole project, including matching the hardware configuration and the related parameters used in the test. In this part, the algorithm of MED scheme and IED scheme are also shown and the main difference between them are also written. Then the design of the modified program and related screenshot has been clearly shown in the report. In case that if the code after changing cannot make the debugging and testing run successfully, the original code has been kept and turned into the comment. In the part of experimental method, it shows the operation about how to installing and running the software on Ubuntu in Linux system successfully. It also mainly told the process that how to coordinate transmitter and receiver, check real-time operation and recommendations for real-time operation. Although in the early period of time of this project, installing the software become the hard work, but with the help of user guide of PECAS and the rational use of wiringPi library [13] and Osmocom’s RTL-SDR library [14], all the difficulties have been solved before the design of the program. In the part of results and calculation, it shows the screenshots of the output terminal and the image of the history of sensed energy values. It also shows the results of the energy values after all the tests are finishes. The periods of mode ON and mode OFF are plotted as the line statistics for displayed and comparison. Then in the next part, it discusses the reason that comparison of these data, and the experimental errors and the further experiments that can help to improve the methods are also been shown. Whether the results meet the expected target of project performance or not is written and if the time is enough or the arrangement of the tasks is more reasonable, it will help complete more detailed and diversified experiments. The results will be more persuasive if the above statement put forward the hypothesis.
It has been confirmed that the improved energy detection can better solve the problem of detection performance limitations and reduce the misdetection of the original methods. This method can also provide a similar level without increasing the complexity and computational cost because of its general field of applicability. But there is still the potential and direction of improvement because of various errors and more ideal hypothesizes. In general, the project has been successful.
Cite This Work
To export a reference to this article please select a referencing stye below:
Related Services
View all


Related Content
All TagsContent relating to: "Information Technology"
Information Technology refers to the use or study of computers to receive, store, and send data. Information Technology is a term that is usually used in a business context, with members of the IT team providing effective solutions that contribute to the success of the business.
Related Articles

DMCA / Removal Request
If you are the original writer of this dissertation and no longer wish to have your work published on the UKDiss.com website then please: