Light Activated Molecules as Oxytocin Receptor Antagonists
Info: 14538 words (58 pages) Example Research Project
Published: 8th Jun 2021
Tagged: Biology
Table of Contents
SECTIONS PAGE
ABSTRACT ………………………………………………3
INTRODUCTION …………………………………………..4
- Oxytocin……………………………………………….4
- Oxytocin Receptor …………………………………………7
- Oxytocin Antagonist………………………………………..8
- Peptide Antagonists………………………………………8
- Nonpeptide Antagonists …………………………………..10
- Photopharmacology……………………………………….11
- Objectives and Hypothesis ……………………………………13
- Calcium Flux Assay……………………………………….14
METHODS ………………………………………………15
- Reagent Preparation ……………………………………….15
- Solubility Tests ………………………………………….15
- Photoisomerization Tests …………………………………….16
- Preparing Media ………………………………………….17
- Plating Cells ……………………………………………18
- Oxytocin Assay ………………………………………….19
- Oxytocin ……………………………………………20
- Antagonists ………………………………………….20
- RR007 …………………………………………..20
- MZ03D ………………………………………….22
- Microplate Reader and SoftMax Settings ………………………23
- Changes to Procedures ……………………………………..23
RESULTS ……………………………………………….24
- Solubility and Isomerization Results and Discussion …………………….24
- RR007 …………………………………………….24
- RR001 …………………………………………….29
- MZ03D …………………………………………….31
- Oxytocin Assay Results and Discussion ……………………………33
- RR007 …………………………………………….33
- MZ03D …………………………………………….35
ACKNOWLEDGMENTS………………………………………38
LIST OF FIGURES………………………………………….39
REFERENCES…………………………………………….55
Abstract
Light treated compounds were tested for the potential to effectively function as oxytocin receptor antagonists. Solubility and photoisomerization of three compounds were tested, but only two made it to biological testing. The compounds, named RR007, RR001, and MZ03D, are derivatives of a triazole oxytocin antagonist each with different functional groups. During photoisomerization, compounds were exposed to various wavelengths of light and evaluated using UV-vis spectroscopy wavelength scans. Biological activity was tested by comparing oxytocin activity in mammalian cells that overexpressed the oxytocin receptor in the presence and absence of a putative oxytocin receptor antagonist in both light treated and untreated conditions. Cells were treated with various concentrations of untreated compound or a light treated compound, in parallel with DMSO controls. Oxytocin binds to the oxytocin receptor, which initiates a series of reactions leading to an influx of Ca2+ in the cytosol. The Ca2+ mechanism of the oxytocin receptors was utilized to record activity by monitoring and recording fluorescence data. Solubility and photoisomerization tests suggested that compound RR007 precipitated out of aqueous solution over time, which made it an unreliable candidate for biological testing. Compound RR001 did not show evidence of photoisomerization when exposed to various wavelengths of light, therefore it never made it to biological tests. Lastly, MZ03D was the most soluble compound in aqueous solution, 300 μM in 5% DMSO, and was able to photoisomerize in aqueous solution when exposed to different wavelengths of light. Biological testing did show signs of inhibition for MZ03D in one test, but we were unable to repeat this, giving inclusive results. Future research includes plans to test other derivatives of these compounds.
Introduction
Oxytocin
Oxytocin is a circular peptide synthesized primarily within the paraventricular nucleus and the supraoptic nucleus of the hypothalamus. The peptide is released into circulation from the axonal projections located in the posterior lobe of the pituitary (5). Regulation of the release of oxytocin is critical for controlling the firing patterns of the oxytocin neurons when the peptide is transported into the dendrites. Oxytocin is composed of nine amino acids, including two cysteines that contain a disulfide bridge between one another (Figure 1). Ca2+, which causes smooth muscle contractions (6).
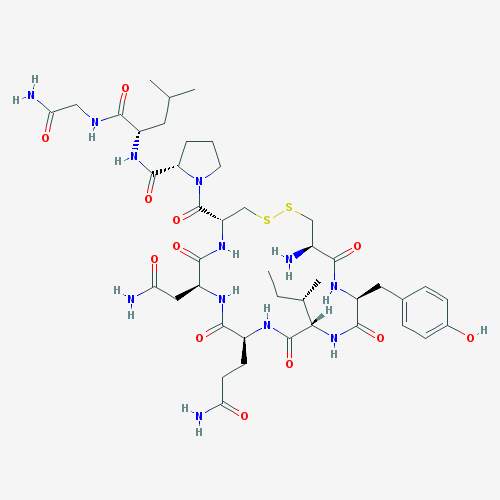
Figure 1. Chemical structure of oxytocin
Oxytocin released within the central nervous system has been involved in the regulation of reproductive, maternal, and affiliative behaviors, and is a critical component of stress response. Oxytocin released within the paraventricular nucleus and supraoptic nucleus appear to originate from dendrites and possibly somata. The dendritic oxytocin release plays a critical role in neuroendocrine regulation of oxytocin secretion into the circulatory system during lactation and parturition (7). Oxytocin released in the paraventricular and supraoptic nuclei is also critical for generating the pulsating pattern of systemic oxytocin secretion characteristic of lactation and parturition. It is understood that the oxytocin neurosecretory population becomes activated after a burst of firing causing oxytocin release (8).
There are many different mechanisms of release for pathways where oxytocin is present throughout the body. In women, such mechanisms include those involved in milk ejection, parturition, maternal behavior and stress. The best understood physiological function of oxytocin is its role as the endocrine effector of the milk-ejection response during lactation (9). The bursting of oxytocin neurons during lactation is initiated by somatodendritic oxytocin release within the supraoptic nucleus. Oxytocin binds to nearby oxytocin receptors located on neurons and causes a release of calcium. The calcium released could come from internal stores and create a feedback mechanism that prompts dendrites to release calcium within the supraoptic nucleus (9-11).
A common step in activation of the myometrium is oxytocin action in the uterus. One of the comparisons of preterm labor and term labor is the increase of oxytocin receptor concentration in the myometrium (12). Recent research also suggests a possible key role for oxytocin synthesized within the uterus as part of a paracrine system that could regulate myometrial contractility. One of the strategies to decrease the chances of preterm labor is to develop an oxytocin antagonist to block the oxytocin receptors that causes the premature myometrial contractions (13).
Aside from the most well-known role of oxytocin in parturition and lactation, it is also involved in the regulation of a wide variety of behaviors; both social and non-social, in men and women. Intracerebral oxytocin inhibits the stress-induced activity of the hypothalamic pituitary adrenal (HPA) axis responsiveness, suggesting an inhibitory effect of oxytocin on stress-responsive neurohormonal systems (14). An experiment done using human subjects showed both social support and oxytocin together resulted in the highest stress protective and anxiolytic effect (15). This suggests that oxytocin may be important in the role of positive social interactions and a lack of the peptide hormone could be associated with various social disorders. However, an increased concentration of oxytocin can also negatively affect social interactions. In a study done by Leckman et. al, patients with Obsessive Compulsive Disorder (OCD) were compared to patients with Tourette’s syndrome and healthy controls (16). They found increased cerebral spinal fluid oxytocin levels in the patients with OCD compared to the other two groups, but the elevation was only significant in a subgroup of patients without a personal or family history of tic disorder. They found that the oxytocin level correlated with the current severity of OCD symptoms in the non-tic related OCD group (17).
In men, oxytocin can be found in the corpus cavernosum and epididymis of the penis; however, binding to the oxytocin receptor in this region may affect contractility and subsequent ejaculation (8). Oxytocin also has a paracrine role in stimulating contractility of the seminiferous tubules and the prostate gland (18). Studies show that an abundance of oxytocin contributes to prostate cancer invasion and metastasis (19). Oxytocin does this by acting as an agonist triggering muscle contractions in the prostate gland. These findings suggest that treatment with oxytocin receptor antagonists may help to overcome the urinary problems in men with benign prostatic hyperplasia.
Oxytocin Receptor
Oxytocin is currently known to have only one human receptor, unlike vasopressin which has at least three different subtypes (8). The oxytocin receptor belongs to the rhodopsin-type family of G-protein coupled receptors and shares a high degree of sequence similarity to vasopressin receptor subfamily members V1a,V1b, and V2 (20). Previous studies determined that the residues
Arg34,
Phe103,
Tyr209, and
Phe284were important for ligand binding and selectivity at the human oxytocin receptor, including
Asp85and
Lys270are involved in receptor signaling. In a study done by Koehbach et. al., a mouse μ-opioid receptor crystal structure was used to develop a homology model of the human oxytocin receptor. Based on their model they determined oxytocin binds to a site within the transmembrane core region of the receptor (21). Oxytocin receptors are centrally expressed in regions throughout the brain and spinal cord including the hypothalamus, nucleus accumbens, amygdala and the ventral tegmental area (5). These receptors can be coupled to different G proteins which lead to different functional effects. For example, the Gq/phospholipase C (PLC)/inositol 1, 4, 5-triphosphate (InsP3) pathway is the major pathway that mediates the signal of the oxytocin receptor after oxytocin is bound. The binding of oxytocin activates Gαq/11, phospholipase C, which hydrolyzes phosphatidylinositol 4,5-bisphosphate (PIP2) to InsP3 and diacylglycerol (DAG) (22) (Figure 2). This series of cascades causes an influx of calcium into the cell leading to uterus smooth muscle cell contraction and increased nitric oxide production, which can lead to cardiomyogenesis, the formation of cardiomyocytes. Voltage-gated ion channels are also effected by the above cascade if coupled to a receptor. When oxytocin is bound it leads to membrane depolarization and the entry of extracellular Ca2+ into the cells, thus promoting smooth muscle contractility (Figure 2) (22).
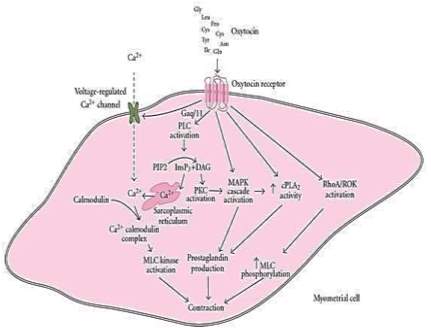
Figure 2. Oxytocin receptor linked signaling pathways resulting in myometrial contraction.
Oxytocin and oxytocin receptor expression is usually higher in females. The central roles of oxytocin on behaviors and physiology are dependent on steroid hormones and biological sex. Oxytocin and its receptor respond to changes in ovarian status, although these effects are species specific. As one example, oxytocin cell counts and the number of oxytocin immunoreactive axons tend to be higher in female mice than in male mice (23). A stimulus for oxytocin secretion into circulation is sexual activity, in mice, and orgasm in humans. Such stimulus is related to both males and females. Given the importance of brain oxytocin in social interactions, mating behavior is also likely to be a relevant stimulus in the intracerebral oxytocin system (24).
Oxytocin Antagonists
Peptide Antagonists
Most oxytocin antagonists are synthetic analogues that have structural similarities to the peptide structure of oxytocin. Due to the similarity of oxytocin to vasopressin, which differs only by two amino acids, Arg-8 and Phe-3, a major challenge has been to find selective peptide oxytocin antagonists that can distinguish between the two receptors. The most prominent oxytocin antagonist available to date is Atosiban ((1-Deamino-2-D-Tyr-(O-ethyl)-4-Thr-8-ornoxytocin), also known as Tractocile. Atosiban is an analogue of oxytocin that is modified at positions 1, 2, 4 and 8 of the parent molecule (Figure 3) (3). Atosiban has been shown to inhibit uterine contractions and delay preterm delivery. Intravenously administered, Atosiban has been established as an acute treatment of preterm labor (6). Unfortunately, because it is a peptide it requires constant infusion and is not suitable for long-term maintenance treatment as it is not orally bioavailable (25). In vitro studies show that Atosiban binds oxytocin receptors in the myometrial cell membrane and inhibits the oxytocin-induced increases of InsP3 and intracellular Ca2+, thus reducing myometrial contractility and leading to relaxation of the myometrium (26) (27). A trial done by Romero et. al demonstrated that Atosiban is superior to placebo control groups in delaying delivery for up to 7 days in preterm labor patients at ≥28 weeks gestation (28). Atosiban has also been recently shown to inhibit the production of prostate cancer cells. The antagonist does this by blocking the oxytocin-activated Gqpathway and inhibiting cell proliferation by activating the Gi-mediated pathway in DU145 cells, a human prostate carcinoma cell line that expresses the endogenous oxytocin receptor. Cell growth evaluation was determined through measurement of absorbance at 590 nm after MCDK cells, a canine kidney epithelial cell line, were fixed and stained with crystal violet (29).
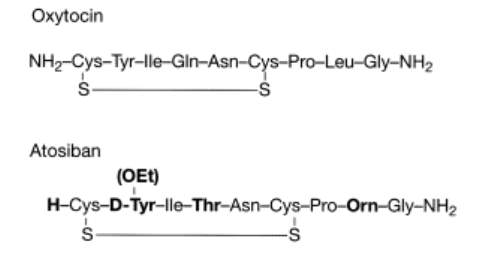
Figure 3. Structures of oxytocin and the oxytocin antagonist Atosiban, which is modified at positions 1, 2, 4 and 8 of the oxytocin molecule.(3)
Barusiban is a selective peptide oxytocin antagonist with a high affinity for the human oxytocin receptor and low affinity for the V1a receptor (Figure 4) (4). It has a higher potency and a longer duration of action than Atosiban. In contractility studies with isolated human myometrium done by Pierzynski et. al., Barusiban has the ability to inhibit myometrial contractility in both term and preterm tissues. It is also suggested that this peptide antagonist meets a comparable of potency as Atosiban (22,30). Reinheimer et. al. demonstrated that Barusiban’s longer duration of action and higher potency compared to Atosiban has pharmacokinetic and pharmacodynamic advantages for long-term treatment. A nonhuman primate model of pre term labor was used as the model for this research (31).
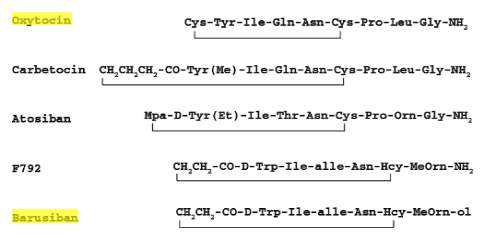
Figure 4. Structure of oxytocin antagonist Barusiban compared to structures of Atosiban and oxytocin.(4)
Nonpeptide Antagonists
There are a few other oxytocin antagonists that are not peptides; a popular one is Retosiban (Figure 5) (32). A recently published phase 2 proof-of-concept study used intravenous Retosiban for the treatment of spontaneous preterm labor, and it showed a favorable efficacy and safety profile (33). Retosiban is >15-fold more potent at the oxytocin receptor than Atosiban (Ki = 3.55 ± 0.52 nM) with a Ki value of 0.65nM. It has also been shown to be an effective tocolytic by IV and by oral administration in rats (6). Non-peptides such as Retosiban are small molecules, structurally not related to oxytocin. It is currently not established how the molecular structure affects signaling pathways. It is plausible that the tocolytic effects of peptide antagonists may differ from nonpeptide antagonists based on their different binding affinity and selectivity to oxytocin receptors and other receptors (34). Manning et al. reported that Retosiban is one of the only non-peptide oxytocin antagonists being developed by Glaxo SmithKline (35). Two other companies, Merck and Wyeth-Ayerst, reported several promising nonpeptide oxytocin antagonists. The most notable were L-368,899, L-371, 257 and WAY 1627720. Unfortunately, all three failed in clinical development for the treatment of premature labor, but they have been adopted for use in experiments to test possible therapeutic treatments. Such experiments include reduction of anxiolytic activity in mice and prevention of stretch-induced stimulation of human myometrial contractility (36-38).
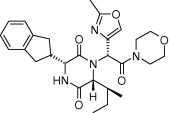
Figure 5. Structure of Retosiban(1)
Photopharmacology
Pharmacotherapy offers the possibility to cure diseases and alleviate symptoms through the administration of drugs (39). Photopharmacology works by shining light of a certain wavelength on a photoisomerizable drug, thus causing it to switch confirmations. Light seems to be an ideal external control element for in situ chemical and biological manipulation because it is generally noninvasive (at a range of wavelengths) and does not cause the contamination of the sample (40). Furthermore, the possibility of altering a drug’s activity with light can be useful as a research tool to study biological processes of enzyme activity, GPCR modulation, neural functioning, and channel protein characterization (41). Many strategies for the reversible photo-control of biomolecules have been explored with a wide variety of chromophores, a photo-switchable bioactive compound, commonly called a photoswitch. The photoswitches that are predominantly used for this purpose are azobenzenes and diarylethenes because their aromatic molecular structure allow for incorporation into most pharmacophores and pharmacophore spacers of drugs (39-41).
Diarylethenes are one of the most reactive systems in photochemistry and are highly promising for the preparation of light triggered switching devices. Their photochromic process consists of a ring closing and opening cyclic isomerization. The open-ring form is colorless, absorbing in the UV region, and the closed-ring form is colored. The open ring form exists in two conformations, parallel and antiparallel, with only the antiparallel form being photoreactive (2,41,42)(Figure 6).
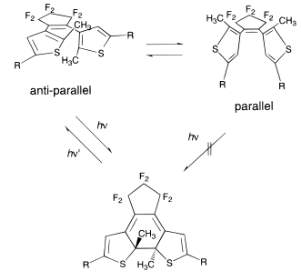
Figure 6. Example of Ring Closing Photoreaction of a Diarylethene.(2)
Azobenzenes form one of the largest and most studied classes of photochromic molecules that exist in two isomeric states, trans and cis (Figure 7). Azobenzenes remain the most widely used photoswitches in biological applications. The reasons behind this include their easy synthesis, relatively high photostationary states and quantum yields, fast photoisomerization, and low rate of photobleaching (40). All antagonists used in this project are azo-stilbene derivatives. Originally developed a century ago as dyes, azo-stilbenes are particularly notable for their facile and reversible trans/cis photoisomerizability. Typically, blue or near-UV light induces a trans to cis isomerization, which can be reversed with a longer wavelength light or by sitting at room temperature in the absence of light (43-45). A previous study was done with azo-combretastatin A4 (azo-CA4), and analogue of CA4, involving its cytotoxicity in human cancer cells following photoisomerization. Results showed azo-CA4 had a greater than 200-fold increase in cytotoxicity on human cancer cells than CA4 (43-45).
Objectives and Hypothesis
The objectives of this project were to develop and test light activated molecules that had potential to effectively function as oxytocin receptor antagonists. The three compounds studied were modeled after a triazole oxytocin antagonist in an attempt to resolve the problem of low aqueous solubility typically seen with biaryl triazoles (Figure 8). Compound 8A was chosen as the model because of its high selectivity over the related vasopressin receptors (46). Solubility and photoisomerization of three putative oxytocin antagonists were tested in aqueous solution, but only two made it to biological testing. In this project we hypothesized that our synthesized, light activated compound would bind with the oxytocin receptors as antagonists to block the oxytocin stimulated increase of
Ca2+in the cytosol at varying concentrations. We compared oxytocin activity using an untreated compound not exposed to light and a light activated compound, in parallel with DMSO controls. We also tested varying concentrations of the compounds.
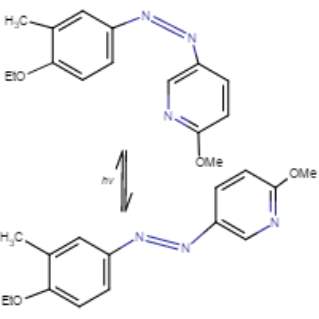
Figure 7. Conformational change from cis to trans of azo-stilbene putative oxytocin antagonist with light treatment. Marvin JS, v17.2.27.
8A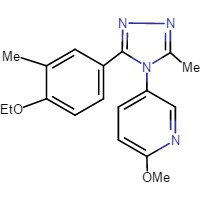 8B
8B 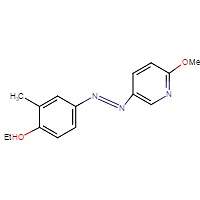
8C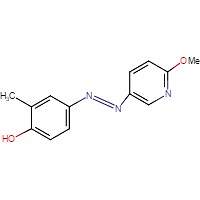 8D
8D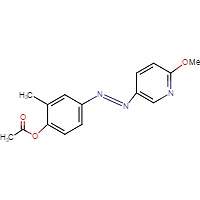
Figure 8. Chemical structures of triazol oxytocin antagonist A and antagonists modeled after it for this experiment: RR007 (B), RR001 (C), and MZ03D (D). Marvin JS, v17.2.27.
Calcium Flux Assay
Eurofins Ready-to-Assay™ Oxytocin Receptor Frozen Cells were used to monitor oxytocin stimulation and test for antagonist activity. Eurofin’s cloned human oxytocin expressing cell line was made in the Chem-1 host and contains high levels of recombinant oxytocin expression on the cell surface. The cell line also contains high levels of the promiscuous G protein
Gα15to couple the receptor to the calcium signaling pathway. Thus, the cell line is an ideal tool for screening for antagonist activity of the oxytocin receptor and its ligands (12). Support for this mechanism of action has been provided by
Ca2+measurement with fluorescent indicator dyes added to the Eurofins Ready-to-Assay™ OT Oxytocin Receptor Cells. In this assay, the cells were incubated with a wash free calcium sensitive dye, Fluo-8. After crossing the cell membrane, the lipophilic blocking groups of Fluo-8 are cleaved by an esterase, resulting in a negatively charged fluorescent dye that stays inside the cell. When Fluo-8 is bound to calcium, the fluorescence signal increases (47). The oxytocin was added to the cells and fluorescent dye after a 90 minute waiting period. When the cells are stimulated with oxytocin, the receptor signals the release of intracellular calcium, which when bound to Fluo-8 significantly increases the fluorescence. If a compound works as an antagonist, a decreased amount of fluorescence should be seen after stimulation with oxytocin compared to control cells not treated with antagonist.
Methods
Reagent Preparation (HHP Buffer)
We prepared a buffer consisting of 98 mL Hanks’ Balanced Salt Solution (HBSS), 2.0mL HEPES, and 0.071g probenecid at pH 7.4. The HBSS and HEPES solutions are sterile and were measured in the Laminar flow hood. The pH of the HBSS, HEPES, and probenecid buffer (HHP) was measured using the Fisher Scientific Accumet Research AR15 pH Meter. Before adjusting the pH of the HHP buffer, the pH meter was calibrated with buffers of pH 4, 7, and 10. We used drops of 0.924 M NaOH and a pasteur pipette to bring the buffer up to pH of 7.4.
Solubility Tests
Before any photoisomerization or experiments, tests were done to measure the solubility of the compounds in aqueous buffer compared to solubility in 100% DMSO. The 20 mM stock solution of RR007 was diluted into the appropriate amounts of HHP buffer and DMSO.
Example Calculation:
V1= M2V2M1
V1=(150μM )(300μL) 20mM
The amount of DMSO and compound volume divided by the total volume multiplied by 100 equals the overall percentage of DMSO desired for the solution. The compound, DMSO, and buffer were mixed in a centrifuge tube and the solubility was observed. The other concentrations of RR007 tested were 300 μM in 5% DMSO, 300 μM in 10% DMSO, and 150 μM in 10% DMSO all in HHP buffer. We received RR001 in a powder form, from the Streu lab, and made a 20 mM stock solution in 100% DMSO. Compounds RR001 and MZ03D were also tested for solubility using the methods above. The concentrations of RR001 tested for solubility were 500 μM and 133 μM both in 10% DMSO. We received 10 mM of MZ03D, from the Streu lab, in 100% DMSO. The concentrations tested were 150 μM, 200 μM, 300 μM and 500 μM all in 5% DMSO. Phosphate buffered saline (PBS) was used in place of HHP for some photoisomerization tests with compounds RR007 and MZ03D to compare our results to a collaborator.
Photoisomerization Tests
The compounds were also tested for the ability to switch confirmations after being exposed to various wavelengths of light. Solutions of the compounds in aqueous buffer and in DMSO were used for isomerization tests. UV-vis spectra were obtained using a Varian Cary 50 Bio UV-Visible Spectrophotometer (Ultra Violet UV-Vis UV/Vis). The machine was blanked prior to scanning and 200 μL of antagonist solution was loaded in a 0.3mm quartz cuvette. An initial scan of the antagonist solution was taken before exposure to any light. After the initial scan, the light tests were performed using 400 nm, white light, green (530 nm) light, blue (465nm) light, room light and 365 nm light. Two red flashlights were also used a Smith & Western, labeled S&W, and an Energizer Construction Headlamp, labeled small. The cuvette with antagonist solution was put in a cuvette holder with the selected light and exposed for 2 minute increments. The set up was covered with aluminum foil to avoid exposure to room light. The cuvette, with sample, was scanned immediately following light exposure. Multiple light tests were done using different wavelengths of light and time increments also varied for all three compounds: RR007, RR001, and MZ03D.
Preparing Media for Cells
Cell media was prepared containing 500 mL of DMEM with 4.5 g/L glucose, 50 mL of heat inactivated fetal bovine serum, 5 mL of 100X nonessential amino acids, 5 mL of 100X HEPES at 1 M, and 2.5 mL of 50 mg/mL geneticin (G418) (0.25 mg/mL final concentration). The geneticin was sterile filtered before addition to the media. All media components were measured in the Laminar flow hood to prevent chance of contamination. Prior to each experiment, the exteriors of the stock bottles, pipets, and flow hood surface were disinfected with 70% ethanol. Sterilized tips were used when measuring smaller amounts. Media components were added together in the DMEM bottle, labeled, and stored in the refrigerator.
Oxytocin Receptor Frozen Cellswere ordered from Eurofins Scientific and stored in liquid nitrogen. The original cell concentration is
2 x 10⁶cells/mLin DMEM, 20% fetal bovine serum, 100 U/mL penicillin and streptomycin, and 10% DMSO. One vial of cells was taken out of the liquid nitrogen (using cold gloves) and quickly thawed in a 37° water bath. Prior to opening, the exterior of the vial was sterilized using 70% ethanol to reduce contamination.
Plating Cells for an Experiment
The cell culture was started from frozen stock 2 days before the oxytocin stimulation tests. The cell stock was aliquoted into a 25
cm2flask with 8 mL of media and allowed to grow overnight in the 37°C humidified, 5%
CO2incubator. The HHP buffer, trypsin, and media were pre-warmed in a 37°C water bath 1 hour prior to plating. The flask with cells was removed from the 37°C humidified, 5%
CO2incubator and the exterior wiped with 70% ethanol prior to placing it in the Laminar flow hood. The media was removed using a vacuum and 1 mL pipette. To prevent vacuuming the cells, the pipette was pointed towards the opposite direction of where the cells were plated in the flask. Then, the cells were washed with 8 mL of Phosphate Buffered Saline (PBS). The PBS was removed and 3 mL of trypsin was added to lift the cells from the wall of the flask. The flask was put in the incubator 37°C for 8 minutes until the cells were released. After the incubation period, 10 mL of media was added to the cells to neutralize the trypsin. The solution was transferred to a sterile 15 mL conical vial and centrifuged using an International Clinical Centrifuge Model CL for 4 minutes on level 6. The supernatant was removed with a vacuum and suspended in 3 mL of media. Finally, we counted the cells to dilute the stock solution to a desired concentration of
2.5 x10⁵cells/mL.
To count cells, 10 μL of the 3 mL cell stock solution was injected into each side of a hemocytometer. The hemocytometer was placed under a microscope and both compartments were counted. The number of cells was averaged to get the approximate concentration of cells in the stock solution. Next, we calculated the volume needed to dilute the stock solution to our desired concentration.
The calculated volume of cells was added to the remaining amount of media needed to bring the volume up to 6 ml. The total volume is 6 ml because that would be enough to pipette 200 μL of cells into 30 wells on a 96 well plate, allowing us to have extra solution. The new solution was mixed in a sterile 15 ml conical vial. Then, using sterile pipet tips, 200 μL of the cell solution was pipetted into each well (24 wells total). For plating we used a 96 sterile well black fluorescent plate. To ensure even plating, the cells were left to sit for 30 minutes before moving the plate to a humidified 37°C, 5%
CO2incubator for 24 hours. The remaining cells were killed using Vesphene disinfectant cleaner. Cell plating procedure was done in the Laminar flow hood to decrease chances of contamination.
Example Calculations:
V1= M2V2M1
V1=(2.5 x10⁵cells/ml)(6 ml cells+media) Average x 104 cells/ml
Oxytocin Assay
After the 24 hour incubation, the assay plate was removed from the incubator and washed with PBS to remove all trace of media components. To empty the wells of PBS, the plate was dumped in the sink after each wash and patted dry to ensure all of the liquid was removed. Each well was washed twice using a multichannel pipette, adding 200 μL of PBS per well. The Fluo-8 AM was prepared by dissolving 50 μg (one tube) in 10 μL of DMSO. Once dissolved, 10 μL of Fluo-8 solution was mixed into 5 mL of the HHP buffer and mixed in a 15 mL conical vial. The vial was wrapped in aluminum foil, to protect it from light exposure, until it was ready to pour into a reagent reservoir. Once in the reservoir, 50 μL per well was pipetted into the wells with cells in the assay microplate using a multichannel pipette. The plate was covered with aluminum foil and set aside to incubate at room temperature for 90 minutes. During the incubation, we prepared the oxytocin and antagonist solutions.
Oxytocin
A balance was used to measure 0.001 g of oxytocin on weigh paper. The oxytocin was combined with 1 mL of water (DNase and RNase free). Once dissolved, we prepared 20 μL aliquots of
1 x 10⁻³ Moxytocin which were stored in a -20°C freezer. Prior to cell experiments, an aliquot of oxytocin was taken out of the freezer and thawed on ice. A 1:100 dilution with the
1 x 10⁻³ Msolution was added to HHP buffer (10 μL oxytocin solution and 990 μL HHP buffer). The now
1 x 10⁻⁵ Mwas diluted 1:10 (100 μL oxytocin solution and 900 μL HHP buffer) to get a
1 x 10⁻⁶ Msolution. All of the solutions were prepared in separate microcentrifuge tubes and stored on ice until use.
Antagonist
RR007
Two compounds, RR007 and MZ03D, were used to test for oxytocin receptor antagonist activity. First, a 20 mM stock solution of compound RR007 was used to prepare a high concentration (200 μM in HHP buffer with 5% DMSO) and low concentration (100 μM in HHP buffer with 5% DMSO) for the pre-plates. The high concentration was prepared with 20 μL DMSO, 5 μL compound, and 475 μL HHP buffer. The low concentration was prepared with 22.5 μL DMSO, 2.5 μL compound, and 475 μL HHP buffer. Both solutions were prepared in microcentrifuge tubes and covered with aluminum foil to prevent exposure from room light. To increase solubility, it is also important to add the DMSO to the tube first, then add the compound and mix. The buffer was added immediately before pipetting into pre-plates to reduce solubility issues. To set up antagonist solutions, we used two clear 96 well plates, one for light treatment and one without treatment. We pipetted the 200 μM antagonist solution into two wells side-by-side on each pre-plate. A 600 μL of 5% DMSO and HHP buffer control was prepared and pipetted into two wells on each pre-plate next to the wells containing the 200 μM solution. The 100 μM antagonist solution was also pipetted into two wells per plate next to the control (Figure 9). We pipetted 120 μL of each solution into the wells of the pre-plate and covered both plates with aluminum foil. The final concentrations of antagonist solutions in the experimental plate were 100 μM and 50 μM both in HHP buffer with 2.5% DMSO. One of the pre-plates was treated with 400nm light for 2 minutes about 20 minutes prior to the fluorescence reading. We added 50 μL of each solution to the experimental plate, using a multichannel pipette, 15 minutes prior to reading. During the 15 minute antagonist incubation, the experimental plate was gently mixed using a light swirling motion. The plate was covered in aluminum foil to prevent exposure from room light. Afterwards, the untreated treated solutions were added to the first 6 wells in rows A and B of the assay plate. The light treated solutions were added to the remaining 6 wells in rows A and B of the assay plate. After the 15 minute incubation we placed the assay plate into the holder on the outside of the fluorescent microplate reader. The microplate reader used was a Molecular SpectraMax M2/M2e Multimode Microplate Reader, with SoftMax Pro Software. Immediately before pressing the “Read” button, 11μL of the 1 x 10⁻⁶ Moxytocin solution was only added to row A of treated cells using an electronic multichannel pipette. The final concentration of oxytocin in row A was 1 x 10⁻⁷ M, Cells in row B were operating as a control and were not treated with oxytocin.
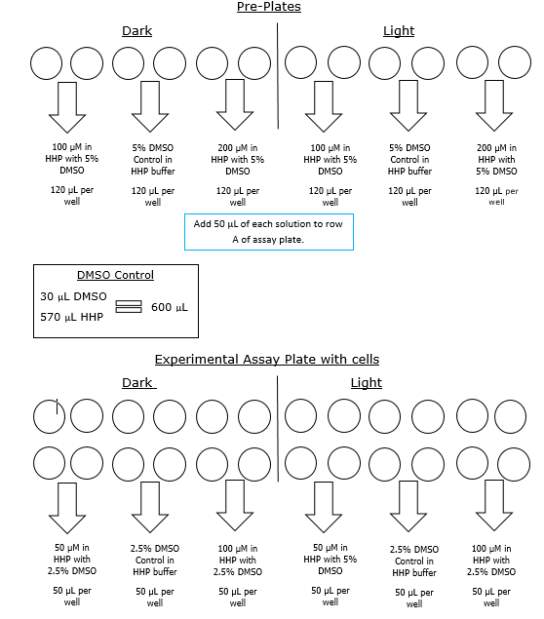
Figure 9. Example of pre-plate set up and experimental plate set up including final concentrations and DMSO control
MZ03D
The acetylated compound (MZ03D) was also used. A 10mM stock solution of compound MZ03D was used to prepare a high concentration (300 μM in 5% DMSO) and low concentration (150 μM in 5% DMSO) for the pre-plates. The high concentration was prepared with 25 μL compound, and 475 μL HHP buffer. The low concentration was made with 10 μL DMSO, 15μL compound, and 475 μL HHP buffer. Both solutions were prepared in microcentrifuge tubes and covered with aluminum foil to prevent activation from room light. The same procedures used previously to set up the pre-plates and assay plate were used for this compound as well. One will note that the concentrations for MZ03D were different than RR007 so adjustments were made accordingly. The final concentrations of antagonists in the experimental plate were 150 μM in 2.5% DMSO and 75 μM in 2.5% DMSO. The final concentration of oxytocin was 1 x 10⁻⁷ M.
Molecular SpectraMax Microplate Reader and SoftMax Settings
The wavelength settings within SoftMax were 490nm for excitation and 525nm for emission. The settings for the photomultiplier tube (PMT) and optics were 6 flashes per second. The spectra scanned for a total of 5 minutes with scans every 11 seconds with only one shake between reads.
Changes to Procedures
Changes to the procedures were made multiple times to acquire optimal results. During one experiment, we doubled the volume of Fluo-8 solution on the cells from 50 μL to 100 μL, which decreased the concentration of the Fluo-8 solution by half. In later experiments, we increased the concentration of Fluo-8. Instead of adding 5 μL of solution to 5mL of buffer, we added 10μL of solution to the buffer. This procedure continued for the duration of the experiment. The concentration of Fluo-8 was doubled again for assay tests with MZ03D. The volume of buffer was decreased to 2.5 mL with the addition of 10 μL of Fluo-8 solution. The concentration of oxytocin was also changed to a 2 x 10⁻⁶Msolution by doing a 1:5 dilution with the 1 x 10⁻⁵ Msolution.The results of these experimental changes will be discussed below. Two experiments were done using compound MZ03D. The concentration used in the first experiment was 500 μM and 200 μM in HHP buffer with 5% DMSO prior to adding the solution to cells. The second concentration used is described in the procedures above. The cuvette holder within the Varian Cary 50 Bio UV-Visible Spectrophotometer was changed and replaced with a 3D printed cuvette holder for one test with RR001 (Figure 10) . This cuvette had openings on all sides allowing the compounds to be exposed to light during scans.
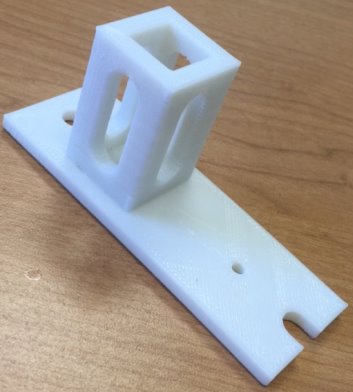
Figure 10. Picture of 3D printed open sided cuvette. Printed by directed research student Maxwell Madden
Results and Discussion
Solubility and Photoisomerization
RR007
The highest concentration that we were able to get RR007 into aqueous solution was 300 μM in HHP buffer with 5% DMSO. The solution initially looked homogeneous; however, the results show a constant decrease in absorbance, which suggested the compound precipitated out of solution. Prior to solubility tests in aqueous buffer, tests were initially done in 100% DMSO.
Compound RR007 was diluted to 150 μM in 100% DMSO solution and treated with two different flashlights, both 400nm, and a flashlight emitting white light. RR007 was treated with 400nm light for 2 minutes causing the absorbance to decrease which suggested a change in conformation from trans to cis (Figure 10A and 10B). The graph reports that white light is capable of reverting the compound back to the trans form as indicated by an increase in absorbance. The test with white light was to observe the effect the overhead light in the lab would have on the compound. Since it showed that white light could cause reversion of RR007, the compound should be covered with aluminum foil or shielded from the light. These results also show that two different 400 nm flashlights have the same effect on the compound and can be used interchangeably upon further testing. RR007 was observed to remain in the cis form when left in the dark for up to 15 minutes in 100% DMSO (Fig 11Aand 11B).
As the previous photoisomerization tests were done in 100% DMSO, biological tests presented variable results. Thus, we decided to do photoisomerization tests with light treated and untreated RR007 in aqueous buffer. The same concentration of RR007, 150 μM, was tested in HHP buffer with 4.25% DMSO which revealed a steady decrease in absorbance over time (Fig. 12A). The initial scan of RR007 showed the compound mostly in the trans form. After exposure to 400nm light, the compound decreased further in absorbance. There could be multiple reasons why this decrease in absorbance happened. The compound could have precipitated over time causing the decrease in absorbance or the compound could be stable in only one conformation. One can observe, after being left in the dark for 30 minutes, more of the solution appeared to be decreasing in absorbance. The molecules did not appear to revert back to the trans formduring the 30 minutes left in the dark without light treatment. In Figure 12 B, RR007’s activity was tracked over a 25 minute lapse in the dark. RR007 constantly decreased in absorbance without the assistance of 400nm light. After 20 minutes the compound appeared to be stable in the state of decreased absorbance which can be observed since the absorbance did not continue to decrease after exposure to 400nm light. It was hypothesized that the cis conformation was more soluble in aqueous solution, which caused the trans form to switch by itself. It is also a possibility that the trans form was not soluble in aqueous buffer and precipitated out of solution. Further tests were performed to try to determine what has happening.
Figure 13 shows compound RR007 300 μM in 5% DMSO after 10 minutes in the dark and exposure to room and white light. After 5 minutes in the dark, the compound was observed to decrease in absorbance without exposure to 400nm light. RR007 continued to convert after 10 minutes and showed to be incapable of reversion to the trans form after white light and room light compared to tests in 100% DMSO. This test was done in buffer containing HBSS and HEPES, without the addition of probenecid. The probenecid was not added to the buffer to test whether or not it was reacting with the compound in a negative way, causing it to fall out of solution. However, the compound continued to decrease in absorbance without exposure to 400nm light. The inability for the compound to revert back to the trans form after exposure to white light suggested that the compound fell out of solution. During the experiment, a change of color from pale yellow to clear was observed by eye over time.
An initial scan of compound RR0007 150 μM in PBS with 10% DMSO was taken, then allowed to sit in the dark for 10 minutes with scans were taken in 1 minute increments. After the 10 min. period, the sample was exposed to green and blue light while mixing. RR007 still showed a constant decrease of absorbance in the dark. Exposure to green and blue light failed to revert the compound back to the trans form. Mixing did not impact results (Fig 14A). The absorbance of compound RR007 decreased faster than previously when it decreased steadily every 5 minutes instead of every minute (Figure 12B). Graph B shows another test without the sample sitting in the dark. Instead a 400nm light test was done immediately after the initial scan. The absorbance decreased dramatically, suggesting a switch in conformation from the trans to cis form. The sample was exposed to blue light and room light which showed a favorable response of the reversion of RR007 back to the trans conformation. 365nm light was used on the sample which decreased its absorbance, making it comparable to the 400nm curve. Green light was also used to revert RR007 back to the trans form, but the absorbance was observed to be higher than the initial scan. There was no evidence of precipitate during the tests.
In summary, graph 14A presented the compound precipitating out of solution. However, when exposed to 400nm light immediately after preparation, the compound switched conformations. Testing after immediate preparation ensures the homogeneity of the solution since it is thoroughly mixed. The effect of green and room light caused the absorbance to increase past the absorbance of the initial scan. The compound may not have been 100% in the trans form prior to scanning.
A new sample was diluted to 75μM in the next experiment to attempt to increase the solubility of compound RR007. In the next test, RR007 (75 μM in PBS with 10% DMSO) was exposed to 400nm light immediately after it was put into aqueous solution, based on results from the previous experiment, which caused the absorbance to decrease (Figure 15A). PBS was used instead of HHP buffer to remove the possibility that the HHP buffer was the cause of insolubility. We also used PBS in order to compare our results to a collaborator’s results. One will also notice the initial absorbance was approximately half what it was in Figure 14 which was expected with the decrease in concentration. After treatment with 400nm light, the sample was exposed to green light which increased the absorbance, showing a partial reversion of conformation from cis to trans. The sample was exposed to blue light slightly decreasing the absorbance, but still keeping the sample mostly in the trans form. The sample was exposed with 400nm light again, switching the conformation to the cis form. After the red light test, the curve shifted upwards, but the shape was similar to the 400nm light curves. It was hypothesized that after exposure to red light the compound would to revert back to the trans form, but it had the opposite effect. The sample was exposed to 400nm light again which decreased the absorbance. At the end of the tests the sample was still yellow, so the compound still appeared to be in solution.
A new sample of 75 μM RR007 in PSB with 10% DMSO sat in the dark for 3 minutes (Figure 15B). The graphs shows a constant decrease in absorbance during the 3 minute time lapse. RR007 was exposed to red light decreasing the absorbance slightly. Exposure to green light appeared to have shifted the curve slightly, but the shape looks similar to the red light curve. It did not drastically increase in absorbance as shown in Graph 15A. When exposed to red light again, the absorbance stayed relatively the same. During this test, the sample appeared to be less yellow than the previous experiment. We also observed precipitate after the 3 minute period without light exposure, which implies the compound precipitated out of solution. The results of this test were similar to those in Figures 14A and 12A that also showed the compound precipitating out of solution.
During the last tests, a new sample of 75 μM RR007 in PBS with 10% DMSO immediately was exposed to 400nm light after being put into buffer (Figure 15C). The absorbance decreased and the sample was next treated with red light. The red light curve and 400nm curve were similar in absorbance and shape suggesting the red light may not have an effect. The sample was treated with green light which increased the absorbance, similarly to Graph A. A final red light test was done on the sample which caused a decrease in absorbance. Throughout the last experiment, the sample remained a yellow color similar to the sample from Graph A. The absorbance observed in Graph C when the compound was exposed to green and blue light suggests that there is a mix of the trans and cis conformation. If the compound reverted completely, the absorbance would be the same as the initial scan.
Collectively, RR007 was not able to stay in aqueous buffer as seen with a constant decrease in absorbance in the absence of light treatment. If left in the dark for a short amount of time prior to light exposure, the absorbance decreased and did not increase after exposure blue or green light. The evidence suggests that that cause of this occurrence is the compound precipitating out of solution. However, when exposed to light immediately after preparation, the compound is able to isomerize with 400nm light without precipitation. Lowering the concentration of RR007 to 75 μM had no significant effect on the results.
RR001
The removal of an ethyl group was hypothesized to lead to a compound with greater aqueous solubility (Figures 8B and 8C). However, the highest concentration that we were able to get RR001 in aqueous solution was 133 μM in HHP buffer with 10% DMSO. Even though the UV-vis scans showed there was a compound present and soluble, we also saw evidence of some precipitate.
UV-vis spectra were also taken during light treatments of compound RR001 (Fig.16A and B, and C). Graph A, with 300 μM compound in PBS with 10% DMSO, shows very minimal changes in absorbance during various light tests. After the 400nm and 365nm light exposure, the absorbance appeared to decrease slightly. When exposed to white light and blue light, the absorbance of RR001 increased beyond the absorbance of the initial scan. One can also observe a slight peak between 600-650nm. The graph showed small changes after exposure to different wavelengths of light; however, nothing caused a significant difference in conformation. Precipitate was observed in 300μM in PBS with 5% DMSO solution after treatment with 465nm light (Figure 16A).
To attempt to keep the compound in solution we made a new sample of 133 μM. Graph B showed spectra for 133μM in PBS with 10% DMSO and there is no evidence of fluctuation in absorbance after any light test. The 133μM sample of RR001 did not completely dissolve in aqueous solution, particles were observed floating in the solution prior to pipetting. Over time the precipitate settled at the bottom of the cuvette.
Graph C shows spectra for 133μM in PBS with 10% DMSO, which appeared to have interference (noise) within the spectra. The scans were taken using a 3D printed cuvette holder allowing light to be exposed on all sides of the cuvette for the duration of the tests (Figure 10). We hypothesized the constant exposure to 400nm light would allow for the cis conformation to be captured. Despite new methods, the absorbance did not change from the initial scan. The graph shows a shift in the curve, but it retains the same shape as the other curves. The shift in the curve was most likely caused by the minor changes of the position of the cuvette holder, which was not as tightly held in place as the original cuvette holder. The absorbance shown in the graphs suggest that the compound was in solution, but during tests precipitate collected at the bottom of the cuvette. The switching of the conformation may not have been caught by the UV-vis scan because the switch reverted back quickly. However, this was not supported by the tests with the new cuvette holder.
Unfortunately, because RR001 never showed evidence of photoisomerization it did not make it to biological testing. Throughout the tests for this compound, there was evidence of precipitate in all of the solutions. Exposure of the compound to any wavelength of light also did not show evidence of photoisomerization.
MZ03D
The addition of an acetyl group in place of the alcohol in RR001 was hypothesized to increase solubility as well (Figure 8C and D). The highest concentration that we were able to get MZ03D in aqueous solution was 300 μM in HHP buffer with 5% DMSO. MZ03D showed no signs of precipitate accumulation, remained homogeneous throughout the project, and was the most soluble of the three compounds in aqueous solution.
An initial scan of compound MZ03D (150 μM in PBS with 10% DMSO) was completed prior to exposure to 400nm light (Figure 17A). The 400nm light caused the absorbance to decrease, but the shape of the 400nm curve was not similar to those from compound RR007 (Figure 15C). The shape of the curve for RR007 looks to be half of the absorbance for the curve of MZ03D, but this could be due to the difference in concentration. The green and blue light treatments on MZ03D after 400nm light treatment caused the absorbance to increase half way. One can assume both conformations of the compound are likely present. Another 400nm light test was done and the curve lines up with the red light curve supporting red light had no effect on the compound as there was no definite change in absorbance. This absorbance curve was much higher than the 400nm curves of RR007 suggesting both conformations of the compound may be present (Figure 15C and 17A). There are also a noticeable peaks at 280 nm which was expected to be the excitation wavelength of the carbonyl located on the MZ03D compound, absent from the other two compounds.
The next sample of MZ03D (300 μM in PBS with 10% DMSO) was allowed to sit in the dark for a 20 minute period to observe if there was a change in absorbance with time similar to the previous experiment with compound RR007 shown in Figure 14A (Figure 17B). The absorbance did not shift within the 20 minute lapse, but decreased when exposed to 400nm light for 2 minutes. Compared to the results of RR007, MZ03D did not fall out of solution while sitting in the dark which is important during the 15 minute incubation for the oxytocin experimental assay. MZ03D was exposed to 400nm light a second time for 5 minutes and showed a small decrease in absorbance. Both green and blue light caused an increase at about 50% of the initial scan inferring both trans and cis conformations are still likely present. White light treatment had an identical curve as the green and blue light curves. When the compound was exposed to 254nm light, the absorbance decreased and the shape of the curve looked similar to the 400nm curve.
The last sample of MZ03D (300μM in HHP buffer with 5% DMSO) was allowed to sit for 20 minutes in the dark; however, the absorbance increased slightly above the absorbance of the initial scan (Figure 17C). This unusual occurrence may have been an error from moving the cuvette holder causing a shift in the curve. The shape of the curve was the same as that of the initial curve implying a similarity. After the 20 minute period, the compound was exposed to 400nm light which decreased the absorbance, but not as much as seen with 400nm light treatment with compound RR007 (Figure 15C). After the exposure, the sample sat in the dark for another 15 minutes which did not affect the absorbance suggesting no reversion back to the trans form. The blue and green lights caused the absorbance to increase partially to the absorbance of the initial scan. Throughout the tests, each of the samples remained yellow and did not form precipitate.
In summary, MZ03D had the highest level of solubility out of all three compounds. MZ03D was able to switch between conformations when exposed to 400nm, blue light (465nm), and green light (530nm) wavelength without an impromptu decrease in absorbance. However, the curve of the 400 nm light test did not decrease as drastically as it did with compound RR007. This suggest that both cis and trans conformations were present in solution. These promising results allowed MZ03D to move into biological testing.
Oxytocin Assay Results and Discussion
RR007
As outlined in the methods, Eurofins Ready-to-Assay™ OT Oxytocin Receptor Cells were engineered by the company to overexpress the oxytocin receptor on the cell surface. In the assay, the cells are preloaded with Fluo-8 which binds to calcium upon stimulation of the receptor with oxytocin. When the receptor is bound to oxytocin, the fluorescence will rapidly increase as Ca2+ enters the cytoplasm. However, in the presence of antagonist, Ca2+ entry will not occur resulting in no change in fluorescence.
The goals of the assay were to evaluate the ability of oxytocin receptor antagonists to block oxytocin from binding to the receptor through biological testing. Throughout the duration of the experiment, we were often unable to catch the full fluorescent curve. Timing the start of the microplate reader was a challenge because it was done manually. Manual operation contributed to the loss of time which was needed to capture the beginning of the oxytocin response. A major challenge was achieving a full oxytocin stimulation curve. However, we attempted to troubleshoot these challenges to produce better outcomes.
Graph 18 shows the fluorescence measurements of the dark compound (untreated) scattered about the graph. The untreated 5% DMSO controls appeared to have a high fluorescence measurement. A well containing untreated 100 μM (2) had a higher fluorescence count than the untreated controls, and the 100 μM (1) had a similar measurement. The treated 100 μM RR007 had a high fluorescence similar to the controls as well. The wells containing untreated 50 μM RR007 (2) and both treated 50 μM RR007 had the lowest fluorescence counts. Both treated 5% DMSO controls had fluorescence measurements around -30 RFU, compared to the untreated controls that are approximately -20 RFU (Figure 18). We decided to increase the stock concentration of oxytocin from
1 x 10⁻⁶ Mto
2 x 10⁻⁶ Mto get a more prominent curve. The final concentration in the experimental plate was 2 x10⁻⁷ M.
The experiments from Figure 19 show the fluorescence results after adding 11 μL
2 x 10⁻⁶ Mof oxytocin to the assay plates containing RR007 with a final concentration of 100uM and 50uM RR007 in 2.5% DMSO for both experiments (Figure 19). One can see from Figure 19B, the results showed an inconsistent signal. All of the wells had a very high fluorescence measurements. Oxytocin was also added to the row of control cells (row B) after the assay reading of row A. The counts for row B were inconsistent as well. Figure 19D, showed some inconsistencies in the fluorescence reading as well. Wells 5,6,10, and 11 had very high counts of fluorescence. We can also see that all of the untreated (dark) wells had fluorescence counts lower than most of the wells, around -30 RFU. The well that contained the dark 50 μM had the lowest count of fluorescence. The light treated DMSO controls have fluorescence measurements close to -10 RFU. The wells containing 50 μM light treated antagonist had a lower florescence reading than the light treated 100 μM antagonist. The increase in oxytocin concentration likely caused us to miss the beginning of the reaction. Without the beginning of the reaction, it is difficult to determine how the antagonist affected the oxytocin receptor.
Figure 20 shows the fluorescence readings after adding 11 μL of
2 x 10⁻⁶Mof oxytocin to the cells containing RR007 with final concentrations of 100uM and 50uM RR007 in HHP buffer with 2.5% DMSO. The wells containing the light activated 100 μM and 45 μM have fluorescence measurements at about -4 RFU. The dark DMSO controls have fluorescence measurements slightly above the fluorescence of the light activated compounds. One of the untreated 95μM wells had an absorbance around -12 RFU also. Both sets of DMSO controls have the highest fluorescence counts. One can see that the beginning of the curve was not caught which prompted us to decrease the concentration of the stock solution of oxytocin back to
1 x 10⁻⁶M. We also planned to decrease the total volume by half (including the Fluo-8) in order to add more antagonist into the oxytocin experimental plate.
In Figure 21, the assay was completed with all light treated samples of RR007 with final concentrations of 100 μM and 50 μM RR007 in HHP buffer with 2.5% DMSO. One can observe 50 μM 1, 3, and 4 had higher fluorescence measurements at approximately 5 RFU compared to the -20 RFU of the well containing 50 μM 2. Samples 1 and 3 containing the DMSO control are around -5 RFU to 1FRU respectively. The other two are outliers measuring around -57 and -19 RFU. One of the 100 μM samples, 1, had a very low fluorescence measurement of about -53 RFU, similar to the 2nd DMSO control. The rest of the 100μM had high fluorescence measurements, close to the DMSO controls. We managed to catch the beginning of this curve after decreasing the oxytocin. However, these results still were not optimal since RR007 was not stable in one conformation while in aqueous solution.
MZ03D
The experiment shown in Figure 22A is the fluorescence measurements for compound MZ03D with final concentrations of 100μM and 250μM in 2.5% DMSO. Evidence of precipitate was noticed in the 250 μM pre-plates after the fluorescence reading was finished. The DMSO controls appeared to have relatively similar measurements in fluorescence all around -30 RFU. The wells containing the dark (untreated) 100 μM solution and the 2nd dark 250 μM solution measured at 5 RFU; however, the 1st dark 250 μM measured around -45 RFU. The 1st light activated 100 μM solution had a higher fluorescence reading than the 2nd 100 μM solution measuring around 4 RFU compared to -36 RFU. The light activated 250 μM solutions had high fluorescence measurements, but the assay plate contained brown and yellow spots when observed under a microscope showing insoluble compound. It is possible that these spots affected the measurements of the cell activity. Figure 22B has very low absorbances and inconsistent results as a result of a faulty Fluo-8 vial. The lack of yellow color was noted for the solution which indicated a low amount of Fluo-8 in the assay plate suggesting cells were not likely loaded with enough Fluo-8. To increase the concentration of Fluo-8, we decreased the volume of HHP buffer by half (2.5mL) for the next experiment.
We did a series of dilutions with oxytocin to test for the optimal oxytocin to add to the experimental plate. If the oxytocin concentration was too high, that could contribute to why the scanner did not capture the beginning of the curve. However, the concentration of oxytocin needs to be high enough to achieve stimulation. Three different stock oxytocin concentrations were tested: the original
1 x 10⁻⁶M,
5 x 10⁻⁷M, and
2.5 x 10⁻⁵M(Figure 23). Each dilution was prepared from the
1 x 10⁻⁵Msolution. Both the
5 x 10⁻⁷Mand
2.5 x 10⁻⁵Moxytocin concentrations did not capture the beginning of the curve (Fig 23 A and B). The final concentrations of the oxytocin solutions were 1 x10⁻⁸ M, 5 x10⁻⁸ M, and 2.5 x 10⁻⁶ M. However, the
1 x 10⁻⁶Mconcentration of oxytocin did succeed in capturing the full curve. This could be a result of a timing issue when adding the oxytocin to the wells. The
1 x 10⁻⁶Moxytocin concentration was used for the experimental plates because it would allow the reader to capture the full curve. The results showed an efficient blocking of the oxytocin receptor by the compounds according to the concentrations in the well. The light activated compound at 150 μM show a lower curve (wells 11 and 12) than the DMSO controls in wells 9 and 10. One can also see the compound is able to block the receptor in well 8, which is the 75 μM compound. Results suggesting efficient blocking of oxytocin from the receptor using both concentrations are expected, but the higher concentration should have more of an effect, which the graph supports. Wells 6 and 7 did not receive any oxytocin because the solution did not release from the electronic micropipette. The untreated (dark) side of the graph also showed inhibition of the receptor. This could also be a result of inconsistent timing of distribution of oxytocin within the cells. Another option could be that the trans form (untreated) also blocks the receptor, but the results are too inconsistent to tell. The figure of the graph shows the beginning of the curve as well.
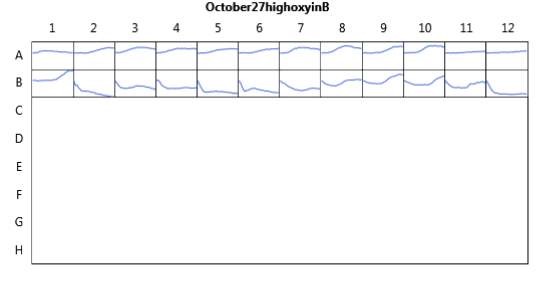
We attempted to recreate the results seen in Figures 23D and 23E; however the results for this test were very different. Figure 24 showed an inconsistent reading in the wells containing the untreated compound. The beginning of the curves for wells 2, 3, 5, and 6 cannot be seen. The wells were also not consistent with the predicted activity of each solution. Well 1 contains the 75 μM compound and had a higher fluorescence reading than the 2.5% DMSO control in well 4. A similar pattern can be seen on the light activated side of the experimental plate. The wells containing the 150 μM solution of antagonist, 11 and 12, had the highest fluorescence reading, but fluorescence should decrease in the presence of an antagonist. Since we were unable to recreate the results of the last experiment (Figure 23), the evidence to support our hypothesis was inconclusive.
Ultimately, additional testing will need to be completed to make a conclusive decision on whether or not the light activated compounds are able to inhibit oxytocin receptors. We did not expect solubility problems or photoisomerization differences in aqueous buffer compared to 100% DMSO. However, the main focus of the project turned into attempting to develop a compound that was soluble in aqueous buffer and could be isomerized in aqueous solution prior to biological testing. A compound solely soluble in DMSO would not be eligible for biological testing. Additional structural changes are currently in the works. All additional compounds are derivatives of the compounds tested during this project. Future modifications include the addition of a phosphate group and a CH2CH2OH in place of the acetyl, ethyl and alcohol groups.
Acknowledgements
I would like to thank St. Mary’s College of Maryland for providing Dr. Mertz with the Faculty Development Grant that helped fund this project. I would also like to thank Dr. Craig N. Streu and his students for assisting with this research. Last, but not least, thank you to Maxwell Madden and Doug Hovland for supplying materials and assisting with the experiments.
Result Figures
11A 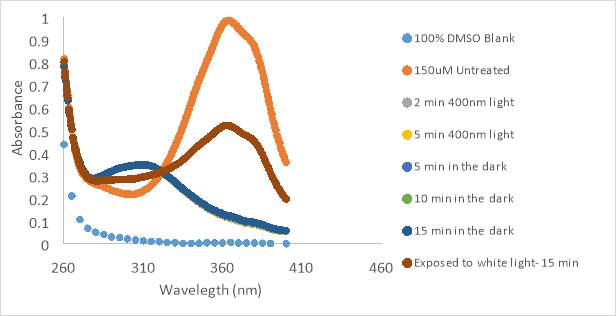 11B
11B 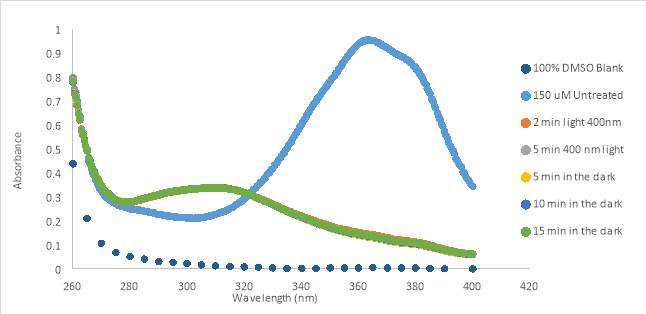
Figure 11. UV-Vis scan of RR001 150 μM in 100% DMSO treated with 400nm flashlights. Graph A shows results of silver flashlight and B shows results of black flashlight. A also shows results of exposure to room light
12A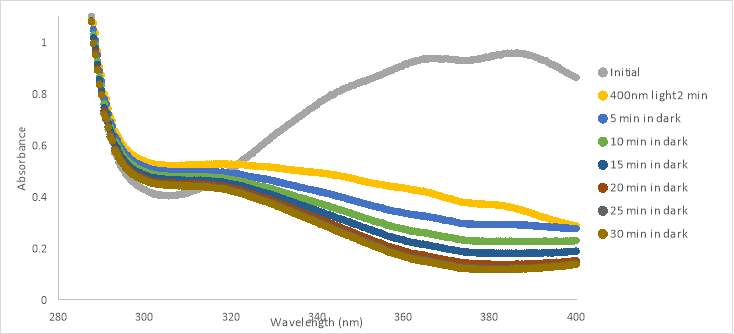 12B
12B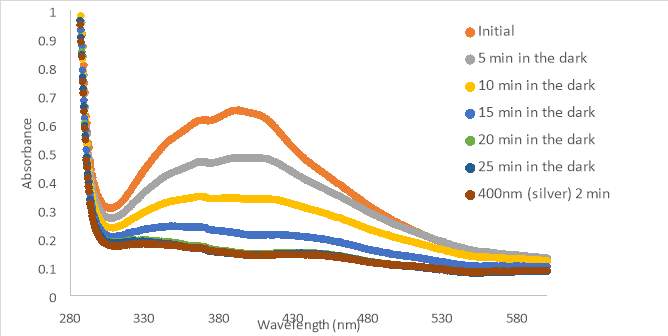
Figure 12. 150 μM RR007 with HHP in 4.25% DMSO (A) and 5% DMSO (B) treated with 400nm light. The compound was left to sit in the dark for up to 30 minutes. Graph B shows exposure to 400nm light.
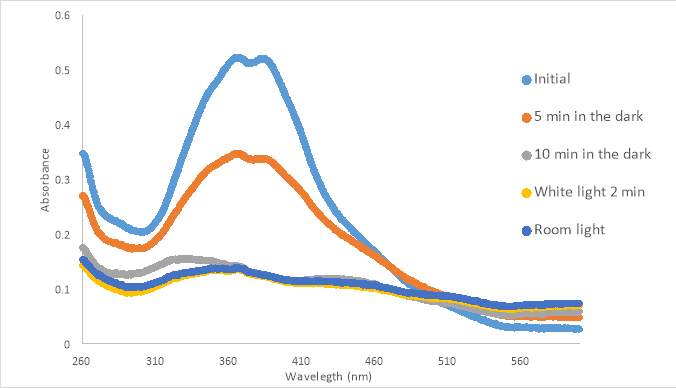
Figure 13. 300 μM untreated RR007 in 5% DMSO in Non-Probenecid Buffer. Left in the dark for up to 10 minutes and exposed to white light and room light.
14A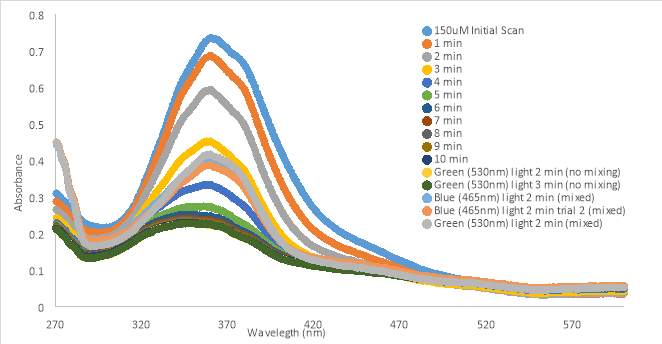
14B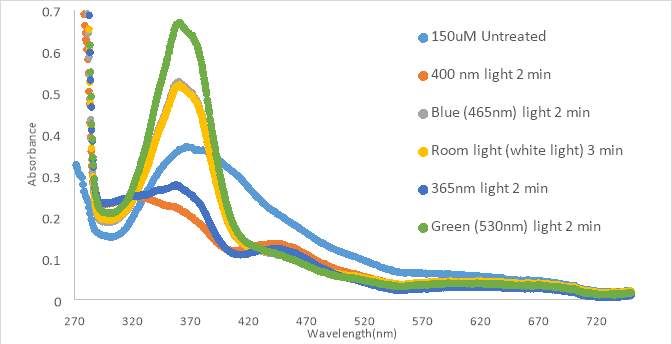
Figure 14. RR007 150 μM in PBS with 10%DMSO time tests prior to light treatments (A) 150 μM in PBS with 10%DMSO light tests, no time in the dark (B)
15A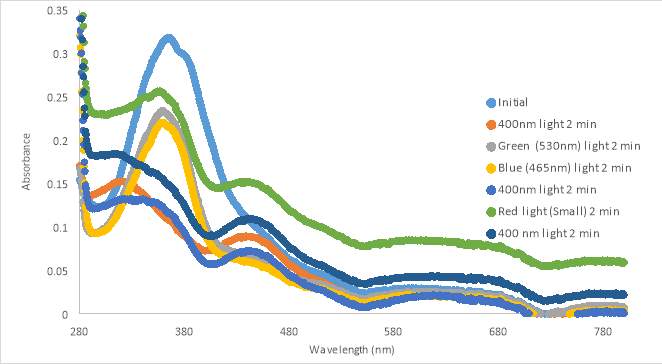 15B
15B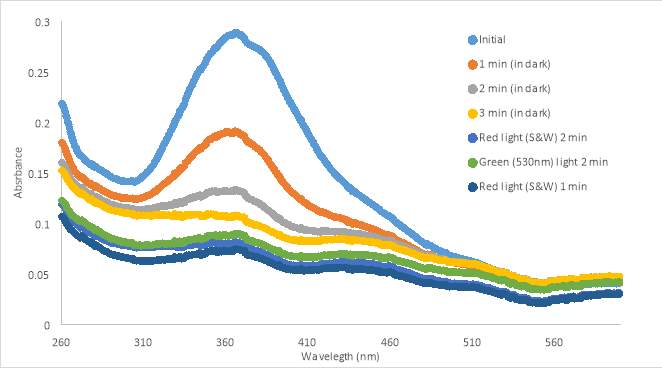 15C
15C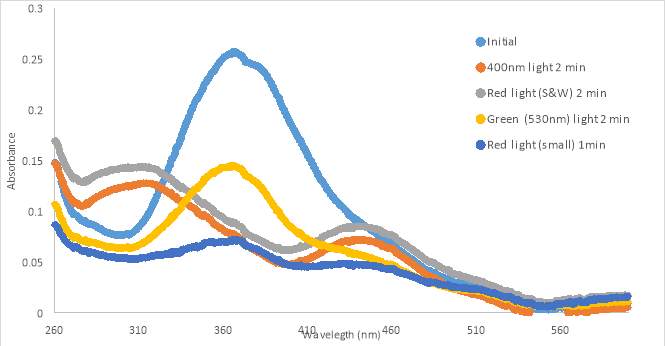
Figure 15. UV-vis spectra of RR007 75 μM in PBS with 10%DMSO in PBS buffer.
16A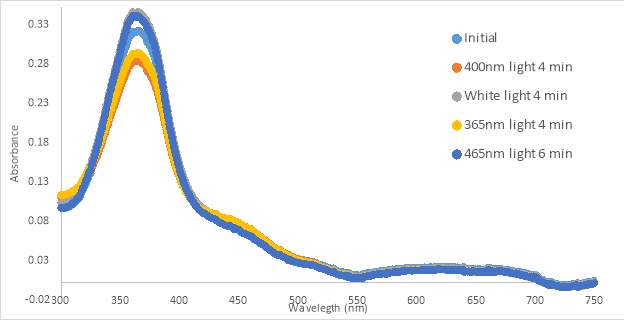
16B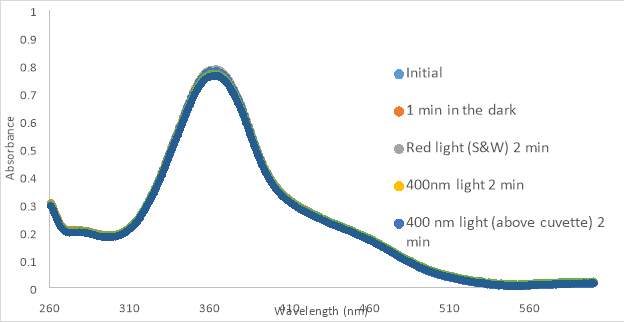
16C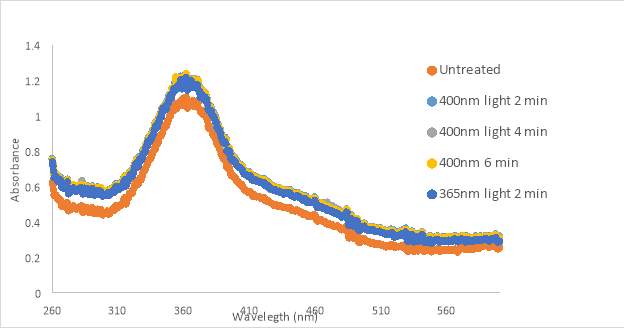
Figure 16. RR001 trans-to-cis light test spectra for 300 μM in PBS with 10% DMSO in HHP (A) and 133 μM in 10% DMSO in PBS (B) and 133 μM in 10% DMSO in PBS using 3D printed cuvette holder (C)
17A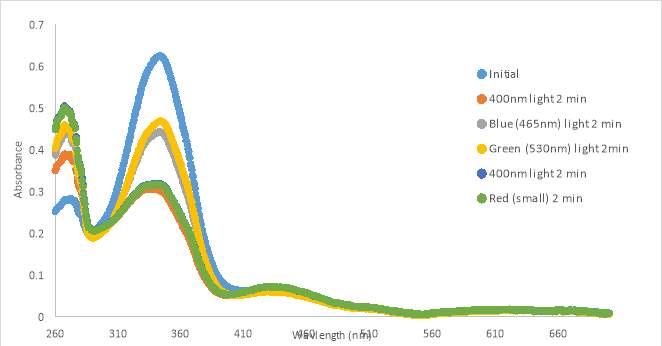
17B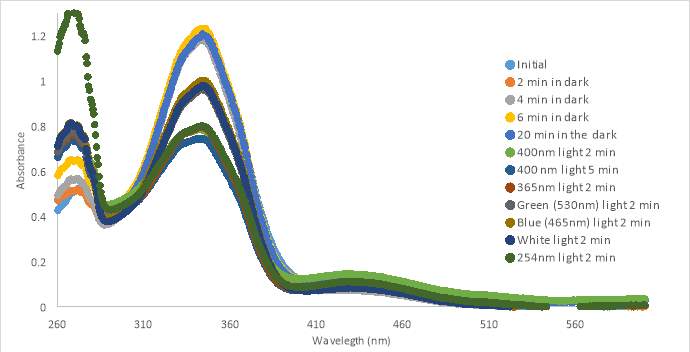
17C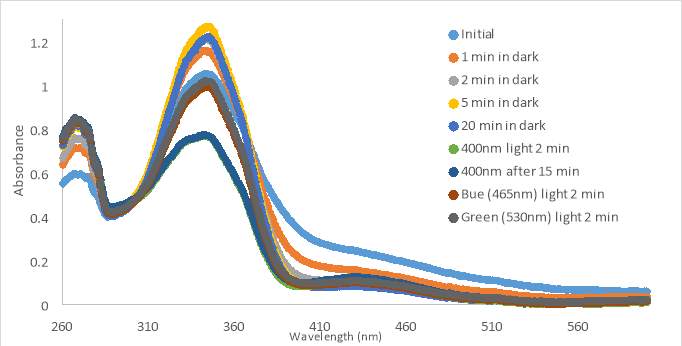
Figure 17. UV-vis spectra for compound MZ03D 150 μM in %10 DMSO in PBS buffer (A and B). 300 μM with HHP in 5% HHP (C).
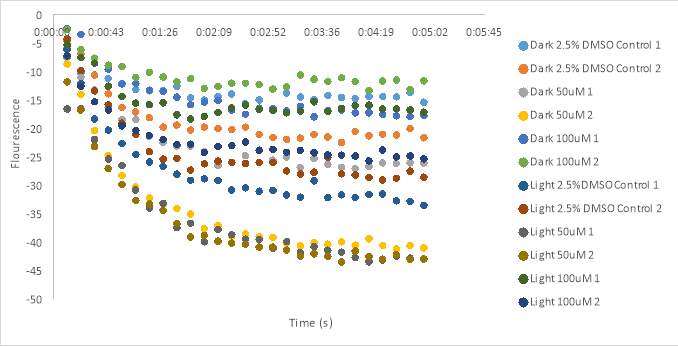 Figure 18. Oxytocin assay fluorescence results for 100 μM and 50 μM RR007 with HHP in 5% DMSO. Final concentration 1 x 10⁻⁷ M
19A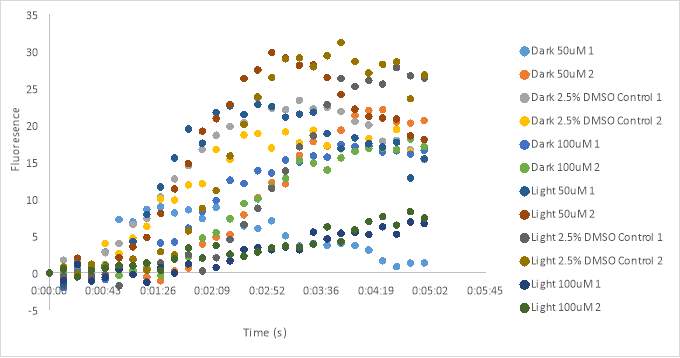
19B
19C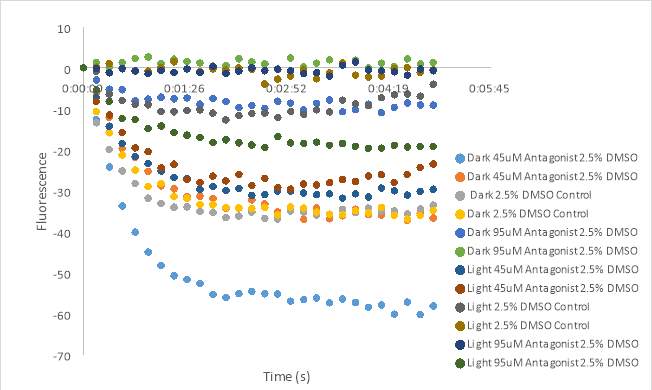
19D
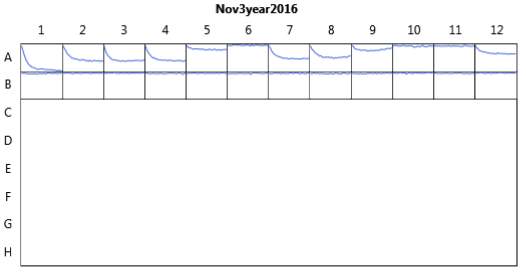
Figure 19. Oxytocin assay fluorescence results for 100 μM and 50 μM RR007 in HHP buffer with 2.5% DMSO. 1 x10⁻⁷ M Final oxytocin concentration for graphs A, B, C, and D. Graphs B and D wells contain Dark 50 μM (1 & 2), Dark 2.5% DMSO control (3 &4), Dark 100 μM (5 & 6), Light 50 μM (7& 8), Light 2.5% DMSO control (9 & 10), and Light 100 μM (11 &12).
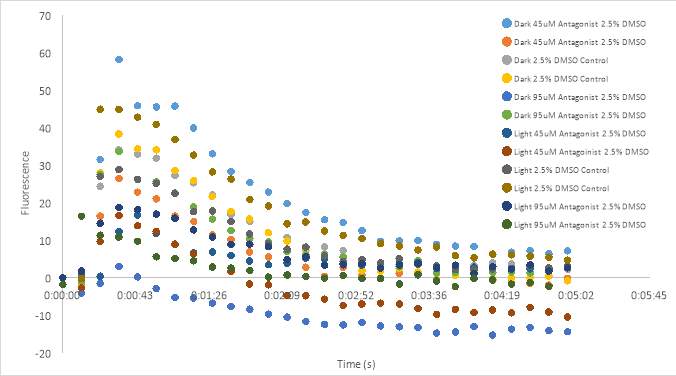
Figure 20. Oxytocin assay fluorescence results for 100 μM and 50 μM RR007 in 5% DMSO. Final oxytocin 1 x10⁻⁷ M.
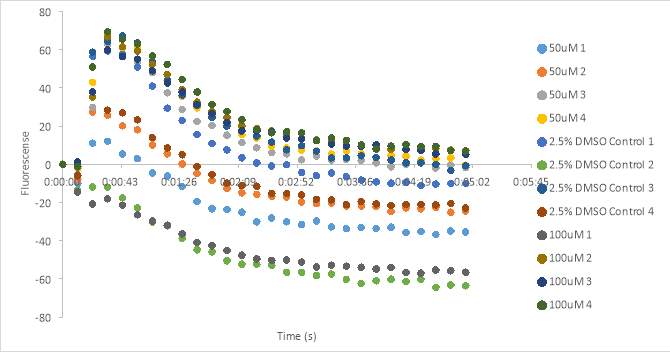
Figure 21. Oxytocin assay fluorescence results for 100 μM and 50 μM RR007 in HHP buffer with 2.5% DMSO. 1 x10⁻⁷ M final oxytocin concentration.
22A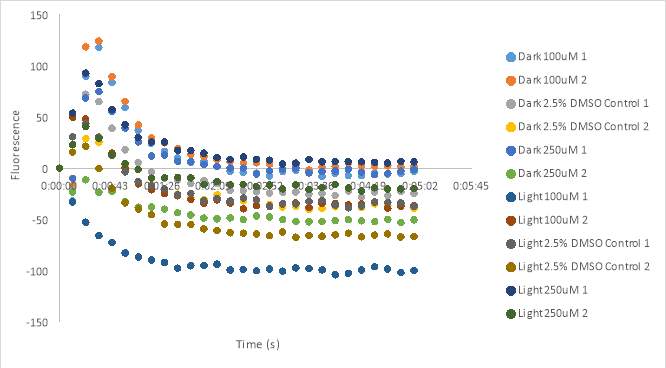
22B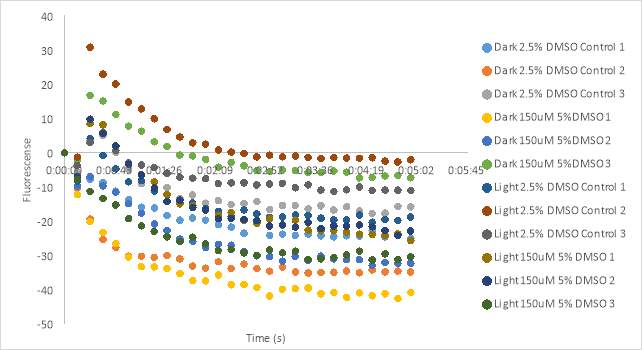
Figure 22. Oxytocin assay fluorescence results for 100 μM and 250 μM MZ03D (A) and 150 μM MZ03D (B) in 5% DMSO. 1 x10⁻⁷ M final oxytocin concentration.
23A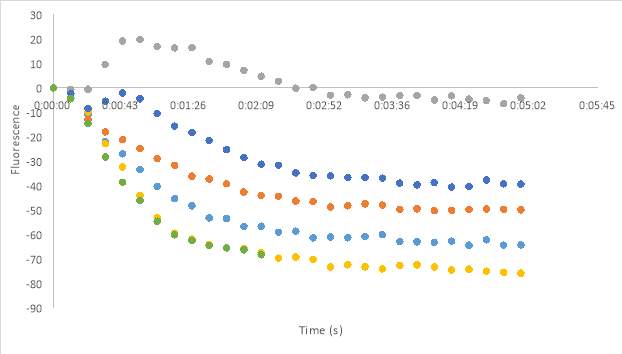
23B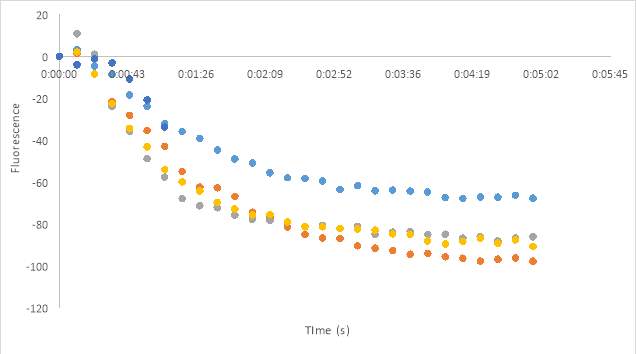
23C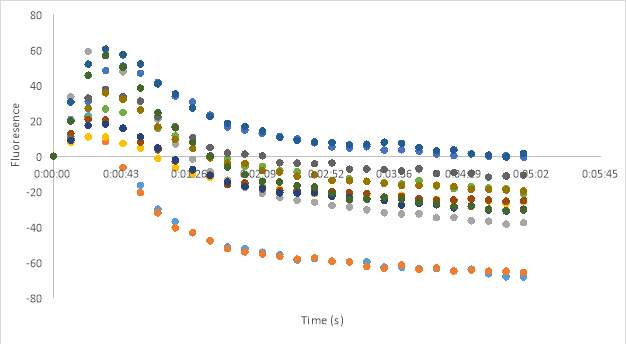
23D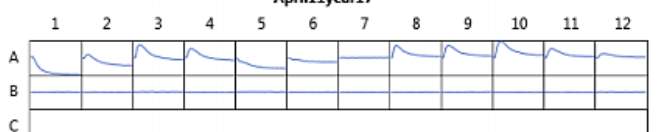
23E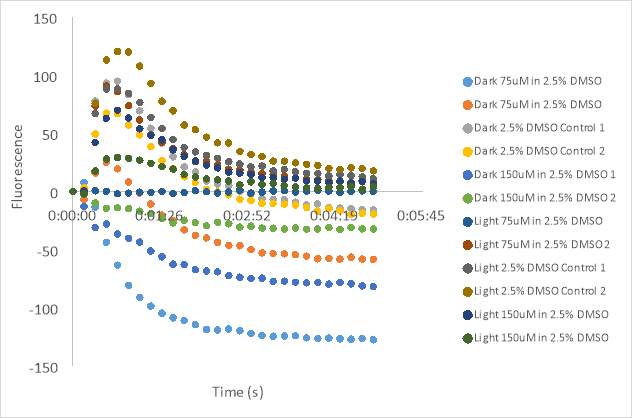
Figure 23. Oxytocin Assay results without antagonist at concentrations 2.5 (A), 5 (B), and 1 (C). Oxytocin assay fluorescence PDF for 150 μM and 75 μM MZ03D both in HHP buffer with 2.5% DMSO. 1 x10⁻⁷ M final oxytocin concentration (D). Figure D wells contain Dark 75 μM (1 & 2), Dark 2.5% DMSO control (3 &4), Dark 150 μM (5 & 6), Light 75 μM (7& 8), Light 2.5% DMSO control (9 & 10), and Light 150 μM (11 &12). Graphed results of oxytocin assay with MZ03D (E).
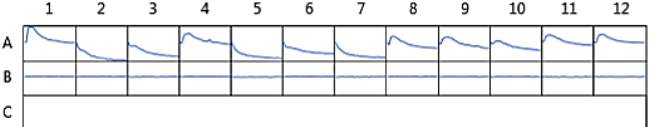
Figure 24. Oxytocin assay fluorescence PDF for 150 μM and 75 μM MZ03D both in HHP buffer with 2.5% DMSO. 1 x10⁻⁷ M final oxytocin concentration. Wells contain Dark 75 μM (1 & 2), Dark 2.5% DMSO control (3 &4), Dark 150 μM (5 & 6), Light 75 μM (7& 8), Light 2.5% DMSO control (9 & 10), and Light 150 μM (11 &12).
References
1. Information, N. C. f. B. Retosiban.
2. Irie, M. (2000) Diarylethenes for Memories and Switches. Chemical Reviews 100, 1685-1716
3. Lamont, R. F. (2003) The development and introduction of anti-oxytocic tocolytics. BJOG: An International Journal of Obstetrics & Gynaecology 110, 108-112
4. Neumann, I. D., and Landgraf, R. (2008) Advances in vasopressin and oxytocin–from genes to behaviour to disease. Preface. Progress in brain research 170, xi-xiii
5. Love, T. M. (2014) Oxytocin, Motivation and the Role of Dopamine. Pharmacology, biochemistry, and behavior 0, 49-60
6. Borthwick, A. D. (2010) Oral Oxytocin Antagonists. Journal of Medicinal Chemistry 53, 6525-6538
7. Bealer, S. L., Armstrong, W. E., and Crowley, W. R. (2010) Oxytocin release in magnocellular nuclei: neurochemical mediators and functional significance during gestation. American Journal of Physiology – Regulatory, Integrative and Comparative Physiology 299, R452-R458
8. Lee, H.-J., Macbeth, A. H., Pagani, J., and Young, W. S. (2009) Oxytocin: the Great Facilitator of Life. Progress in neurobiology 88, 127-151
9. Crowley, W. R., and Armstrong, W. E. (1992) Neurochemical Regulation of Oxytocin Secretion in Lactation. Endocrine Reviews 13, 33-65
10. Ludwig, M., Sabatier, N., Bull, P. M., Landgraf, R., Dayanithi, G., and Leng, G. (2002) Intracellular calcium stores regulate activity-dependent neuropeptide release from dendrites. Nature 418, 85-89
11. de Kock, C. P., Wierda, K. D., Bosman, L. W., Min, R., Koksma, J. J., Mansvelder, H. D., Verhage, M., and Brussaard, A. B. (2003) Somatodendritic secretion in oxytocin neurons is upregulated during the female reproductive cycle. The Journal of neuroscience : the official journal of the Society for Neuroscience 23, 2726-2734
12. Gimpl, G., and Fahrenholz, F. (2001) The oxytocin receptor system: structure, function, and regulation. Physiological reviews 81, 629-683
13. Mitchell, B. F., Fang, X., and Wong, S. (1998) Oxytocin: a paracrine hormone in the regulation of parturition? Rev. Reprod. 3, 113-122
14. Olff, M., Frijling, J. L., Kubzansky, L. D., Bradley, B., Ellenbogen, M. A., Cardoso, C., Bartz, J. A., Yee, J. R., and van Zuiden, M. (2013) The role of oxytocin in social bonding, stress regulation and mental health: An update on the moderating effects of context and interindividual differences. Psychoneuroendocrinology 38, 1883-1894
15. Heinrichs, M., Baumgartner, T., Kirschbaum, C., and Ehlert, U. (2003) Social support and oxytocin interact to suppress cortisol and subjective responses to psychosocial stress. Biological psychiatry 54, 1389-1398
16. Leckman, J. F., Goodman, W. K., North, W. G., Chappell, P. B., Price, L. H., Pauls, D. L., Anderson, G. M., Riddle, M. A., McSwiggan-Hardin, M., McDougle, C. J., and et al. (1994) Elevated cerebrospinal fluid levels of oxytocin in obsessive-compulsive disorder. Comparison with Tourette’s syndrome and healthy controls. Archives of general psychiatry 51, 782-792
17. Cochran, D., Fallon, D., Hill, M., and Frazier, J. A. (2013) “The role of oxytocin in psychiatric disorders: A review of biological and therapeutic research findings”. Harvard review of psychiatry 21, 219-247
18. Thackare, H., Nicholson, H. D., and Whittington, K. (2006) Oxytocin—its role in male reproduction and new potential therapeutic uses. Human Reproduction Update 12, 437-448
19. Zhong, M., Boseman, M. L., Millena, A. C., and Khan, S. A. (2010) Oxytocin induces the migration of prostate cancer cells: involvement of the Gi-coupled signaling pathway. Molecular cancer research : MCR 8, 1164-1172
20. Favre, N., Fanelli, F., Missotten, M., Nichols, A., Wilson, J., di Tiani, M., Rommel, C., and Scheer, A. (2005) The DRY Motif as a Molecular Switch of the Human Oxytocin Receptor. Biochemistry 44, 9990-10008
21. Koehbach, J., Stockner, T., Bergmayr, C., Muttenthaler, M., and Gruber, C. W. (2013) Insights into the molecular evolution of oxytocin receptor ligand binding. Biochemical Society transactions 41, 197-204
22. Vrachnis, N., Malamas, F. M., Sifakis, S., Deligeoroglou, E., and Iliodromiti, Z. (2011) The Oxytocin-Oxytocin Receptor System and Its Antagonists as Tocolytic Agents. International Journal of Endocrinology 2011, 8
23. Carter, C. S. (2007) Sex differences in oxytocin and vasopressin: implications for autism spectrum disorders? Behavioural brain research 176, 170-186
24. Neumann, I. D. (2008) Brain Oxytocin: A Key Regulator of Emotional and Social Behaviours in Both Females and Males. Journal of Neuroendocrinology 20, 858-865
25. Quattropani, A., Dorbais, J., Covini, D., Pittet, P.-A., Colovray, V., Thomas, R. J., Coxhead, R., Halazy, S., Scheer, A., Missotten, M., Ayala, G., Bradshaw, C., De Raemy-Schenk, A.-M., Nichols, A., Cirillo, R., Tos, E. G., Giachetti, C., Golzio, L., Marinelli, P., Church, D. J., Barberis, C., Chollet, A., and Schwarz, M. K. (2005) Discovery and Development of a New Class of Potent, Selective, Orally Active Oxytocin Receptor Antagonists. Journal of Medicinal Chemistry 48, 7882-7905
26. Tsatsaris, V., Carbonne, B., and Cabrol, D. (2004) Atosiban for preterm labour. Drugs 64, 375-382
27. Flenady, V., Reinebrant, H. E., Liley, H. G., Tambimuttu, E. G., and Papatsonis, D. N. M. (2014) Oxytocin receptor antagonists for inhibiting preterm labour. The Cochrane Library
28. Romero, R., Sibai, B. M., Sanchez-Ramos, L., Valenzuela, G. J., Veille, J. C., Tabor, B., Perry, K. G., Varner, M., Goodwin, T. M., Lane, R., Smith, J., Shangold, G., and Creasy, G. W. (2000) An oxytocin receptor antagonist (atosiban) in the treatment of preterm labor: a randomized, double-blind, placebo-controlled trial with tocolytic rescue. American journal of obstetrics and gynecology 182, 1173-1183
29. Reversi, A., Rimoldi, V., Marrocco, T., Cassoni, P., Bussolati, G., Parenti, M., and Chini, B. (2005) The oxytocin receptor antagonist atosiban inhibits cell growth via a “biased agonist” mechanism. The Journal of biological chemistry 280, 16311-16318
30. Pierzynski, P., Lemancewicz, A., Reinheimer, T., Akerlund, M., and Laudanski, T. (2004) Inhibitory effect of barusiban and atosiban on oxytocin-induced contractions of myometrium from preterm and term pregnant women. Journal of the Society for Gynecologic Investigation 11, 384-387
31. Reinheimer, T. M., Chellman, G. J., Resendez, J. C., Meyer, J. K., and Bee, W. H. (2006) Barusiban, an effective long-term treatment of oxytocin-induced preterm labor in nonhuman primates. Biology of reproduction 75, 809-814
32. Liddle, J., Allen, M. J., Borthwick, A. D., Brooks, D. P., Davies, D. E., Edwards, R. M., Exall, A. M., Hamlett, C., Irving, W. R., Mason, A. M., McCafferty, G. P., Nerozzi, F., Peace, S., Philp, J., Pollard, D., Pullen, M. A., Shabbir, S. S., Sollis, S. L., Westfall, T. D., Woollard, P. M., Wu, C., and Hickey, D. M. B. (2008) The discovery of GSK221149A: A potent and selective oxytocin antagonist. Bioorganic & medicinal chemistry letters 18, 90-94
33. Thornton, S., Miller, H., Valenzuela, G., Snidow, J., Stier, B., Fossler, M. J., Montague, T. H., Powell, M., and Beach, K. J. (2015) Treatment of spontaneous preterm labour with retosiban: a phase 2 proof-of-concept study. British Journal of Clinical Pharmacology 80, 740-749
34. Flenady, V., Reinebrant, H. E., Liley, H. G., Tambimuttu, E. G., and Papatsonis, D. N. M. (2014) Oxytocin receptor antagonists for inhibiting preterm labour. Cochrane Database of Systematic Reviews
35. Manning, M., Misicka, A., Olma, A., Bankowski, K., Stoev, S., Chini, B., Durroux, T., Mouillac, B., Corbani, M., and Guillon, G. (2012) Oxytocin and Vasopressin Agonists and Antagonists as Research Tools and Potential Therapeutics. Journal of Neuroendocrinology 24, 609-628
36. Williams, P. D., Clineschmidt, B. V., Erb, J. M., Freidinger, R. M., Guidotti, M. T., Lis, E. V., Pawluczyk, J. M., Pettibone, D. J., Reiss, D. R., Veber, D. F., and et al. (1995) 1-(1-[4-[(N-acetyl-4-piperidinyl)oxy]-2-methoxybenzoyl]piperidin-4- yl)-4H-3,1-benzoxazin-2(1H)-one (L-371,257): a new, orally bioavailable, non-peptide oxytocin antagonist. J Med Chem 38, 4634-4636
37. Ring, R. H., Malberg, J. E., Potestio, L., Ping, J., Boikess, S., Luo, B., Schechter, L. E., Rizzo, S., Rahman, Z., and Rosenzweig-Lipson, S. (2006) Anxiolytic-like activity of oxytocin in male mice: behavioral and autonomic evidence, therapeutic implications. Psychopharmacology 185, 218-225
38. Moraitis, A. A., Cordeaux, Y., Charnock-Jones, D. S., and Smith, G. C. S. (2015) The Effect of an Oxytocin Receptor Antagonist (Retosiban, GSK221149A) on the Response of Human Myometrial Explants to Prolonged Mechanical Stretch. Endocrinology 156, 3511-3516
39. Velema, W. A., Szymanski, W., and Feringa, B. L. (2014) Photopharmacology: Beyond Proof of Principle. Journal of the American Chemical Society 136, 2178-2191
40. Szymański, W., Beierle, J. M., Kistemaker, H. A. V., Velema, W. A., and Feringa, B. L. (2013) Reversible Photocontrol of Biological Systems by the Incorporation of Molecular Photoswitches. Chemical Reviews 113, 6114-6178
41. Velema, W. A., Hansen, M. J., Lerch, M. M., Driessen, A. J. M., Szymanski, W., and Feringa, B. L. (2015) Ciprofloxacin–Photoswitch Conjugates: A Facile Strategy for Photopharmacology. Bioconjugate Chemistry 26, 2592-2597
42. Cipolloni, M., Ortica, F., Bougdid, L., Moustrou, C., Mazzucato, U., and Favaro, G. (2008) New Thermally Irreversible and Fluorescent Photochromic Diarylethenes. The Journal of Physical Chemistry A 112, 4765-4771
43. Borowiak, M., Nahaboo, W., Reynders, M., Nekolla, K., Jalinot, P., Hasserodt, J., Rehberg, M., Delattre, M., Zahler, S., Vollmar, A., Trauner, D., and Thorn-Seshold, O. (2015) Photoswitchable Inhibitors of Microtubule Dynamics Optically Control Mitosis and Cell Death. Cell 162, 403-411
44. Engdahl, A. J., Torres, E. A., Lock, S. E., Engdahl, T. B., Mertz, P. S., and Streu, C. N. (2015) Synthesis, Characterization, and Bioactivity of the Photoisomerizable Tubulin Polymerization Inhibitor azo-Combretastatin A4. Organic Letters 17, 4546-4549
45. Sheldon, J. E., Dcona, M. M., Lyons, C. E., Hackett, J. C., and Hartman, M. C. (2016) Photoswitchable anticancer activity via trans-cis isomerization of a combretastatin A-4 analog. Organic & biomolecular chemistry 14, 40-49
46. Brown, A., Brown, T. B., Calabrese, A., Ellis, D., Puhalo, N., Ralph, M., and Watson, L. (2010) Triazole oxytocin antagonists: Identification of an aryloxyazetidine replacement for a biaryl substituent. Bioorganic & medicinal chemistry letters 20, 516-520
47.
Cite This Work
To export a reference to this article please select a referencing stye below:
Related Services
View all


Related Content
All TagsContent relating to: "Biology"
Biology is the scientific study of the natural processes of living organisms or life in all its forms. including origin, growth, reproduction, structure, and behaviour and encompasses numerous fields such as botany, zoology, mycology, and microbiology.
Related Articles

DMCA / Removal Request
If you are the original writer of this research project and no longer wish to have your work published on the UKDiss.com website then please: