Impact of Anthropogenic Aerosol and Dust on Orographic Precipitation
Info: 8932 words (36 pages) Dissertation
Published: 14th Feb 2022
Abstract
The cumulative effect of anthropogenic aerosol pollution acting primarily as CCN along with dust acting as cloud condensation nuclei (CCN), giant cloud condensation nuclei (GCCN), and ice nuclei (IN) is examined in this study. The study covers the entire Colorado Rocky Mountains from the months of October to April in the year 2004-2005. This ~6.5-month analysis provides a range of snowfall totals and variability in concentrations of anthropogenic aerosol pollution and dust. The specific objectives of this research are to quantify the impacts of both dust and pollution aerosols on wintertime precipitation in the Colorado Mountains using the Regional Atmospheric Modeling System (RAMS). In general, anthropogenic aerosol pollution reduces water resources in the Colorado River Basin(CRB) via the so-called “spill-over” effect (delaying precipitation until outside of the CRB), by enhancing cloud droplet concentrations and reducing riming rates. Dust on the other hand, enhances precipitation primarily by acting as IN. Dust is more episodic and anthropogenic aerosol is more pervasive throughout the winter season. Combined response to dust and anthropogenic aerosol is a net reduction of water resources in the CRB. The question is by how much are those water resources affected? This study estimates that the total winter-season precipitation loss for the CRB in the 2004-2005 winter season due to the combined influence of anthropogenic aerosol and dust was 5,380,00 acre-feet of water.
1. Introduction
The southwest United States is a region with huge demands on water resources. The Colorado River Basin (CRB) covers the states of Colorado, Wyoming, Utah, Nevada, Arizona, New Mexico, and California as well as Mexico (Fig. 1). The headwaters lie in the Rocky Mountains of Colorado and Wyoming. The water resources in the CRB are potentially impacted by anthropogenic aerosol and dust acting as cloud nucleating aerosol. We investigate these effects in this paper.
Saleeby et al. (2009) examined the hypothesis that high aerosol pollution acting as cloud concentration nuclei (CCN) leads to the formation of smaller, more numerous droplets and reduced riming. They found that with higher CCN concentrations the smaller droplets evaporate more readily when ice crystals grow at the expense of cloud droplets (the Wegener-Bergeron-Findeisen process; WBF) depleting liquid water contents, but enhances ice particle vapor deposition growth. Thus, overall precipitation was reduced only by a small amount owing to the compensating effects of the enhanced WBF process. Consistent with the Bory’s hypothesis (Bory’s et al. 2000; 2003), they found that reduced riming lowered snow water equivalent precipitation amounts on the windward side of the mountain barrier and increased it on the lee slopes. In the case of the Park Range, the “spillover effect” led to a downstream shift of precipitation from the Pacific watershed to the Atlantic watershed further contributing to a reduction of precipitation in the CRB. Spillover effect is defined as the shift of precipitation from the windward to the leeward side of a mountain due to redistribution of precipitation particles from heavily rimed, faster-falling graupel particles to unrimed or lightly rimed, slower-falling snow crystals and aggregates of crystals (Saleeby et al. 2010). They also showed that this effect was only important for relatively wet storms where riming is important. These results are further supported by more recent studies, wherein Saleeby et al. (2011) estimated the total change in precipitation for all of western Colorado due to aerosol pollution for a 60-day period for four different seasons. These simulations were performed for assumed high and low values of aerosol acting as CCN. Again, little change in total precipitation was found but a major shift in precipitation downwind, or spillover effect, was simulated owing to aerosol pollution. In that study, the biggest loser was the CRB with as much as 522,000 acre-ft lost for a 60-day period in 2005. Saleeby et al. did not include dust in their analysis. In this study, we examine the combined impact of anthropogenic aerosol and dust on orographic precipitation and the water resources in the CRB.
Dust is known to act as a good ice nuclei (IN) (Schaefer 1949; 1954; Isono et al. 1959; Roberts and Hallett 1968; Zuberi et al. 2002; Hung et al. 2003; Gagin 1965; Sassen et al. 2003; DeMott et al. 2003; 2009). Considering that the basis behind cloud seeding is to enhance precipitation by enhancing IN concentrations (Cotton and Pielke 2007), we anticipate that dust serving as IN will enhance precipitation in wintertime orographic clouds. Muhlbauaer and Lohmann (2009) did a 3D idealized case study of mixed phase orographic clouds and found that in the simulations with dust aerosol, the dust aerosols serve as ice nuclei and hence lead to an early ice phase initiation and enhanced riming which leads to enhancement of orographic precipitation. If dust becomes coated with hygroscopic material or originates over dry lake beds, dust can serve as giant cloud condensation nuclei (GCCN) which when wetted can result in larger cloud droplets and thereby enhance the warm-cloud collision and coalescence process and ice particle riming. Dust serving as GCCN should enhance precipitation (Levin et al. 1996), thus affecting precipitation in the same direction as IN. However, the major impact of GCCN is on enhancing the warm-rain collision and coalescence process, a process that is not very active in wintertime orographic clouds in Colorado. But smaller dust particles coated with hygroscopic material can enhance droplet concentrations, leading to numerous smaller droplets and decreasing collision and coalescence of droplets and ice particle riming. Thus, dust functioning as CCN will work in opposition to its activity as GCCN and IN and suppress precipitation much like pollution aerosol. In their study of the effects of African dust on deep convective precipitation over South Florida, van den Heever et al. (2006), found that dust serving as CCN had a stronger impact on precipitation than dust serving as GCCN or IN. No one to our knowledge has examined the combined effects of dust serving as IN, GCCN, and CCN on precipitation or on water resources in the CRB. Therefore, the focus of this study is on the impacts of anthropogenic aerosol and dust acting as cloud nucleating aerosol on wintertime orographic precipitation in the Colorado Mountains.
2. Method – RAMS dust model
The dust source and transport module incorporated into RAMS for this study (implemented by Smith et al. 2007 and revised by Lerach 2010) is based on that of Ginoux et al. (2001), which advects lofted dust in two size bins; accumulation mode and coarse mode. The fine mode dust median radius was set to 0.2µm, and the coarse mode dust median radius was set to 3.0 µm. These values were derived from limited AErosol RObotic NETwork (AERONET) observations at Sevilleta, NM (–106.885°, 34.35°) from 15 April 2003 at 2200 UTC. The dust simulation in RAMS is dependent on soil moisture, soil composition, wind speed, vegetative cover and composition (Prospero, 1999). A dust source function S, created by Ginoux et al. (2001) represents the fraction of dust produced by wind erosion. This source function is based on the work of Prospero (1999) relating the major global sources of dust with regional topographic depressions, as these areas can accumulate fine-particle sediments that are suitable for wind erosion and transport. Tegen and Fung (1994) characterize the soil mass fractions and size classes. Soil is divided into two broad classes: silt and clay. Silt is assumed to constitute the majority of erodible materials.
Silt is evenly partitioned into three size classes and is assigned 90% of all mass available for lofting. The remaining 10% is assumed to be clay in the sub-micron range, partitioned evenly into four size classes. The algorithm in RAMS follows the methods of Marticorena and Bergametti (2005), and hence parameterizes a threshold friction velocity, based on intrinsic particle characteristics as well as the roughness length of the surface. Mass emissions are dependent on the wind speed at 10 m, which is interpolated from the lowest model layer wind speed by assuming a logarithmic wind profile. The mass flux is converted to a number concentration assuming a density of 2500 kg m-3 for clay and 2650 kg m-3 for silt. The RAMS dry deposition scheme is based on that of Wang et al. (2006) but modified for use with mineral dust.
3.0 RAMS cloud microphysics
The RAMS bin-emulating, two-moment bulk microphysics scheme (Feingold et al. 1998; Cotton et al. 2003; Saleeby and Cotton 2004; 2008) is used in these simulations, in which the cloud droplet size distribution is decomposed into small cloud droplets (cloud1) and large cloud droplets (cloud2) (Saleeby and Cotton 2004). The scheme explicitly predicts mixing ratios and number concentrations of pristine ice, snow, aggregates, graupel, hail, cloud1 and cloud2 droplets, and rain. Droplet collection, condensation, and evaporation are explicitly represented in this scheme.
a. Dust activation as CCN
A look-up table is constructed to simulate the competitive interaction of three externally aerosol species; dust, sea spray salt, and ordinary natural soluble aerosol and pollution aerosol. For dust, which is large and largely insoluble, Koehler theory is replaced by an adsorption theory treatment (Kumar et al. 2011). For given environmental conditions, water adsorption effects on the insoluble dust particles can produce important reductions in the critical size and therefore significantly affect competition. Adsorption theory is described in detail in Appendix 1.
The original parcel model of Heymsfield and Sabin (1989) and Feingold and Heymsfield (1992) was streamlined and optimized by R. Walko. A new look-up table was constructed by Gustavo Carrio, Colorado State University from an ensemble of simulations covering a range of vertical velocity, temperature, pressure, air density, liquid water content, aerosol chemistry, aerosol size, and number concentration.
Generalized bins describing not only particle sizes but also different hygroscopicity parameters (kappa), or adsorption theory to represent dust particles were implemented. Adsorption theory (Kumar et al. 2011) was implemented for dust particles of different size; it must be noted that this expression presents singular points (for equal wet and dry particle diameters) and therefore required adaptation of an iterative scheme to find critical diameters and saturations. A control file was implemented to allow the user the selection of several characteristics defining an arbitrary number of aerosol types to be considered as well as the size partitions to represent each distribution (e.g., their hygroscopicity parameter, or dust identity, number of size bins, distribution boundaries, etc). User control files were constructed to automatically control the aforementioned code for sampling the ample parameter space required to take into account the competition of aerosols (differing in abundance and nature). The multidimensional LUT’s are used to represent cloud droplet activation as well as the corresponding nucleation scavenging rates for all competing aerosol types.
b. Dust activation as GCCN
The droplet spectrum in RAMS is composed of two cloud droplet modes and rain. The second cloud mode can be thought of as small drizzle droplets that form either from self-collection among droplets in the first cloud mode or nucleation of GCCN. GCCN are considered aerosol particles greater than 1 µm (or coarse mode aerosol particles) that are wettable. In earlier versions of RAMS, it was assumed that all wettable particles (like mineral dust) greater than 1 µm would form droplets in the second cloud mode whenever the relative humidity exceeded 100% (Saleeby and Cotton 2004; Ward and Cotton 2010). Lerach (2012) examined this hypothesis with a range of updraft speeds, by performing parcel model simulations for dust in moist rising air with an assumed κ value of 0.03. For a given chemical composition, Köhler theory predicts that the dry particle size increases with the decrease in critical supersaturation, making it is easier to activate larger particles. This is a result of the fact that the Kelvin curvature effect is very small for such large particles. Lerach (2012) found that the activation fraction for dust particles greater than 1 µm reaches 100% for updraft speeds greater than 2.87 m/s and reduces appreciably for speeds less than 0.01 m/s.
c. Ice nucleation scheme
The formula for ice nuclei (IN) follows the recent results reported in DeMott et al. (2014).
Tobo et al. (2013) observed systematic errors of predicted IN using the DeMott et al. (2010) scheme vs. measured ice particle (INP) number concentrations at a forest site dominated by biological INPs. Using the DeMott et al. (2010) in RAMS precipitation was over-predicted due to the large concentrations of ice nuclei activated. Hence, a correction factor cf was introduced in the equation based on different locations
nINPTk=cfna>0.5μmα273.16-Tk+βexpγ273.16-Tk+δ
Equation 1
where α=0, β= 1.25, γ= 0.46, δ=-11.6.
cf=3 is used to estimate mineral dust IN concentration (Fig. 4) and yields good agreement between the simplified parameterizations and the surface area based parameterization of Niemand et al. (2012). The Niemand et al. (2012) scheme was developed solely from laboratory data, supporting the atmospheric applicability of laboratory ice nucleation results to the atmosphere. Consequently, the results additionally support the premise of Niemand et al. (2012) that, to a first order, mineral dust particles from locations as separate as the Saharan or Asian regions may be parameterized as a common particle type for numerical modeling purposes (DeMott et al. 2014).
d. Precipitation scavenging
Precipitation scavenging of aerosols and sea-salt particles in RAMS is dependent on the moments of each size spectra of precipitating liquid species (i.e., drizzle and rain). Scavenging coefficients are computed separately for CCN, GCCN as well as the film, jet, and spume sea-salt modes. The scheme is based on empirical data (Slinn et al. 1983) linking scavenging coefficients to rainfall rates at every model grid cell (computed from the drizzle and raindrop spectra). This helps in the reduction of the uncertainty linked to drop-particle collision efficiencies.
e. GEOS-Chem
Long range transported aerosol (both anthropogenic and natural sources) and dust is simulated from the GEOS-Chem model v9.02 (http://geos-chem.org; Bey et al. 2001). GEOS-Chem is a chemical transport model which uses assimilated meteorological data from the NASA Goddard Earth Observation System (GEOS) version 5. The aerosol simulation in the GEOS-Chem includes the sulfate-nitrate-ammonium system (Park et al. 2004; 2006), carbonaceous aerosol (Park et al. 2003; Liao et al. 2007). Sea-spray emissions are estimated using the Clarke et al. (2006) scheme, and dust emissions are estimated using the Ginoux et al. (2001) scheme. Both wet and dry depositions are included (Liu et al. 2001) through washout and rainout. GEOS-Chem was run globally at 4° x 5° horizontal resolution with a nested simulation over North America at 0.5° x 0.667° horizontal resolution. Both simulation domains have 47 vertical levels. GEOS-Chem was run with a spin-up of about 1 month.
The smallest size bin of dust, DST1 (0.1-1 microns) is introduced into the RAMS code. The appropriate modifications have been done in the microphysics subroutine and new subroutines have been added to read dust into RAMS. Dr. Jeffery Pierce of Colorado State University ran GEOS-Chem and provided the output data. The data obtained is post processed by using the panoply software, obtained from NASA (http://www.giss.nasa.gov/tools/panoply/). Standard GEOS-Chem simulations include ~60 gas and aerosol-phase species. The aerosol species simulated are sulfate, nitrate, ammonium, hydrophobic organics, hydrophilic organics and dust. Emissions of gases and aerosols are discussed in Wainwright et al. (2012). Aerosols introduced into RAMS are 3 lumped species: inorganic species, hydrophilic organics and hydrophobic organics. The concentrations of these species in RAMS are nudged from aerosol concentrations in GEOS-CHEM. The pollution aerosol data that has been taken from the GEOS-Chem model consists of 13 different species. The aerosol data consist of a sum of hydrophobic and hydrophilic black carbon and organic aerosol, hydrophilic organics which consists of SOAs (secondary organic aerosol). The inorganic aerosol consists of the sum of nitrate, sulfate and ammonium and has a characteristic kappa-value of 0.6. The hygroscopic organic aerosols contain (hydrophilic black carbon, hydrophilic organic carbon and the five SOA species) and have a kappa-value of 0.12. The hydrophobic aerosols (hydrophobic black carbon and hydrophobic organic carbon) have a kappa-value of 0.0. The seasonal average variation of dust and pollution aerosol concentration has been plotted in Figure 2 and 3.
4. RAMS dynamic model setup
The Colorado State University (CSU) Regional Atmospheric Modeling System (RAMS) version 6.0 is used. Table 1 summarizes the features of the RAMS setup for this study. Figure 5 shows the grid configuration used. The outermost grid, Grid 1 has 36 km grid spacing and consists of almost all of North America. Grid 2 is displayed in the blue color and has a grid spacing of 12 km. The innermost grid is Grid 3, displayed in red with a grid spacing of 3 km. The topography of the domain is displayed in Figure 6. The 32km North American Regional Reanalysis (NARR) (Mesinger et al. 2006), was used for model initialization and boundary nudging of the geopotential height, temperature, relative humidity, and winds on grid-1 and the radiative boundary condition of Klemp and Wilhelmson (1978) was applied to the lateral boundaries. RAMS has an upper boundary condition that acts as a rigid lid, with a wave absorbing high-viscosity layer aloft used in the top most model levels to absorb gravity waves by nudging to large-scale analysis or initial conditions (Cotton et al. 2003).
We examine the cumulative effect of dust and pollution aerosol acting as cloud nucleating aerosol (CCN, GCCN, IN) over the entire Colorado Rocky Mountains for the months of October 2004 to mid- April 2005 (Water Year 2005). We differ from Saleeby et al. (2011), by choosing months covering the entire snow year. The entire winter season analysis provides a range of seasonal conditions, snowfall totals and variability in dust production and anthropogenic aerosol. The clean background runs had the non-anthropogenic sources of aerosol pollution and the dirty runs had the anthropogenic sources of aerosol and both GEOS-Chem and RAMS dust sources were activated. We consider dust sources to be present in the non-anthropogenic control run as well as the anthropogenic source run. This is done because, while anthropogenic sources of dust occur, they tend to be less than non-anthropogenic sources (Huang et al. 2015). Thus, the model was run for 6.5 months starting on October 1st and ending on April 20th. The local dust sources were turned ON from RAMS dust model as well as the dust from the GEOS-Chem was also turned ON and nudged into the RAMS. This was for the representation of both coarse (local dust sources) and the fine mode dust particles (long range transport). The clean background or non-anthropogenic sources of aerosol pollution were then compared to a run having anthropogenic sources of aerosol and both GEOS-Chem and RAMS dust sources.
5. Results
Simulations for a period of 6 months were run for the entire region and the runs were re-initialized for each 10-day period. Each of the individual ten-day periods was analyzed separately (Table 2). Table 2 presents the difference in precipitation divided over 20 periods over the duration of 6.5 months of simulation. Each period is run for 10 days and it starts on Oct 2nd 2005 and ends on April 22nd 2016, which is the end of snow year.
The Colorado River basin comprises 71 different basins (Fig. 7). Figure 8 shows the difference in the integral mass of precipitation for both regions, with the red line signifying the Atlantic divide in the map. We have included dust in the clean run, which led to a net reduction in domain total integral winter-season precipitation of 2.56 % for the Grid 3 and 2.1 % for the CRB compared to the run with no anthropogenic aerosol sources (Fig. 9). This was due to the fact, that although dust increases precipitation, aerosol pollution acting as CCN outweighs the impact of increase by dust acting as IN. The shift in precipitation with respect to different river basins has been shown in Figure 10 in percentage change. Anthropogenic pollution can lead to a total winter-season precipitation loss of 5,380,00 acre-feet of water for CRB (Fig.11).
The 500-hPa geopotential height fields display zonal flow over Colorado and southwesterly flow over the Southwest part of the state and an averaged trough condition is seen offshore southern California (Fig. 12). From the geopotential height anomaly field, there is a greater persistence in 2005 for low pressure systems over the Southwest (Fig. 13). It is evident from the relative humidity fields that 2005 water year (WY) was a moist year (Fig. 14). The mean height field and moisture patterns support the tendency for heavy snowfall in 2005 with higher precipitation in southwest Colorado region. These synoptic conditions have an important impact on the snowfall variation and can affect the response of these cloud systems in terms of precipitation changes due to dust and aerosol pollution.
6. Snotel observation and comparisons
All numerical models are subject to different degrees of variability and their predictions are limited by this factor (Wetzel et al. 2004). The time series of the Snow Water Equivalent (SWE) for the seasonal trend of precipitation was compared with Snotel site observational measurements. We selected Snotel sites closest to RAMS grid points and made comparisons with a group of Snotel sites in the north CRB and another group in the south CRB (Fig. 15, 16). RAMS tends to over-predict precipitation in most of the cases. However, in some cases there were instances of under-prediction by RAMS as well. The Upper San Juan Snotel site (lat: 37.49, lon: -106.84) measured the highest precipitation and Summit Ranch (SRH) (lat: 39.43; lon: -106.9) measured the lowest precipitation. The snotel sites (the stations have been marked in Fig. 10) that we have used for comparison are Berthoud Summit (BST), Summit Ranch (SRH), Overland Res. (OLR), Medona Pass (MDP), Sharkstooth (STH), Upper San Juan (USJ) Lily Pond (LPD) and South Colony (SCL). Saleeby and Cotton (2005, 2008) demonstrated that the CSU RAMS performs rather well in winter snowfall prediction for individual cases over the Park Range with a tendency for over-prediction in some individual events (Saleeby et al. 2010). The variability might be attributed to location of the grid cells and the abrupt terrain change between grid cells. Hence it is important to well represent the terrain in the sigma Z terrain following system (Saleeby et al. 2010). RAMS in general, does a fair job of predicting the precipitation. The differences in plots are because of the differences in location of Snotel sites. Some of the Snotel sites have a lapse in observation on days when the instruments become covered by snow and sometimes there is blowing over of snow by high wind events which might result in RAMS appearing to over-predict.
7. Discussion
Although dust acting as IN tends to increase precipitation for individual events; the total precipitation change over the season is largely ruled by aerosol pollution, while dust has an opposing impact. It was found that the simulations with anthropogenic pollution resulted in a net reduction of precipitation by 2.56 % for the Grid 3 and a decrease in 2.1 % for the CRB compared to the run with no anthropogenic aerosol sources. This corresponds to total winter-season precipitation loss due to anthropogenic pollution of 5,380,00 acre-feet of water for the 6.5 months of simulation for the CRB. This can be considered our “best estimate” of the effects of aerosol pollution on precipitation over the CRB for the 2004-2005 snow year. To put this in perspective, this loss of precipitation corresponds to roughly 72% of the total allocated water resources for the upper Colorado River Basin in the 1922 Colorado River Compact.
The results of the season-long simulations are very sensitive to the details of the microphysics models. Earlier simulations using Kohler theory and the DeMott et al. (2010) IN parameterization exhibited almost no effects of aerosol pollution and dust (they counter-acted each other). Thus, relatively modest variations in CCN activation schemes and IN activation schemes can alter the results appreciably. Sensitivity studies have been performed to analyze the impact of changing dust and aerosol ratios on precipitation in the Colorado River Basin (Jha et al. 2017). The dust is varied from 3 to 10 times in the experiments and the response is found to be non-monotonic and depends on various environmental factors.
8. Acknowledgements
This work was supported by the National Science Foundation Division of Atmospheric Sciences grant AGS 1138896 and I am grateful to NSF for this opportunity. I want to thank Dr. Jeffrey Pierce of Colorado State University for providing the GEOS-Chem data. I would also like to thank Dr. Steve Rutledge and Dr. Jorge Ramirez for being on my PhD committee and providing valuable inputs.
Appendix 1
The adsorption theory
Kumar et al. (2009) found that FHH (Frenkel, Halsey and Hill) adsorption activation theory is a far more suitable framework for describing fresh dust CCN activity than Kohler theory, based on the observed dependence of critical supersaturation, sc, with particle dry diameter, Ddry. “For insoluble CCN activating according to FHH-AT, the equilibrium supersaturation of the droplet, equation is given by:
seq=exp4σMwRTρwDp-AFHHDp-Ddry2DH2O-BFHH-1
(Equation A1)
where σ is the CCN surface tension at the point of activation (Pruppacher and Klett 1997), Ddry is the dry CCN diameter, DH2O is the diameter of water molecule equal to 2.75 A ̊ (Kumar et al. 2009), and AFHH and BFHH are adsorption parameters constrained from the activation experiments.” The CCN activation curves for dry generated dust are shown in Figure 3 (Kumar et al. 2011). A simple weighting function was implemented wherein for kappa less than say 0.05 the full weight is given to the adsorption parameterization, and for kappa greater than, 0.1, zero weight is given to the adsorption parameterization and full weight given to kappa. Thus, there is a smooth transition between those regimes. Owing to their low hygroscopicity and large size, dust particles exhibit a long adsorption time scale to reach their critical supersaturation (Sc). Therefore, we adopt the parameterization of Kumar et al. (2009; 2011) to represent adsorption effects for dust. This can result in up to 40% lower droplet concentrations than predicted by standard Kohler theory (Kumar et al. 2009). We consider an external mixture of pollution aerosols, dust, and sea-spray generated sea salt, although variable sea-spray aerosols is not a focus of this study.
References
Borys, R. D., D. H. Lowenthal, S. A. Cohn, and W. O. J. Brown, 2003: Mountaintop and radar measurements of anthropogenic aerosol effects on snow growth and snowfall rate. Geophys. Res. Lett., 30, 1538.
Borys, R. D., D. H. Lowenthal, and D. L. Mitchell, 2000: The relationships among cloud microphysics, chemistry, and precipitation rate in cold mountain clouds. Atmos. Environ., 34, 2593–2602.
Clarke, A. D., S. R. Owens, and J. Zhou, 2006: An ultrafine sea-salt flux from breaking waves: implications for cloud condensation nuclei in the remote marine atmosphere. J. Geophys Res., 111, D06202, doi:10.1029/2005JD006565.
Cotton, W. R., and Coauthors, 2003: RAMS 2001: Current status and future directions. Meteor. Atmos. Phys., 82, 5–29.
Cotton, W. R., and R. A. Pielke, 2007: Human impacts on weather and climate. Cambridge University Press, 330 pp.
DeMott, C. A., C. Stan, D. A. Randall, and M. D. Branson, 2014: Intraseasonal variability in coupled GCMs: The roles of ocean feedbacks and model physics. J. Climate, 27, 4970–4995.
DeMott, P. J., M. D. Petters, A. J. Prenni, C. M. Carrico, S. M. Kreidenweis, J. L. Collett, and H. Moosmuller, 2009: Ice nucleation behavior of biomass combustion particles at cirrus temperatures. J. Geophys. Res., 114, D16205, doi: 10.1029/2009jd012036.
DeMott, P. J., A. J. Prenni, X. Liu, M. D. Petters, C. H. Twohy, M. S. Richardson, T. Eidhammer, S. M. Kreidenweis, and D. C. Rogers, 2010: Predicting global atmospheric ice nuclei distributions and their impacts on climate. P. Natl. Acad. Sci. USA, 107, 11217–11222.
DeMott, P. J., K. Sassen, M. R. Poellot, D. Baumgardner, D. C. Rodgers, S. D. Brooks, A. J. Prenni, and S. M. Kreidenweis, 2003: African dust aerosols as atmospheric ice nuclei. Geophys. Res. Lett., 30, 1732, doi:10.1029/2003GL017410.
Feingold, G., and A. J. Heymsfield, 1992: Parameterizations of condensational growth of droplets for use in general circulation models. J. Atmos. Sci., 49, 2325–2342.
Feingold, G., S. M. Kreidenweis, and Y. Zhang, 1998: Stratocumulus processing of gases and cloud condensation nuclei: Part I: trajectory ensemble model. J. Geophys. Res., 103, 19527–19542.
Gagin, A., 1965: Ice Nuclei, their physical characteristics and possible effect on precipitation initiation. Proc. Int. Conf. On Cloud Physics, Tokyo and Sapporo, Japan, 155-162.
Ginoux, P., M. Chin, I. Tegen, J. M. Prospero, B. Holben, O. Dubovik, and S. J. Lin, 2001: Sources and distributions of dust aerosols simulated with the GOCART model. J. Geophys. Res., 106, 20255–20274.
Harrington, J. Y., 1997: The effects of radiative and microphysical processes on simulated warm and transition season Arctic stratus. Ph.D. dissertation, Dept. of Atmospheric Science, Colorado State University, 289 pp.
Heymsfield, A. J., and R. M. Sabin, 1989: Cirrus crystal nucleation by homogeneous freezing of solution droplets. J. Atmos. Sci., 46, 2252–2264.
Huang, J. P., J. J. Liu, B. Chen, and S. L. Nasiri, 2015: Detection of anthropogenic dust using CALIPSO lidar measurements. Atmos. Chem. Phys., 15, 11653-11665.
Hung, H. M., A. Malinowski, and S. T. Martin, 2003: Kinetics of heterogeneous ice nucleation on the surfaces of mineral dust cores inserted into aqueous ammonium sulfate particles. J. Phys. Chem., 107, 1296-1306.
Isono, K., M. Komabayasi, and A. Ono, 1959: Volcanoes as a source of atmospheric ice nuclei. Nature, 183, 317-318.
Jha V., W. R. Cotton, G. G. Carrió, and R. Walko, 2017: A study on the impact of dust and aerosol pollution on precipitation in the Colorado River Basin: Seasonal Precipitation Estimates (in preparation).
Kain, J. S., and J. M. Fritsch, 1993: Convective parameterization for mesoscale models: The Kain–Fritsch scheme., The Representation of Cumulus Convection in Numerical Models, Meteor. Monogr., No. 24, Amer. Meteor. Soc., 165–170.
Klemp, J. B., and R. B. Wilhelmson, 1978: Simulations of right-and left-moving storms produced through storm-splitting. J. Atmos. Sci., 35, 1097-1110.
Kumar P., I. N. Sokolik, and A. Nenes, 2011: Measurements of cloud condensation nuclei activity and droplet activation kinetics of wet processed regional dust samples and minerals. Atmos Chem Phys., 11,8661–8676, doi:10.5194/acp-11-8661-2011.
Kumar, P., A. Nenes, I. N., and Sokolik, 2009: Importance of adsorption for CCN activity and hygroscopic properties of mineral dust aerosol. Geophys. Res. Lett., 36, L24804.
Lerach, D. G., 2012: Simulating Southwestern U.S. desert dust influences on severe, tornadic storms. PhD dissertation, Dept. of Atmospheric Sciences, Colorado State University, pp. 353.
Lerach, D. G., S. A. Rutledge, C. R. Williams, and R. Cifelli, 2010: Vertical Structure of Convective Systems during NAME 2004. Mon. Wea. Rev., 138, 1695-1714.
Levin, Z., E. Ganor, and V. Gladstein, 1996: The effects of desert particles coated with sulfate on rain formation in the eastern Mediterranean. J. App. Meteor., 35, 1511-1523.
Liao H., D. K. Henze, J. H. Seinfeld, S. Wu, and L. J. Mickley, 2007: Biogenic secondary organic aerosol over the United States: Comparison of climatological simulations with observations. J. Geophys. Res., 112, D06201, doi:10.1029/2006JD007813.
Liu, H., D. J. Jacob, I. Bey, and R. M. Yantosca, 2001: Constraints from 210Pb and 7Be on wet deposition and transport in a global three-dimensional chemical tracer model driven by assimilated meteorological fields, J. Geophys. Res., 106, 12,109-12,128.
Marticorena, B. and G. Bergametti, 1995: Modeling the atmospheric dust cycle: 1-design of a soil derived dust production scheme. J. Geophys. Res., 100, 16,415–16,430.
Mellor, G. L., and T. Yamada, 1974: A hierarchy of turbulence closure models for planetary boundary layers. J. Atmos. Sc., 31, 1791-1806.
Mesinger, F., and Coauthors, 2006: North American regional reanalysis. Bull. Am. Meteorol. Soc., 87, 343–360.
Muhlbauer, A., and U. Lohmann, 2009: Sensitivity studies of aerosol-cloud interactions in mixed-phase orographic precipitation. J. Atmos. Sci., 66, 2517-2538.
Neimand, M., and Coauthors, 2012: A Particle-Surface-Area-Based Parameterization of Immersion Freezing on Desert Dust Particles. J. Atmos. Sci., 69, 3077-3092.
Park, R. J., D. J. Jacob, B. D. Field, R. M. Yantosca, and M. Chin, 2004: Natural and transboundary pollution influences on sulfate-nitrate-ammonium aerosols in the United States: implications for policy, J. Geophys. Res., 109, D15204, 10.1029/2003JD004473.
Park, R. J., D. J. Jacob, M. Chin, and R. V. Martin, 2003: Sources of carbonaceous aerosols over the United States and implications for natural visibility. J. Geophys. Res., 108, 4355, doi:10.1029/2002JD003190.
Park, R. J., D. J. Jacob, N. Kumar, and R. M. Yantosca, 2006: Regional visibility statistics in the United States: natural and transboundary pollution influences, and implications for the Regional Haze Rule. Atmos. Environ., 40, 5405–5423.
Prospero, J. M., 1999: Long-term measurements of the transport of African mineral dust to the southeastern United States: Implications for regional air quality. J. Geophys. Res., 104, 15917–15927.
Pruppacher, H. R., and J. D. Klett, 2010: Microphysics of Clouds and Precipitation. Springer, pp. 954, doi:10.1007/978-0-306-48100-0.
Roberts, P., and J. Hallett, 1968: A laboratory study of ice nucleating properties of some mineral particulates. Q. J. R. Meteorol. Soc., 94, 25-34.
Saleeby, S. M., S. C. W. Berg, S. C. van den Heever, and T. Lecuyer, 2010: Impact of cloud-nucleating aerosols in cloud-resolving model simulations of warm-rain precipitation in the East China Sea. J. Atmos. Sci., 67, 3916-3930.
Saleeby, S. M., and W. R. Cotton, 2004: A large droplet mode and prognostic number concentration of cloud droplets in the Colorado State University Regional Atmospheric Modeling System (RAMS). Part I: Module descriptions and supercell test simulations. J. Appl. Meteor., 43, 182-195.
Saleeby, S. M., and W. R. Cotton, 2005: A large droplet mode and prognostic number concentration of cloud droplets in the Colorado State University Regional Atmospheric Modeling System (RAMS). Part II: Sensitivity to a Colorado winter snowfall event. J. Appl. Meteor., 44, 1912-1929.
Saleeby, S. M., and W. R. Cotton, 2008: A binned approach to cloud‐droplet riming implemented in a bulk microphysics model. J. Appl. Meteorol., 47, doi:10.1175/2007JAMC1664.1.
Saleeby, S. M., W. R. Cotton, D. Lowenthal, 2011: Impact of aerosols on the microphysical processes with an orographic cloud environment. AMS Annual Meeting, Seattle, WA.
Saleeby, S. M., W. R. Cotton, D. Lowenthal, R. D. Borys, and M. A. Wetzel, 2009: Influence of cloud condensation nuclei on orographic snowfall. J. Appl. Meteor. Clim., 48, 903-922.
Sassen, K., P. DeMott, J. Prospero, and M. Poellot, 2003: Saharan dust storms and indirect aerosol effects on clouds: Crystal-face results. Geophys. Res. Lett., 30, 1633, doi:10.1029/2003GL017371.
Schaefer, M. B., 1954: Some aspects of the dynamics of populations, important for the management of the commercial marine fisheries. Inter. Am. Trop. Tuna Comm. Bull., 1, 27-56.
Schaefer, V. J., 1949: The formation of ice crystals in the laboratory and the atmosphere. Chem. Rev., 44, 291-320.
Slinn, W. G. N., 1983: Precipitation scavenging. Atmospheric Sciences and Power Production, D. Randerson, Ed., 1984. Div. of Biomedical Environ. Res., U.S. Dep. of Energy, Washington, D. C., 57–90.
Smagorinsky, J., 1963: General circulation experiments with the primitive equations, i. the basic experiment. Monthly Weather Rev., 91, 99-164.
Smith, J. D. T., and Coauthors, 2007: The Mid-Infrared Spectrum of Star-forming Galaxies: Global Properties of Polycyclic Aromatic Hydrocarbon Emission. Astrophys. J., 656, 770.
Stokowski, D. M., 2005: The addition of the direct radiative effect of atmospheric aerosols into the regional atmospheric modeling system (RAMS). M.S. thesis, Colorado State University, Department of Atmospheric Science, Fort Collins, CO.
Tegen, I., and I. Fung, 1994: Modeling of mineral dust in the atmosphere: Sources, transport and optical thickness. J. Geoph. Res., 99, 22897-22914.
Tobo, Y., A. J. Prenni, P. J. DeMott, J. A. Huffman, C. S. McCluskey, G. Tian, C. Pöhlker, U. Pöschl, and S. M. Kreidenweis, 2013: Biological aerosol particles as a key determinant of ice nuclei populations in a forest ecosystem. J. Geophys. Res.-Atmos., 118, 10100–10110, doi:10.1002/jgrd.50801, 2013.
Van den Heever, S. C., G. G. Carrió, W. R. Cotton, and P. J. DeMott, 2006: Impacts of nucleating aerosol on Florida storms. Part I: Mesoscale simulations. J. Atmos. Sci., 63, 1752-1775.
Walko, R. L., and Coauthors, 2000: Coupled atmosphere-biophysics-hydrology models for environmental modeling. J. Appl. Meteor., 39, 931-944.
Wang, J., S. A. Christopher, U. S. Nair, J. S. Reid, E. M. Prins, J. Szykman, and J. L. Hand, 2006: Mesoscale modeling of Central American smoke transport to the United States: 1. top-down assessment of emission strength and diurnal variation impacts. J. Geoph. Res., 111.
Ward, D. S., and W. R. Cotton, 2010: Cold band transition season cloud condensation nuclei measurements in western Colorado. Atmos. Chem. Phys. Discuss., 10, C11358–C11361.
Wetzel, M. A., and Coauthors, 2004: Mesoscale snowfall prediction and verification in mountainous terrain. Wea. Forecasting, 19, 806–828.
Zuberi, B., A. Bertram, C. Cassa, L. Molina, M. Molina, 2002: Heterogeneous nucleation of ice in (NH4)2SO4-H2O particles with mineral dust immersions. Geophys. Res. Lett., 29, 1504
List of Figures
Figure 1: The Colorado River Basin (source: http: //www.usbr.gov/lc/region/programs/ crbstudy.html)
Figure 2: Concentration of aerosol for the entire season solid line- anthropogenic, dotted line – non-anthropogenic aerosol concentration
Figure 3: Concentration of dust for the entire season
Figure 4: Comparison of ice nucleation parameterization with cf =3 with the D10 parameterization for calculations in the mixed-phase cloud regime; Courtesy DeMott et al. 2014
Figure 5: The 3 grid configuration is shown here. Grid 1 has the 36 km grid spacing and comprises of the entire outer boundary in the map. Grid is 12 km and is shown in blue rectangle. Grid 3 is of 3 km spacing and is displayed in red rectangle
Figure 6: Topography of the region shown in contour for Grid 1
Figure 7: Map for the regions for different river basin Source: Steve Saleeby (personal communication)
Figure 8: Map for precipitation difference millimeters (mm) in both regions
Figure 9: Total accumulated precipitation (mm) for the grid 3. Snotel sites: BST: Berthoud Summit, SRH: Summit Ranch, OLR: Overland Res. STH: Sharkstooth, USJ: Upper San Juan, LPD: Lily Pond, SCL: South Colony
Figure 10: Map for precipitation difference (%) in both regions for different river basins
Figure 11: Total accumulated precipitation difference in mm
Figure 12: Composite 500-hPa geopotential height (m) from the NARR dataset for 1 Oct- Apr 2005
Figure 13: Composite 500-hPa geopotential height anomaly from the NARR dataset for 1 Oct- Apr 2005
Figure 14: 700-hPa RH anomaly (%) from the NARR dataset for 1 Oct- Apr 2005
Figure 15: Total accumulated precipitation comparison of RAMS with Snotel sites in the South Colorado River Basin for 7 months starting Oct 1st, 2004 and ending In April 19th, 2005 (SWE) in inches
Figure 16: Total accumulated precipitation comparison of RAMS with Snotel sites in the North Colorado River Basin for 7 months starting Oct 1st, 2004 and ending In April 19th, 2005 (SWE) in inches
Figure A1: CCN activation curves of different types.Symbols show experimentally determined CCN activity and lines show FHH adsorption activation fits. Error bars represent measurement uncertainty in Ddry. Also shown in black thick line is the κ =0, Kelvin curve. Black dashed line corresponds to κ = 0.05. (Figure taken from Kumar et al. 2009 with permissions).
Figures
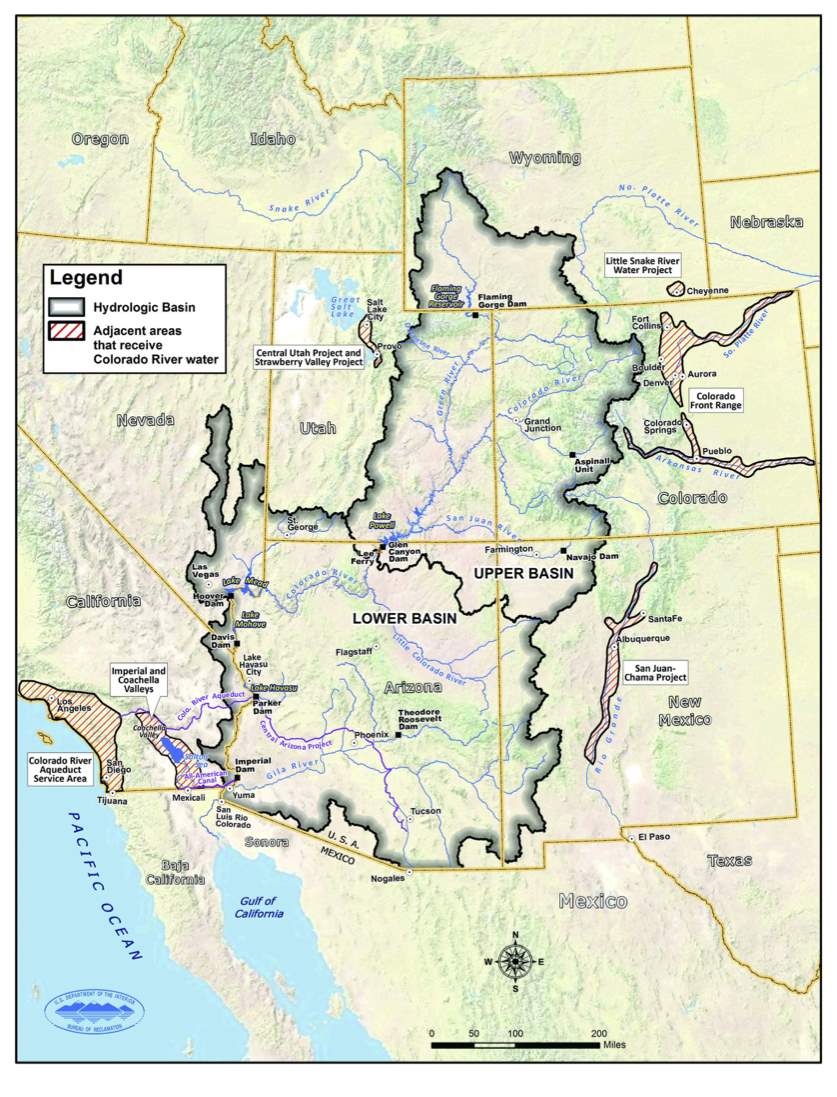
Figure 1: The Colorado River Basin (source: http: //www.usbr.gov/lc/region/programs/ crbstudy.html)
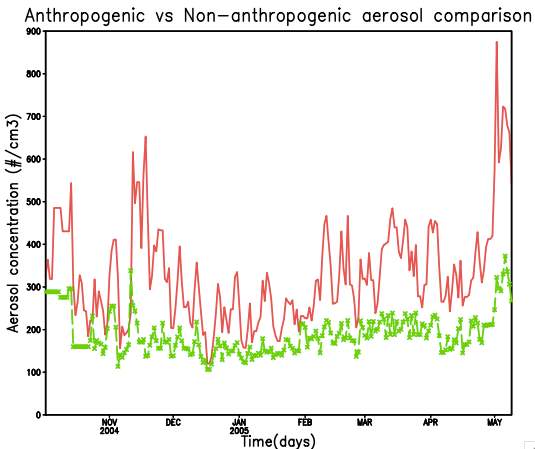
Figure 2: Concentration of aerosol for the entire season solid line- anthropogenic, dotted line – non-anthropogenic aerosol concentration
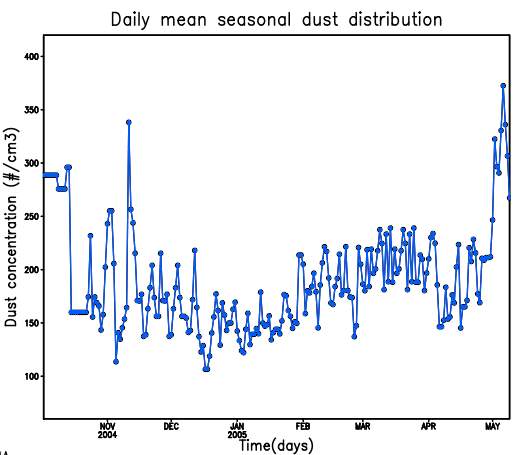
Figure 3: Concentration of dust for the entire season
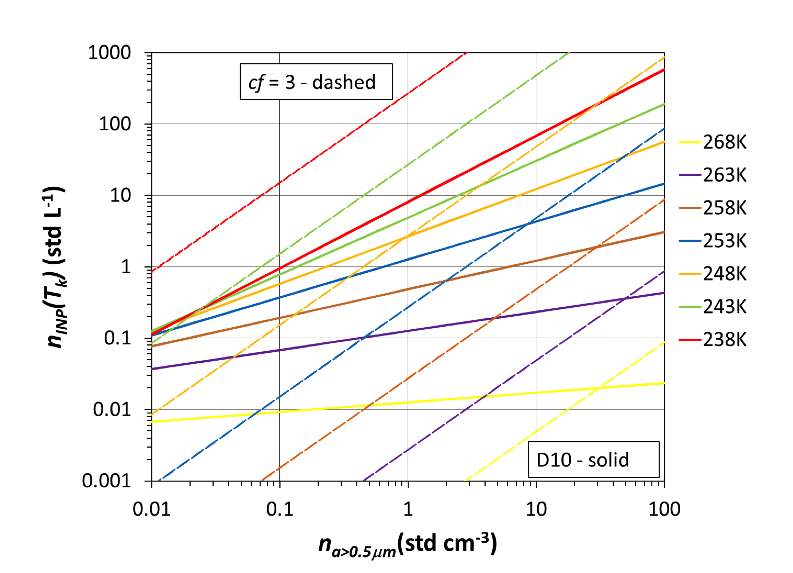
Figure 4: Comparison of ice nucleation parameterization with cf =3 with the D10 parameterization for calculations in the mixed-phase cloud regime; Courtesy DeMott et al. 2014
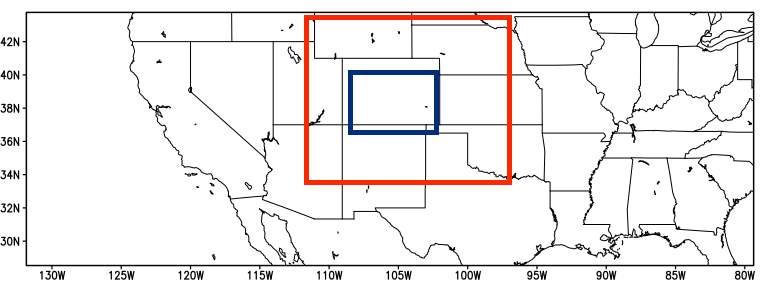
Figure 5: The 3 grid configuration is shown here. Grid 1 has the 36 km grid spacing and comprises of the entire outer boundary in the map. Grid is 12 km and is shown in blue rectangle. Grid 3 is of 3 km spacing and is displayed in red rectangle.
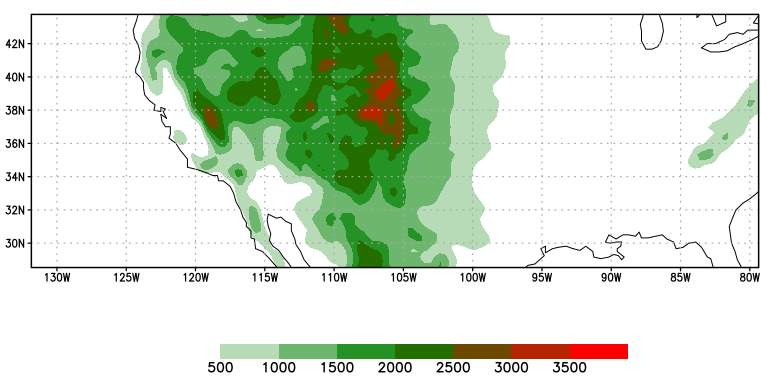
Figure 6: Topography of the region shown in contour for Grid 1.
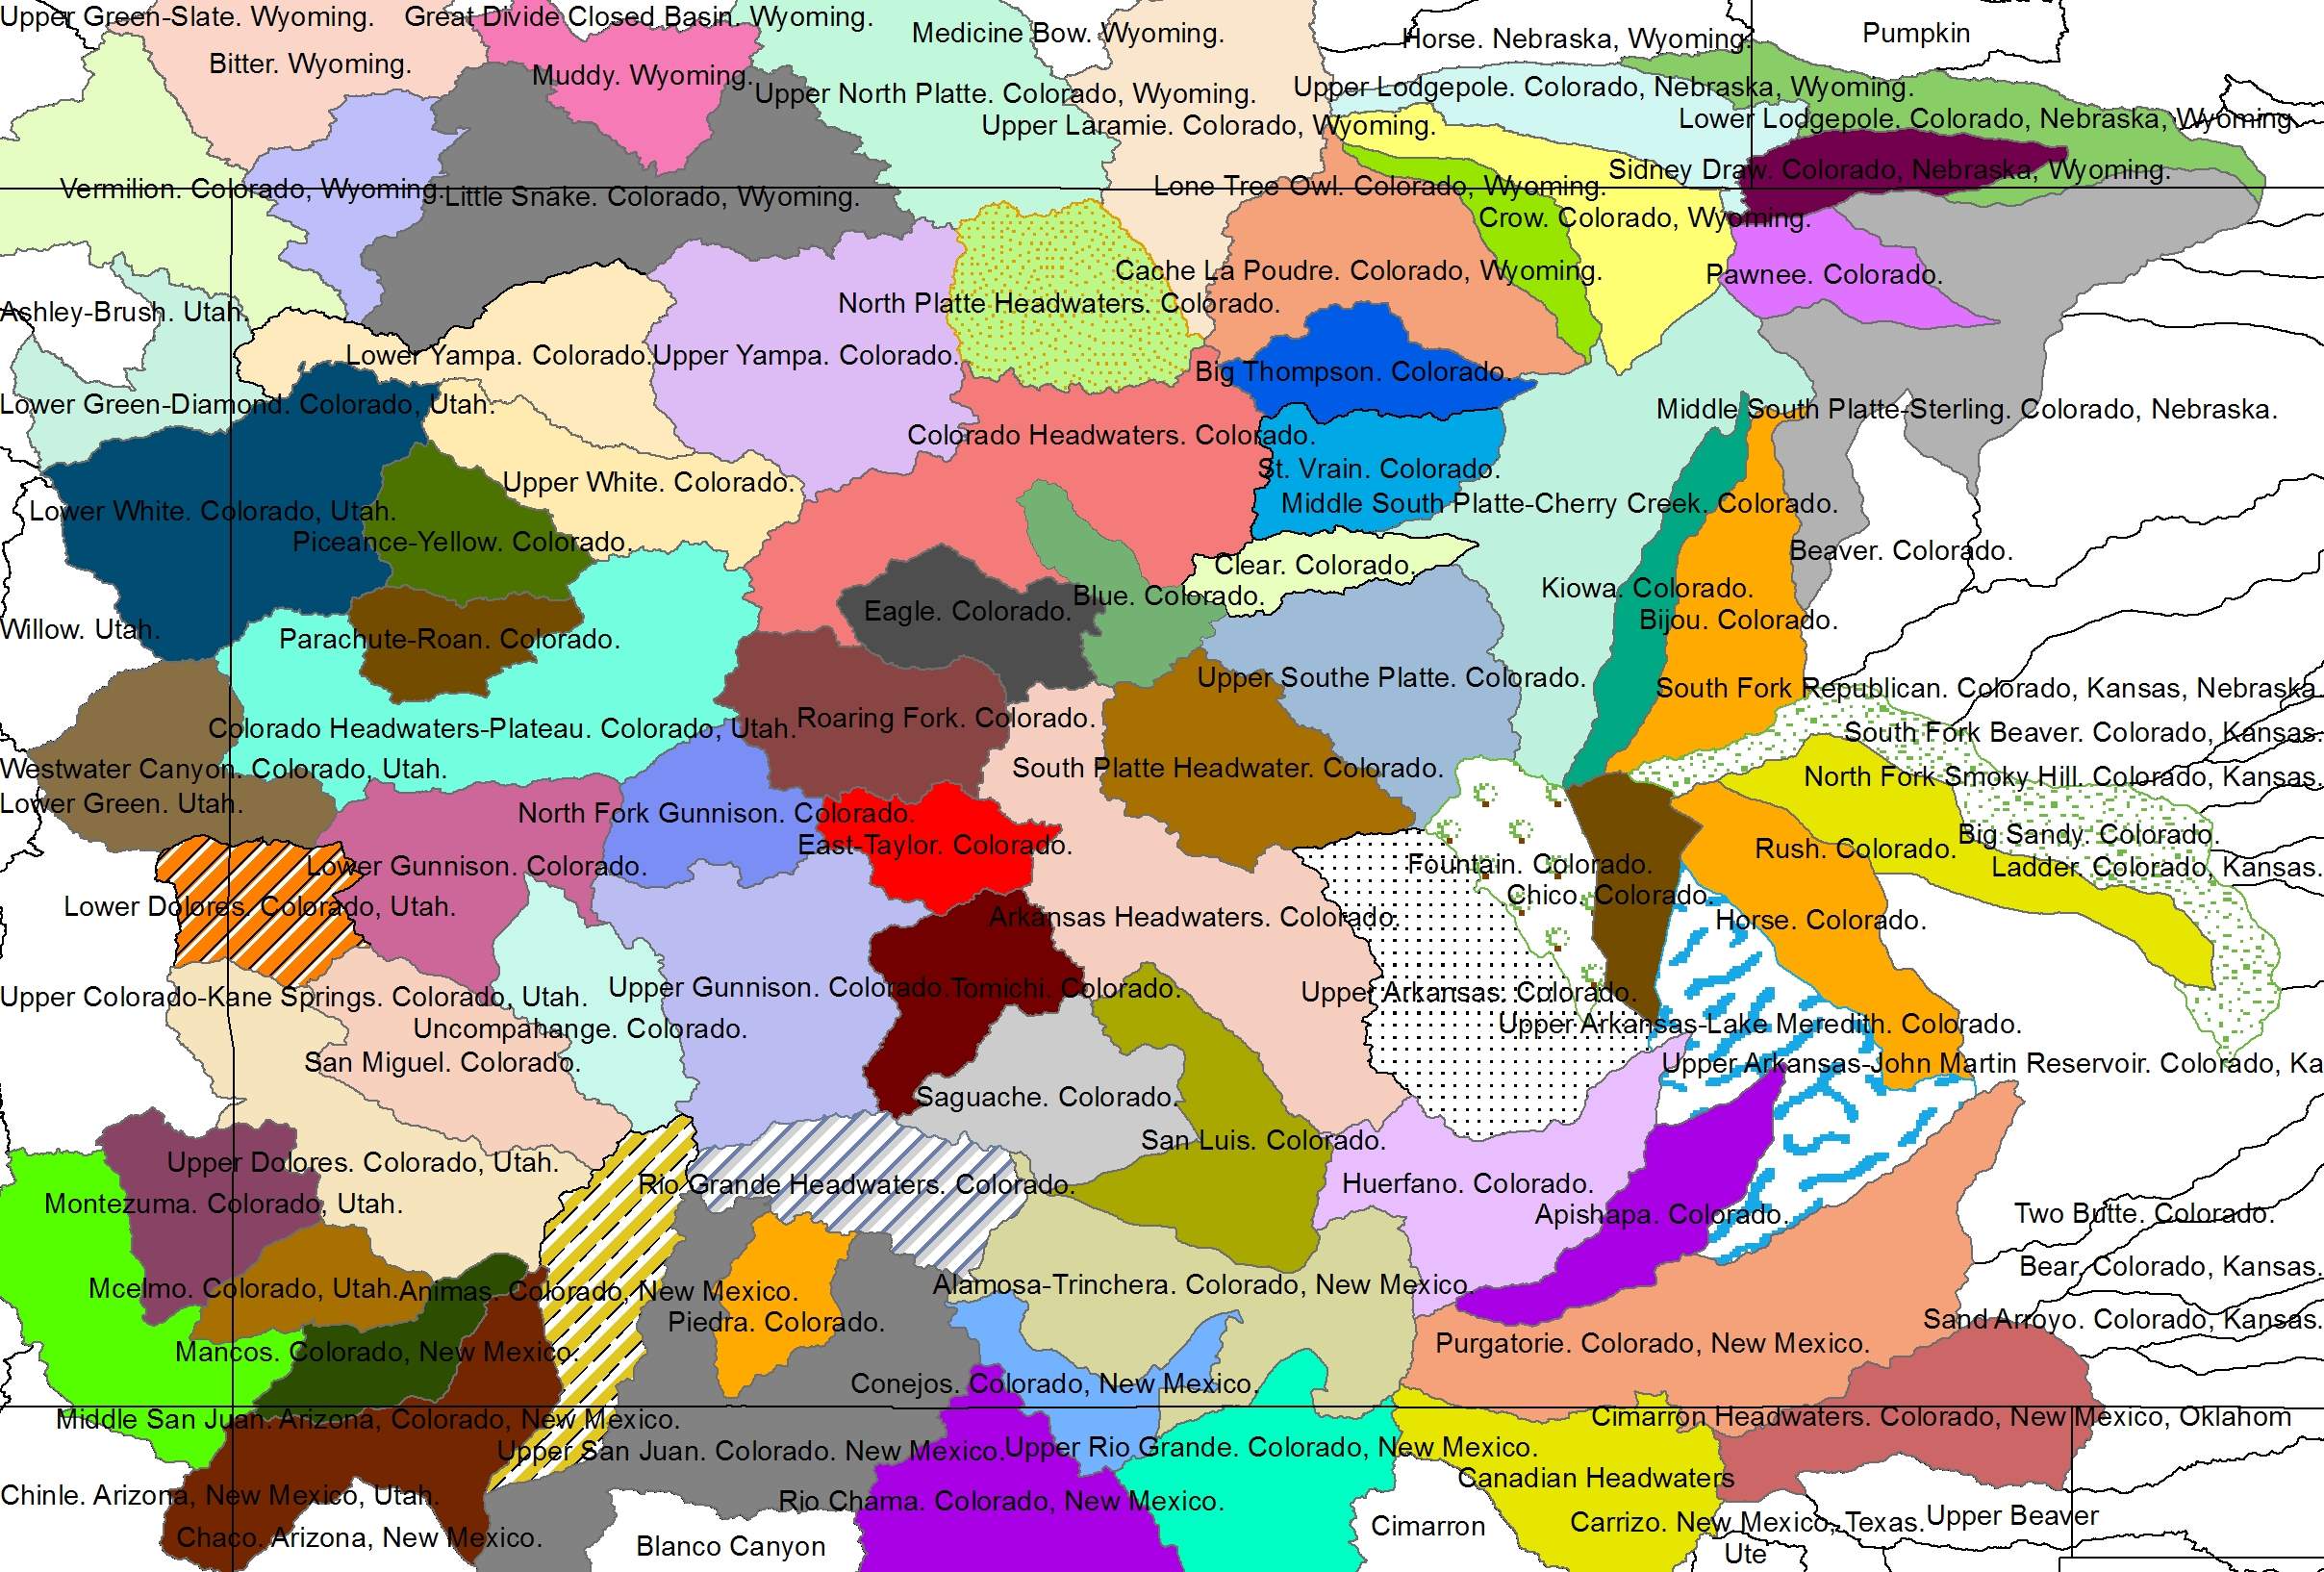
Figure 7: Map for the regions for different river basin Source: Steve Saleeby (personal communication).
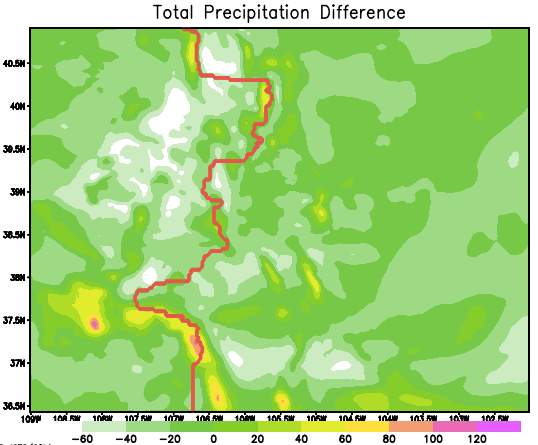
Figure 8: Map for precipitation difference millimeters (mm) in both regions
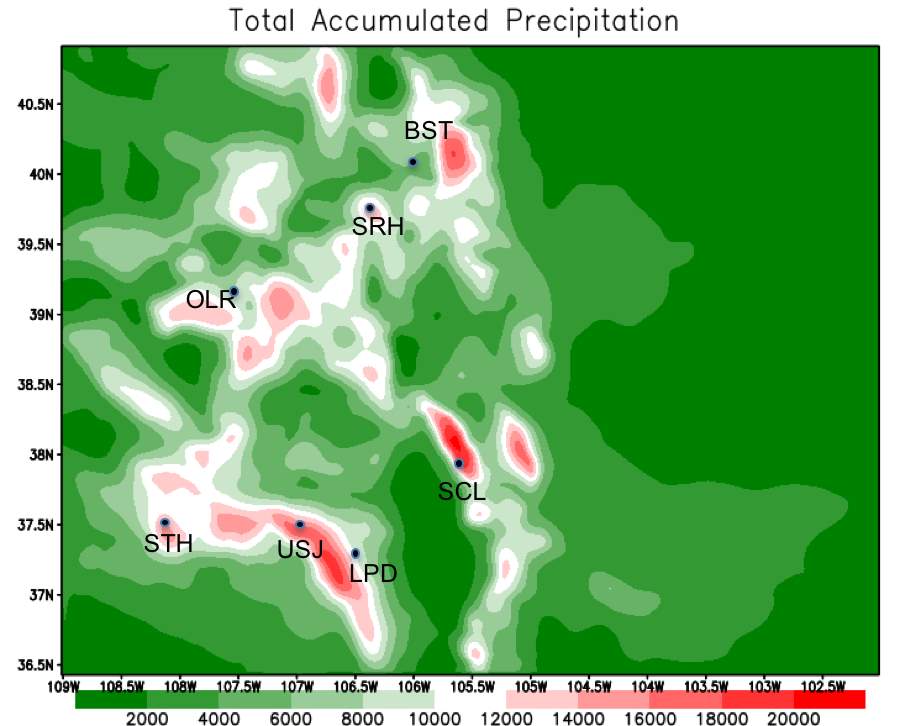
Figure 9: Total accumulated precipitation (mm) for the grid 3.
Snotel sites: BST: Berthoud Summit, SRH: Summit Ranch, OLR: Overland Res.
STH: Sharkstooth, USJ: Upper San Juan, LPD: Lily Pond, SCL: South Colony
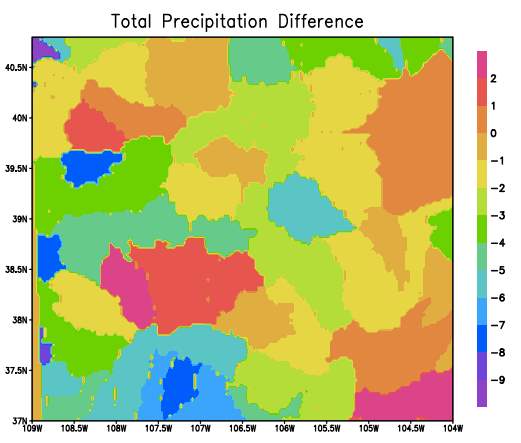
Figure 10: Map for precipitation difference (%) in both regions for different river basins
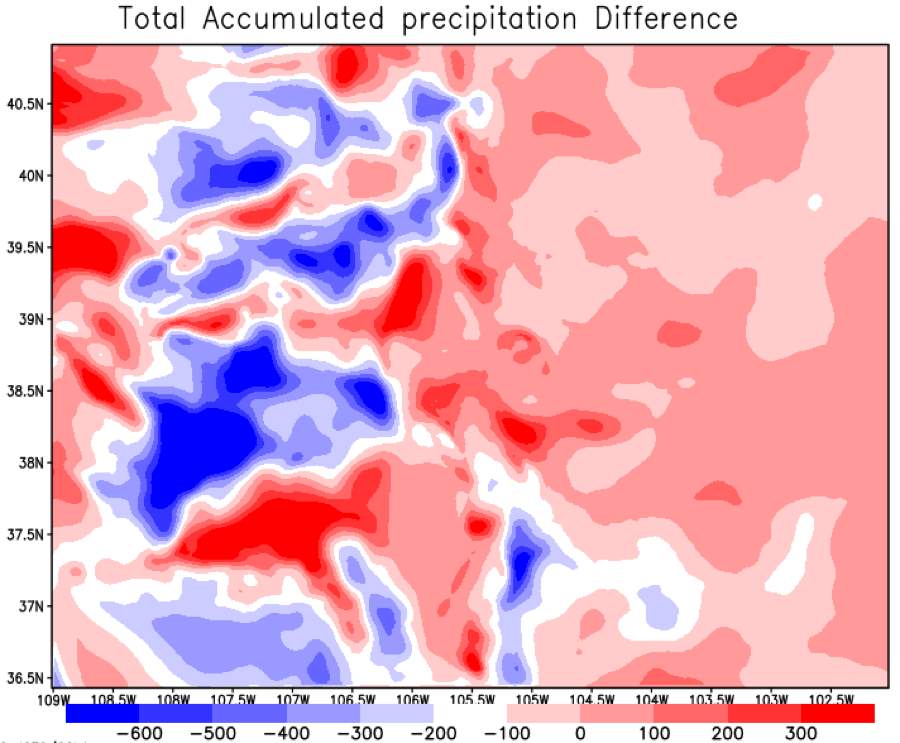
Figure 11: Total accumulated precipitation difference in mm
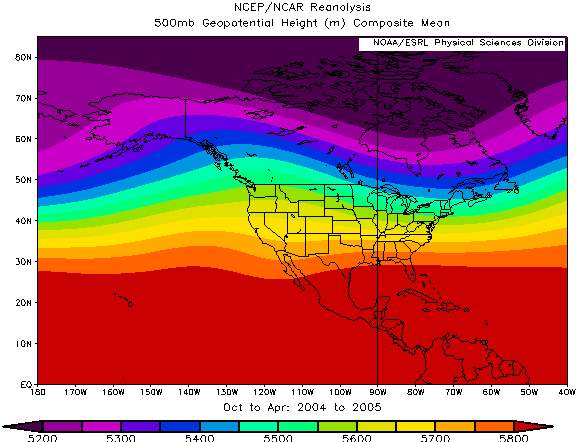
Figure 12: Composite 500-hPa geopotential height (m) from the NARR dataset for 1 Oct- Apr 2005
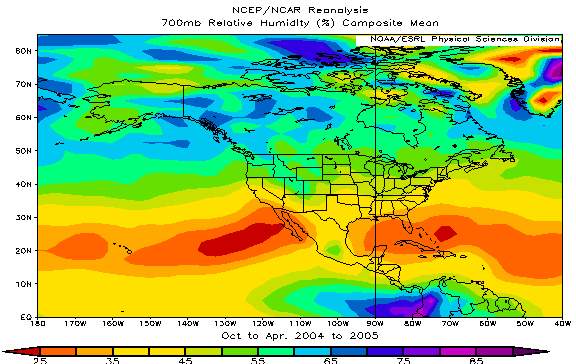
Figure 13: Composite 500-hPa geopotential height anomaly from the NARR dataset for 1 Oct- Apr 2005
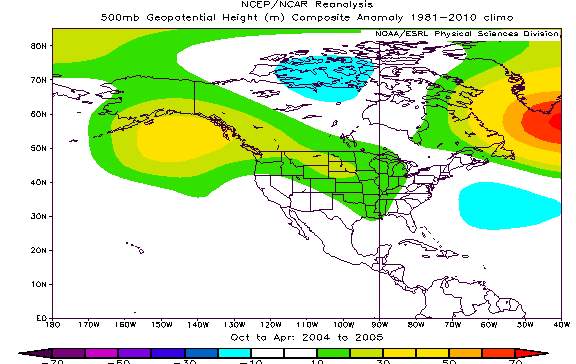
Figure 14: 700-hPa RH anomaly (%) from the NARR dataset for 1 Oct- Apr 2005
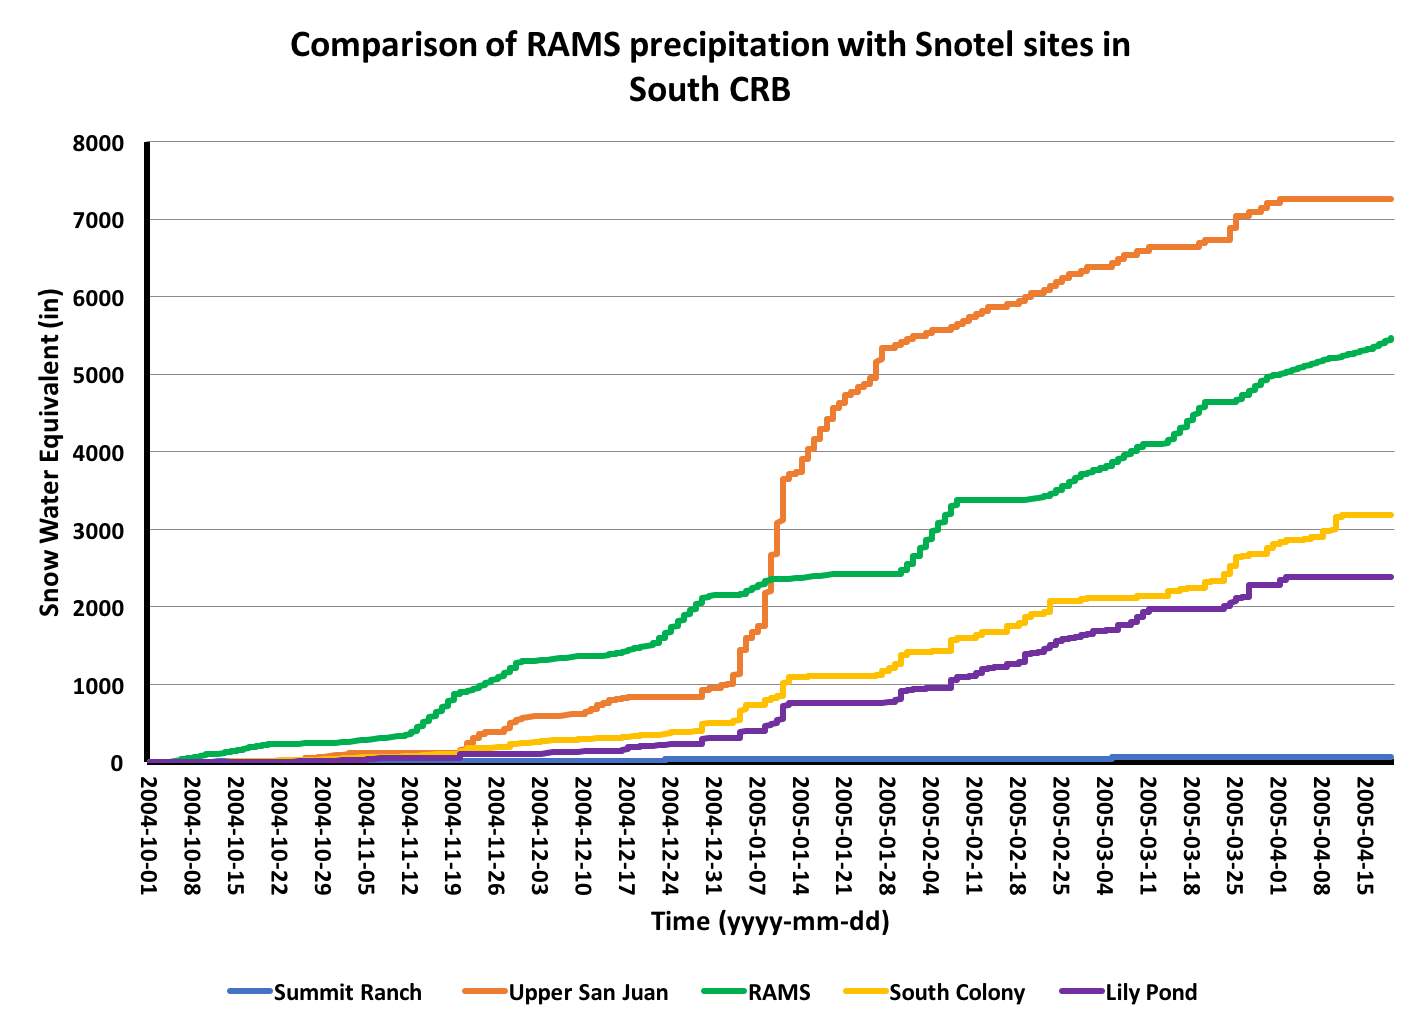
Figure 15: Total accumulated precipitation comparison of RAMS with Snotel sites in the South Colorado River Basin for 7 months starting Oct 1st, 2004 and ending In April 19th, 2005 (SWE) in inches
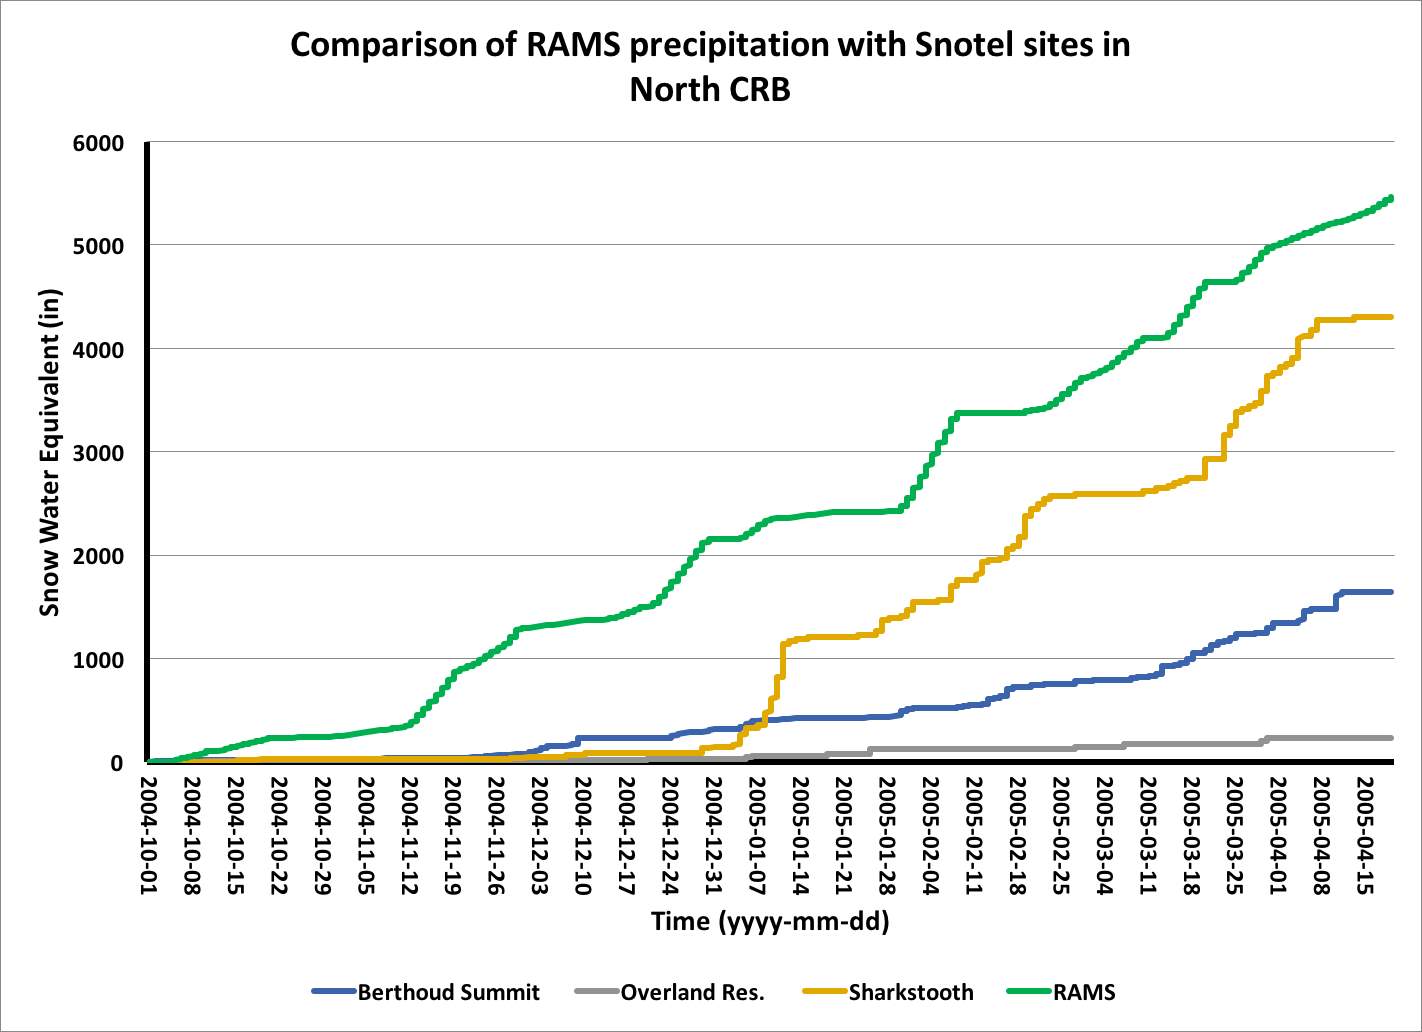
Figure 16: Total accumulated precipitation comparison of RAMS with Snotel sites in the North Colorado River Basin for 7 months starting Oct 1st, 2004 and ending In April 19th, 2005 (SWE) in inches
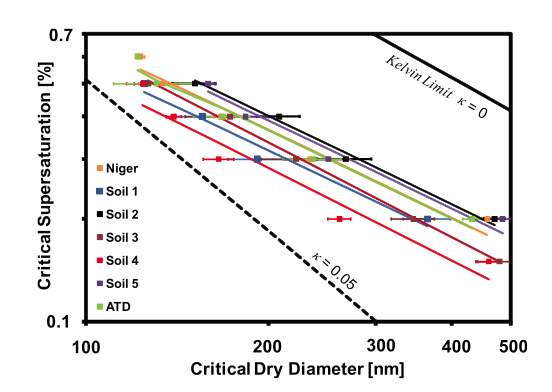
Figure A1: CCN activation curves of different types.Symbols show experimentally determined CCN activity and lines show FHH adsorption activation fits. Error bars represent measurement uncertainty in Ddry. Also shown in black thick line is the κ =0, Kelvin curve. Black dashed line corresponds to κ = 0.05. (Figure taken from Kumar et al. 2009 with permissions)
Table 1: RAMS model configuration
Table 2: Comparison of integrals precipitation per period
| Period | Clean*1012
(mm) |
Dirty*1012 (mm) | Difference (%) |
| 1 | 15.3 | 14.6 | -4.8 |
| 2 | 17.8 | 17.6 | -1.0 |
| 3 | 19.0 | 18.8 | -1.4 |
| 4 | 9.70 | 9.68 | -0.1 |
| 5 | 17.3 | 16.4 | -5.2 |
| 6 | 20.0 | 19.7 | -1.3 |
| 7 | 8.67 | 8.55 | -1.4 |
| 8 | 4.07 | 3.97 | -2.5 |
| 9 | 16.8 | 16.5 | 1.5 |
| 10 | 28.2 | 27.9 | -0.9 |
| 11 | 17.7 | 17.6 | -0.8 |
| 12 | 9.92 | 9.59 | -3.4 |
| 13 | 19.3 | 19.2 | -3.36E-02 |
| 14 | 12.4 | 11.8 | -4.4 |
| 15 | 25.7 | 25.2 | -2.1 |
| 16 | 11.7 | 10.9 | -6.2 |
| 17 | 17.4 | 17.2 | -0.5 |
| 18 | 26.0 | 25.4 | -1.6 |
| 19 | 11.7 | 11.5 | -2.5 |
| 20 | 14.3 | 13.2 | -8.5 |
Cite This Work
To export a reference to this article please select a referencing stye below:
Related Services
View allRelated Content
All TagsContent relating to: "Geology"
Geology is an “Earth science” or “geoscience” concerned with the study of the physical structure of the Earth (or other planetary body) and the rocks of which it is made, the processes that shaped it and its physical, chemical and biological changes over time.
Related Articles
DMCA / Removal Request
If you are the original writer of this dissertation and no longer wish to have your work published on the UKDiss.com website then please:


