Antimicrobial Susceptibility Test Methods
Info: 4949 words (20 pages) Dissertation
Published: 9th Dec 2019
Tagged: Microbiology
Table of Contents
- Introduction 1
2. Current – Growth Dependent AST Methods 1
2.1 Diffusion 1
2.2 Broth Dilution 2
2.3 Automated Methods 3
3. Rapid AST Methods 4
3.1 Dielectric Impedance 4
3.2 Micro-Cantilever Deflection 5
3.3 Piezoelectric Plate Sensor 5
4. Preliminary Results 8
4.1 Sensor Fabrication 8
4.2 Bacteria Testing 8
5. Future Work 9
- Introduction
Rapid determination of drugs effective against bacterial strains is critically important to stopping further spread of an infection and reducing antibiotic resistant bacteria strains2. Due to antibiotic resistance, the concentration of antibiotic, or even the type of antibiotic effective against the microbe varies within the same species. Drug resistant bacterial infections, or superbugs, are becoming increasingly prevalent and physicians must prescribe broad spectrum antibiotics to treat infections until antimicrobial susceptibility test (AST) results become available2. Current AST methods monitor the growth of the bacteria in the presence of an antibiotic, which typically requires two steps of overnight incubation3. The MIC corresponds to the lowest concentration of antibiotic needed to inhibit bacteria growth.
Rapid AST results are critical to ensure the effectiveness of antibiotic therapy administered to patients. The delay of an effective antibiotic administration, particularly in blood stream infections, can increase patient mortality significantly. For hyposensitive septic patients, the mortality rate increases by 8% per hour delay in effective treatment4. The administration of broad-spectrum antibiotics has become necessary to avoid inadequate treatment of antibiotic resistant bacteria. Broad spectrum antibiotics, however, are expensive and run a higher risk of side effects and inducing antibiotic resistance5. Rapid AST results allows for quicker administration of narrow-spectrum antibiotics, which leads to improved patient outcomes and lower costs.
The motivation behind this project aims to provide rapid AST results to patients to ensure effective antibiotic treatment in a timely manner. This paper will describe current AST methods used in clinical microbiology labs, and emerging techniques. Research in this area is heavily focused on measuring changes in bacteria growth, however this paper will discuss why this may not be the best approach to antimicrobial susceptibility testing.
- Growth Dependent AST Methods
Current AST methods used in clinical applications monitor the growth of a bacteria isolate in the presence of different antibiotics. The isolated bacteria must grow to an initial standard concentration, depending on the test method, for the tests to be done. It typically takes 18-24 hours for the bacteria to reach a suitable concentration for testing3. Once the bacteria reach a standard concentration, there are several techniques that involve exposing the bacteria to various concentrations of different antibiotics to determine the susceptibility and MIC. Diffusion and broth dilution tests are most commonly used clinical labs.
2.1 Diffusion Techniques
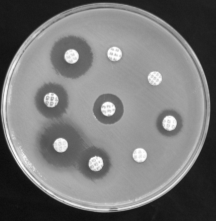
Diffusion test techniques are commonly used in clinical settings. Disk diffusion tests place round paper antibiotics in an agar plate that has a standard concentration of bacteria of approximately 1×10⁸ CFU/mL suspended on the surface 3,6. The disks are left to incubate overnight. If the bacteria cells are susceptible to an antibiotic, then growth in inhibited. The diameter of inhibited growth is measured with a ruler or caliper, and the diameter must fall into an acceptable range to determine susceptibility 7. This test is limited in the number of antibiotics and concentrations that can be tested in a single disk. It is also only able to determine if the bacteria are susceptible or resistant, it does not give the MIC. The advantages of disk diffusion tests lie in the simplicity and low cost of the test.
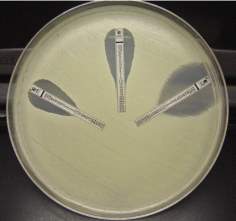
Gradient diffusion tests are similar to disk diffusion; however, they are able to test more concentrations of a single antibiotic in the same amount of time, and provide an MIC. Gradient diffusion tests consist of a test strip containing a concentration gradient of a single antibiotic. The test strip, or ETest tm, is then placed on a plate with a suspension of bacteria and incubated overnight. Areas of the strip with an effective concentration of antibiotic will inhibit bacterial growth, which can be visually determined by the lowest part growth inhibition area, as can be seen in figure 1b 6. Gradient diffusion tests have flexibility in antibiotic selection, however, can become expensive if many antibiotics need to be tested.
Figure 1 a) disk diffusion b) gradient diffusion
2.2 Broth Dilution
Broth dilution tests consist of macrodilution tests and microdilution tests. Dilutions typically involve a two-fold dilution of antibiotics (eg 1, 2, 4, 8, and 16 ug/ML) in a liquid medium8. Macrodilutions are dispensed in test tubes. The antibiotic test tubes are then mixed with a standardized bacterial suspension on the order of magnitude 1×10⁵ CFU/mL and incubated overnight3,6. The tubes are then examined for bacterial growth. The lowest concentration that inhibits bacterial growth is deemed the MIC. This test has many disadvantages including the manual preparation of the antibiotic solutions, the overnight incubation, and the reliance on visual measurement of bacterial growth. The precision of this method is determined to be plus or minus one two-fold concentration.
To overcome the manual preparation of antibiotic solutions, companies have developed standard trays with 96 wells containing various concentrations of 12 different antibiotics for microdilution tests. A very small volume of antibiotic solution (0.1 mL) is dried or frozen in each well3. Companies are able to produce many of these trays from a single parent antibiotic solution, lowering the cost of the test and reducing preparation time for microbiology labs6. A standard concentration of 1×10⁵ CFU/mL bacteria is then dispensed into each tray and incubated overnight. The wells are then inspected manually for growth. Broth dilution tests determine susceptibility as well as the MIC, however the results are reliant on visual inspection of bacterial growth which can be a big source of error. There is also little flexibility in antibiotic selection as the trays are 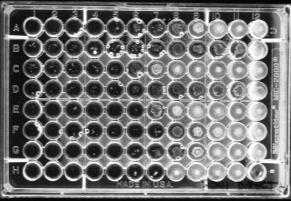
commercially produced.
Figure 2 Microdilution tray
Of the tests described above, gradient diffusion and microdilution techniques are the most common in clinical microbiology labs. Many concentrations can be tested simultaneously, and the optical density of bacteria is measured visually, making them relatively low cost. The biggest drawback is the amount of time it takes to get results. These tests require an initial growth of the bacteria to reach a standard testing concentration, which typically takes 18-24 hours, then overnight incubation with the antibiotics. At the earliest, results can be available three days after the sample is taken3. When it comes to getting susceptibility results, time is critically important. Time can be reduced by lowering the concentration of bacteria needed for testing, and reducing AST test time.
2.3 Automated Detection
Automated instruments are making their way into clinical microbiology labs. Automated instruments can increase the reliability of AST results by standardizing measurement parameters. They are also typically quicker than tests that require manual measurements because they can have a higher sensitivity to bacterial growth by detecting changes sooner. Automated methods currently include the Microscan WalkAwaytm, and the Vitek 2 Systemtm .The Microscan WalkAwaytm periodically scans samples in microdilution trays using a photometer or flurometer to monitor growth over a period of 3.5-18 hours. The Vitek 2 Systemtm uses turbidity to detect growth in 4-12 hours, however these methods still require a high concentration of bacteria for testing, and still depend on bacteria growth to determine susceptibility.
Advanced techniques such as optical microscopic imaging9, microchannel resonators10,11, flow cytometry12, laser light scattering13, and impedance measurements14 allow for bacteria growth to be detected much quicker than visually determining the optical density. These techniques give results within several hours rather than days, however they are still slow, many require significant sample preparation, and the cost of running these tests is a major hurdle when it comes to implementing them into microbiology labs. The most sensitive growth dependent methods for antimicrobial susceptibility testing can detect single cell reproduction, which still takes a minimum of 90 minutes and much longer for slower growing bacteria and requires expensive equipment9,10. Rapid results at a low cost are critical. In order to truly shorten the AST process, methods that do not rely on bacteria growth are necessary, however very few have been reported.
- Rapid AST Methods
For non-growth dependent methods, a different way to measure cell viability must be achieved. It has been documented that bacteria experience significant metabolic shock when exposed to effective antibiotics15. The antibiotics change the bacterial transcription profile, which results in changes in the metabolic activity of the bacteria. If the bacteria are resistant to an antibiotic, they should not experience a significant change in their metabolic functions. A sensor that measures the metabolic activity of a bacteria cell would be able to determine susceptibility much quicker than waiting for cellular reproduction. Metabolic activity of the bacteria cells create forces on the cell walls,16 causing minute movements. A change in the metabolic activity can be detected through a change in the cell wall movement.
There are several methods that report measuring the changes in metabolic activity or physiological stresses of the bacteria cells in the presence of antibiotics to determine the viability of the cells. These methods are in the preliminary stages of research and still require significant testing before they can be implemented into clinical labs, however developing these techniques should be a priority for the AST community. There are several different approaches to measuring cell stress response including dielectric impedance monitoring1, micro cantilever deflections17, and piezoelectric impedance.
3.1 Dielectric Permittivity
Monitoring the dielectric permittivity of bacteria suspensions in the presence of antibiotics is one method that has been used to determine susceptibility. The dielectric permittivity is impacted by a change in the charge distribution of the suspension, which is attributed to all metabolic functions of the bacteria cells1. The capacitance of the suspension was measured by placing a cassette with two test chambers in a custom built instrument with two electrodes on either side of the cassette. The dielectric permittivity was calculated from the measured capacitance using C=e(A/d), where C is the capacitance, e is the dielectric permittivity, A is the area of the electrode, and d is the distance between the electrodes. The normalized impedance response (NIR) was calculated by dividing the impedance of the test chamber with the antibiotics by the impedance of the control chamber. Susceptible and resistant strains of mycobacterium tuberculosis were tested with four different antibiotics: RIF, INH, EMB, and PZA1.
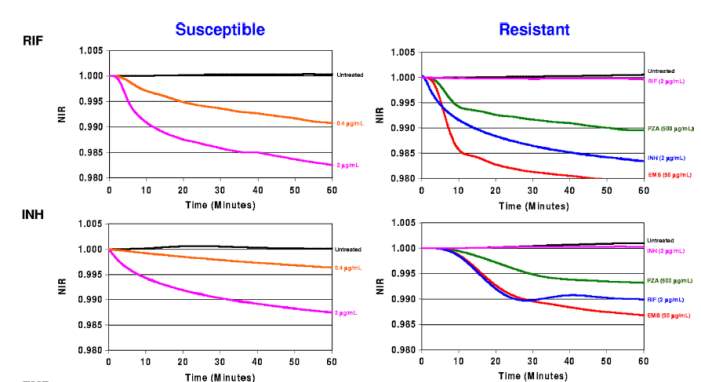
This method did not calculate the MICs, however the MIC could be determined through calibrating an impedance value with MICs determined through another method. This method is able to identify if the bacteria are susceptible or resistant to an antibiotic by measuring a change in dielectric permittivity. It is interesting that the magnitude of the impedance change was proportional to the concentration of antibiotic for susceptible cells. This would indicate that the stress response from the cells is higher for a higher concentration of antibiotic. Resistant bacteria do not show a change in impedance when exposed to antibiotics.
Figure 3 Normalized Impedance Reading (NIR) for susceptible and resistant bacteria when exposed to RIF and INH antibiotics 1
This work was the first example of using the metabolic activity of bacteria to determine cell viability for AST. The tests focused on mycobacteria, because it is known to have a very slow growth process. By measuring the impedance, they were able to determine susceptibility within minutes. The change in impedance is attributed to a change in metabolic function of the bacteria. This is further demonstrated through a similar study using micro cantilevers.
3.2 Micro cantilevers
Atomic force microscopy (AFM) cantilevers have been used to detect the metabolic reactions of low concentrations of bacteria, and their response to antibiotics17. The presence of E. coli and S. aureus immobilized on the surface of the cantilever caused large fluctuations before they were exposed to the antibiotics. The fluctuations are thought to be caused by small movements of the cell walls, or normal metabolic activity of viable cells. When exposed to effective antibiotics, the metabolic shock is immediate to the cells. As the cells are no longer viable and performing normal metabolic functions, the cantilever fluctuations stop within minutes of exposure to the effective antibiotics. Resistant bacteria also displayed a decrease in activity when exposed to antibiotics, however the normal metabolic activity returned after ~15 minutes of exposure. The amplitude of the deflections at each concentration were fit to a sigmoid curve, that can be used to calculate the MIC of the antibiotic. The results of the calculated MIC 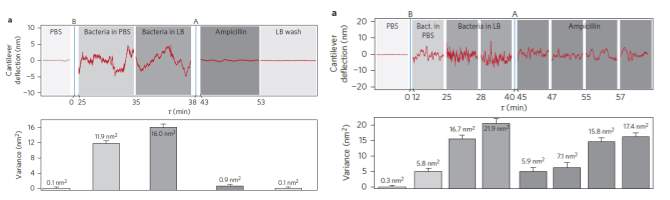 correspond directly with the MI C values determined from conventional methods.
Figure 4 a) cantilever deflection and variance for susceptible bacteria over time b) cantilever deflection and variance for resistant bacteria over time
The bacteria were immobilized using a linker molecule, APTES, READ ABOUT THIS IN THE SUP INFO 2.1.
The bacteria movement was detected using a commercial AFM. An AFM setup is not practical for a high throughput number of samples, and is high cost. It demonstrates that micro cantilevers are able to detect viable bacteria cells through cantilever displacement, and nonviable cells through lack of cantilever fluctuations.
3.3 Piezoelectric Plate Sensor
3.3 Piezoelectric Plate Sensors
Piezoelectric Plate Sensors (PEPS) also detect the metabolic response of the bacteria cells when exposed to a lethal concentration of antibiotic. Piezoelectric materials convert mechanical strain into electrical energy and vice versa. The direct piezoelectric effect occurs when mechanical stress is applied to a dielectric material, creating a distribution of charge across the boundary of the material, which results in an electric field. In contrast, the indirect piezoelectric effect occurs when an electric field is applied to a material and results in a mechanical stress. The piezoelectric effect in materials is highly dependent on the crystal structure of the material. In crystalline materials, the arrangement of ions must lack inversion symmetry, which creates an internal polarization when the material is stressed. The relationship between the electric field and applied strain is linear and reversible. PEPS uses the inverse piezoelectric effect to detect the metabolic behavior of bacteria cells.
Piezoelectric devices make excellent biosensors as they are sensitive to minute changes in their environment. They are preferable to other biosensing mechanisms due to their simplicity, quick response and low cost. Each device, depending on the materials and dimensions, converts electricity into mechanical motion, or vice versa, most efficiently at a specific frequency called the resonance frequency. Most applications of piezoelectric sensing operate in dynamic mode, which utilizes an alternating current to induce mechanical oscillations within the material18. The dynamic mode allows for a change in environment to be continuously read. A change in the mass on the surface of the sensor dampens the frequency of the oscillations proportionally according to the Sauerbrey equation19, however, the equation does not hold true when the sensor is immersed in a liquid medium20.
PEPS differs from other piezoelectric biosensors because it does not operate as a mass sensor. It measures the physiological stresses of the bacteria. The piezoelectric sensor used in PEPS is functionalized with an amine group to electrostatically attract negatively charged bacteria cells. The coating must be thick enough to provide insulation, so the bacteria are not electrocuted, however the overall surface charge must not be so strong that the bacteria cell walls are not able to move. The viable bacteria cells on the surface of the sensor perform normal metabolic functions, which result in minute stresses on the surface of the sensor. The stresses create an electrical response from the piezoelectric material that is measured with an impedance analyzer. The electrical signal created by the movement of the bacteria cells interferes with the alternating current that is moving through the sensor, causing losses in the electrical signal, which can be seen in the blunting of the impedance phase angle.
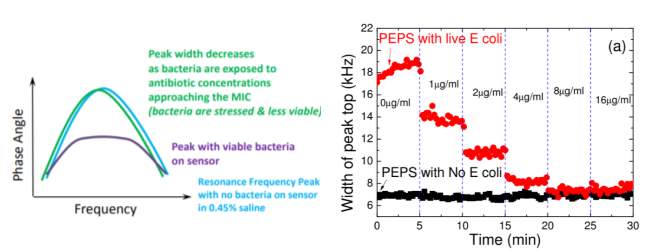 When the bacteria are exposed to an antibiotic they are susceptible to, the cells will cease their normal metabolic functions. The bacteria will stop creating stresses on the surface of the sensor, and the phase angle peak will return to its original shape. The MIC is determined by measuring the width of the phase angle peak as it returns to its original shape.
Figure 5 a) Sketch of changes in impedance phase angle peak width. The blue line represents the peak without bacteria on the sensor, the purple line represents the blunting of the peak when the bacteria attach to the sensor, and the green line represents the peak when the bacteria are exposed to the MIC. b) the red points measure the peak width with bacteria on the sensor, and increasing concentrations of antibiotic over time, and the black points measure the peak width of a control sensor with no bacteria.
The piezoelectric sensors are fabricated to fit in 96 well microdilution tray that is used for the broth dilution tests, so integration into current clinical testing methods would be relatively easy. PEPS is the most promising rapid AST method to date. The sensors are inexpensive, simple, and give results within minutes.
The amine coating that functionalizes the sensor needs to be investigated further. Determining the optimal charge of the sensor surface required to capture the bacteria, and still allow for maximum range of motion could reduce the concentration of bacteria necessary to get AST results. By reducing the number of bacteria needed to create a signal, it may be possible to eliminate the first bacteria incubation step and determine susceptibility even quicker.
- Preliminary Results
4.1 Sensor Fabrication
A sensor was fabricated using a commercially available lead zirconate titanate (PZT) piezoelectric cut into length, width and thickness of 1mm, 2.5 mm, and 0.125 mm respectively. These dimensions were chosen so the sensor could fit into microtiter tray wells that are used in micro dilution tests. Wires were connected to either side of the PZT using conductive epoxy. An MPS coating was grown on the surface of the senor by means of dip coating using parameters set by (SOURCE). The MPS binds to the surface (BLAH BLAH) The MPS coating insulates the sensor and protects the bacteria from being electrocuted. A thin layer of APS was grown on top of the MPS to provide the silane functional group, which gives the sensor an overall positive charge to attract the negatively charged bacteria. The resonance frequency of the sensor was measured using an AIM UHF Impedance analyzer.
4.2 Bacteria Testing
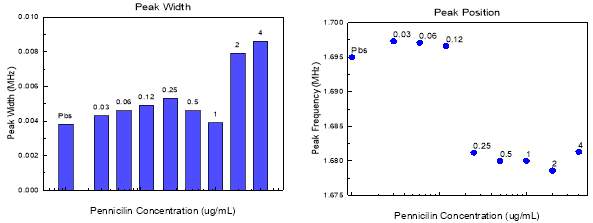 The resonance peak of the sensor was first measured in a control saline solution, then the sensor was immersed in staph aureus (SA) for ten minutes to allow the bacteria to interact with the sensor. The resonance peak was measured again after 10 minutes, then the sensor was submerged into penicillin suspensions of increasing concentration (0.03, 0.06, 0.12, 0.25, 0.5, 1.0, 2.0, 4.0) (UNITS). The resonance peak was measured as soon as the sensor was fully submerged, so the results are instantaneous. Figure A shows the resonance peak position as the concentration of antibiotic increased. At 0.25 there is a significant drop in peak position, which indicates a mass change on the surface of the sensor. This may be the antibiotic beginning to bind to the bacteria cells, however more research will have to be done to determine the cause. Figure B shows the width of the resonance frequency peak as the antibiotic concentration increases. The MIC is defined to be at the peak width minimum per the patent, and it can be seen that the peak width is at a minimum when the penicillin concentration is 1.0 ug/mL. The MIC for this strain of SA was determined to be 1.0 ug/ML through an ETest performed on the same bacteria on the same day. Our results are consistent with the conventional methods of measuring the MIC as well as with the patent results.
Figure 6 a) Peak width with S. Aureus and increasing antibiotic concentration on sensor b) peak position with increasing antibiotic
- Future Work
While it is exciting that we were able to replicate the results published in the patent, and it is consistent with conventional methods used for AST testing for this strand of SA, more testing needs to be done. We need to test different strands of bacteria to confirm this method does consistently work for different types of bacteria. We also need to test a sensor without bacteria in the different concentrations of antibiotic to study how the antibiotic interacts with the sensor and the coating.
It is also very important to understand how the bacteria and antibiotic are interacting with each other and with the coating on the surface of the sensor. In situ SEM measurements will be done in an attempt to de
It is also very important for us to
- References
1 Rieder, R. J., Zhao, Z. & Zavizion, B. New Approach for Drug Susceptibility Testing: Monitoring the Stress Response of Mycobacteria. Antimicrobial Agents and Chemotherapy 53, 4598-4603, doi:10.1128/aac.00643-09 (2009).
2 Ventola, C. L. The Antibiotic Resistance Crisis: Part 1: Causes and Threats. Pharmacy and Therapeutics 40, 277-283 (2015).
3 Wiegand, I., Hilpert, K. & Hancock, R. E. W. Agar and broth dilution methods to determine the minimal inhibitory concentration (MIC) of antimicrobial substances. Nature Protocols 3, 163, doi:10.1038/nprot.2007.521 (2008).
4 Kumar, A. et al. Duration of hypotension before initiation of effective antimicrobial therapy is the critical determinant of survival in human septic shock*. Critical Care Medicine 34, 1589-1596, doi:10.1097/01.ccm.0000217961.75225.e9 (2006).
5 Fair, R. J. & Tor, Y. Antibiotics and Bacterial Resistance in the 21st Century. Perspectives in Medicinal Chemistry 6, 25-64, doi:10.4137/PMC.S14459 (2014).
6 Reller, L. B., Weinstein, M., Jorgensen, J. H. & Ferraro, M. J. Antimicrobial Susceptibility Testing: A Review of General Principles and Contemporary Practices. Clinical Infectious Diseases 49, 1749-1755, doi:10.1086/647952 (2009).
7 Andrews, J. M. & Bsac Working Party on Susceptibility Testing, f. t. BSAC standardized disc susceptibility testing method. Journal of Antimicrobial Chemotherapy 48, 43-57, doi:10.1093/jac/48.suppl_1.43 (2001).
8 the, E. C. f. A. S. T. E. o. & (ESCMID), E. S. o. C. M. a. I. D. Determination of minimum inhibitory concentrations (MICs) of antibacterial agents by broth dilution. Clinical Microbiology and Infection 9, ix-xv, doi:doi:10.1046/j.1469-0691.2003.00790.x (2003).
9 Choi, J. et al. A rapid antimicrobial susceptibility test based on single-cell morphological analysis. Science Translational Medicine 6, 267ra174-267ra174, doi:10.1126/scitranslmed.3009650 (2014).
10 Godin, M. et al. Using buoyant mass to measure the growth of single cells. Nature Methods 7, 387, doi:10.1038/nmeth.1452
https://www.nature.com/articles/nmeth.1452#supplementary-information (2010).
11 Etayash, H., Khan, M. F., Kaur, K. & Thundat, T. Microfluidic cantilever detects bacteria and measures their susceptibility to antibiotics in small confined volumes. Nature Communications 7, 12947, doi:10.1038/ncomms12947
https://www.nature.com/articles/ncomms12947#supplementary-information (2016).
12 Álvarez-Barrientos, A., Arroyo, J., Cantón, R., Nombela, C. & Sánchez-Pérez, M. Applications of Flow Cytometry to Clinical Microbiology. Clinical Microbiology Reviews 13, 167-195 (2000).
13 Hayden, R. T. et al. Rapid Antimicrobial Susceptibility Testing Using Forward Laser Light Scatter Technology. Journal of Clinical Microbiology 54, 2701-2706, doi:10.1128/jcm.01475-16 (2016).
14 Safavieh, M. et al. Rapid Real-Time Antimicrobial Susceptibility Testing with Electrical Sensing on Plastic Microchips with Printed Electrodes. ACS Applied Materials & Interfaces 9, 12832-12840, doi:10.1021/acsami.6b16571 (2017).
15 Goh, E.-B. et al. Transcriptional modulation of bacterial gene expression by subinhibitory concentrations of antibiotics. Proceedings of the National Academy of Sciences 99, 17025-17030, doi:10.1073/pnas.252607699 (2002).
16 Pollard, T. D. & Cooper, J. A. Actin, a Central Player in Cell Shape and Movement. Science 326, 1208-1212, doi:10.1126/science.1175862 (2009).
17 Longo, G. et al. Rapid detection of bacterial resistance to antibiotics using AFM cantilevers as nanomechanical sensors. Nature Nanotechnology 8, 522, doi:10.1038/nnano.2013.120
https://www.nature.com/articles/nnano.2013.120#supplementary-information (2013).
18 García-Martinez, G. et al. Development of a Mass Sensitive Quartz Crystal Microbalance (QCM)-Based DNA Biosensor Using a 50 MHz Electronic Oscillator Circuit. Sensors 11, doi:10.3390/s110807656 (2011).
19 Sauerbrey, G. Verwendung von Schwingquarzen zur Wägung dünner Schichten und zur Mikrowägung. Zeitschrift für physik 155, 206-222 (1959).
20 Kanazawa, K. K. & Gordon, J. G. Frequency of a quartz microbalance in contact with liquid. Analytical Chemistry 57, 1770-1771, doi:10.1021/ac00285a062 (1985).
Cite This Work
To export a reference to this article please select a referencing stye below:
Related Services
View all


Related Content
All TagsContent relating to: "Microbiology"
Microbiology is the study of microscopic organisms, or microorganisms. Microorganisms are simple life forms that include bacteria, fungi, algae, and viruses.
Related Articles

DMCA / Removal Request
If you are the original writer of this dissertation and no longer wish to have your work published on the UKDiss.com website then please: