Big Data in Digital Marketing
Info: 8401 words (34 pages) Dissertation
Published: 27th Jan 2022
Tagged: Marketing
CONTENTS
Introduction
Chapter 1 Big data in digital marketing
1.1. Big data and advertising analytics
1.2. Framework overview
1.3. The problems of modern digital marketing in FCMG
Chapter 2 Moving to effective digital marketing
2.1. Implementing standards of digital media buying
2.2. Verification of targeting accuracy
Conclusion
Literature
Introduction
Big Data is one of the fastest growing areas of information technology, according to statistics, the total volume of received and stored data doubles every 1.2 years. Between 2012 and 2014, the number of data transmitted monthly by mobile networks increased by 81%. According to Cisco estimates, in 2014 the volume of mobile traffic amounted to 2.5 exabytes (a unit of measurement of the amount of information equal to 10^18 standard bytes) per month, and in 2019 it will be equal to 24.3 exabytes. Thus, Big Data is already a well-established sphere of technology, even though it is relatively young, it has become widespread in many areas of business and plays an important role in the development of companies.
This paper studies how the emergence of big data is driving the adoption of broader and increasingly sophisticated quantitative analysis techniques across media channels by large, medium and even smaller sized firms. The era of big data is underway. Computer scientists, physicists, economists, mathematicians, political scientists, bio-informaticists, sociologists, and other scholars are clamoring for access to the massive quantities of information produced by, and about people, things, and their interactions [4] (Boyd and Crawford, 2012). Experts in the field of studies of Economics believe that further progress will be closely linked with the widespread introduction of mathematical and economic methods and models. If previously dominated by qualitative analysis, today revealed the quantitative regularities and mathematical models of many economic phenomena and processes. In modern conditions even, an experienced Marketer is not always able to detect and objectively compare the advantages and disadvantages of different solutions, so modeling marketing mix can reduce the level of harmful consequences. The relatively low cost of modeling allows to replicate the “economic storm”, while saving millions and even billions of rubles. Today in the field of marketing there is a serious competition for customers. In this connection, it’s obligatory to optimize marketing strategy basing on collected Big Data to offer each customer as much personalized and consistent experience as possible.
The goal of this work is to study the ways of using Big Data in digital marketing to solve difficulties of building FCMG brand in digital.
Among the tasks of the paper are the following:
- studying the current state of the Big Data framework in marketing;
- Identification of problem areas of digital marketing;
- Finding solutions for problem areas using Big Data;
- Making recommendations for FMCG brands on using big data
The object of the research is the influence of digital marketing channels on brand health indicators.
This paper will discuss the theoretical basis for the use of big data in the marketing strategy of the company. In the first chapter the ecosystem and the key problems faced by most players in the market will be discussed. The definition of big data will be considered. The second Chapter describes the methods of verification of marketing strategy and the quality of investments in digital channels of promotion, as well as key indicators for assessing the implementation of the strategy.
Chapter 1 - Big data in digital marketing
1.1. Big data and advertising analytics
Nowadays, the concept of “Big data” does not have a generally accepted definition. In the open online encyclopedia «Wikipedia» the following definition is given: «big data – is the designation of structured and unstructured data of huge volumes and significant diversity, effectively processed using scale-out software tools that appeared in the late 2000s and alternative to traditional database management systems and solutions of the business intelligence class». In a recent article, Lev Manovich, Professor of computer science at New York University, says that the concept of “Big data” was previously used in Sciences to refer to data sets large enough to use supercomputers. However, with the growth of PC performance-the situation has changed.
Now the same data sets can be processed on personal computers by means of standard software. ” There is no doubt that the amount of data available is often quite large, but this is not a defining characteristic of this new data ecosystem [10]. Paul Zikopoulos, together with a team of researchers from the international company IBM comes in his book entitled “Understanding of Big Data” to the following idea: «Big data is a bit wrong, because it means that the previously existing data is somehow small (it’s not so) or that the problem is a clean one (Size is one of them, but often more.). Thus, the term “Big Data” should refer to data that cannot be processed or analyzed by using traditional processes or tools.”. The most common academic definition of Big data is the definition of Dana Boyd and Kate Crawford. They define big data as a cultural, technological and scientific phenomenon, which is based on the interaction of three factors:
1. Technology: maximize the computing power and algorithmic accuracy to gather, analyze, link and compare large data sets.
2. Analysis: use of large amounts of data to identify patterns in support of economic, social, technical and legal requirements.
3. Mythology: the widespread belief that large data sets offer a higher form of intelligence and knowledge that can generate insight that was previously impossible with an aura of truth, objectivity, and accuracy [4] (Boyd & Crawford, 2012).
Based on the definition of Big Data, the following basic principles of working with such data can be formulated:
1. Horizontal scalability. Because there can be as much data as you want – any system that involves processing large data must be extensible. The amount of data has doubled – the amount of iron in the cluster has doubled and everything has continued to work.
2. Fault-tolerance. The principle of horizontal scalability implies that there can be many machines in a cluster. For example, Hadoop cluster Yahoo has more than 42,000 machines (at this link you can see the size of the cluster in different organizations). This means that some of these machines will be guaranteed to fail. Big data techniques should take into account the possibility of such failures and deal with them without significant consequences.
3. The data locality. In large distributed systems, data is distributed across a large number of machines. If the data is physically located on one server and processed on another, the data transfer costs may exceed the processing costs. Therefore, one of the most important design principles of BigData-solutions is the principle of data locality-if possible, process the data on the same machine on which they are stored.
All modern big data tools follow these three principles one way or another. In order to follow them – it is necessary to come up with some methods, methods, and paradigms for developing data development tools.
Big data popularization is a trend that is officially supported by W3C for many years through the support of the so-called Semantic Web. “The semantic web is a collaborative movement led by international standards of The World Wide Web Consortium (W3С). The standard promotes common data formats on the World Wide Web. By encouraging the inclusion of semantic content in web pages, the semantic web aims to transform the existing network, dominated by unstructured and semi-structured documents, into a “data network”.
The semantic web is based on the Framework Description of the W3C resource consortium (RDF)” (from W3C, 2011). There is confusion between the terms “semantic web” and “web 3.0”. According to one of the leading technology bloggers Akhilesh Sharma, the “semantic web” is sometimes appropriate, used as a synonym for “Web 3.0”, though the definitions of these terms differ (Sharma, 2011). The importance of the semantic web and/or web 3.0 in the development of big data is hard to deny. In modern times, the technology itself seems to be evolving faster than its clear definitions, such as big data and its applications to business and society.
The impact of big data spreads much wider than a PC or even a smartphone. Paul Zikopoulos and his team of researchers at IBM state the following: “Simply put, the era of big data today is in full force because the world is changing. With instrumentation, we can feel more things, and if we feel it, we tend to store it (or at least some of it). Advances in technology have made people and things increasingly interconnected-not only part of the time, but all the time.
The level of interconnectedness is a runaway train ” (Zikopoulos et al., 2011). With the lightning-fast spread of big data, an increasingly important business task is to learn how to use IT to improve marketing efficiency. One solution is Predictive Analytics. Predictive Analytics is not new, as it is widely used in the fields of public health, environmental protection, and national security. Predictive Analytics is currently being applied to integrated marketing communications (IMC), which leads to more spread of media on the Internet.
According to recent reports from Duke University and the society of digital agencies (SoDA), advertisers are transferring significant budgets from traditional media advertisers to various online channels. According to TNS Mediascope, the volume of the advertising market on the Internet in November 2017 for the first time compared with the volume of the television advertising market in Russia.
Corporate clients require greater accountability and detailed measurement of the impact of their advertising campaigns, regardless of the form of application. Historically, online advertising has been used primarily as a means to accelerate direct transactions with customers and to a lesser extent as a tool for brand building. This trend is changing and the movement towards the use of online advertising in brand order will shift a higher percentage of their advertising budgets on Internet sites. The Nielsen online advertising report in Outlook 2013 confirms this view of digital media as channels of brand development:
“Digital media continues to develop as a branding medium, moving beyond its roots as a channel of interest solely to direct response marketers. Today, it seems that branding in the online environment appears to have reached adulthood, because the costs of brand advertising on the Internet in 2013, according to forecasts, they will compete with the advertising direct response. Moreover, growth projections for branding surpass the predictions of its brothers and sisters on the basis of performance” (Nielsen, 2013).
Advertisers, for the most part, still work in the “swim lane” mode to assess the effectiveness of the advertising campaign. This means that the performance of each media channel is evaluated as a separate silo or “swim lane”. Thanks to the emergence of powerful big data analysis technologies, measuring the impact of one media channel on another (the concept of “assist power”) is becoming increasingly realistic. For example, you can measure the contribution of television advertising to social media communication. As online takes on an increasingly important role in the brand media mix, intuitive performance measurement will be more critical. There are tools for analyzing the performance of traditional media, such as a television in an integrated form with the performance of an online channel.
An excellent example is the Nielsen Cross-Platform rating service, which was released in the United States in October 2012 (Nielsen, 2013). In addition, the increase in computing power and the ongoing standardization of the format data in the web using semantic web agreements facilitates the acquisition of data related to traditional use (Blomqvest, 2014). The above trends in the competitive marketing environment lead to the emergence of an advertising strategy called Advertising Analytics 2.0. Wes Nichols, co-founder, and CEO of MarketShare based in Los Angeles global forecast and analysis company says: ” The days of correlating sales data with a few dozen discrete advertising variables are over. Many of the world’s biggest companies are now deploying analytics 2.0, a set of capabilities that can chew through terabytes of data and hundreds of variables, in real time, to reveal how advertising touch points interact dynamically.
The results: 10% to 30% improvements in marketing performance” (Nichols, 2013). The results of the Economist Intelligence Unit survey confirm the positive effect of Big data implementation. 46% of companies claim that they have improved customer service by more than 10% with the help of Big Data technologies, 33% of companies have optimized stocks and improved productivity of fixed assets, 32% of companies have improved planning processes.
1.2. Framework overview
The first finding uncovered in this study is that large investments have been made in big data start-ups in the past several years. This prompted a search for recent merger and acquisition news. More than 16 acquisitions of privately financed start-ups that have taken place in the past 4 years with 10 acquisitions (62.5%) occurring in 2014. Clearly, investment activity is active and picking up speed, as seen in Table 1. The term big data investor seems appropriate for firms in this first typology. These firms are investing billions of dollars in big data.
Table 1 Big Data Investors
| Big data investor | Acquired company | Deal value |
| Adobe | Demdex (DSP)
Omniture (MMM) |
$58,0000,0000
$1,800,000,000 |
| AOL | Convetro (MMM) | $101,000,000 |
| Centro | SiteScout (DSP) | $40,000,000 |
| DataXu | JasperLabs | Undisclosed |
| Ebay | ClearSaleing (MMM) | $2,400,000,000 |
| Ensinghten | TagMan | Undisclosed |
| InviteMedia (DSP)
Adometry (MMM) |
$81,000,000
Undisclosed |
|
| IgnitionOne | Knotice (DMP) | Undisclosed |
| IBM | Coremetrics (MMM) | Undisclosed |
| Lotame | AdMobius (DMP) | Undisclosed |
| Neurostar | Aggregate Knowledge (DMP) | $119,000,000 |
| Oracle | Blue Kai (DMP) | $350,000,000 |
| Rakuten | DC-Storm (MMM) | Undisclosed |
| Rocket Fuel | X + 1 | $230,000,000 |
Investors of large data come in many forms. Larger, usually from high-tech or media sectors. One example of a high-tech major investor is Google data. Google – These are products and services that manage Internet traffic and income from advertising on the Internet. Other high-tech investors include Adobe-innovator in Content-active software, Oracle-leader in customer relationship management (CRM) systems and Ebay-a pioneer in online purchase and sale of products. A notable conglomerate of media time Warner Inc. which recently acquired Convertro and Nielsen. Company Nielsen operates the service of Catalina – a firm specializing in media-mix simulations. Investors of large data come in many forms. Larger, usually from high-tech or media sectors. One example of a high-tech major investor is Google data. Google – These are products and services that manage Internet traffic and income from advertising on the Internet. Other high-tech investors include Adobe-innovator in Content-active software, Oracle-leader in customer relationship management (CRM) systems and Ebay-a pioneer in online purchase and sale of products. A notable conglomerate of media time Warner Inc. which recently acquired Convertro and Nielsen. Company Nielsen operates the service of Catalina – a company specializing in media mixes modeling.
Demand-side platforms (DSPs) are the main force in promoting an approach to marketing large data. Particleboard is used to purchase advertising in automatic mode. Advertisers and agencies to help them buy display, video, mobile and search ads most often use DSP. DSPs are highly controversial in the advertising community, because they are destructive. Advertising has traditionally been exchanged by human buyers and sellers in a manual process that is expensive and subject to human error. DSP helps make this process cheaper and more efficient by removing people from parts of the process, eliminating the need, for example, to negotiate ad rates and manually process orders.
The DSP requirement significantly reduces the cost of advertising purchases. Almost all ad networks now offer some kind of DSP-like product or an option in real-time bidding (RTB). There is also a shift in the industry where DSPs start to look very much like ad networks-buying up inventory, repackaging it and reselling it to advertisers for the Prize. DSP can simply be the next generation of ad networks. Table 2 shows the key players in the DSP space together with the companies (in parentheses) that acquire
Table 2 Demand-Side Platforms (DSP) And Real Time Bidding (RTB)
| Indicative Demand-Side Platforms |
| Accordant |
| Centro |
| DataXu |
| InviteMedia (Google) |
| Demdex (Adobe) |
| MediaMath |
| RocketFuel (listed on NASDAQ) |
| SiteScout |
| Turn |
The very amount of data that analytical firms and agencies had at their disposal from third parties was quite noticeable. Integrate customer data for DMPs by CRM and any of the following characteristics: large public databases, broadcasts from Nielsen or Rentrack, economic data, public data on competitors and much more. This is the third batch of materials for the analytics models provided by the following typology of data platform management or dmp. Progressive marketers want to combine their own client data with third-party data in the best segment and target audience.
DMPs generally rely on third-party cookies to help target segments and associate third-party behavioral data with the first party’s data and personal information. There are privacy issues, and the industry segment develops into the function it provides. These firms now look like data warehouses in the sense that they collect more data than they supply. However, they also seem willing to continue to displace more value-added data as the industry develops. At this point, they can be more like data factories. There also seems to be some consolidation of DMP with DSP. Some DMPs also run DSP services and vice versa. Table 3 below in parentheses indicates indicative DMPs for acquiring companies.
Table 3 Indicative Data Management Platforms
| Audience Optics (Accordant) |
| Media Optimizer (Adobe) |
| Aggregate Knowledge |
| Blue Kai (Oracle) |
| CoreAudience |
| eXelate |
| nPario |
| Turn |
| X + 1 (Rocket Fuel) |
It was discovered that about 50% of the online-focused attribution and predictive analytics service companies also integrate traditional (specifically broadcast) data into their analyses. They use what is called a bottom-up approach where they build their models around the online media mix of the client. This is done in an effort to meet their marketing goals which are typically measured by cost per acquisition (CPA) or click through rates (CTR). They are, however, able to overlay feeds from traditional media to establish the impact of broadcast on the online media performance and visa-versa.
Findings from the current research also showed that the firms excluded from the study are currently linking more aggressively to the online world. These top-down media mix modelers are from TV audience measurement systems such as Nielsen or TiVo (TRA Inc.). With this information, another typology was identified as media mix modeling with an extension of two sub-classifications. The first sub-classification is bottom-up media mix modeling which emphasizes online data first or in some cases only works with online data. The second group is top-down media mix modeling companies with their roots in TV. We expect these sub-categories to become blurry over time as the importance of online increases. Table 3 below identifies indicative media mix modelers (MMM’s) with the acquiring companies in parenthesis.
Table 4 Media mix modelers (MMM’s)
| Indicative bottom-up media mix modelers | Indicative top-down media mix modelers |
| Adaptive Audience | IRI |
| Adometry (Google) | Marketshare |
| AT Internet (Europe) | Nielsen Catalina Solutions |
| C3 Metrics | OMD Brand Science |
| Converto (AOL) | ThinkVine |
| DC-Storm (Rakuten) (Europe) | TiVo (TRA Inc.) |
| DataSong | |
| Encore Metrics | |
| Visual IQ |
Agencies have always been an integral part of the marketing industry. With the rising influence of online, the model of what an advertising agency is and what it does is clearly in flux. Due to the changing online needs of the clients, two predominant agency models appear to be on the rise. The first is a digital agency which focuses primarily or exclusively on internet advertising content creative and techniques. The second is a full-service agency that provides creative strategy and traditional offerings; however, they also maintain a digital practice with subject matter experts in a variety of online skills. Full service agencies may also have partnerships with the previously identified players in our posited framework. At times the full-service agencies may also partner or sub-contract to the digital agencies. Agencies in both categories were interviewed in the current study. Indicative agencies, which may or may not have been interviewed and are identified in Table 4.
Table 5 Agencies (Digital and full service)
| Indicative digital agencies | Indicative full-service agencies |
| 360I | 22 Squared |
| C4-Analytics | Booyah! |
| Icrossings | Havas |
| Performics | JWT |
| PM Digital | Leo Burnett |
| Purple Rock Scissors | OMD |
| Resolution Media | Razorfish |
| Rise Interctive | Weiden and Kennedy |
| Sq1 | Zenith Optimedia (Publicis Groupe) |
In addition to the typologies, it is important to remember that all the firms in the ecosystem are working to better connect their progressive marketing clients to existing and potential customers. The progressive marketing organization is central to the system and may or may not have the ability to interface directly with each type of firm for purposes of marketing communications. Reaching customers to achieve the goals of the progressive marketing organization is paramount for all the players in the ecosystem. Customers are pervasive, and the system manipulates the marketing messages they receive. Figure 2 provides a consolidated classification framework for understanding key players in the big data ecosystem and a graphical overview of the potential interaction touch points a progressive marketing organization should consider and when engaging this ecosystem.
The order of the concentric circles of this framework is not by chance. It can be argued that big data investors want influence over the customers and will get it if they invest wisely. DSP’s are positioned just inside of big data investors and are critical because ultimately the media buy dictates who sees the content and when they see it. This is probably why Google invested in the Invite platform as early as 2010. In a big data world, information is king and that is why the DMP’s are the next concentric circle in the ecosystem. These firms have the data, and they effectively are the data warehouses of the external world in which the organization operates. There is also the potential that the DSP’s and DMP’s will merge into one circle as the ecosystem evolves.
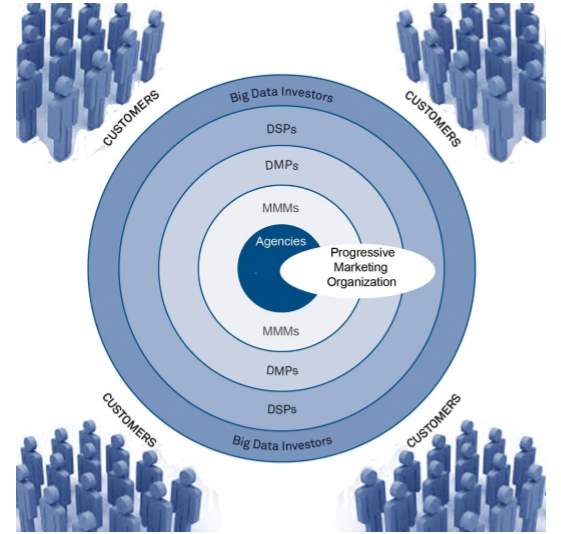
Figure 1 Classification Framework for Big Data Ecosystem
In a big data world, information is king and that is why the DMP’s are the next concentric circle in the ecosystem. These firms have the data, and they effectively are the data warehouses of the external world in which the organization operates. There is also the potential that the DSP’s and DMP’s will merge into one circle as the ecosystem evolves.
To date, the Arsenal of modeling tools in marketing includes a variety of formal and informal methods, some of them are suitable for performing the present work is shown in figure
1.3. The problems of modern digital marketing in FCMG
Despite the rapid development of the big data market and the active introduction of data driven approach in marketing strategies, there are several serious problems that call into question the effectiveness of digital channels in the General media mix.
The main difficulty lies in the fact that it is quite difficult to establish the relationship between investments in digital channels and their impact on brand formation in the eyes of consumers. For one of the brands in the category of pet food together with the company Millward Brown conducted a study of the impact of different channels of communication with consumers on brand awareness. The study was conducted continuously during the year in the form of an online panel. Participants were asked: “From what channel of communication did you hear about the brand lately?” It was suggested to choose among the following channels: television, radio, Internet, In-store awareness, Newspapers/magazines, mass events, etc. The results of the study are shown in the figure.
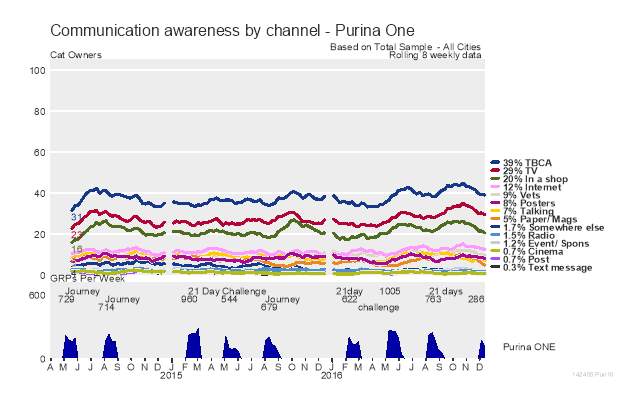
Figure 2 Communication awareness by channels
Blue marked periods with the presence of TV commercials, in between, he conducted a digital advertising campaign. It’s easy to see that despite the massive support in digital media and a comparable amount of investment – awareness of advertising on television is much higher. In addition, the brand awareness chart from digital channels does not correlate with periods of active campaigns. Thus, the first important problem faced by FMCG brands while building brand awareness – the extreme difficulty of identifying the relationship between investment in digital media and impact. Blue marked periods with the presence of TV commercials, in between, he conducted a digital advertising campaign.
It’s easy to see that despite the massive support in digital media and a comparable amount of investment – awareness of advertising on television is much higher. In addition, the brand awareness chart from digital channels does not correlate with periods of active campaigns. Thus, the first important problem faced by FMCG brands while building brand awareness – the extreme difficulty of identifying the relationship between investment in digital media and its impact on consumers.
“The days of giving digital a pass are over,” Mr. Pritchard (Chief Brand Officer pf P&G) said, urging the rest of the ad industry to follow P&G”s lead. “It’s time to grow up. It’s time for action. “P&G doesn’t “want to waste time and money on a crappy media supply chain,” he said. And he urged others in the industry to follow suit. “Don’t accept the excuses,” he said. “Don’t wait for someone else to move. …There is tremendous power in the collective force of our industry.”
Global CMO of Coca-Cola gives quite similar thoughts “TV still offers the best ROI across media channels.” In digital, “we are investing massive amounts of money,” but “historically probably not in the smartest way,” Mr. de Quinto said. He gave one example: Coke runs an estimated 300 apps worldwide, “but most of these apps, they have less than 50,000 users or 100,000 users. That is nothing,” he said.
The next problem, which is no less important – the problem of assessing the quality of contact with the audience in the digital space. The most common model of payment for advertising on the Internet in the strategy of making awareness about brand is the payment for a thousand impressions (CPM). We can logically expect that if we pay for thousand impressions we can possibly get thousand consumers impressed with our message. However, in practice it turns out that not all impressions that are counted by the platform and are billed to the advertiser are honest indicators for real people.
In fact, screenings include screenings of bots and botnets of various kinds (about 15%), screenings that are impossible to see (i.e. on the consumer’s screen in the visible area was less than 50% of pixels during 1 second for banners and less than 50% of pixels during 2 seconds for video) and immeasurable impressions (impressions in which the counter worked, but the advertising message itself was not loaded).
Thus, the next important question arises as to how to assess the accuracy and quality of the impressions. That is, despite the use of Big Data to build suitable audiences for displaying an advertising message – we have no confidence in what form the message will be shown and whether the audience we showed it to is suitable. In Petcare industry it’s important to make a step forward and to count the amount of impressions which were shown to pet owners which is the additional difficulty to the described above problem. On the picture we could see the difference between amount of impressions which were bought and amount of real people who viewed this.
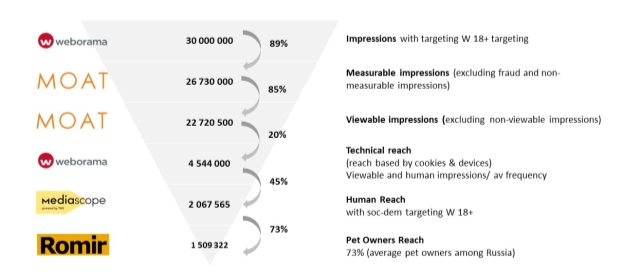
Figure 3 The funnel of paid advertisements in digital
And one of the biggest challenges is identifying the right audience for your ads. The easiest and most expensive way is to show ads to a wide audience, set up by socio – demographic parameters. This method is comparable with the usual approach for television advertising. However, the key difference lies in the cost – the cost of one useful contact with the audience in digital channels – much more expensive than in television. Accordingly, the use of the same approach is not advisable.
Analysis of big data based on behavioral factors of people on the Internet allows you to create fine-tuned audience. But in many specific areas, such as Pet Food, identifying animal owners becomes a much more challenging task, because the behavior of such people is very little different from that of ordinary people. The majority of even the most advanced digital advertising networks (Google, Yandex, GPMD and other) does not allow you to target pet owners. So, we come to another problem: which types of data should we collect to analyze and identify implicit traits among customers. As well as how to assess the quality of the data received post factum.
Chapter 2 Moving to effective digital marketing
2.1. Implementing standards of digital media buying
In the previous section, the global problem of the Internet marketing industry in the FMCG sphere was identified – the fragmentation of market participants in terms of approaches to providing data and subsequent analysis. Collecting and analyzing Big Data could help identify bad traffic and decrease costs significantly. There are many indicators that allow you to evaluate advertising campaigns, but each company providing advertising platforms for the brand differently evaluates the same indicators. The solution may be the use of an independent verifier of the quality of placements on all sites. Each banner and commercial is pixel-stitched by an independent vendor (such as MOAT), which allows you to evaluate the actual data by considering the international standards of MRC and analyzing millions of advertising impressions at a time.
- The allocation of the search engines and traffic from data centers.
- Traffic from unknown proxy servers.
- Traffic from IP addresses that are in the black list.
- Traffic from unknown browsers.
Such systems are used as filtering on known databases of bot traffic sources, and analysis of user behavior, tracking triggers strange behavior that signal that the user is not a person. Such systems are used as filtering on known databases of bot traffic sources, and analysis of user behavior, tracking triggers strange behavior that signal that the user is not a person. The following sets of criteria can be selected:
1) Known Data-Center — known technology accumulated base sources of bot traffic, verified with MRC.
2) Activity-based Detection and Removal Techniques — behavioral criteria.
For example, the bot closes the advertisement in a fraction of a second after processing the impression event.
Or clicks on the button “Close” on the resource occur strictly in the same point of the display (pre-created navigation).
Or there is an abnormally enormous number of impressions of ads from the same IP with one cookie.
And so on, it is impossible to give a complete list, as it is closed information (know-how), and constantly updated in accordance with the continuously clever robots base.
3) Auto-Refresh Ad Detection — abnormally frequent updating of the page at equal intervals of time, not initiated by the website, and “end user”, that is a bot.
4) Robotic Indicators or Suspect Strings — the same behavioral characteristics as in paragraph 2, but rather marked “suspicious behavior”.
5) Non-browser user agent header — the browser deliberately hides the user agent.
6) Old browsers — older browser versions are an indirect sign of fraudulent schemes and/or security threats. As an example, the Chrome browser is updated automatically and continuously, and if now the current version is the 59th, many impressions in versions 47, 50, 57 and further say that the user’s machine, most likely, infected — not least because, to prohibit updates to the browser must be a good reason, which, as a rule, is the presence of Malware.
2.2. Verification of targeting accuracy
DMP systems allow you to collect, collect and analyze substantial amounts of data about users who interact with advertising content published on behalf of the brand. The first Chapter discussed the possibilities of modeling media mix for mmm advertising campaigns. Another very popular option is to collect user segments by storing a cookie of users whose behavior indicates the possibility that they are the target audience. However, after building extended segments based on this Look a Like (LAL) data, the question arises as to how much the audience collected corresponds to our real TA.
Consider the solution of such a problem on the example of the brand engaged in the production and sale of pet food. As mentioned earlier, identification of animal owners on the Internet is a very non-trivial task. First, the behavior of such people as a whole is quite different from the behavior of ordinary users. Second, when collecting data, we face a typical problem of analysis of Big Data:
- A small number of 1st party data allows you to make accurate predictions, but does not allow to achieve sufficient scale;
- Data to achieve the required scale does not provide a decent quality of accuracy in reaching the target audience when compiling LAL, as they contain only indirect factors.
In the case of e-commerce projects, the signals that clearly indicate the quality of the selected target audience in the advertising campaign are target actions, such as clicks, conversions, and so on. For ad campaigns whose primary purpose is to influence awareness, you must take a different approach to determine quality.
The approach can be quite simple, but not obvious. You need to ask people who have been shown ads, whether they are our target audience. How can it be done if we cannot contact each of these people, as their number can reach hundreds of thousands and even millions. To use this approach in digital marketing, it is necessary to compare the data about all the people who saw our advertising campaign (their cookies) with the data of online research of the population (cookies of participants).
Using the services of the research campaign, we can receive cookies of users who suit us according to certain criteria, for example, they are pet owners. A sample of the people involved in such studies is representative and gives an idea of the population of the whole country. Thus, we can expect that if by the results of the advertising campaign N% of the respondents were among those who saw the advertising campaign and M% of them have a sign of interest to us, then the accuracy of targeting in the campaign is M%.
Table 6 Verification results
| ALL | Composition («Have seen») | Verification (W 25-35) | Verification (18-65, cat owners) | |||||||
| Placement name | Total (18+) | W 25-35 cat owners | W, 25-35 | 18-65, cat owners | Reach TA % | TA | Not TA | Reach TA % | TA | Not TA |
| Placement 1 – Mobile W25-35 | 1 409 | 289 | 507 | 750 | 0,74% | 36,0% | 64,0% | 0,35% | 53,3% | 46,7% |
| Placement 1 – W25-35 | 3 099 | 1 461 | 2 298 | 1 981 | 3,37% | 74,2% | 25,8% | 0,91% | 63,9% | 36,1% |
| Placement 2 – W25-35-cats-interest | 255 | 148 | 206 | 183 | 0,30% | 80,7% | 19,3% | 0,08% | 71,8% | 28,2% |
| Placement 2 – W25-35 | 11 735 | 5 443 | 8 994 | 7 059 | 13,18% | 76,6% | 23,4% | 3,25% | 60,2% | 39,8% |
| Placement 3 – mix W25-35 and W25-35-family&pets | 1 413 | 716 | 1 051 | 967 | 1,54% | 74,3% | 25,7% | 0,45% | 68,5% | 31,5% |
| Placement 3 – DMP LAL WebsiteCatOwners&120S | 23 240 | 2 838 | 4 736 | 13 040 | 6,94% | 20,4% | 79,6% | 6,00% | 56,1% | 43,9% |
| Placement 3 – mix DMP LAL and retargeting | 67 | 41 | 57 | 47 | 0,08% | 85,9% | 14,1% | 0,02% | 70,4% | 29,6% |
| Placement 3–DMP_CatOwners&120S | 516 | 129 | 154 | 425 | 0,23% | 29,9% | 70,1% | 0,20% | 82,3% | 17,7% |
| Placement 4 – W25-35 | 4 489 | 1 267 | 2 074 | 2 655 | 3,04% | 46,2% | 53,8% | 1,22% | 59,1% | 40,9% |
| Placement 4 – DMP LAL Cat Owners M | 1 156 | 136 | 237 | 616 | 0,35% | 20,5% | 79,5% | 0,28% | 53,3% | 46,7% |
| Placement 4 – W25-35-cats-interest | 1 456 | 413 | 657 | 893 | 0,96% | 45,1% | 54,9% | 0,41% | 61,3% | 38,7% |
| Placement 4–DMP_Cat_Owners.csv.decrypt.u. | 1 076 | 227 | 297 | 814 | 0,44% | 27,6% | 72,4% | 0,37% | 75,7% | 24,3% |
| TOTAL | 41 347 | 9 476 | 15 537 | 24 045 | 22,77% | 37,6% | 62,4% | 11,06% | 58,2% | 41,8% |
Table 5 shows the verification data of one of the companies. The method of analysis is as follows: in DMP cookies are collected from all unique users who saw the campaign, compiled into unique data sets for each inventory type and transferred to a partner research company, in which cookies are compared with the participants of the panel study.
For each site on which the placement took place, it is possible to analyze the quality of a segment. It can be noted that the lowest level of hit in CA in this case on sites 1 and 4 for user segments (53.3%), which is lower than the probability of organic hit TA with the widest possible targeting on socio-demographic parameters. The best result was recorded on site 3 for the “mix MP all and retargeting” and “DMP_CatOwners&120S”segments. This indicates the high quality of the created look-a-like audiences, based on the analysis of large data sets of the behavioral factors of the audience. The variance of the set is not big (about 1%) but the overall result is just 58,2% TA Reach which is comparable with organic TA reach for the mentioned criteria (if no special targeting is made).
Based on these data it can be concluded that in some cases, expensive Data Mining helps you to win only a small improvement in accuracy and ROI in this case is negative. However, with the right data collection and interpretation, it is possible to provide a significant business benefit. To do this, you need to constantly monitor the quality of advertising campaigns, based on a pre-prepared KPI system. Basing on post verification of the results in cooperation with sociological research agency it can be concluded that in some cases, expensive Data Mining helps you to win only a small improvement in accuracy and ROI in this case is negative. However, with the right data collection and interpretation, it is possible to provide a significant business benefit. To do this, you need to constantly monitor the quality of advertising campaigns, based on a pre-prepared KPI system.
Conclusion
Having data is important, but it is not useful unless you can make sense of it. There is clearly overlap between the analytic capabilities of the DMP’s and the new age analytics firms – that may or may not change as the ecosystem evolves. These media mix modeling companies (MMM’s), whether bottom-up or top-down, allow customers to make sense of big data and make better marketing decisions. Agencies occupy the innermost circle of the ecosystem – they are currently in flux and redefining themselves so that they can add more value to (and extract more benefit from) other players in the system. The progressive marketing organization is depicted as an ellipse, so it can touch all the players (concentric circles) except the big data investors. This demonstrates the potential interactions progressive marketing organizations must contemplate when developing an IMC strategy.
Many firms are too small to have direct relationships and expertise in the tools used by the DMP’s, DSP’s and MMM’s and must rely in part (or fully in some cases) on advertising agencies to fill this gap. The purpose of this course work was to study the most common problems associated with media purchases in the field of FCMG, as well as to identify ways to use big data analysis to solve these problems. The theoretical foundations of big data were studied, the study of the modern market of digital agencies engaged in research in this area was carried out. Also, the main difficulties were identified, and the practical solutions are provided in order to optimize media expenses on brand building in FCMG market.
Literature
Aghaei Mohammad [et al.] An Examination of the Relationship between Services Marketing Mix and Brand Equity Dimensions [Journal] // Procedia – Social and Behavioral Sciences. – 2014. – Vol. 109. – pp. 865-869.
Association American Pet Products Pet Industry Market Size & Ownership Statistics [Online] // American Pet Products Manufacturers Association, Inc. – 2 11, 2018. – http://www.americanpetproducts.org/press_industrytrends.asp.
Berger Marc L and Doban Vitalii Big data, advanced analytics and the future of comparative effectiveness research. [Journal] // Journal of Comparative Effectiveness Research. – 2014. – 2 : Vol. 3. – pp. 167-176.
Boyd D. and Crawford K. Critical Questions for Big Data [Journal] // Information, Communication & Society. – 2012. – 5 : Vol. 15. – pp. 662–679.
boyd dana and Crawford Kate Six Provocations for Big Data [Journal] // Social Science Research Network: A Decade in Internet Time: Symposium on the Dynamics of the Internet and Society.
Chen Hsinchun, Chiang Roger H. L. and Storey Veda C. Business intelligence and analytics: from big data to big impact [Journal] // Management Information Systems Quarterly. – 2012. – 4 : Vol. 36. – pp. 1165-1188.
Hanssens Dominique M. [et al.] Consumer Attitude Metrics for Guiding Marketing Mix Decisions [Journal] // Marketing Science. – 2014. – 4 : Vol. 33. – pp. 534-550.
Katal Avita, Wazid Mohammad and Goudar R. H. Big data: Issues, challenges, tools and Good practices [Online]. – 2013. – 2 11, 2018. – http://stat.purdue.edu/~doerge/bioinform.d/spring16/katalwazidgoudar_2013.pdf.
Lamberti Lucio and Noci Giuliano Marketing strategy and marketing performance measurement system: Exploring the relationship [Journal] // European Management Journal. – 2010. – 2 : Vol. 28. – pp. 139-152.
McVeigh K. Margaret Making the connection: Lev Manovich’s Texas and the challenges of interactive new media narrative [Journal] // Digital Creativity. – 2011. – 2 : Vol. 22. – pp. 78-90.
MDC Partners | Strategic & Creative Marketing Agencies [Online]. – 2 11, 2018. – http://www.mdc-partners.com/#agencies.
Unold Jacek Information Technology in the Marketing Mix of a Modern Business [Online]. – 2001. – 2 11, 2018. – http://link.springer.com/chapter/10.1007/978-1-4615-1341-4_29.
Cite This Work
To export a reference to this article please select a referencing stye below:
Related Services
View all


Related Content
All TagsContent relating to: "Marketing"
Marketing can be described as promoting and selling certain products or services to meet the needs of the customer. Tasks involved with Marketing include market research, content creation, advertising, and more.
Related Articles

DMCA / Removal Request
If you are the original writer of this dissertation and no longer wish to have your work published on the UKDiss.com website then please: