Dissertation on the Capacity of Fiber Optic Network Connections
Info: 8420 words (34 pages) Dissertation
Published: 23rd Nov 2021
Tagged: CommunicationsTechnology
ABSTRACT
Since the earlier implementations of fiber-optic communication systems thirty years ago, the capacity carried by a single-mode optical fiber has amplified by an overwhelming 10,000 times. Most of the development happened in the starting two decades with growth slackening to ten times in the latter decade. Over the similar three decades, network traffic has augmented by a much slighter factor of 100, but then the most of the growth occurred in the past few years, when data starts leading network traffic. As per current growth rate, the following factor of 100 in network traffic growth will occur within a coming few years. The great variance in growth rates between the delivered fiber capacity and the traffic demand is predictable to generate a capacity deficiency in only 10 years. The starting report describes the network traffic and capacity growth and extrapolations for the future. Then later studies the technological challenges of growing the capacity of single-mode fibers by presenting a capacity limit survivable optical fibers. Finally, the last part of the report discusses about overcoming these limits and then briefly studies about estimating the fiber capacity.
INTRODUCTION
Optical communication is unobstructed for the transmission of huge quantities of data over long distance with low latency in addition it causes modern communications networks. The transmission capacity of optical system technology has made histrionic steps over the eras since its outline at the beginning of 1970s. The initial years of optical communications were categorised by a firm development of technology, a reasonable rate of upsurge of bit rate in the single optical channel maintained on these systems and the steady variation of the optical frequency transmission windows from 800 to 1300 to 1550 nm. The later part of the 1990s saw remarkable increase in system capacity carried about using wavelength division multiplexing (WDM) enabled by optical amplifiers. This technical insurgency exploded massive speculation in system development equally from traditional sellers as well as new competitors, and the capacity of industrial light wave systems augmented from less than 100 Mb/s when they debuted in the 1970s to unevenly 1 Tb/s by 2000. Which is an growth of more than 10 000 times in 3 decades, nevertheless more amazingly, the initiation of WDM give rise to in a factor of 1000 increase in just 1 decade. It was permitted by the simple addition of more wavelengths to systems which were not restricted by the existing optical bandwidth.
Optical fibre nowadays supports the worldwide communications organization with state-of-the art laboratory experimentations accomplishing data values above than 50 Tb s−1, by means of hundreds of wavelengths, across a single fibre core. The industrial systems trail these accomplishments but are not far behindhand. For several years, it has been understood and appealed that, for all practicable resolves, optical fibres have countless capacity which would not ever be drained. Up till now, the expansion of optical fibre technology has just about become the ‘victim’ of its own accomplishment.
Much of worldwide data and voice traffic is elated using optical fibers, intersected to outline the global fiberoptic networks. The demand for bandwidth keeps on increasing exponentially at about 60% per year, it is of major appeal to research the transmission capacity among two sites in such optical networks. The purpose to study this topic gives knowledge about the utmost precise capacity estimate feasible for a “fiber channel” well-defined in the perspective of transferring information in optically-routed networks (ORNs). Meanwhile its basis, information theory has been useful to numerous communication channels with immense achievement. The utmost significant variance among the optical fiber and another transmission media that have been thought for capacity studies is the manifestation of Kerr-nonlinearity, that is, the propagation properties of the medium conversion with growing signal power. This property has considerable outcomes. Although linear physical media disconcerted by additive noise commonly give rise to channel capacities that surge monotonically with transmit power due to an augmenting SNR, we may discover that the negative influence of nonlinear signal distortions nurtures at a faster rate than the SNR capacity gain at high signal powers in addition for a band-limited channel. This performance might change the channel capacity into a nonmonotonic function of the transmitted power, besides this the channel capacity will show a noticeable maximum at a finite signal power level or SNR. Fiber channel capacity estimation displays such behavior and consequently fluctuates basically from linear channels whose capacities have been generously considered. Applying information theory to the fiber channel confronts numerous main challenges. A significant struggle instigates from the presence of three phenomena in the fiber channel: noise, filtering, and Kerr nonlinearity, as visualized in Fig.1. These three phenomena are different in nature, occur simultaneously, are dispersed alongside the propagation path, and impact each other. Fiber chromatic dispersion is a form of all-pass filter and can introduce substantial memory into the channel.
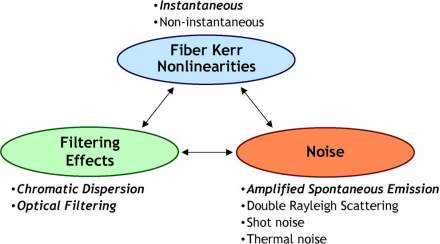
fig 1: List of the physical phenomena present in the optical path classified in three groups: 1) Fiber nonlinearities, 2) filtering, and 3) noise.
NETWORK TRAFFIC
Internet traffic has been increasing at large rate from the the earliest days of personal computers. At different times different applications are developed as the drivers of this growth, but a fairly steady growth rate is shown by a examination of growth rates over the past 15 years.
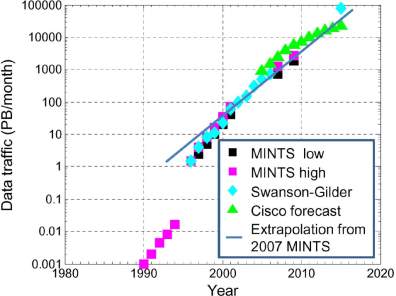
Fig. 2. North American Internet traffic.
In Fig. 2 the traffic data of North America from various sources has been shown over the period from 1990 through the present and various forecasts up to 2015. The two sources for the traffic data are the Minnesota Internet Traffic Study (MINTS) and a report from the Discovery Institute by Swanson and Gilder. Tn the MINTS data a period of rapid growth in 1996 is shown, but the remainder of the years shows that the growth rate was ranging from 100% a year in the early years to 50% to 60% a year till 2000. The latest growth rate calculated from this given data is 50% to 60% a year till the end of 2008. The data of Swanson and Gilder shows very good agreement with the data of MINTS. The other data on the chart is from a forecast created by Cisco in 2007 and again revised in 2011. The forecast from 2007 is consistent with the data of 2008 from MINTS and estimates a similar growth rate till 2011, while the revision in 2011 suggests a little reduction in growth rate. While the current calculated growth rates are very much less than the Bdoubling every 100 days[ sometimes mention in the late 1990s to 2000 , they still provide an increase in the traffic by a factor of 100 in ten years. The solid line shown on Fig. 2 is set at the mean of the high and low estimates for year 2007 and mentioned using the predicted growth rate for late 2008. It is shown that the rate of growth has been fairly consistent until 2000. There is a large variety of services that underlie the traffic demand described before. It is possible to observe a reason for the growth in the traffic that do not dependent on the individual services but instead depend on the trends in the technology used to help those services. perhaps, it is useful to see the evolution of speed of microprocessor and data storage. The Top 500 organization records the increase in the performance of the 500 fastest supercomputers and has shown an increase up to 10 times since the early 1990s. this similar improvement rate has been also shown in Individual microprocessors. However the data traffic originates and terminates on the machines designed with these processors, it is clear that the traffic scales are essentially the of same rate. Similarly traffic can be said a movement of data. The International Data Corporation (IDC) has predicted the total amount of data which is stored to be increase by a factor of 10 in next 5 years again surely equal to traffic increase rate. Both the devices speed connected with the network and the information stored are always at the same rate that is observed for traffic of the network.
FIBRE CAPACITY LIMITS
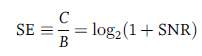
What limits the continued growth of achievable data rates in optical fibres. Claude Shannon first introduced the theory of channel capacity in 1948 in his paper. The result from his work states that for any of the channels, a maximum transmission rate is always exits which can be achieved with low error rate only, and that above this needed quantity no reliable transmission of data is possible. however, for most (if not all) channels, there is no closed-form expression exist for the channel capacity. Perhaps, most of the channels (e.g. copper wires and wireless channels) can be perfectly modeled with the use of an additive white Gaussian noise (AWGN) model of the channel, for this case the channel capacity is the elegant equation
C =B·log2(1 + SNR), eq1
where B is the bandwidth of channel and SNR is the signal-to-noise ratio. Since the derivation, almost over 60 years ago, the theorists of coding and information have tried to approach this limit of capacity with lots of low-complexity coding schemes. They have indeed succeeded in case of binary modulation with performance within fractions of a dB. These efforts can be found as in a good. The use of the information-theoretic capacity concept for the optical fibre channel dates to the work of Splett et al. in 1993. Eventually, that this concept became popular recently in the optical fibre literature. This was prompted by the continously slow rate of the dramatic capacity growth, since the optical fibre channel is nonlinear, it has become constrained. The analysis of channel capacity has become surprisingly difficult. A better review is provided by Essiambre & Tkach. The optical fibre channel is completely nonlinear, this means that the refractive index of the propagation medium neff changes in response to the change in the strength of the square of the electric field E or optical intensity I,
neff =n0 + n2I, eq 2
where n0 and n2 are the linear and nonlinear refractive indices, respectively; the normalized time averaged electric field E is related to optical intensity as |E| = √P, where P is the optical power in the fibre and I =P/Aeff with Aeff the effective area of the fibre. For silica, n0 ≈1.5 and n2 ≈3 × 10⁻²⁰ m2W−1. After a transmission distance L, the nonlinear optical Kerr effect will result in a phase shift, which, when added to the shift from linear propagation, results in a total phase shift, given by
ϕ =k0n0L + ϕNL, eq 3
where k0 =2π/λ0 is the free-space wavenumber, λ0 is the optical wavelength and ϕNL is a nonlinear phase shift. This phase shift depends on the optical signal power P as
ϕNL =γ PL eq4
and γ is the fibre nonlinear coefficient, a measure of nonlinearity,
γ = k0n2/Aeff
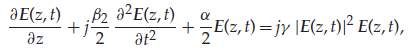
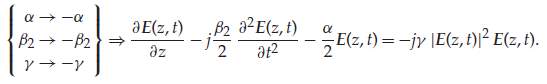
Channel capacity calculations require a channel model (also known as channel law). As no unambiguous (and simple) channel model exists it is a trouble in calculating the capacity of the nonlinear optical fibre channel. As stated above, the NLSE is a precise model; though, it is not definite, that is the throughput of the channel is not articulated as a simple function of the input. The nonlinear fibre channel also introduces memory and the signal also interacts nonlinearly with the ASE noise. All these effects present a considerable challenge to the definition of the nonlinear channel model, a source of some debate of recent years, and a focus of much recent research activity, as explained by Agrell et al. There have been numerous proposals to overcome the Kerr nonlinearity limit or at least to mitigate the impact of nonlinearities. Transmission of more data within a finite bandwidth requires greater optical power levels P, which leads to the power-dependent nonlinear distortion of the transmitted data. This imposes a Kerr nonlinearity limit, sometimes referred to as the nonlinear Shannon limit. Strictly speaking, however, this limit is only a lower bound to the channel capacity, as it assumes that nonlinear interference is noise (whereas, as shown above, it is deterministic). The propagation of the amplitude and phase of the electric field E is governed by the nonlinear Schrödinger equation (NLSE).
 eq 5
eq 5
SYSTEM CAPACITY
Optical communications underwent a revolution in the 1990s as optical amplifiers and WDM enabled the information carried on a single fiber to move from a few gigabits per second to over one terabit per second. This rapid expansion of system capacity is visible in Fig. 3. The points on the figure are total capacities for a single fiber in laboratory/research demonstrations. Points are also distinguished by whether WDM is employed. Generally, only points which represent a new record of capacity are plotted. Various time periods exhibit relatively stable growth rates with relatively sharp demarcations between them. We see an initial rapid rise in capacity for single channel time division multiplexing (TDM) demonstrations as researchers employed available microwave components in digital circuits.
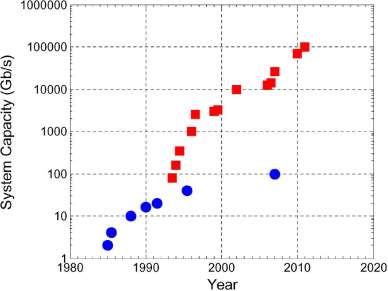
Fig. 3: Demonstrated system capacities. Single channel TDM systems (filled circles) WDM systems (filled squares).
Development levels-off in the later 1980s as the optical system speed turn into restricted by the speed of components and additional advancement was regulated by the rate of technological expansion of transistors. Additional rapid rise in capacity begins in 1993 when the accessibility of optical amplifiers, dispersion management, and gain equalization empowered the function of WDM. The existing spectrum was swiftly occupied by more channels until 1996, when the spectrum was almost occupied, and the first 1 Tb/s experiments were being performed. From this time until the current, a slower rate increase is observed in capacity as research focused on increased spectral efficiency (SE). Fig. 4 demonstrations the Spectral efficiency achieved in these illustrations as a function of year. It can be seen from the figure that enhancements in Spectral efficiency have driven the improvements in capacity. The present capacity highest of 101.7 Tb/s attained a Spectral efficiency of 11 b/s/Hz using coherent detection, offline processing and pilottone- based phase-noise mitigation.
The modulation format is quadrature amplitude modulation (QAM) with 128 constellation points (128-QAM). The signal-to-noise ratio required for this format, allowed transmission over only three relatively short, Raman-amplified spans, is combined with the limitations imposed by impairments arising from optical fiber nonlinearity. The Spectral efficiency of this result is impressive and it is worth noting that improving it by a factor of two via a more complex constellation would require the use of 16 384-QAM and would increase the required optical signal-to-noise ratio (OSNR) by about two orders of magnitude making transmission over useful distances impossible given the presence of nonlinear effects in fibers.
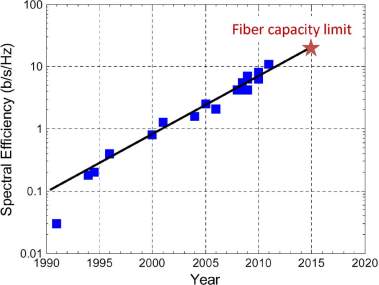
Fig. 4: Spectral efficiency achieved in research demonstrations versus year.
Fig. 5 shows the capacity as a function of the year of introduction of commercial optical communication systems. These figures are tend to track the research illustrations of Fig. 3 with a three to seven-year delay. The point at 8.8 Tb/s in late 2009 corresponds to a system with 88 100-Gb/s channels using polarization-multiplexed QPSK modulation and coherent detection. The solid lines in Fig. 5 shows the continuous representation of system capacity vs. year and are projected into the future. A growth rate of less than 20% per year is shown by the slope of the line from 2000 forward. The data traffic extrapolation in the network traffic composed of described above combined with voice traffic which dominated the network before 2002 but grows slowly is demonstrated by the curve in Fig. 5. Important thing is that the total network traffic and system capacity cross twice. First, in 2000 commercial system capacity increases through the total network traffic and it became possible to buy a system that could carry the entire network traffic on a single fiber pair. Second, the two curves cross again in 2008, when traffic growth resulted in network traffic exceeding system capacity.

Fig. 5. Commercial system capacities (squares) and total network traffic including voice (blue curve) using measurements and measured and projected voice traffic as of 1998.
In the succeeding years, the projected curves diverge with traffic surpassing capacity by more than a factor of 10 per decade. It is important to note that there is no obvious reason to contrast network traffic with the capacity of a single optical communication system; however, the contrast can be defensible, at least when plotted on a logarithmic axis. The capacity of a link need apparently be greater than the traffic passed on that link; stereotypically peak to average traffic ratios, the factor is accounted between two and five. Undeniably, the traffic on a link is not the identical as the traffic in the network. In North America, we might expect that link traffic would be roughly three to five times lower than network traffic as there are three to five links passing east to west. These two errors are in contrasting tracks in addition one might expect that the evaluation carries at least qualitative and order-of-magnitude value. It is significant for the speed of interface rates to the networking equipment to increase as well to limit the increase in complexity of the network as system capacity scales to meet the growth of network traffic,. Fig. 6 shows interface rates for a variety of networking equipment plotted against the year of commercial introduction.
The plot starts with an primary high-speed interface at 168 Mb/s, through nowadays. The years previous than 2000 are categorised by a variety of rates for various layers of the network, with cross connects and internet protocol (IP) routers using lower rates than those available for transmission. In 2000, we see a remarkable coalescing of rates at 10 Gb/s for transmission, cross connects, and routers.
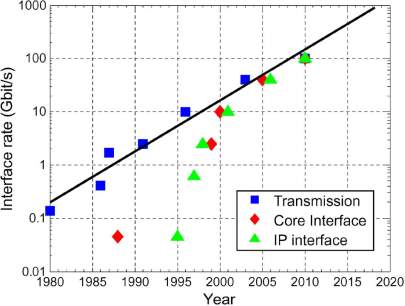
Fig. 6: Interface rates for a variety of networking equipment versus year of introduction. Optical communication systems (squares), cross connects (diamonds), and IP routers (triangles).
The line on the diagram is represented over the transmission points and efforts to project the evolution of interface rates into the following decade. This extrapolation proposes that 1-Tb/s interfaces will be used towards the end of the decade. The slope of the line is coarsely a factor of ten in a decade similar to that observed for the extrapolation of system capacity. Thus, far we have only examined trends and extrapolated their continuation. Now we our next consideration is to study the requirements that these trends in traffic and capacity will place on system design. We initiate by studying the evolution of a number of key system constraints. The most basic WDM systems were introduced in 1995 and had between four and eight 2.5-Gb/s channels. These first systems operated on a 200-GHz channel spacing resulting in a SE of 0.0125 b/s/Hz and had capacities on the order of 20 Gb/s. Through the year 2000, systems had swiftly progressive to 80 or more 10-Gb/s channels operating on 50-GHz spacing for capacities of nearly 1 Tb/s, and a Spectral efficiency of 0.2 b/s/Hz. To obtain the same factor of 10 improvement over the next decade would imply systems with SE of 20 b/s/Hz , 1-Tb/s channels and capacity of 100 Tb/s. Evidently these are very interesting stipulations. In fact, additional upsurge in capacity will be obstructed by significant limitations arising from fiber nonlinearity as we see below.
LIMITS TO SYSTEM CAPACITY
A. SHANNON CAPACITY
The capacity of a channel can be designated as the asymptote of the rates of transmission of information which can be attained with indiscriminately low error rate. In his influential work, Shannon focused primarily on a channel that adds white Gaussian noise, in addition more precisely, the AWGN channel. Shannon’s information theory has been employed and adapted to extra composite channels such as digital subscriber lines (DSLs) over twisted copper wires, wireless communication, the photon channel and coaxial cables relevant to deep space and satellite communications. The signal-to-noise ratio that is SNR is defined as
SNR = P/N
where P is the signal average power and N the noise average power in a bandwidth B.
 eq 6
eq 6
B. RELATIONS BETWEEN SNR AND OSNR
The optical signal-to-noise ratio is the quantity typically reported to characterize the ratio between signal and noise in Optical communication systems. Whereas, in other parts of digital communication, the SNR is used. The quantities involved in both OSNR and SNR definitions are displayed in Fig. 7.
The OSNR is written as
OSNR=
P2NASEBrefeq9
where P is the average signal power, if polarization division multiplexing (PDM) is used, is summed over the two states of polarization, Bref is a reference bandwidth, commonly taken to be 0.1 nm, which corresponds to 12.5 GHz at 1550 nm and NASE is the spectral density of amplified spontaneous emission per polarization. Important thing to consider here is that the description of OSNR does not necessitate the signal to carry any data because the OSNR description uses a fixed reference bandwidth Bref instead of the symbol rate Rs which is used in the SNR definition. The OSNR also considers the noise in both polarization states independent of whether PDM of the signal is used or not. The relation between OSNR and SNR can be expressed as
OSNR =
ρRs2BrefSNReq 10
where p is rquals to 1 for a singly-polarized signal as well as p is equals to 2 for a PDM signal, and where NASE and N0 have canceled each other out since they represent the noise power spectral density that is the same physical quantity.
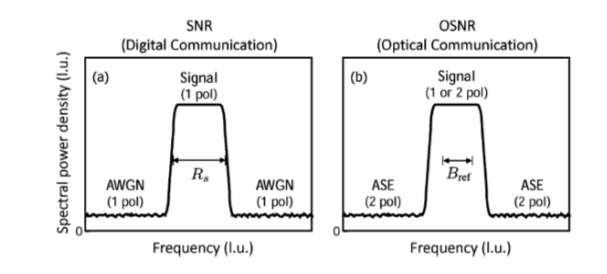
Fig7: Definition of signal and noise for the (a) signal-to-noise ratio (SNR) and (b) optical signal to-noise ratio (OSNR). l.u.: linear units.
C. NONLINEAR SHANNON LIMIT FOR A NONLINEAR FIBER CHANNEL
The fact that an optical fiber is a Kerr nonlinear medium, which raises many challenges which also a reason of late focus on the fiber channel. One of difficulty is the absence of closed-form analytic expressions describing fiber propagation for arbitrary input signal shapes and power levels. A second difficulty is that there is no well established framework of information theory to calculate the capacity of a channel that is simultaneously nonlinear and bandwidth-limited.
Whereas in the case of the nonlinear fiber channel, the capacity is limited by noise at low power but as power increases it becomes limited by fiber nonlinearity. Surprisingly, in the situation of optically-routed networks (ORNs), the high-power fiber capacity limitations originate mainly from fields present exterior to the bandwidth of the signal of interest and lead to highest capacity. Fig. 8 demonstrates schematically the nonlinear process which outcomes in capacity limitation for the nonlinear fiber channel. The existence in a fiber of a WDM channel occupying a distinct frequency band from a WDM channel of interest through the Kerr nonlinear effect, changes the refractive index of the fiber medium. Fiber capacities are calculated for a single WDM channel of notice in an ORN, if all other WDM channels are concurrently existing, but not known at the transmitter or receiver.
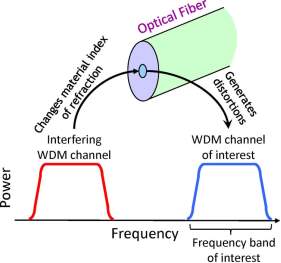
Fig. 8: Schematic illustration of the main nonlinear process limiting capacity in fiber.
PROPOSALS TO OVERCOME THE KERR NONLINEARITY LIMIT
A. DIGITAL BACKPROPAGATION
Digital backpropagation (DBP) is a fibre nonlinearity mitigation method which can be functional both to a single channel besides to a multi-channel WDM system. In the previous case to recompense for self-phase modulation (SPM)—the nonlinear interference of a channel persuaded by its own electric field; in the later situation to alleviate for nonlinear distortions from mutually multichannel nonlinearities (cross-phase modulation (XPM) and four-wave mixing (FWM)), and SPM produced by the electric field from adjoining WDM channels. This is done by simultaneously receiving and processing multiple optical channels using a high-bandwidth receiver.
In Digital backpropagation, the NLSE in 11 is resolved, in its inverse form, in the digital domain, by varying the sign of all the propagation parameters, permitting for the Kerr nonlinearity to be compensated, either completely or partially, i.e.
 eq 11
eq 11
Digital backpropagation objects at rebuilding the transmitted signal and is classically applied at the receiver. Though, DBP can also be applied at the transmitter or split between the two. In all cases, nevertheless, whole reconstruction of the signal is not possible for the reason that of nonlinear mixing among the signal and the ASE noise as well as other stochastic effects such as polarization mode dispersion. Smearing Digital backpropagation at the transmitter (sometimes termed as nonlinear pre-distortion or transmitter-based pre-distortion) or at the receiver gives roughly the similar gains (determined by the accumulation of noise from the amplifier in the link) with one less amplifier noise contribution in the transmitter-based DBP case. In the case of long transmission distances (greater than 10 spans), this difference is inconsequential. Moreover, it is clear that to decrease the contribution of noise, Digital backpropagation should be fragmented in the ratio of 50% : 50% among the transmitter and receiver. However, the greatest increase in the effectiveness of Digital backpropagation can be attained by reverse propagation of multiple channels, allowing the reimbursement of not only SPM also of inter-channel nonlinearities (XPM).
B. OPTICAL PHASE CONJUGATION
With the use of nonlinear optical processes, to exactly reverse the phase of a beam of light. Since the technique is known as optical phase conjugation (also called spectral inversion) as the reversed beam is called a conjugate beam. The character of the optical phase conjugator (OPC), typically situated in the centre of a symmetrically amplified link, is played by a nonlinear element such as an optically pumped optical fibre. For greatest presentation, a symmetric power profile is mandatory, to ensure that distortion triggered in the initial half of the link is exactly reversed by that in the second portion. Current accomplishments include dual-band optical phase conjugation of an optical superchannel by means of 75km spans of standard single-mode fibre, where it was possible to significantly eradicate inter-channel nonlinear penalties; this nonlinearity compensation give rise to in roughly 50% upsurge in transmission reach for 6 concurrently transmitted 400 Gbit s−1 DP-16QAM superchannels, a record total bit rate of 2.4 Tbit s−1 using one dual-band OPC. In upcoming years , it is probably possible to associate the OPC with DBP for further performance gains.
C. NONLINEARITY-TAILORED DETECTION
DBP is a zero-forcing equalization technique, and thus can be outperformed under certain circumstances by improved detection techniques that account for noise, nonlinearity and the memory of the channel. Given a noisy observation from the channel, optimal detection techniques minimize the error probability based on the noise distribution. For a multispan link, a closed form for this distribution is not available, and thus approximated solutions have been proposed. Additionally, unlike the single span case, the interaction between signal and ASE noise limits the SNR at the receiver. Because of this, the uncoded bit-error rate (BER) does not monotonically decrease as a function of the transmit power, even with improved detection. The problem of optimal detection of signals transmitted through a nonlinear channel with memory is theoretically important as it represents a preliminary step in the design of optimal receivers for more complex channel models. Recent promising results have been reported showing optimum detection for the single span fibre channel with a near-optimum detector in the presence of both nonlinear distortions and memory. Despite the significant nonlinearity at the high values of transmitted powers used, it was shown that uncoded BER can be made arbitrarily low in this regime when the detector is tailored to the nonlinear properties of the channel, effectively acting as a ‘nonlinear matched filter’. More work remains to be done in this promising area.
D. NONLINEAR FOURIER TRANSFORM AND EIGENVALUE COMMUNICATIONS
This approach is a transmission and signal processing technique that makes positive use of the nonlinear properties of fibre channels. The NLSE is a member of a unique class of integrable nonlinear equations that can be solved via the so-called inverse scattering transform method. This is an extension of the linear Fourier transform into nonlinear systems and is known as the nonlinear Fourier transform (NFT) . The principle of the NFT involves the transformation of the effects of both nonlinearity and dispersion to a simple phase rotation of continuous nonlinear spectral data that play the role of a Fourier spectrum for nonlinear problems. The pioneering work of Hasegawa & Nyu used discrete eigenvalues to encode and transmit information, as these are unaffected by dispersion and nonlinearity. There is currently much focus on this approach as it allows one to make positive use of the nonlinear properties of the fibre channel, since in integrable nonlinear channels, there are nonlinear normal modes that also propagate without any resulting nonlinear cross-talk; effectively in a linear manner. The conversion from the space–time domain into the nonlinear spectral domain and back is performed through the forward NFT and inverse NFT, respectively.
Alternative approaches to increasing capacity include a range of techniques which are in different stages of development such as coding tailored to the nonlinear channel, multichannel all-optical and electronic regenerators or noise squeezing, wideband optical amplifiers— capable of taking advantage of the entire low-loss fibre bandwidth of 400nm (1200–1600 nm), approximately 50 THz, rather than the limit imposed by the EDFAs of approximately 40 nm— and the use of negative n2 metamaterials which would allow for all-optical nonlinearity compensation.
ESTIMATING FIBRE CAPACITY
(A) CHANNEL CAPACITY AND MUTUAL INFORMATION
The channel capacity can be well-defined for continuous-time output a continuous-time input channel, which is demonstrated for an example through the NLSE. Though, the channel capacity is more generally specified between the output constellation symbols and the discrete-timeinput, that is when certain parts in the transmitter and receiver have been fixed (e.g. filtering, up/down-conversion, digital-to-analogue, modulators and A/D convertors.
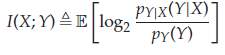
The connection among the input and output symbols is arbitrary, and therefore it is modelled using a conditional probability density function (PDF) pY|X(y|x), where X and Y are random vectors, both of length n, representative the transmitted and received symbols. Then the channel capacity is described as
 eq12
eq12
The optimization is over all input dispersals px(x) which satisfies a power limitation and I(X; Y) is the mutual information among the random vectors X and Y. Mutual information defines the information that X and Y share. Mutual information (measured in bits or bits s−1 Hz−1—by analogy with SE) is the reduction of uncertainty in X that we get from the knowledge of Y and vice versa. The channel capacity definition given above is conventional in the logic that it deliberates possible memory in the channel, and therefore random vectors are take into consideration. Moreover, the expression12 is mathematically tough to analyse. Nonetheless, this expression was used to estimate (numerically) the capacity of a heuristic channel model for dispersive fibre-optic links with finite memory.
If the the transmitted symbols are independent and identically distributed per px(x) and channel memory is discarded, a lower bound on the capacity can be found. If an average PDF py|X(y|x) is measured, we have
 eq 13
eq 13
where the Mutual information is defined as
 eq14
eq14
and E[・] is the expectation operator.
Another lower bound is obtained if no enlargement is completed in above equation. This is the case when the constellation symbols are drawn with the same probability as of a set of discrete constellation points (such as 16QAM or 64QAM), as generally complete in exercise. Mathematically, if we denote the transmitted QAM symbols by Xqam, obtained in the subsequent inequalities:
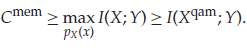 eq15
eq15
B. CALCULATING THE SIGNAL-TO-NOISE RATIO IN NONLINEAR FIBRES
The performance is limited by the ASE noise from edfas and the Kerr nonlinearity of a long-haul dispersion-uncompensated transmission system. Close precise performance of optical data signals in dispersive and nonlinear fibre can be attained from numerically explaining the NLSE. Nevertheless, it has been proposed that the nonlinear distortion in dispersion uncompensated optical fibre transmission systems can be approximated as additive noise with a zero-mean Gaussian distribution, as this is relatively time-consuming, which is statistically liberated from ASE noise. Whether this approximation characterises a valid channel model in the high nonlinearity regime is however a much-debated public question, as it is based on the perturbation model approach to solving the NLSE (or other simplifying approximations). This also predicts that the SNR tends to zero at high power levels which gives the incorrect impression of a channel capacity equal to zero in the highly nonlinear regime that is so-called Gaussian noise model of nonlinear interference (GN-model). As per equation, though, this only means that a lower bound given by the GN-model tends to zero, and not the channel capacity. Nonetheless, if used carefully, the Gaussian noise -model is a appropriate approximation and, can be used to provide valuable insights. The SNR specified by the Gaussian noise -model can be used to evaluate the Q2 factor or the MI.
According to the Gaussian noise model, and also underneath the hypothesis of incoherent accumulation of nonlinearity, the SNR in an optical communication systems can be articulated as
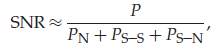
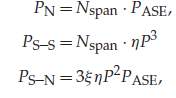
where P represents the optical signal power, PS–S is the total nonlinear signal–signal interaction, PN is the total ASE noise in the transmission system, PS–N is the total nonlinear signal–noise interaction and can be written as
C. CAPACITY LOWER BOUND CALCULATIONS
The expression for channel capacity for the memoryless AWGN channel in equation is used for the channel capacity of the nonlinear optical fibre channel can be lower bounded that is :
C =2B· log2(1 + SNR),
where the aspect 2 presented here designates two information-carrying polarization states studied in the fibre.
For a linear AWGN channel, the SNR is calculated as:
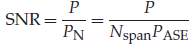
and the resulting lower bound becomes the actual channel capacity.
Whereas in the case of the digital signal processing following coherent detection performing electronic dispersion compensation (EDC) only, nonlinear signal–signal interaction (much larger than signal–noise interaction in equation, which can therefore be neglected in this case) is included in the noise term, in addition to ASE, so that the SNR is calculated as
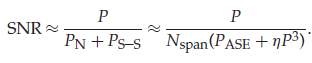
Whereas in the case of full-bandwidth DBP being applied as part of the receiver- or transmitter-based DSP, only the signal–noise nonlinear interference is included in the noise term (in addition to ASE) and all nonlinear signal–signal interactions (including intra- and inter-channel nonlinearities) are detached. The SNR is computed with the help of the following equation:
CAPACITY INCREASE
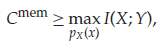
A major scientific challenge nowadays is to increase the overall capacity. Even though for the link which does not contain amplifiers that is an solitary link, the capacity can be explained by the quantum limit of detection that is shot noise emphasised that for any augmented link, an upper bound on the capacity, Cmem in, is given by the log2(1 + SNR) expression for an equivalent AWGN channel where the SNR is calculated using only the ASE noise. This consequence means that the capacity of the optical fibre channel nonlinearity do not increase capacity and is not above a log2(1 + SNR) expression, and that dispersion. The consequence of this outcome is that the best we can hope for resulting in a linear AWGN channel, also ideally compensate Kerr nonlinearities and dispersion and under this assumption the character of logarithmic function signifies that progressively smaller increases in channel capacity is lead by increasing power in the fibre.
As stated, the channel capacity of a communication channel is the extreme rate at which information can be communicated with an randomly low error probability. Certainly, the current determined scientific discussions regarding the channel capacity of several channels has results in the realization that all the optical channels conferred are certainly dissimilar: they depend on amplifier type, and on fibre type, the in-span compensation scheme—such as optical phase conjugation or optical regeneration and span length. For instant of the nonlinear channel, the channel properties are power dependent in the high-power regime or at the onset of significant nonlinearity. Individually of these separate channels will have their own channel capacity and evaluations essentially be made with extreme attention.
The attained outcomes are demonstrated in figure 9, where capacity is plotted against power for distances (2000km—a long-haul terrestrial link; and 10 000km— equivalent to a subsea, transoceanic system) and two different bandwidths. It is noticeable from figure that, for an SE of approximately 10 bit s−1 Hz−1 per polarization, it would be possible to transmit 1 Pbit s−1 in the linear regime with quantum noise-limited amplifiers at the launch power of 45dBm (approximately 30W total launch power) which will surpass the existing record for highest system capacity of 100 Tbit s−1 by roughly a factor of ten. Captivating nonlinearity of the channel into account leads to a reduction in capacity of approximately 500 Tbit s−1. With the help of full field DBP, most of the capacity can be retrieved which upsurges capacity to 850 Tbit s−1. Dispossessed of reliant upon the practice of spatial modes, a factor of larger than 10 is difficult to envision at current because of the scuffle of increasing transmitted capacity by decently escalating the cardinality of modulation arrangement.
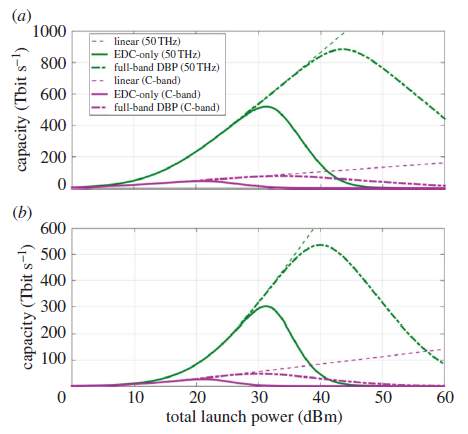
Fig. 9: Capacity versus total launch power for C-band and 50 THz at (a) 2000 km (25 spans of 80 km) and (b) 10 000 km (125 spans of 80 km).
CAPACITY OF SPATIAL MULTIPLEXING IN FIBERS
The spatial modes of an ideal fiber do not couple to each other during propagation. For such an ideal fiber, each spatial mode can be identified as a channel in the sense of Shannon. However, for practical fibers, linear coupling between modes almost invariably occurs due to imperfections in waveguide, material or due to fiber bending. Such linear mode coupling can occur at various locations along the fiber and with various coupling strengths. Despite this unpredictability in the coupling of individual modes, the overall effect of mode coupling on all modes is not arbitrary and obeys the coupled-mode theory (CMT). Coupled-mode theory can be applied for instance to the field evolution in each core of a HMCF and to spatial modes in MMF experiencing linear coupling. It has been shown that the matrix of coupling coefficients between modes is Hermitian, which makes the corresponding channel transfer matrix unitary. It is well known in information theory that a unitary transformation does not impact channel capacity.
Therefore, the coupling between modes in fibers does not impact capacity and one can use the capacity comparison between a single and M independent AWGN channels to assess the potential of spatial multiplexing in fibers.
A variety of phenomena can occur during propagation over fibers that can make capacity differ from the case of independent AWGN channels. The first category involves mode-dependent loss (MDL), and it includes polarization dependent loss (PDL) and spatial MDL. A similar impact on capacity is expected from mode-dependent gain (MDG) such as polarization dependent gain (PDG) or spatial MDG. Spatial MDL can originate from various sources, including a difference in fiber loss coefficients between spatial modes, a differential in transmission between spatial modes in discrete network elements, such as at the transmitter or receiver, at couplers, at mode multiplexers and demultiplexers, at reconfigurable optical add-drop multiplexers (ROADMs), or at the location of fiber splices. The phenomena of PDG and spatial MDG can only occur at the location of optical amplifiers. Note that the MDLs and MDGs mentioned above can be reduced by advanced fiber and device fabrication techniques.
Increasing the capacity of optical fibers through spatial multiplexing will only have a large impact on system cost if it is possible to similarly increase the capacity of the subsystems attached to the fiber. The development of spatial multiplexing in fibers will require dramatic progress in a broad area of integrated technologies including transceivers, optical amplifiers, wavelength multiplexers and demultiplexers and a variety of other components. A first example of this integration is monolithic receivers designed to simultaneously detect the signals from 7 cores of a MCF. This device received signals on two wavelengths from each core and provided polarization diversity
CONCLUSION
In report shows the study of fiber capacity and network traffic growths and pointed out that, at the rate of growth of the last decade, network traffic demand is now exceeding the capacity of individual fiber communication systems, reversing the situation that has existed since the beginning of the WDM era. presented the potential of using spatial multiplexing in fibers supporting multiple spatial modes in combination with multiple-input multiple-output digital signal processing to provide dramatic increase in capacity or reducing the energy of transmission by one to two orders of magnitude. Spatial multiplexing in fibers is the only new fiber technology that can provide the capacity scaling compatible with traffic demands in the next few decades.
Finally and optimistically, even relatively small increases in the achievable transmission rates may be converted into large gains in overall network capacity for networks operated in the nonlinear regime.
REFERENCES
[1] R.-J. Essiambre, G. Kramer, P. J. Winzer, G. J. Foschini, and B. Goebel, BCapacity limits of optical fiber networks, J. Lightw. Technol., vol. 28, pp. 662–701, 2010
[2] C. E. Shannon, Bell Syst. Tech. J. 27, 379 (1948); 27, 623 (1948).
[3] R.-J. Essiambre, G. J. Foschini, P. J. Winzer, G. Kramer, and E. C. Burrows, in Proceedings of the Optical Fiber Communications Conference (OFC) (Optical Society of America, San Diego, 2008), OTuE1.
[4] G. P. Agrawal, Fiber-Optic Communication Systems, 3rd ed. Hoboken, NJ: Wiley-Interscience, 2010.
[5] R.-J. Essiambre, G. Kramer, G. J. Foschini, and P. J. Winzer, “High spectral efficiency modulation for high capacity transmission,” Proc. IEEE/LEOS Summer Top. Meet., pp. 113–114, 2008.
[6] R. G. Gallager, Information Theory and Reliable Communication. Hoboken, NJ: Wiley, 1968
[7] Lavery D, Millar D, Maher R, Alvarado A, Bayvel P, Savory SJ. 2015 Why compensating fibre nonlinearity will never meet capacity demands.
[8] A. D. Wyner, BCapacity and error exponent for the direct detection photon channelVPart I,[ IEEE Trans. Inf. Theory, vol. 34, no. 6, pp. 1449–1461, Jun. 1988.
[9] J. Pierce, BOptical channels: Practical limits with photon counting,[ IEEE Trans. Commun., vol. 26, no. 12, pp. 1819–1821, Dec. 1978.
[10] J. Massey, BCapacity, cutoff rate, and coding for a direct-detection optical channel,[ IEEE Trans. Commun., vol. 29, no. 11, pp. 1615–1621, Nov. 1981.
[11] Liga G, Alvarado A, Agrell EA, Secondini M, Killey RI, Bayvel P. 2015 Optimum detection in presence of nonlinear distortions with memory. In Proc. European Conf. on Optical Communication (ECOC), Valencia, Spain, 27 September–1 October 2015. (doi:10.1109/ ECOC.2015.7341769
[12] I. Kalet and S. Shamai, “On the capacity of a twisted-wire pair: Gaussian model,” IEEE Trans. Commun., vol. 38, no. 3, pp. 379–383, Mar. 1990.
[13] T. M. Cover and J. A. Thomas, Elements of Information Theory, 2nd ed. Hoboken, NJ: Wiley, 2006.
[14] Rene´-Jean Essiambre, Senior Member IEEE, and Robert W. Tkach, Fellow IEEE Capacity Trends and Limits of Optical Communication Networks, invited paper 2012 IEEE
[15] Polina Bayvel, Robert Maher, Tianhua Xu, Gabriele Liga, Nikita A. Shevchenko, Domaniç Lavery, Alex Alvarado and Robert I. Killey, Maximizing the optical network capacity, Optical Networks Group, University College London, Torrington Place, LondonWC1E 7JE, UK, march 2017
Cite This Work
To export a reference to this article please select a referencing stye below:
Related Services
View all


Related Content
All TagsContent relating to: "Technology"
Technology can be described as the use of scientific and advanced knowledge to meet the requirements of humans. Technology is continuously developing, and is used in almost all aspects of life.
Related Articles

DMCA / Removal Request
If you are the original writer of this dissertation and no longer wish to have your work published on the UKDiss.com website then please: