How Does the Use of Coastal Management Strategies Differ along the Ventnor Coastline?
Info: 11273 words (45 pages) Dissertation
Published: 9th Dec 2019
Tagged: GeographyMarine Studies
How does the use of coastal management strategies differ along the Ventnor coastline?
Introduction:
Coastal defence, as defined by the Dorset coast forum is (forum, 2010) “A broad term used to include both flood defence and coast protection”. A coastal management strategy is also defined by BBC bitesize (Bitesize, 2017) as being “Physical management, of the coast, attempts to control natural processes such as erosion and longshore drift.” The aim of this research is to investigate the different coastal management strategies that have been implemented along the coastline in Ventnor, Isle of Wight and how they may differ. In doing so, I hope to investigate the different coastal defences and the effect each coastal management strategy has on protecting the coast. I also hope to observe why that strategy has been placed in a specific location and to whether there is something important at that location that needs extra protection against erosional processes. Therefore, for this investigation I will research the following question: “how does the use of coastal management strategies differ along the Ventnor coastline?”
I will aim my investigation along the Ventnor coastline but in particular focusing my research on the beaches of Ventnor and Monk’s Bay. To answer my investigation, I will use both primary and secondary data, including questionnaires, beach profiles, beach sediment sampling, land use survey, newspaper articles, photographs and house prices. This investigation is set out to investigate how the coastal management strategies may differ in anyway. I will be testing three separate hypotheses; the coastal management strategies are effective in protecting the Ventnor coastline, the age and pricing of houses and buildings effects the spatial distribution of coastal defences and people have positive perceptions of the coastal management strategies. I will investigate the first hypothesis by looking at beach sediment sampling, beach profiles and primary and secondary photographs to show how the strategies may have affected the coast, through the distribution of sediment and compare the state of the beach to what it looked like in the past. To research the second hypothesis, I will look at a land use survey and house prices to show whether there are older buildings closer to the coast. Also look at house prices to see whether these elements have affected the distribution of the management strategies and whether more effective strategies have been placed in certain areas. Finally, I will investigate my third hypothesis by carrying out questionnaires and collecting secondary newspaper articles. Therefore, I can see what people’s perceptions are of the coastal defences and to whether they have a positive impact on the community and people of that live, work or visit anywhere along the Ventnor coastline.
My investigation links to multiple areas of the Edexecel GCE specification such as 2B.6a weathering (mechanical, chemical and biological) because weathering influences the rate of recession, 2B.8a rapid coastal recession which is caused by physical factors and can be influenced by human factors which relates to the basis of my investigation of coastal erosion and recession, 2B.10a economic losses (housing, businesses, agricultural land and infrastructure) which relates to my project because it shows how different impacts may influence the decision of certain coastal management strategies been implemented, 2B.11a hard engineering approaches (groynes, sea walls, rip rap, revetments and offshore breakwaters) which links to the different management strategies that have been placed and why the council or government has chosen that specific technique and finally my investigation relates to 2B.11b which is soft engineering approaches which again shows why the council or government has opted for a certain management technique.
Geographical context:
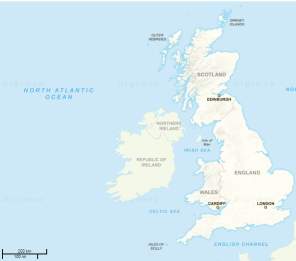
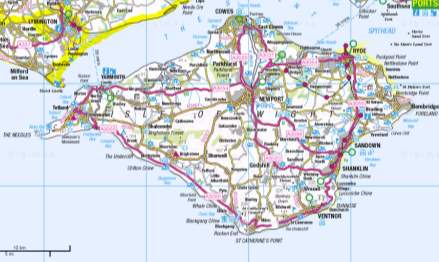
I decided to test these three hypotheses at two main places on the Isle of Wight in the English Channel these were Ventnor beach and Monk’s Bay as well I also collected some data along the coastline of Ventnor.
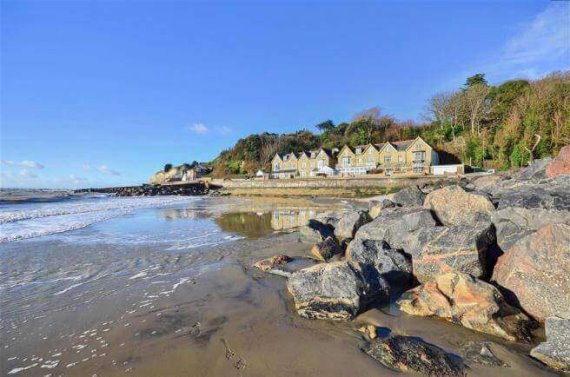
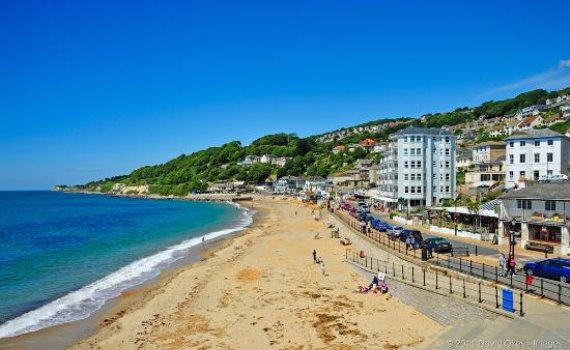
Ventnor is on the south coast of the Isle of Wight and it is a seaside resort with many houses and buildings which were built during the Victorian era. It is the highest point on the island with the higher part being known as Upper Ventnor. It is a relatively sheltered location however, the cliffs are made up of different clays, which when the ground becomes unstable, Ventnor suffers from severe landslips. Resulting, in the loss of many buildings and homes being lost to the sea due to cliff-fall and subsidence. Monk’s Bay is on the southeast coast of the Isle of Wight, with a strip of Victorian period houses. The cliffs at Monk’s Bay are also made up of different types of clay which are subject to cliff collapse and are made up of different imported rocks to try and avoid the cliffs from slipping and preventing any damage to the coast.
 National map of the UK:
The Isle of Wight


 Regional map of the Isle of Wight:
Ventnor
Monk’s Bay


Street view of Ventnor and Monk’s Bay:
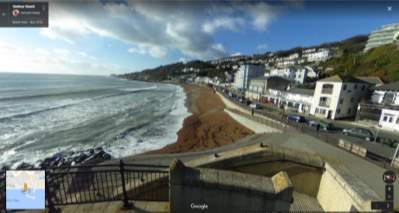 Ventnor:
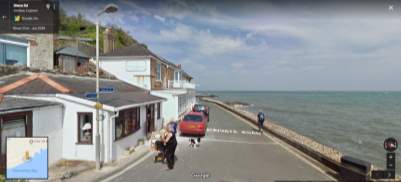 Monk’s Bay:
These two beaches were selected for particular reasons such as;
The main reason why I have chosen to collect data from Monk’s bay and Ventnor is because they are at either end of the coastline so I will be able to collect results and compare them to possibly gain different results. Another reason why I have chosen to do my investigation at Monk’s Bay is because it faces severe impacts to the coast, due to marine erosion, such as unstable cliffs. New studies are being carried out and developed, such as one stated by Isle of Wight County Press (Press, March 2017), to defend the area and identify the costs of replacing existing coastal defences or if it is cheaper and more beneficial to install alternative new defences. I also chose to carry out my investigation along the beach in Ventnor as it is the only defended strip of coastline that hasn’t improved or benefitted from the coastal defences. There is an existing concrete sea wall that runs along the coastline to Monk’s Bay which the wall is also protected by concrete tetrapod’s, because it faces extreme marine erosion and weathering. As a result, another proposal for a scheme to be carried out, by the Centre for the Coastal Environment (Coastal Management, 2013), to provide sustainable defences for the next 100 years. As said by the Shoreline Management plan for the Isle of Wight (Plan, 2008-2010) erosion rates are likely to increase over the years as a main result of the impacts of climate change. The organisations most responsible for deciding which management strategies should be placed where and why, are the Isle of Wight Council. The defences that are placed are decided based on guidelines created by Defra (Department of the Environment, Fisheries and Rural Affairs) (Plan, Reviewed 2008-2010) who are in charge of setting national policies for coastal defences.
Methodology:
Primary data:
- Questionnaires:
-I will carry out my questionnaires by using an IPad, as my only piece of equipment and using the app called “Poll Daddy” to generate an electronic questionnaire. I will then walk along the coastline from Ventnor to Monk’s Bay asking at least 15 people that walk past the questions in the middle of the day in June. I will input the results into the IPad recording the results and then I will download all the results and compare what people said at different points along the coastline. I will follow ethical dimensions by any not asking questions such as their age which I will simply assume what age group they fit into. This data collection method is random sampling as I will be asking anyone I walk past.
- Beach profiles:
-I will collect results using equipment such as; a tape measure, ranging poles and a pantometer which I will collect during the middle of the day and in the summer. I will begin by placing a tape measure along the width of the beach and then placing the first ranging pole at the highest point nearest to the shore. I will then place the second ranging pole where the beach has first noticeably dipped or increased in height where I will record, using the pantometer, the angle of the beach. I will then repeat this for 3 different points along the beach where I will eventually gain a table of results for both beaches. Any ethical issues regarding the environment I will make sure none of the equipment I am using has any impact on the environment or causes any damage. This data collection method is systematic sampling as I will be taking measurements at set intervals for example, every 10 metres.
- Sediment sampling:
-I will carry out my sediment sampling by using three pieces of equipment a transect, a tape measure and a ruler I will collect the results in the middle of the day and during the middle of June. I will begin by placing the tape measure along the width of the beach and then randomly placing the transect once within three different areas of the beach such as the high, middle and low parts. First placing the transect within the highest part of the beach, using the ruler I will measure the length of 10 different stones within the transect and identify the type of rock or stone it is. I will then repeat this twice again with placing the transect in the middle section of the beach and the lowest part recording all my results into a table. The same as the beach profiles ethnically I will make sure that none of the equipment affects the coast or beaches in anyway making sure there is no lasting damage or impact. Sediment sampling method will be random sampling as I will place the transect anywhere within the top, middle and lower part of the beach then randomly selecting 10 different rocks to measure and deciding its rock type.
- Land use survey:
-The land use survey I will begin by getting an IPad as my only equipment using an app called ArcGIS where you input a map of the area, in this case Ventnor, presenting the data you have inputted. I will start at the top of Ventnor known as Upper Ventnor and I will work my way down to the lower part collecting data on what each building is used for, for example industrial, commercial, housing etc. Also collecting results for the age the building was built such as Victorian, Post-War which the older the building the greater the number and darker the colour shown on the map also looking at the extent of damage to the building from none too severe rated from 5 (being severe) to 1 (being none). Once I have placed all my results into the app it will present them in a map of the area of Ventnor showing what the building is used for, its age and damage. Addressing any ethical issues, I will make sure whilst I am recording my results for the land use survey such as building damage I will make sure I am discreet so that I don’t offend the owner of the house or building in anyway. This data collection is stratified sampling as I will be collecting results from all the buildings around the area of Ventnor I am doing and deciding for all the buildings their age and structural damage.
- Photographs:
-For my primary photographs, I will simply use my mobile phone and take photographs to show an overview of what the beaches look like and the coastal management strategies that have been placed there. I will try and take these photos at all times of the day but mainly in the middle of the day. I will take these photos and compare them to older secondary photos to show how the beaches and coastline may have changed and whether this has effected what type of coastal defence is placed where. The only ethical issue of taking photographs is that when I am taking photographs of the area or of the beaches that I make sure that no one, that doesn’t want to be directly in the photo, is in it.
Secondary data:
- Newspaper articles:
-I will gather newspaper articles from either online, as there is a much larger range of sources about Isle of Wight’s coastline, or buy them from corner shops or local shops. I will use the newspaper articles to see whether the council or local government has different opinions to locals and residents. Also to discover whether there are specific reasons for particular coastal management systems to be placed in certain places along the coast.
- Photographs:
-The same with the primary photographs except I won’t take the photographs myself as I will collect them from the internet or other resources as I want to get a range of different times that the photographs were taken. I want recent photos as well as photos from years ago in order to compare the differences between them and to decide whether certain defences had been placed that weren’t there in previous photos.
- House prices:
-By looking online at estate agent websites such as Rightmove and Zoopla I will compare different houses and their ages, size etc, as to whether this greatly affects their selling prices or not. I can then compare them to the area they have been built for example Upper Ventnor or right by the beach to whether the cost of the house has influence over the choice of coastal management strategy.
Data presentations:
Questionnaires:
- Comparison of age between Ventnor and Monk’s Bay:
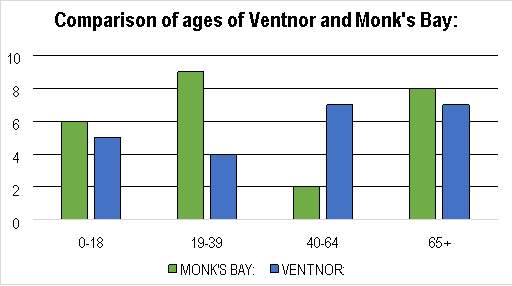
- Comparison of gender between Ventnor and Monk’s Bay:
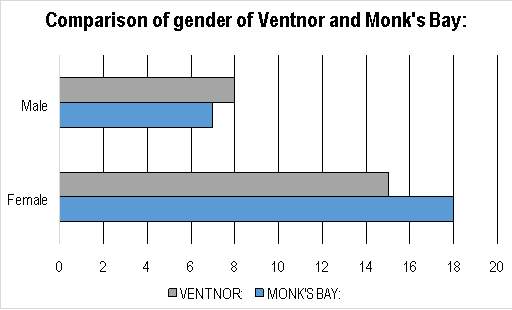
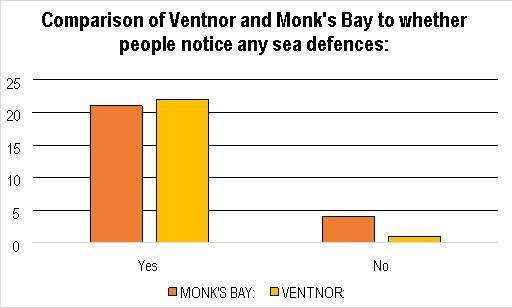
- Comparison of whether people notice any sea defences in action at either Ventnor or Monk’s Bay:
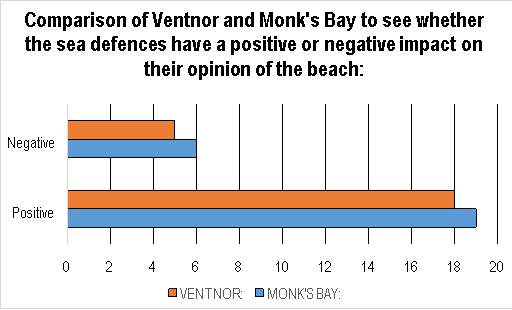
- Comparison of whether the sea defences have a positive or negative impact on people’s opinion of the beach:
Land use survey:
 Land use survey:
KEY:


 Building age:
KEY:

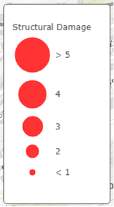
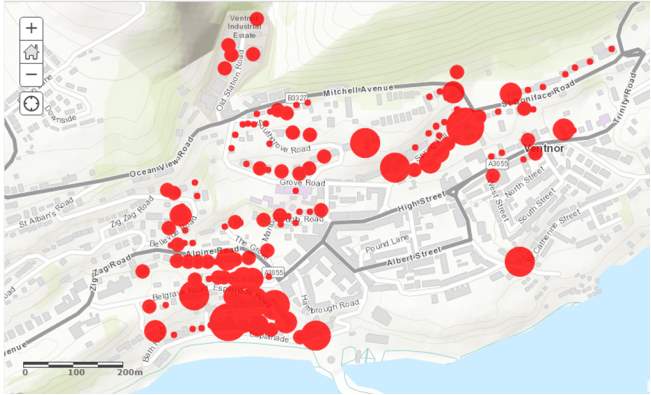 Structural damage:
KEY:
Annotated photographs:
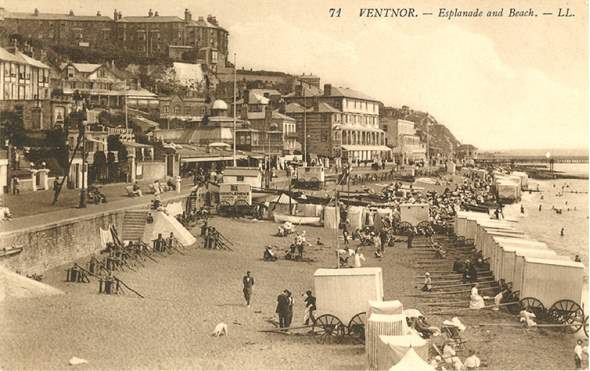
Evidence of process of Long Shore Drift has occurred as no defence system to prevent it.


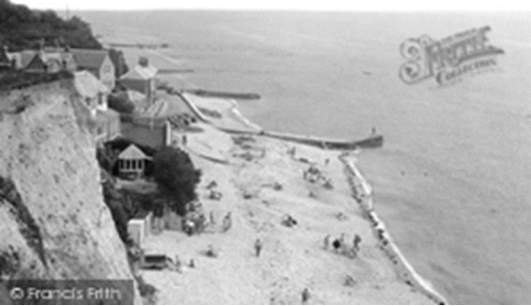
 Ventnor historic photos:
A sea wall has been placed just behind the beach to slow down the process of erosion.
Compared to the photograph above where the sea wall appears to have just been installed in this photo it appears the sea wall is almost overtopping.
The beach is really wide and erosion hasn’t seemed to have affected the beach too severely.
The beach is still quite wide and it appears Longshore drift has been slowed down as the beach doesn’t curve round.


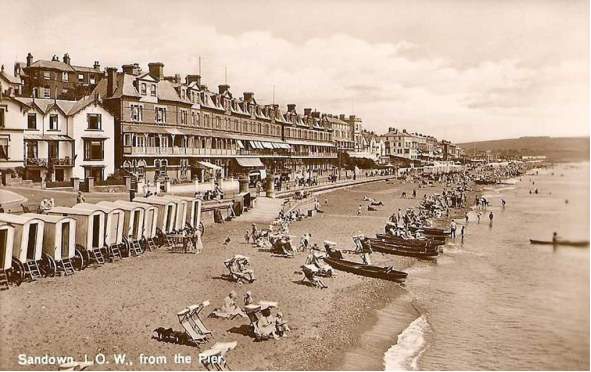
The beach consists of sand and is quite flat.
- Monk’s Bay historic photos:
Compared to the present day photographs the sea wall hasn’t been installed yet.

Shingle and pebble beach which appears to be quite steep.

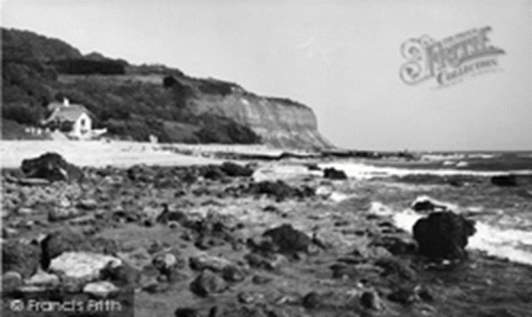

Rock armour has been placed to slow down the process of erosion.


Rock armour has been placed along the beach to try and slow down and prevent further erosion of the coast.
From a birds eye view the beach appears to be sandy but it is actually shingle and pebble.
The rock type of the cliff is made up of Blue Slipper Clay with a lot of flora positioned at the base of the cliff.

 Ventnor present day photos:
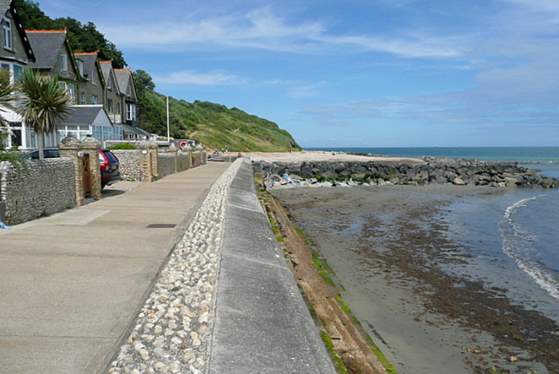
Compared to the historic photos the sea wall that was installed is still there and the risk of overtopping seems to have reduced.
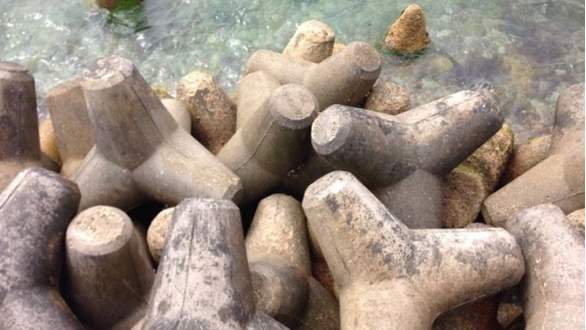
Tetra pods which were placed along the strip of walkway between Ventnor and Monk’s Bay to reduce impact of erosion.


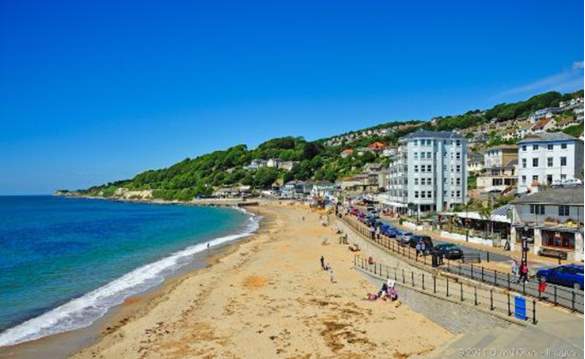
Compared to the historic photos the beach is still made up of sand but appears to be a bit thinner than the historic photos which is possibly due to the impact of erosion.
Behind the camera there is now a pier that has been placed to try and prevent longshore drift from occurring which wasn’t there before (shown in the historic photos).

 Monk’s Bay present day photos:
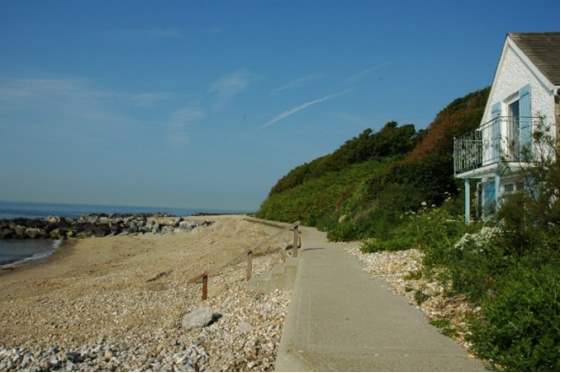
Compared to the historic photographs the rock armour is still there and has been reinstalled so it is more effective in protecting the coastline and the cliffs behind.

Compared to the historic photographs the beach is still made up of shingle and pebbles and appears to still be quite steep.
Compared to the historic photographs a sea wall has now been placed at the back of the beach to protect the houses behind and the cliffs from erosion.

House prices along the Ventnor coastline:
| Price: | Address: | Distance from coast/beach: | No. of bedrooms: | Building age: |
| £1,800,000 | St. Lawrence, Isle of Wight | On the sea front | 5 bedrooms | Victorian era but refurbished inside |
| £975,000 | The Esplanade | On the sea front | 11 bedrooms | Victorian marine villa built in 1845 |
| £749,950 | Esplanade, Ventnor, Isle of Wight, PO38 | On the sea front | 5 bedrooms | Brand new |
| £639,950 | Park Avenue, Ventnor, Isle of Wight, PO38 | Close to the beach but in upper Ventnor | 6 bedrooms | Victorian era |
| £550,000
(land for sale) |
Steephill Cove | Land to build on in front of the beach | – | – |
| £495,000 | Madeira Road, Ventnor | Not far from the coast with sea views | 4 bedrooms | Victorian era |
| £349,950 | Esplanade, Ventnor, Isle of Wight, PO38 | On the sea front | 2 bedroom apartment | Brand new |
| £270,000 | Mitchell Avenue, Ventnor, PO38 | Not far from the coast with sea views | 2 bedrooms | 1960s-1970s style building |
| £195,000 | Lowtherville Road, Ventnor, Isle of Wight | Quite far away from the sea front higher up in Upper Ventnor | 3 bedrooms | Post war period but refurbished inside |
| £172,500 | Ventnor, Isle of Wight | On the sea front | 2 bedroom apartment | Brand new |
| £93,000
(Actually at a reduced price for 60+) |
Albert Street, Ventnor, Isle of Wight | In the middle of Ventnor | 3 bedroom ground maisonette | 1960s-1970s style building |
| £45,000 | Pier Street, Ventnor, Isle of Wight | In the middle of Ventnor | Apartments | 1960s-1970s style building |
Data analysis:
- Questionnaires:
-Overall, my questionnaires in figure 3 show that majority of the people that we asked to fill out the questionnaire recognised or noticed some sea defences in action. In the area of Ventnor 22 people out of 23 noticed sea defences and within that 22, looking at figure 4, 18 people thought that the sea defences had a positive impact on the coastline. In between Ventnor and within the area of Monk’s Bay again looking at figure 3, 21 people out of 25 noticed sea defences in action and then within the 25, also figure 4, 19 people thought that the sea defences had a positive impact on the coastline. This shows how within the area of Ventnor more people had a positive perception of the sea defences compared to the people I asked in the area of Monk’s Bay. The questionnaires also showed that in the area of Ventnor (figure 7) only 2 people felt that the sea defences impacted their enjoyment of the coastline and 4 partially believed this. Compared to Monk’s Bay (figure 7) 3 people felt the sea defences impacted their enjoyment and 2 people partially believed this. This shows a similar result between Ventnor and Monk’s Bay showing how overall majority of people along the Ventnor coastline had a positive perception of the management strategies. This proves my overall question of “how does the use of coastal management strategies differ along the Ventnor coastline?” as people had a positive perception it shows that the coastal defences shouldn’t be replaced or removed as they don’t really impact the public in anyway. I was able to successfully follow the ethical dimensions of the questionnaires as I didn’t ask anyone directly their age or anyone questions that seemed as rude. I also think this was the correct method to choose as it showed to me the perceptions of the public who have influence over the type of sea defence being implemented.
- Beach profiles:
-Looking at figure 8 and 9 at my beach profiles show that both at Ventnor and Monk’s Bay the further along the beach you went the steeper it got. For example, we placed transect 3 closest to the shore which shows, for both Ventnor and Monk’s Bay, that the beach wasn’t too inclined. However, for Ventnor the angle of the beach was more of a gradual increase but for Monk’s Bay it had some anonymous results for example, an angle of 20 degrees. Transect 1 was then placed further along the beach showing on the beach profiles that the beach began to gradually get higher but then once we reached between 11-14 metres up the beach the angle of the beach then increased quite a bit. Transect 2 shows for Ventnor quite a continuous gradual climb overall but for Monk’s Bay, it had quite an increase in angle and then seemed to taper off the closer we got to the cliffs behind. For example, for Ventnor’s transect 2 between 1-17 metres the angles were all very similar and almost equal from an angle of 7degrees-5degrees whereas Monk’s Bay’s transect 2 between 7-9 metres away from the sea had a dramatic increase from an angle of 23 degrees-minus 3 degrees. This shows overall how the beach profiles prove my overall question of “how does the coastal management strategies differ along the Ventnor coastline?” as the sea defences put in place on the beaches of Ventnor and Monk’s Bay differ as in Ventnor the beach profiles were had more of a gradual smooth increase in angle whereas for Monk’s Bay there were more random greater inclines in the angle of the beach. This is suggesting the defences are different and more accurate for protecting the coast in Ventnor. I was able to successfully follow any ethical dimensions as none of my equipment damaged the environment or impacted it in anyway. I also think this method was the correct choice to use as it shows why a certain defence has been placed and whether it is effective in protecting the coastline.
- Sediment sampling:
-When looking at my sediment sampling, shown in figure 10, it shows that on average the mean length of the stones at Monk’s Bay were greater than those at the beach in Ventnor. For example, the mean length of the stones at Monk’s Bay went 43.7mm at the highest part of the beach then 20.4mm and finally 89.6mm at the point closest to the sea compared to Ventnor where it went 15.55mm at the highest point then 13mm and then at the point closest to the sea there was a mean length of 35.5mm. This shows how the sea defences at Monk’s Bay may not be as effective as the ones at Ventnor as there is almost an overtopping of sediment where the beach is a lot steeper and inclined. The results also show how the sediment sampling links to the beach profiles as they both show that at Ventnor and Monk’s Bay both have a change with their results in the middle section of the beach. For example, both beaches have a decrease in the mean length of the sediment at the middle section of the beach as there is a decline in the beach and then a random increase in the angle of the beach. Finally, the sediment sampling shows that at Monk’s Bay at the lowest point on the beach the mean length of sediment has increased quite dramatically from 20.4mm to 89.6mm which is a large increase. Overall, I was successfully able to follow ethical dimensions as none of the equipment I used damaged the environment or disturbed it in anyway and I also think this was the correct method to use for my investigation because it shows whether the distribution of sediment on the beaches is evenly distributed or whether the sea defences are needed to protect the coast better.
- Land use survey:
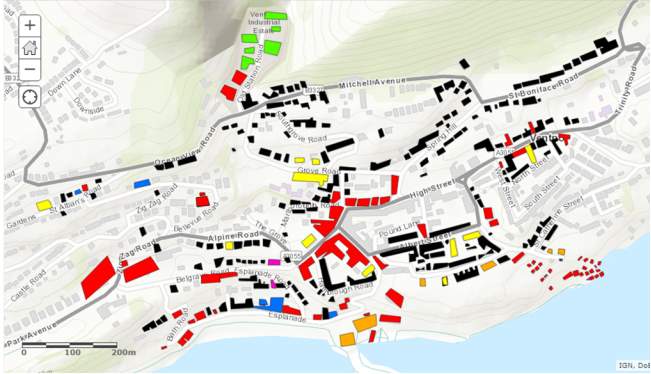
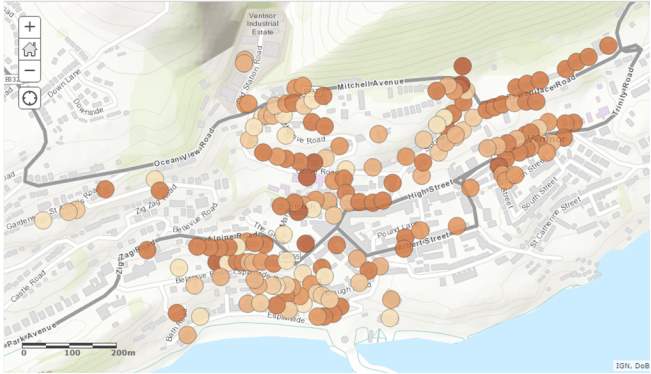
-My land use survey shows what buildings are being used for, their age and their structural damage in the area of Ventnor. The land use survey (figure 11) shows that majority of the houses are residential housing (shown in black) which are mainly situated in Upper Ventnor and along the seafront. This may be because the risks of erosion are increasing so new housing is being built further away from the coastline so that it is at less of a risk of being effected in the future. The land use survey also shows that a lot of the buildings closer to the sea front are used for commercial purposes (shown in red) such as restaurants, bars, shops etc. This is because tourists that visit the beach want easy access to facilities and if they are closer to the beach it may attract more tourists. The land use survey also shows in figure 12 the building age of each building ranging from >9 being the oldest to <0 being brand new. It also shows that the majority of older buildings are towards the east of Ventnor and the middle of Ventnor this may be because they are older so therefore, have been positioned further back so they are at less of a risk from erosional processes. I also think that most of the younger built buildings are closer to the sea front as they are new blocks of apartments or are used for commercial purposes so they have been refurbished and newly built to attract tourists. Figure 13 also shows the land use survey’s structural damage of the buildings ranging from >5 being severe damage such as cracks and slumping to <1 being no visible damage. Showing how most of the buildings with the worst structural damage are those closest to the sea front. This may be because they are older buildings and have older features as well as they are used for commercial purposes so tourists and locals may not take as much care. Overall, I think that the land use surveys prove my question of “how does the use of coastal management strategies differ along the Ventnor coastline?” because it shows that the older the building or the more severe appearance of structural damage are generally those closer to the sea front. Proving my question because if in one area of Ventnor there are older buildings or more expensive housing then a more effective defence may be placed in front of it to have a better chance of preserving the building. When I was collecting my data able to successfully follow ethical dimensions as I made sure I recorded my results so that no one saw or heard what I was saying therefore no one was then offended if I classed their home or building as old or having severe structural damage. I think the land use survey was a right method to choose as it showed what the buildings of Ventnor where being mainly used for, their age and structural appearance which may be factors that determine what defences are being placed where. Also showing a difference along the coast as Ventnor is the most populated meaning a lot more buildings and houses compared to the strip of coastline between Ventnor and Monk’s Bay, meaning more effective management strategies may be paced there to better protect the coast. However, instead of doing a land use survey I could have taken photographs and annotated and compared them to older photographs to show the age they were built and any damage that may have occurred to the building since being built.
- Photographs:
-When I was annotating and comparing the historic photographs, shown in the figures 14 – 21, of both Ventnor and Monk’s Bay to the present day photographs they show that more coastal defence systems have been installed. This is shown by Ventnor in the historic photos has only a sea wall but in the present day photos a pier with rock armour has been installed. It is also shown in the historic photos of Monk’s Bay where again rock armour has been placed to try and prevent erosion of the cliff but in the present day photographs a sea wall has been installed at the back of the beach as well. I think that the annotated photographs prove my overall question of “how does the coastal management strategies differ along the Ventnor coastline?” because it shows how previously years ago only the basic defences were placed to reduce the impact of erosion but nowadays there has been more defences placed. However, it does also disprove my overall question as the nowadays photographs, except from the Tetra pods, show that both Ventnor and Monk’s Bay don’t have any difference in the defence systems they have used as they both have a sea wall and rock armour. I was able to successfully follow ethical dimensions for the photographs as I made sure no one was in the photographs that didn’t need to be. However, I would have chosen another method and just use old and newer photographs from online as most of the photos I took when I was there didn’t show the coastal management strategies effectively and therefore only ended up using one of my photographs.
- Newspaper articles:
-The two newspapers that I looked at were written by DredgingToday.com and the Isle of Wight County Press (IWCP). The article by the IWCP (figure 22) is about how the coastal management restructure is being criticised as plans to disband the coastal management function. This newspaper article proves my overall question of “how does the use of coastal management strategies differ along the Ventnor coastline?” as it shows how people have a positive perception of the management strategies as they want to keep them in place as they are protecting the coast and slowing down the process of erosion. The other newspaper article (figure 23) is about how future plans and studies aiming to identify the cost of replacement or alternative coastal defences will be and are being considered and how these will be influenced by views of the public shown by the article saying “we are very interested to know the views of the public about these areas”. Overall, both newspaper articles prove my overall question of “how does the use of coastal management strategies differ along the Ventnor coastline?” as people have a positive perception of the defences and want to keep them enforced throughout the Ventnor coastline. I think this was the right method to choose as it shows perceptions of the public as well as those of the council and officials however, I could have chosen another method of interviewing all these people and getting a transcript and therefore providing more accurate information as some newspaper articles may be biased.
- House prices:
-When I looked at figure 24 and I was investigating house prices, it showed that the closer the house is to the sea front the higher the price is for it also showing that the older the house the higher the price is again. For example, the top two highest priced houses that I could find on Rightmove costing £1,800,000 and £975,000 were the ones built during the Victorian era which were built right on the sea front. It also showed that the cheapest houses, that were located right on the sea front, weren’t actually houses but apartments or flats built during the 1960s-1970s or were brand new. It also showed that the cheaper the house the further away you got from the beach for example, the two cheapest house prices were £93,000 (at a discounted rate for over 60+) and £45,000 were actually positioned in the middle of Ventnor and quite far away from the sea front. Overall, showing how as you got further away from Ventnor’s coastline the cheaper and newer the house is and that the Victorian era built houses are those closest to the coastline. This proves my overall question of “how does the use of coastal management strategies differ along the Ventnor coastline?” because it shows that the houses built on the sea front as those that are generally the most expensive and also the oldest therefore, needing to be protected and preserved against the processes of erosion. Meaning that coastal management strategies need to be implemented to protect these houses on the sea front, effecting which defence is used as more effective defences need to be placed to better protect the coastline from erosion.
Conclusion:
Overall, my original question that I needed to answer in this investigation was “how does the use of coastal management strategies differ along the Ventnor coastline?” which I have successfully been able to answer and prove almost all three of my separate hypotheses of; the coastal management strategies are effective in protecting the Ventnor coastline, the age and pricing of houses and buildings effects the spatial distribution of coastal defences and people have positive perceptions of the coastal management strategies.
I haven’t been able to prove my first hypothesis that the coastal management strategies are effective in protecting the coast when looking at beach profiles, sediment sampling and primary and secondary photographs. This is because the beach profiles show that at both Ventnor and Monk’s Bay the further along the beach you went the steeper it got and how the coastal defences are effective as there is a gradual increase in the angle of the beach. However, the beach profiles also show that at Ventnor the beach has a more gradual increase in the angle of the beach compared to Monk’s Bay that had random results showing a greater increase in the angle at some points along the beach. Linking to my overall question as it shows how the defences are different and more effective in Ventnor as there is a better and more equal distribution of sediment and beach material but for Monk’s Bay they aren’t as effective. I also haven’t proved my first hypothesis when looking at sediment sampling as similar to the beach profiles it shows the mean length of the stones and sediment was greater at Monk’s Bay than at Ventnor. For example, at the lowest part of the beach at Monk’s Bay there was a mean length of 89.6mm but at the lowest part of the beach in Ventnor the mean length was only 35.5mm. Again linking to my overall question as it shows how different coastal management strategies have been placed along the Ventnor coastline because they may be more effective in an area that is needed to be protected more than another. Finally, I was also unable to prove my first hypothesis when looking at old and updated photographs because they showed how over time different defences have been implemented. For example, the historic photographs showed for Ventnor that only one management strategy had been placed which was a sea wall and the same for Monk’s Bay which just showed rock armour but in the present photos Ventnor also had a pier with rock armours, tetra pods had been placed along the walkway between Ventnor and Monk’s Bay and a sea wall had been placed at the back of Monk’s Bay’s beach. Again showing and linking to my overall question as different strategies have now been placed alongside coexisting ones with different strategies being placed along the boardwalk and at Monk’s Bay. Also disproving my hypothesis because the management strategies obviously weren’t effective as extras ones have been placed to further help in protecting the coastline also showing that at Ventnor and Monk’s Bay the new installations of defences of the sea wall and rock armour are actually the same showing no great difference.
When looking at results for land-use survey and house prices I was able to prove my second hypothesis of the age and pricing of houses and buildings effects the spatial distribution of coastal defences because overall, they both showed how the older the building is raises the price of a house was those generally closer to the sea front. The land use survey showed what the buildings were being used for, their age and their structural damage providing a result that most of the buildings were residential (shown in black on map) mainly positioned along the seafront or upper Ventnor. Also providing results from a scale of >9 being the oldest to <0 being brand new of the age of the building and how most of the older buildings were positioned in the middle of Ventnor or along the sea front. Finally, also showing the structural damage of the buildings were the buildings with the worst structural damage were those closest to the sea front. This then links to when I investigated the house prices as they showed that on average the older the house and the closer it was to the sea front the more expensive it was for example, the two highest prices were £1,800,000 and £975,000 both being built during the Victorian era. This shows how overall the land use survey and house prices link to my original question because in Ventnor where the older and more expensive the house is the closer it was to the seafront meaning better and more effective coastal defence system has been placed to protect these buildings from cliff collapse or being lost to the sea during erosion. Therefore, showing how the defences are different along the Ventnor coastline as well because in Monk’s Bay there are a couple of houses which are further away from sea front meaning less protection may be needed and different less expensive defences may be installed to still protect the coast.
Finally, I have also been able to prove my third hypothesis that people have positive perceptions of the coastal management strategies when looking at questionnaires and collecting secondary newspaper articles, as they show that on average there is a majority that feel Ventnor’s coastline actually needs the defences to protect its coast. The questionnaires I carried out show that at Ventnor 18 people out of 22 thought the defences had a positive impact on the coastline and at Monk’s Bay 19 people out of 25. This shows how majority of the public feel that the defences in fact a have a positive impact on the coast as they reduce coastal flooding, beach sediment sparsity, erosion and more. Linking to my overall question as the people’s views mainly at Ventnor and Monk’s Bay were based on the defences at that location showing even though different management strategies had been placed both locations had a positive perception on average of them. The newspaper articles also showed that even the press and councils agree that the defences are actually needed along the coastline and without them erosion rates will dramatically increase also suggesting future plans and studies. Showing how this links to my overall question as officials are trying to find alternative coastal defences for Ventnor to better slow down the process of erosion showing how a further difference may be made to try and effectively protect Ventnor beach more over the rest of the coastline with more accurate defence systems.
To conclude, my investigation shows how the use of coastal management strategies differs along the Ventnor coastline mainly due to factors that influence what management system is implemented and why. My investigation shows the choice of which coastal defence system seems to be mainly influenced by the age, structural damage and price of the building/house this is because my data shows that the older and more damaged a building is the higher the price of it is and they are generally positioned closer or on the sea front particularly in Ventnor. Meaning that they are needed to be protected more than others further along the coast as they cost the community a lot more and without protection they will simply be lost to the sea or collapse losing all value. My investigation also shows the difference as along the walkway between Ventnor and Monk’s Bay there is just one large long sea wall which you walk on and tetrapod’s placed at the bottom of the wall. This shows that compared to Ventnor and Monk’s Bay a difference in defence systems as the tetrapod’s are trying to reduce wave energy and prevent erosion to the cliff behind it. Also another difference being that the coastal management strategies are more effective in Ventnor as there is a more even distribution of sediment and angle of the beach compared to Monk’s Bay that has random areas that have a dramatic increase in the angle of the beach and a large mean length in sediment size. Finally, the use of coastal management strategies also differs along the Ventnor coastline because in Monk’s Bay the public has a lower amount of people with a positive perception of the defences compared to those that I asked my questionnaires at in Ventnor.
Evaluation:
I think overall that the methods I chose to carry out my investigation were successful as they didn’t provide me with any major problems and I was able to gain the results I needed. For example, my beach profiles showed me if there were any changes in the angle of the beach or any random results as well as the questionnaires provided results for the opinions and perceptions of the public linking to the secondary newspaper articles. What also went well was the land use survey as I was able to easily input my data into the IPad which would display it clearly onto a map of the area I was collecting results for. This was also successful because if I made a mistake or needed to change something I could easily delete it and insert the result I needed. Finally, another success I had whilst carrying out this investigation was when I was gathering information on the house prices I was easily able to locate the area I was looking at which the website I used (Rightmove) also provided information about the house and I could see when the house was built and any problems it had which I could link to my results from my land-use survey.
However, I also faced some problems when carrying out my investigation such as when I carried out the sediment sampling I just used a cm/mm ruler placing it at one end of the stone measuring its length. This was a problem because most of the stones were rounded off at the edges or had sections that pointed out further meaning I may have read the ruler wrong providing incorrect results. Therefore, this could have changed my conclusion as the large mean length figure for Monk’s Bay may have been due to incorrect readings and inaccuracy. If I was to carry this investigation out again I wouldn’t change this method as it enabled me to see whether a defence was effective in protecting the coast or not but instead I would improve the equipment by using a tape measure so I could accurately measure from one side to another.
Another problem I faced was with the questionnaires as when I selected people at random I may have chosen to speak to someone particular as they may have appeared friendlier or they were nearer to my age etc. This then affects my results as I may have been biased to a certain age group or gender not gaining a wide variety of results also suggesting the person I am asking the questions may have been biased for example, if they are a resident they may have a better view of Ventnor than a tourist. This also links to the secondary newspaper articles which may have been biased due to it being one person’s perception making the defences sound all positive and the correct things to have for the coastline. These methods may have impacted my conclusion providing a different result because if I had questioned someone from abroad or another area they may have had a completely different perception to the residents. I wouldn’t change this method if I did the investigation again because it provided a view of some of the public however, I would make sure I ask a wider range of people and gather more results to compare. I would also carry out the method of interviews of officials and stakeholders in Ventnor and Monks Bay beaches so I could also gain their perception on the coastal management defences.
Finally, another problem that occurred when doing this investigation was with the primary and secondary photographs of Ventnor and Monk’s Bay. This was a problem because the primary photographs I produced didn’t show a great view of the defence in action along the coast which meant I wasn’t able to successfully annotate them and I had to not use them and just take photographs from the internet such as Google. This means I wasn’t able to successfully provide primary photographs and only mainly included those from the internet. Another problem with the photos was that there weren’t many historic photos of Monk’s Bay and the ones I was able to include aren’t the best quality. I would just collect secondary photographs to annotate and this wouldn’t change my conclusion as this is what I have done in my investigation as I was unable to clearly annotate the photographs I took of Ventnor and Monks’ Bay.
Appendix:
Questionnaire results:
- VENTNOR:
| AGE CATEGORY: | GENDER: | ORIGIN: | VISITED PREVIOUSLY: | NOTICE ANY SEA DEFENCES: | IMPACT ENJOYMENT? | POSITIVE OR NEGATIVE IMPACT: |
| 0-18 | Female | Tourist | No | No | No | Positive |
| 0-18 | Female | Tourist | Yes | Yes | No | Positive |
| 0-18 | Male | Nearby town | Yes | Yes | Yes | Negative |
| 0-18 | Female | Local | Yes | Yes | No | Positive |
| 0-18 | Male | Other | Yes | Yes | Partially | Positive |
| 19-39 | Female | Tourist | No | Yes | No | Positive |
| 19-39 | Male | Tourist | Yes | Yes | Partially | Negative |
| 19-39 | Female | Local | Yes | Yes | No | Positive |
| 19-39 | Female | Tourist | No | Yes | No | Positive |
| 40-64 | Male | Tourist | Yes | Yes | No | Positive |
| 40-64 | Female | Tourist | Yes | Yes | No | Positive |
| 40-64 | Male | Local | Yes | Yes | Partially | Negative |
| 40-64 | Female | Local | Yes | Yes | No | Positive |
| 40-64 | Female | Nearby town | Yes | Yes | Yes | Negative |
| 40-64 | Male | Tourist | Yes | Yes | No | Positive |
| 40-64 | Female | Tourist | Yes | Yes | No | Positive |
| 65+ | Male | Tourist | No | Yes | No | positive |
| 65+ | Female | Local | Yes | yes | No | Positive |
| 65+ | Female | Nearby town | Yes | Yes | No | Positive |
| 65+ | Male | Tourist | Yes | Yes | No | Positive |
| 65+ | Female | Local | Yes | Yes | No | Positive |
| 65+ | Female | Tourist | Yes | Yes | Partially | Negative |
| 65+ | Female | Local | Yes | Yes | No | Positive |
- MONK’S BAY:
| AGE CATEGORY: | GENDER: | ORIGIN: | VISITED PREVIOUSLY: | NOTICE ANY SEA DEFENCES: | IMPACT ENJOYMENT? | POSITIVE OR NEGATIVE IMPACT: |
| 0-18 | Male | Local | Yes | Yes | Yes | Negative |
| 0-18 | Female | Tourist | No | No | No | Positive |
| 0-18 | Female | Nearby town | No | Yes | No | Positive |
| 0-18 | Female | Tourist | Yes | Yes | No | Positive |
| 0-18 | Male | Local | Yes | Yes | No | Negative |
| 0-18 | Female | Tourist | No | No | No | Positive |
| 19-39 | Female | Nearby town | Yes | Yes | No | Positive |
| 19-39 | Female | Tourist | Yes | Yes | No | Positive |
| 19-39 | Female | Tourist | No | Yes | No | Positive |
| 19-39 | Female | Local | Yes | Yes | Yes | Negative |
| 19-39 | Male | Nearby town | Yes | Yes | No | Positive |
| 19-39 | Female | Tourist | No | Yes | No | Positive |
| 19-39 | Female | Tourist | No | Yes | No | Positive |
| 19-39 | Female | Tourist | Yes | Yes | No | Positive |
| 19-39 | Female | Tourist | No | yes | No | Positive |
| 40-64 | Male | local | Yes | Yes | No | Positive |
| 40-64 | Male | Local | Yes | Yes | Yes | Negative |
| 65+ | Female | Nearby town | Yes | Yes | Partially | Negative |
| 65+ | Female | nearby town | Yes | Yes | No | Positive |
| 65+ | Female | Tourist | No | Yes | Partially | Negative |
| 65+ | Male | Tourist | Yes | No | No | Positive |
| 65+ | Female | Local | Yes | Yes | No | Positive |
| 65+ | Female | Tourist | No | Yes | No | Positive |
| 65+ | Male | Tourist | Yes | Yes | No | Positive |
| 65+ | Female | Local | Yes | Yes | no | Positive |
Beach profiles:
- VENTNOR (4th July 2017):
| Distance (m): | Angle: transect 1 (+ or -): | Angle: transect 2 (+ or -): | Angle: transect 3 (+ or -): |
| 0-1 | 8.00 | 7.00 | 7.00 |
| 1-2 | 7.00 | 6.00 | 6.00 |
| 2-3 | 8.00 | 6.00 | 6.00 |
| 3-4 | 8.00 | 7.00 | 6.00 |
| 4-5 | 10.00 | 5.00 | 6.00 |
| 5-6 | 13.00 | 3.00 | 5.00 |
| 6-7 | 12.00 | 4.00 | 5.00 |
| 7-8 | 6.00 | 6.00 | 7.00 |
| 8-9 | 10.00 | 9.00 | 7.00 |
| 9-10 | 14.00 | 8.00 | 4.00 |
| 10-11 | 14.00 | 10.00 | 5.00 |
| 11-12 | 8.00 | 11.00 | 5.00 |
| 12-13 | 12.00 | 7.00 | 6.00 |
| 13-14 | 14.00 | 9.00 | 7.00 |
| 14-15 | 7.00 | 11.00 | 3.00 |
| 15-16 | 4.00 | 12.00 | 8.00 |
| 16-17 | -2.00 | 5.00 | 12.00 |
| 17-18 | -1.00 | 2.00 | 11.00 |
| 18-19 | 0.00 | 2.00 | 6.00 |
| 19-20 | 2.00 | 3.00 | 6.00 |
| 20-21 | 2.00 | 7.00 | 5.00 |
| 21-22 | 10.00 | 9.00 | 10.00 |
| 22-23 | 10.00 | 14.00 | 8.00 |
| 23-24 | 11.00 | 13.00 | 2.00 |
| 24-25 | 10.00 | 11.00 | 6.00 |
| 25-26 | 8.00 | 5.00 | 4.00 |
- MONK’S BAY (4th July 2017):
| Distance (m): | Angle: transect 1 (+ or -): | Angle: transect 2 (+ or -): | Angle: transect 3 (+ or -): |
| 0-1 | 14.00 | 11.00 | 6.00 |
| 1-2 | 15.00 | 13.00 | 6.00 |
| 2-3 | 2.00 | 8.00 | 12.00 |
| 3-4 | 8.00 | 4.00 | 10.00 |
| 4-5 | 8.00 | 6.00 | 10.00 |
| 5-6 | 16.00 | 11.00 | 10.00 |
| 6-7 | 10.00 | 12.00 | 8.00 |
| 7-8 | 6.00 | 23.00 | 2.00 |
| 8-9 | 20.00 | -4.00 | 10.00 |
| 9-10 | 12.00 | -3.00 | 10.00 |
| 10-11 | 10.00 | 8.00 | 18.00 |
| 11-12 | 9.00 | 19.00 | -4.00 |
| 12-13 | -6.00 | 20.00 | -3.00 |
| 13-14 | -8.00 | 16.00 | 8.00 |
| 14-15 | -10.00 | 12.00 | 17.00 |
| 15-16 | -8.00 | -1.00 | 16.00 |
| 16-17 | 2.00 | -3.00 | 8.00 |
| 17-18 | 10.00 | 0.00 | 2.00 |
| 18-19 | 14.00 | 1.00 | 2.00 |
| 19-20 | 14.00 | 0.00 | 2.00 |
| 20-21 | 12.00 | -4.00 | 0.00 |
| 21-22 | 2.00 | 2.00 | 0.00 |
| 22-23 | -2.00 | 4.00 | 0.00 |
| 23-24 | -2.00 | 0.00 | 0.00 |
Beach sediment sampling:
- TELM BAY, VENTNOR:
| Distance along transect: | Length (mm): | Rock type: | Length (mm): | Rock type: |
| (High) | 24 | S | 18 | S |
| 18 | F | 14 | F | |
| 10 | F | 25 | F | |
| 21 | G | 18 | F | |
| 14 | F | 17 | F | |
| 16 | F | 7 | F | |
| 14 | F | 10 | F | |
| 23 | F | 14 | F | |
| 12 | F | 5 | S | |
| 19 | F | 11 | F | |
| Mean length: 15.55mm | ||||
| (Middle) | 11 | F | ||
| 10 | F | |||
| 16 | F | |||
| 20 | F | |||
| 13 | F | |||
| 10 | F | |||
| 11 | F | |||
| 15 | F | |||
| 14 | S | |||
| 10 | F | |||
| Mean length: 13mm | ||||
| (Low) | 44 | S | ||
| 35 | F | |||
| 32 | F | |||
| 26 | F | |||
| 31 | F | |||
| 45 | F | |||
| 30 | S | |||
| 47 | F | |||
| 29 | F | |||
| 36 | F | |||
| Mean length: 35.5mm | ||||
- MONK’S BAY:
| Distance along transect: | Length (mm): | Rock type: | Length (mm): | Rock type: |
| (High) | 46 | F | 38 | F |
| 58 | F | 34 | F | |
| 44 | F | 36 | G | |
| 49 | F | 40 | F | |
| 62 | F | 33 | S | |
| 39 | F | 36 | F | |
| 36 | F | 43 | F | |
| 43 | F | 40 | F | |
| 59 | F | 50 | S | |
| 41 | F | 47 | F | |
| Mean length: 43.7mm | ||||
| (Middle) | 31 | F | ||
| 26 | F | |||
| 25 | F | |||
| 21 | F | |||
| 25 | F | |||
| 28 | F | |||
| 27 | G | |||
| 20 | F | |||
| 23 | F | |||
| 15 | F | |||
| Mean length: 20.4mm | ||||
| (Low) | 80 | F | ||
| 73 | F | |||
| 86 | F | |||
| 67 | F | |||
| 125 | G | |||
| 61 | F | |||
| 136 | F | |||
| 94 | F | |||
| 84 | F | |||
| 90 | F | |||
| Mean length: 89.6mm | ||||
Cite This Work
To export a reference to this article please select a referencing stye below:
Related Services
View allRelated Content
All TagsContent relating to: "Marine Studies"
Marine studies look at the oceans and seas from the resources they provide, the diverse organisms and life that live in them to the threats and effects of climate change on marine habitats.
Related Articles
DMCA / Removal Request
If you are the original writer of this dissertation and no longer wish to have your work published on the UKDiss.com website then please:


