Fulvestrant as Therapy for Oestrogen Receptor-positive Breast Cancer
Info: 10916 words (44 pages) Dissertation
Published: 4th Feb 2022
Tagged: CancerBiomedical Science
A cost-utility analysis of fulvestrant (Faslodex) as first-line therapy for oestrogen receptor-positive locally advanced and metastatic breast cancer.
List of Abbreviations
Abbreviation Full text
AI Aromatase inhibitor
AIC Akaike information criterion
BC Breast cancer
BIC Bayesian information criterion
CEAC Cost-effectiveness acceptability curve
EMA European Medicines Agency
EQ-5D EuroQol five-dimension questionnaire
ER Oestrogen receptor
FALCON Fulvestrant and Anastrozole Compared in Hormonal Therapy Naïve Breast Cancer Trial
FIRST Fulvestrant First-Line Study Comparing Endocrine Treatments
HR Hormone receptor
ICER Incremental cost-effectiveness ratio
LABC Locally advanced breast cancer
LYG Life years gained
MBC Metastatic breast cancer
NHS National Health Service
NICE National Institute for Health and Care Excellence
ONS Office for National Statistics
OS Overall survival
PFS Progression-free survival
PR Progesterone receptor
PSA Probabilistic sensitivity analysis
PSSRU
QALY Quality adjusted life years
RCT Randomised controlled trial
SAE Serious adverse event
Introduction
Epidemiology
Cancer remains one of the leading causes of death in the UK, accounting for 27.9% of deaths in England and Wales in 2015 (ONS, 2017). In 2015 there were 299,923 cases of cancer registered (ONS, 2017). It has been reported that England’s five-year cancer survival rates falls below the European average of 54.6% at only 49% (ABPI, 2017). Breast cancer (BC) is the most common cancer in England, with 46,083 new cases registered in 2015, accounting for 15.4% of all cancer registrations (ONS, 2017). Survival rates for patients with BC has increased over the past few decades, with an average one-year survival rate of 96%. However, survival rates for those with metastatic breast cancer (MBC) are much lower, with only 63% reaching one year survival (ONS, 2016). Five-year survival rates for BC patients with stage one BC are very high, at 99%. However, for those at stage three and four they decrease drastically, to 55% and 15% respectively (Cancer Research UK, 2017).
It has also been reported that the five-year survival rate is 1.7% lower than the average in Europe (ABPI, 2017). Although only 13% of breast cancer cases are diagnosed at the advanced or metastatic stage (Stage III and IV) (ONS, 2016), it is reported that up to 40% of patients with breast cancer will develop advanced disease within 10 years (NICE or National Collaborating Centre for Cancer, 2009). Due to the rate of recurrence and the low survival rates for advanced disease, there is a need to develop more effective treatments.
The type of treatment that BC patients receive depends on certain factors associated with their tumour, such as hormone receptor (HR) status and human epidermal growth receptor (HER2) status. Therefore, when patients are diagnosed with BC they undergo pathological tests to determine their HR status and HER2 status (NICE, 2017). HR status can depend on two factors, whether you are oestrogen receptor (ER) positive or negative, and whether you are progesterone receptor (PR) positive or negative.
Having HR-positive tumours is very common in BC patients. The Second All Breast Cancer Report (2011) identified women diagnosed with BC in in England in 2007. ER status was known for 61% of surgically treated invasive cases and it was found that 84% of these women had ER-positive tumours. Different studies report a variation in the percentage of ER-positive patients, but they typically range from 70% to 80% (Cancer Research UK, 2017, Schnetti et al., 2016, Garrido-Castro and Metzger Filho, 2016).
When breast tumours are ER-positive it means they are subjected to excessive levels of oestrogens due to the production of oestrogens in the breast tissue. Because of this oestrogen binds to and stimulates oestrogen receptors, which promotes the cancer cell growth. Due to oestrogen playing a part in the grown of the cancer, ERs have been a main target in developing treatment for this subgroup (Hiscox, Davies and Barrett-Lee, 2009). Patients who present with early ER-positive BC are treated with adjuvant endocrine therapy for five years after surgery (NICE, 2006).
Endocrine therapy has been considered very successful in treating ER-positive tumours for early breast cancer. Rates of recurrence in this patient group remain lower than patients who present with ER-negative tumours for the first five years. Those with ER-negative tumours are most likely to experience recurrence two years after surgery, with the rate significantly dropping after five years (Zhang et al., 2013). However, it has been shown that half of BC recurrences for patients with ER-positive tumours occur five years or more after diagnosis and surgery. This is alarming as most BC related deaths are caused by metastases rather than primary tumour (Zhang et al., 2013).
There are four stages of breast cancer, with the first stage referring to early breast cancer. stage three is called locally advanced breast cancer (LABC) and is when the disease has spread to other parts of the breast such as the surrounding tissues or has spread to lymph nodes located nearby (NICE, 2009). Stage four is metastatic breast cancer (MBC) and is the most severe case of BC, meaning that the cancer cells have spread from the primary tumour in the breast to other parts of the body, either through the lymphatic or blood system. Common sites of metastases for breast cancer patients includes the bones, liver, lungs and brain (National Cancer Intelligence Network, 2012). Once cancer has become advanced, it is incurable, therefore treatment focuses on managing symptoms and trying to extend progression-free survival.
As BC is common among women, it has been associated with a high economic burden, especially for those with LABC or MBC. A study assessing the cost of managing patients with MBC was conducted based on incidence, treatment and costs in 2002 (Ramak and Brazil, 2004). They obtained data from cancer registries across the United Kingdom, and reported on the number of patients that presented with MBC at first diagnosis and considered all different treatment paths. It was estimated that the cost of treating these patients was approximately £26 million per year (Ramak and Brazil, 2004). However, this estimate was based on patients that had metastatic disease at first diagnosis, and did not account for those who had recurrent BC.
Ramak and Brazil (2004) could not obtain data on the number of patients that had disease recurrence, due to limited information being documented by cancer registries. However, based on an estimate that 50% of patients diagnosed with earlier disease will relapse, they estimated that the total annual cost of treating patients with MBC was over £245 million (Ramak and Brazil, 2004).
This provides insight in to the economic burden of MBC, however, the study was conducted over ten years ago, and treatment has changed as well as incidence rates. The incidence of BC has increased, but it is unsure if this is for early BC or later stages. It could be assumed that early BC rates have increased due to earlier detection through screening. Also, the study was based on tamoxifen being the first-line treatment option for postmenopausal ER-positive patients, however, aromatase inhibitors have since become standard first-line treatment. It is also believed that the rate of recurrence is lower than 50% today, at around 40%. Despite the limitations of this study, it is still indicative of the huge cost associated with LABC and MBC.
Treatment
Treatment for patients who present with LABC or MBC that is oestrogen-receptor positive consists of endocrine therapy, but has not changed considerably in the past two decades (Turner et al., 2017). Tamoxifen was the first-line option for treating postmenopausal patients with ER+ tumours for many years (Nabholtz et al., 2000). It is a selective oestrogen receptor modulator (SERM) which acts as an oestrogen antagonist, blocking the effects of oestrogen in breast cancer cells (Frasor et al., 2004). Although it was a successful treatment option, it is associated with some alarming side-effects such as an increase in incidence of endometrial cancer (Hortobagyi, 2003).
Due to the side effects associated with tamoxifen, different endocrine therapy options were explored, and trials began to show that aromatase inhibitors (AIs) were superior to tamoxifen (Nabholtz et al., 2000, Mourisden et al., 2003, Paridaens et al., 2008). Both tamoxifen and AIs are available for ER+ patients, with tamoxifen being predominantly used for premenopausal women, and aromatase inhibitors mainly used for postmenopausal women (Turner et al., 2017).
AIs suppress aromatase enzyme activity which restricts the body’s ability to produce oestrogen (Fabian, 2007). Three generations of AIs have been created, with the most recent AIs being associated with less toxicities and superior suppression of aromatase activity (Fabian, 2007). These third-generation AIs are anastrozole, letrozole and exemestane (NICE, 2006).
NICE recommend that women with advanced disease who are postmenopausal and have not received prior endocrine therapy are treated with an AI (NICE, 2009). Based on clinical expertise, anastrozole and letrozole are the most commonly used AIs in England (NICE, 2011). However, patients with metastatic disease that initially respond to treatment, can eventually develop resistance to aromatase inhibitors (Fabian, 2007), emphasising the need for different treatment options for this patient group.
Fulvestrant (Faslodex)
Fulvestrant is a selective oestrogen receptor downregulator, which binds to oestrogen receptors which results in suppressing the oestrogen protein (Robertson, 2001). Fulvestrant binds to oestrogen receptors approximately 100 times greater than tamoxifen, and unlike tamoxifen it has no effect on oestrogen-sensitive tissues such as the uterus (Robertson, 2001).
Fulvestrant was previously experimented with and licensed under a 250mg dosage. Studies that assessed the efficacy of 250mg fulvestrant versus tamoxifen in first-line setting showed that it was an effective treatment but failed to show an advantage over tamoxifen (Howell et al., 2004). However, approximately 22% of patients in this trial were not ER-positive, due to unknown ER status. This could have led to misjudged efficacy of the drug.
Due to fulvestrant failing to show an advantage in first-line setting, it began being tested in second-line settings. This involved testing the efficacy of fulvestrant versus AIs. Two randomised controlled trials (RCTs) showed that a 250mg dose of fulvestrant was not more effective than anastrozole in second-line treatment for postmenopausal women with advanced breast cancer (Howell et al., 2002, Osborne et al., 2002). However, both trials did provide evidence that fulvestrant was as effective as anastrozole, and therefore another available treatment option for this patient group. This led to the marketing authorisation of fulvestrant 250mg in Europe in 2004 (EMA, 2010).
Testing on the safety and efficacy of a higher dose of fulvestrant began, however the FINDER1 and FINDER2 phase two trials failed to show an increased efficacy in the higher dose, but demonstrated that there was no increased risk of adverse events (Pritchard et al., 2010, Ohno et al., 2010).
However, a larger phase three trial, CONFIRM, compared the efficacy of a 250mg dose versus a 500mg dose, and demonstrated that the 500mg dose had a statistically significant increase in progression free survival without increasing toxicity (Di Leo et al., 2010). They also reported that fulvestrant 500mg lead to a 19% reduction in the risk of death and an increase of median OS of 4.1 months (Di Leo et al., 2013). Although these results showed the higher dose was more effective, they failed to conduct tests to confirm patients were ER-positive, as they relied on the fact that patients had received prior endocrine therapy. If patients included in the trial were in fact not ER-positive, this could have reduced the reliability of these results. Regardless of this, the results from the CONFIRM trial led to the 500mg dose being approved in Europe in March 2010 (Di Leo et al., 2013).
Although fulvestrant received marketing authorisation, NICE did not approve the use of fulvestrant as second-line treatment for postmenopausal women whose cancer has relapsed on or after anti-oestrogen therapy (NICE, 2011). This was mainly due to the high cost of the ICER, at around £35,000 and the uncertainty around the network meta-analysis that was conducted (NICE, 2011). However, since this technology appraisal in 2011, two trials have showed promising results for the use of fulvestrant in first-line therapy.
The Fulvestrant First-Line Study Comparing Endocrine Treatments (FIRST) was a phase 2, randomised open-label trial comparing fulvestrant with anastrozole as first-line treatment for postmenopausal women with LABC or MBC (Robertson et al., 2009). It took place in nine different countries across North America, South America and Europe, including the United Kingdom (Robertson et al., 2009). Subjects were not permitted to have received endocrine therapy for advanced disease, although they were allowed to have received adjuvant endocrine therapy if it was more than 12 months ago and for early disease.
In total, 74.6% of patients were endocrine-therapy naïve and 25.4% had received endocrine treatment for early disease (Robertson et al., 2009). The primary endpoint of the trial was the clinical benefit rate, and PFS and OS were secondary endpoints. One hundred and two patients were allocated to the fulvestrant arm and one hundred and three were allocated to the anastrozole arm. Median PFS was 13.1 months for anastrozole and 23.4 months for fulvestrant, showing a reduction in the risk of progression of 34% (Robertson et al., 2012). Median overall survival was 54.1 months in the fulvestrant arm and 48.4 months in the anastrozole arm (Ellis et al., 2015). The trial showed significant benefits of fulvestrant over anastrozole, however the trial was an open-label study, meaning patients and assessors were aware of the treatment patients were receiving.
As a result of the FIRST trial showing promising results on the efficacy of fulvestrant, a phase 3 trial was conducted to further explore fulvestrant in the first-line treatment setting. The Fulvestrant and Anastrozole Compared in Hormonal Therapy Naïve Breast Cancer (FALCON) trial was a phase 3, randomised, double-blind trial comparing fulvestrant with anastrozole in postmenopausal women with LABC or MBC (Robertson et al., 2016). It was conducted in 20 countries in Asia, Europe, North America, South America and South Africa, including the United Kingdom.
The primary endpoint of the trial was PFS. Progression was determined by investigators assessing tumours by using Response Evaluation Criteria in Solid Tumours version 1.1 or by the patients receiving surgery or radiotherapy for deteriorating disease, or death (Robertson et al., 2016). Two hundred and thirty-two patients were allocated to the anastrozole arm and two hundred and thirty were allocated to the fulvestrant arm. Median PFS was 16.6 months with fulvestrant and 13.8 months with anastrozole. Due to insufficient follow-up time, 31% maturity, median OS could not be calculated.
The study was a well-designed RCT, as it was a large trial across different countries and involved double-blinding. It showed that PFS was longer in patients who received fulvestrant in comparison to anastrozole, with no significant difference in serious adverse events. Health related quality of life was recorded for patients using the Functional Assessment of Cancer Therapy for Breast Cancer (FACT-B) questionnaire, and there were no significant differences in the patient responses. This trial provided promising results for the use of fulvestrant as treatment for ER-positive postmenopausal women in first-line settings.
Zhang et al., (2017) conducted a network meta-analysis of six endocrine therapies in first-line treatment for HR-positive LABC or MBC postmenopausal patients. The six therapies they assessed were tamoxifen, exemestane, anastrozole, letrozole, fulvestrant 250mg and fulvestrant 500mg. The main outcomes they assessed were objective response rate and PFS. Eight trials were identified and their network meta-analysis resulted in fulvestrant 500mg and letrozole being the preferred treatment option for this patient group as first-line therapy (Zhang et al., 2017).
The network meta-analysis did have limitations in that some trials did not follow the same randomisation and blinding criteria. Also, fulvestrant 250mg has not been considered a treatment option for first-line therapy as it was previously authorised for treatment after failure on other endocrine therapies. Also, this trial did not include the results from the FALCON trial, as it was conducted prior to these results being published. However, this network meta-analysis does show that fulvestrant 500mg is a good treatment option for this group in relation to its efficacy.
Fulvestrant was primarily authorised for second-line treatment in patients with advanced or metastatic breast cancer, that had progressed on an anti-oestrogen treatment. Due to the results from the FALCON trial, in June 2017 the EMA edited the terms of the marketing authorisation, approving the use of fulvestrant on patients with oestrogen receptor-positive advanced or metastatic breast cancer, who have not received prior endocrine therapy (EMA, 2017).
Cameron et al. (2008) conducted a cost-effectiveness analysis of fulvestrant as second or third line therapy for HR+ ABC patients from a UK NHS perspective. The model showed that fulvestrant was a cost-effective option with a 60% and 70% chance of being cost-effective at £30,000 with second or third line treatment respectively. However, this analysis was based on the previously authorised dose of 250mg, which is no longer in use and was cheaper than the current 500mg dose. Cameron et al. (2008) obtained their utility values from a clinician’s survey using a visual analogue scale, which is not in accordance with NICE recommendation where the use of the EQ-5D is preferred.
Lux et al. (2009) conducted a cost-utility analysis in Germany of fulvestrant as second line treatment with a hypothetical population of HR-positive LABC/MCB postmenopausal women. These patients had previously received tamoxifen or AIs for at least five years. Utilities were obtained by a panel of clinical experts on a visual analogue scale. The fulvestrant arm was cost-effective with a 75% probability of being cost-effective at €30,000. They varied utilities to values from UK surveys completed by clinicians and showed similar results, however, this does not follow NICE standards as it does not use the EQ5D. Using parameters estimated by clinical experts introduces a high level of uncertainty. Both Cameron et al. (2008) and Lux et al. (2009) conducted their analyses based on a 250mg dose, which is no longer authorised and was cheaper than the current 500mg dose.
Das et al. (2013) conducted a cost-utility analysis for second line treatment of fulvestrant 500mg versus anastrozole and letrozole from a UK NHS perspective. Their model looked at fulvestrant as second line therapy and used a time in state approach, based on PFS and OS. They conducted a network meta-analysis and used an indirect treatment comparison as there was no head-to-head trial data of fulvestrant 500mg versus anastrozole or letrozole. Fulvestrant was more effective than both aromatase inhibitors, but also resulted in higher costs, with ICERs of £34,528 versus letrozole and £31,468 versus anastrozole. This would suggest that fulvestrant is not cost-effective as second-line treatment. However, this cost-utility analysis had some limitations, for example, it did not contain head-to-head data, which results in a higher level of uncertainty.
Ding et al., (2017) conducted a cost-effectiveness analysis of fulvestrant 500mg as first-line treatment from a Chinese societal perspective. They used data from the FIRST study and conducted a Markov model. Their model produced a high ICER of $296,855 per QALY, deemed to not be cost-effective.
Due to the lack of cost-utility analyses that have been conducted using fulvestrant 500mg dose as first-line treatment, a cost-utility analysis was conducted to identify whether fulvestrant is a cost-effective option for treating postmenopausal women with oestrogen receptor positive LABC or MBC.
Methodology
Clinical trial data
The clinical data used for this model consisted of the only two RCTs that have tested fulvestrant in first line setting for LABC and MBC, the FIRST and FALCON trials.
Population
Patients were postmenopausal women who had histologically confirmed ER-positive LABC or MBC. These patients had not received prior endocrine therapy for their BC. The patient population was obtained from the FALCON trial as it was larger than the FIRST trial. The age of patients ranged from 38 – 87 in the treatment arm and 36 – 90 in the control arm. For the model, the patients entered the model at the average age from the control arm, which was 62. This age is slightly below the average age of women presenting with breast cancer, which is in people aged 65 and over, however, it is not considerably lower (Cancer Research UK, 2017). Patients had a WHO performance status of 0 – 2, with 0 representing normal activity, 1 representing restricted activity and 2 representing being in bed 50% of the time or less.
Comparator
The comparator in this model was anastrozole, a third-generation aromatase inhibitor. This comparator was chosen as it is what NICE recommend for treating patients with LABC and MBC who are postmenopausal and have not received prior endocrine therapy. It was the comparator used in both the FIRST and FALCON RCTs.
Model
A partitioned survival model with monthly cycle lengths (30.4 days) was generated in Excel. It involved three health states (figure 1), progression-free, progressed disease and dead, which follows a typical oncology model structure. Patients in the progression-free health state either remained in that health state or transitioned to progressed disease or dead. Patients in the progressed disease state either remained in that state or transitioned to dead. And dead was an absorbing health state.
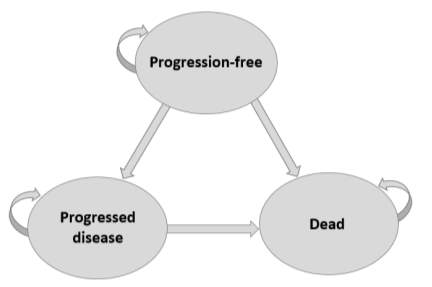
Figure 1: Model Schematic
The proportion of patients in each health state over time was calculated from PFS and OS data from the FIRST and FALCON trials.
Due to individual patient-level data not being available, Kaplan-Meier curves and summary statistics were used. Kaplan-Meier curves for PFS from the FALCON trial and OS curves from the FIRST trial were digitised using Engauge. The reason for digitising is because it allows the points on the Kaplan-meier curve to be identified. Once digitised, the data was used to estimate individual patient-level data, using the Hoyle and Henley (2011) method. This used the total number of patients, the number of patients at risk and the survival probabilities obtained from the digitised curve. Their Excel spreadsheet contained a code to be used in R, and allowed different survival distributions to be applied, including Weibull, Exponential, Log-normal, Logistic and Log-logistic.
The Akaike information criterion (AIC) and Bayesian information criterion (BIC) were obtained for each distribution as they are used to determine which model fits the Kaplan-Meier data best. Table 1 shows the AIC and BIC for each distribution.
| Progression-Free survival Anastrozole | Overall Survival Anastrozole | Overall Survival Fulvestrant | ||||
| AIC | BIC | AIC | BIC | AIC | BIC | |
| Exponential | 1512.11 | 1515.54 | 373.30 | 375.94 | 331.56 | 334.17 |
| Weibull | 1503.05 | 1506.47 | 357.06 | 359.69 | 327.53 | 330.13 |
| Lognnormal | 1494.48 | 1497.91 | 361.08 | 363.72 | 328.79 | 331.40 |
| Loglogistic | 1498.86 | 360.69 | 363.33 | 327.57 | 330.18 | |
Table 1
The best fitting distribution was used to extrapolate the data to a lifetime horizon of 15 years. Graphs 1, 2 and 3 (see appendix) also demonstrate how each distribution fit the data. The Weibull distribution was used for both OS curves and the lognormal distribution was used for the anastrozole PFS.
For the fulvestrant PFS arm, a hazard ratio was applied from a meta-analysis. A meta-analysis combining the hazard ratios from the FIRST and FALCON trial was conducted in Stata, to obtain a new estimate. A meta-analysis enables randomisation to be preserved and provides a more accurate estimate of treatment effect (Pang, Drummond and Song, 1999). A fixed effects model was chosen as both studies were conducted under similar conditions with similar subjects. Figure 2 show the forest plot of the meta-analysis conducted.
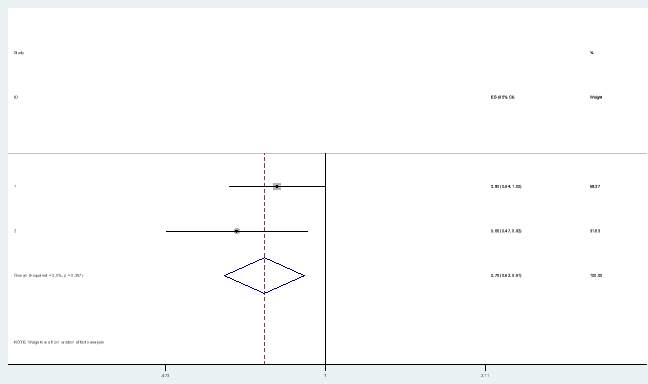
Figure 2: Forest plot
The proportion of patients in each health state for each cycle was determined from overall survival and PFS data. However, for the fulvestrant PFS health state, the hazard ratio obtained from the meta-analysis was applied to the PFS anastrozole arm from the FALCON trial. Applying the hazard ratio was done using the following calculation:
PFS fulvestrant = PFS Anastrozole ^ hazard ratio
The number of patients in each health state was calculated as below:
Progression-free survival = PFS
Progressed disease = OS – PFS
Dead = 1 – OS
Figure 3 shows a representation of how the number of patients in each health state is calculated, with an area under the curve for the fulvestrant arm. The whole area under the dark blue line represents everyone that is alive, the shaded light blue area is everyone in the progressed disease health state and the shaded orange area is everyone that is in the PFS health state. The area above the blue line represents those that are dead.
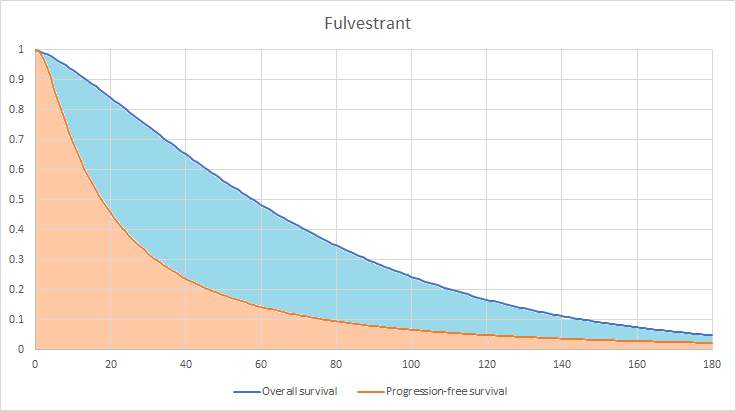
Figure 3: Area under the curve
The model applied monthly cycles as fulvestrant is administered monthly and anastrozole tablets are provided in a monthly pack. Costs and outcomes were calculated, with the outcomes of interest being quality adjusted life years (QALYs) and life years gained (LYG).
Patients in the PFS health state received either fulvestrant or anastrozole. It was assumed that once patients had progressed they would receive chemotherapy treatment, as that is what NICE recommend for this patient group once they have progressed on AIs (NICE, 2009). The chemotherapy drug used for this model was docetaxel as NICE recommend docetaxel as the first chemotherapy option for BC patients (NICE, 2009).
Resource use and costs
Resource use and drug costs were obtained from different sources and were reported in British pounds for the year 2015/16. Drug costs were obtained from the British National Formulary (BNF) and resource use costs were obtained from NHS Reference Costs and the Personal Social Services Research Unit (PSSRU).
| Progression-Free Survival Treatment and Resource Use Costs | ||
| Drug/Resource Use | Cost | Source |
| Fulvestrant 500mg | £522.41 | BNF |
| Anastrozole 1mg (28 pack) | £1.08 | BNF |
| Nurse outpatient appointment administering fulvestrant | £69.20 | NHS Reference Costs, 2015. Code: N10AF |
| CT Scan of two areas | £115.29 | NHS Reference Costs, 2015. Code: IMAGOP |
| Oncologist appointment | £162.84 | NHS Reference Costs, 2015. Code: WF01A |
| Monthly prescription cost | £27.00 | PSSRU 2016 |
Table 2: Progression free survival costs
Costs were applied to each health state. The costs for the progression-free health state included drug costs, administration costs, monitoring costs and serious adverse events (SAEs) costs. Table 2 includes a breakdown of the costs associated with the PFS health state including sources. For both the anastrozole and fulvestrant arm different costs applied for the first cycle due to the administration of fulvestrant involving two doses in the first month, followed by one every month thereafter. Also, in both the control and treatment arm patients would have an initial appointment with an oncologist, followed by one every two months along with a CT scan every two months. Table 3 lists the total cost associated with each treatment arm that was applied to the model.
| Progression-Free Survival Cycle Costs | ||
| Treatment Arm | First Cycle | Subsequent Cycles |
| Anastrozole | £248.57 | £167.15 |
| Fulvestrant | £1,403.72 | £730.68 |
Table 3
Serious adverse event (SAE) data was obtained from the FALCON trial. Grade 1 and 2 events were not incorporated in to the model as they have a low impact on costs and quality of life. SAEs consisted of grade 3-4 events. All costs associated with SAEs were obtained from NHS Reference Costs. The probability of SAEs occurring was obtained from the FALCON trial. Table 4 outlines the costs associated with each SAE and the probability of that SAE occurring. The cost was multiplied by the percentage of patients who experience a SAE in each cycle.
| Serious Adverse Events Costs | |||
| Condition | Cost | Probability of event occurring | Source |
| Gastroenteritis | £247.27 | 4% | FZ36K, NHS Reference Costs, 2015.Robertson et al., 2016 |
| Pyelonephritis | £437.72 | 4% | LA04Q, NHS Reference Costs, 2015. Robertson et al., 2016 |
| Drug hypersensitivity | £471.26 | 4% | WJ11Z, NHS Reference Costs, 2015. Robertson et al., 2016 |
| Atrial fibrillation | £595.99 | 4% | EB14C, NHS Reference Costs, 2015.Robertson et al., 2016 |
| Deep vein thrombosis | £461.65 | 4% | YQ51C, NHS Reference Costs, 2015.Robertson et al., 2016 |
| Pulmonary embolism | £569.54 | 4% | DZ09M, NHS Reference Costs, 2015.Robertson et al., 2016 |
| Bile duct stone | £1,024.10 | 4% | GA13B, NHS Reference Costs, 2015. Robertson et al., 2016 |
Table 4
The progressed disease health state consisted of monthly GP appointments, a monthly visit from a nurse and palliative care. It also involved the cost of chemotherapy, and the administration cost of chemotherapy. Table 5 lists the breakdown of drug and resource use costs and the total cost of the progressed disease health state. The dose of docetaxel was based on the average body surface area of a woman of 1.75m2, as is used in the NICE (2009) advanced breast cancer guidance. Because chemotherapy is administered every three weeks the costs associated with it were adjusted to a monthly cycle. A cost associated with end of life care was also included and applied to the dead health state, by applying it to the number of new patients that entered the health state. The cost associated with death is reported in table 6, and this was adjusted to a monthly cycle cost.
| Progressed disease costs | ||
| Drug/Resource use | Cost | Source |
| GP attendance | £31.00 | PSSRU 2016 |
| Nurse visit | £44.00 | PSSRU 2016 |
| Docetaxel | £1,103.79 | BNF |
| Administration cost of chemotherapy | £406.63 | NHS Reference Costs, 2015. Code: SB14Z |
| Palliative care | £145.38 | NHS Reference Costs, 2015. Code: SD04A |
| Total cost per cycle | £2,410.49 | |
Table 5
| Cost associated with death | ||||
| Resource use | Cost | Source | ||
| End of life care (per year) | £11,616.00 | PSSRU 2016 | ||
| Adjusted cost per cycle | £968.00 | |||
Table 6
Utilities
Utilities were obtained from the Lloyd et al. (2006) study. This is in line with other economic evaluations of MBC, and various HTA submissions have used the utilities from Lloyd et al.’s (2006) study. Lloyd et al.’s (2006) utilities were adjusted for age, as their study an average age of 38, however, the original EQ5D study used subjects with an average age of 47.055, therefore the model used this adjusted age. This is in line with what has been done in previous HTA submissions that have used those utility values (Fleeman et al., 2011). The mean utility values from the Lloyd et al. (2006) study were 0.715 for stable disease, 0.79 for responding to treatment and 0.443 for progressed disease. Dead had a utility value of zero.
To calculate the QALYs per cycle, the baseline utility for the average person in the UK without a disease was calculated, and was adjusted based on the age and gender of the patients. The following formula was used to obtain the general population utility:
0.9508566 + 0.0212126 * male – 0.0002587 * age – 0.0000332* (age)2
Then the condition specific utilities from Lloyd et al., (2006) were combined. There are three methods that can be used to combine condition specific utilities, the additive, multiplicative and minimum methods. This model used the multiplicative method. This involved using the mean utility values associated with each health state, and calculating a multiplier associated with the utility value. For example, in the PFS health state, patients were assumed to have the baseline utility associated with metastatic breast cancer, as well the utility associated with responding to treatment. Using the following formula, the utilities associated with that health state were combined to obtain a single utility value, and were adjusted to monthly.
Proportion of patients*General population utility*multiplier_baseline*multiplier_responding/12
Disutilities were also incorporated in to the PFS health state for SAEs. Due to limited data on the disutility associated with the SAEs experienced by patients in this model, disutilities were only obtained for deep vein thrombosis and gastroenteritis. The utility associated with a patient experiencing gastroenteritis resulted in a decrement of 0.103 from the stable disease utility (Lloyd et al., 2006), therefore it was 0.612. Deep vein thrombosis resulted in a decrement of 13% (Delea et al., 2007), therefore it was 0.622. These were incorporated in to the model by using their multiplier and the percentage of patients that experienced the SAE and multiplying it by the QALYs obtained for PFS from the formula above.
Figure 4 shows the first 24 cycles (2 years) in the trace for both anastrozole and fulvestrant.
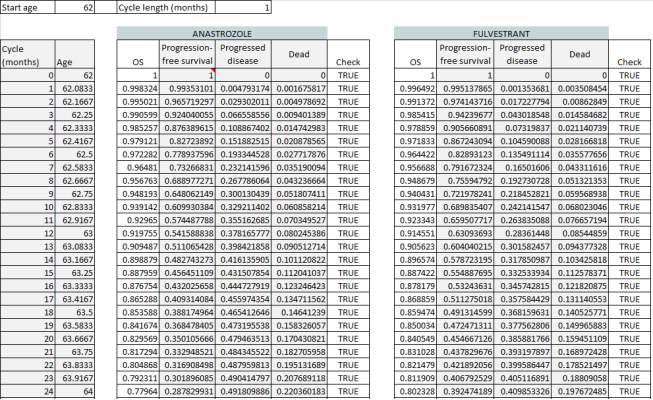
Figure 4: Trace
Discounting
Costs and outcomes were both discounted at an annual rate of 3.5% as is specified in the Guide to the methods of technology appraisal (NICE, 2013).
ICER
In order to obtain the incremental cost-effectiveness ratio for QALYs and LYG the following formulas were applied:
Cost per QALY= Total Cost(FULV) – Total Cost(ANAS)/Total QALYs(FULV) – Total QALYs(ANAS)
Cost per LYG = Total Cost(FULV) – Total Cost(ANAS)/Total LYG(FULV) – Total LYG(ANAS)
Sensitivity analysis
Due to the level of uncertainty associated with input parameters, sensitivity analyses were carried out to account for uncertainty. Deterministic sensitivity analysis was performed which involved varying one parameter at a time, based on its upper and lower limits, to determine the effect it would have on the ICER. This was done by conducting a tornado diagram. Where confidence intervals were not provided in the literature, ±20% was used.
Threshold analysis was conducted on the cost of fulvestrant to determine at what cost the drug should be set to obtain an ICER of £20,000 and £30,000.
Probabilistic sensitivity analysis (PSA) was carried out, which involved varying the parameters at the same time. This then enabled a cost-effectiveness plane to be produced, and a cost-effectiveness acceptability curve (CEAC), which determined the probability of fulvestrant being cost-effective under different willingness to pay thresholds. For the PSA, the model ran 5000 Monte Carlo simulations, which resulted in a probabilistic ICER for QALYs and LYG. In order to carry out the PSA, it was necessary to calculate probability distributions for each parameter. Table 7 shows the parameters that were changed and the distribution that was used.
| Type of parameter | Distribution |
| Costs | Gamma |
| Utilities | Beta |
| Probabilities | Beta |
| Hazard Ratio | Log-normal |
Table 7: Distributions used for parameters in PSA
One of the issues with PSA is that parameters are assumed to be independent (Briggs, Claxton and Sculpher, 2006). When parameters are correlated, they can still be incorporated in to the PSA when the variance-covariance matrix is known. The Cholesky decomposition of the variance-covariance matrix creates correlated draws from a multivariate normal distribution (Briggs, Claxton and Sculpher, 2006). The Hoyle and Henley (2011) Excel spreadsheet provides the R code that generates the cholesky decomposition, and table 8 shows the Cholesky decomposition for the Weibull distribution for anastrozole overall survival.
| Cholesky Decomposition | ||
| intercept | log(scale) | |
| intercept | 0.07564745 | 0 |
| log(scale) | -0.0002964 | 0.1017761 |
Table 8: Cholesky decomposition of Weibull coefficients for anastrozole OS.
Once the cholesky decomposition is obtained or calculated, the formula x= y + Tz can be used to generate probabilistic values, which was taken from Briggs, Claxton and Sculpher (2006). Y is the parameter’s mean value, T is obtained from the cholesky decomposition matrix and z is a random number. Table 9 shows an example of how the anastrozole overall survival probabilistic values were calculated.
| Mean | Random | Tz | y +Tz | |
| Intercept | 4.06194 | 1.65397 | 0.12512 | 3.936821 |
| log(scale) | 0.45317 | 0.88349 | 0.08943 | -0.5426 |
Table 9:
Scenario Analysis
A scenario analysis using a discount rate of 1.5% was conducted, as is suggested by NICE (2013) in the guide to the methods of technology appraisals.
Another scenario analysis was conducted, which changed the distributions used to extrapolate survival to 15 years to see the impact it would have on the results. The next best fit was used based on the AIC, and for all three curves the next best fit was the log-logistic distribution.
Results
Base case results
Over the 15-year lifetime horizon, the total costs associated with fulvestrant were £98,025.88, and the total costs associated with anastrozole were £67,609.62, resulting in a difference of £30,416.26. The total number of LYG were 5.017 and 3.962 for fulvestrant and anastrozole respectively meaning that fulvestrant resulted in just over one additional life year. The total number of QALYs were 2.31 and 1.80 for fulvestrant and anastrozole respectively, with a difference of 0.51. The cost per QALY was £59,914.38, which is higher than the £20,000 – £30,000 threshold set by NICE, and therefore deemed to not be cost-effective. The cost per LYG was £28,824.68.
Deterministic sensitivity analysis
The tornado diagram was used to determine the main drivers of the ICER. Figure 5 shows the tornado diagram with the results. The parameter that resulted in the most uncertainty was the PFS hazard ratio, followed by the utility for stable disease, the utility for treatment response and the utility for post-progression. Varying the PFS hazard ratio resulted in a £67,243.40 per QALY difference in the ICER, showing a high level of uncertainty around this parameter. Varying the stable disease utility resulted in a difference in the ICER of £24,964.33. The parameter with the smallest effect was the cost of gastroenteritis, which resulted in a minor difference in the ICER of £7.85.
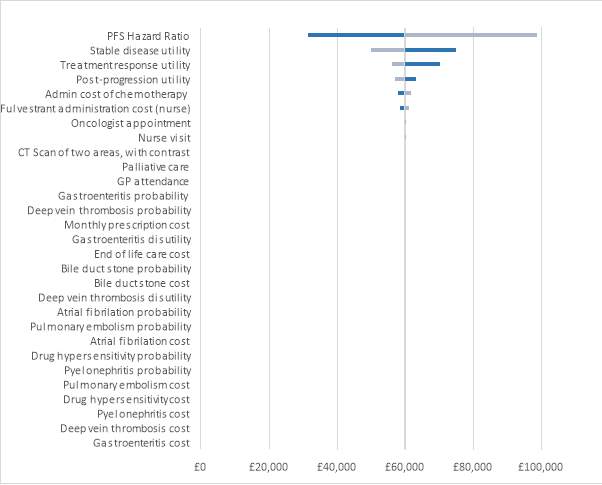
Figure 5: Tornado diagram
Table 10 shows the parameters that were included in the deterministic sensitivity analysis and how much they varied the ICER. None of the parameter variations resulted in an ICER within the NICE threshold. It is evident that the SAEs did not result in a huge difference, meaning they had a small impact on the ICER.
| Parameters: | Output with low values | Output with high values | Difference |
| PFS Hazard Ratio | £31,536.45 | £98,779.86 | £67,243.40 |
| Stable disease utility | £74,892.98 | £49,928.65 | £24,964.33 |
| Treatment response utility | £70,224.05 | £56,002.63 | £14,221.41 |
| Post-progression utility | £63,280.20 | £56,888.54 | £6,391.66 |
| Admin cost of chemotherapy | £57,755.58 | £61,578.85 | £3,823.27 |
| Fulvestrant administration cost (nurse) | £58,353.62 | £61,109.02 | £2,755.40 |
| Oncologist appointment | £59,621.04 | £60,291.22 | £670.18 |
| Nurse visit | £59,693.28 | £60,205.84 | £512.55 |
| CT Scan of two areas, with contrast | £59,711.39 | £60,055.86 | £344.47 |
| Palliative care | £59,530.29 | £59,852.90 | £322.61 |
| GP attendance | £59,874.18 | £59,964.64 | £90.45 |
| Gastroenteritis probability | £59,878.83 | £59,949.97 | £71.14 |
| Deep vein thrombosis probability | £59,944.96 | £59,883.83 | £61.14 |
| Monthly prescription cost | £59,927.02 | £59,872.27 | £54.75 |
| Gastroenteritis disutility | £59,941.22 | £59,887.58 | £53.64 |
| End of life care cost | £59,938.51 | £59,890.26 | £48.25 |
| Bile duct stone probability | £59,938.35 | £59,890.42 | £47.92 |
| Bile duct stone cost | £59,947.42 | £59,906.56 | £40.86 |
| Deep vein thrombosis disutility | £59,894.16 | £59,934.62 | £40.46 |
| Atrial fibrilation probability | £59,895.51 | £59,933.26 | £37.75 |
| Pulmonary embolism probability | £59,896.35 | £59,932.42 | £36.08 |
| Atrial fibrilation cost | £59,897.43 | £59,929.74 | £32.31 |
| Drug hypersensitivity probability | £59,899.46 | £59,929.31 | £29.85 |
| Pyelonephritis probability | £59,924.63 | £59,904.14 | £20.48 |
| Pulmonary embolism cost | £59,902.25 | £59,919.42 | £17.16 |
| Drug hypersensitivity cost | £59,900.23 | £59,916.88 | £16.65 |
| Pyelonephritis cost | £59,924.85 | £59,910.34 | £14.51 |
| Deep vein thrombosis cost | £59,920.45 | £59,911.51 | £8.94 |
| Gastroenteritis cost | £59,910.06 | £59,917.91 | £7.85 |
Table 10
Threshold analysis
Threshold analysis was conducted to determine the maximum amount that fulvestrant should cost for the ICER to be £20,000 and £30,000. For the ICER to be equal to £20,000 the cost of fulvestrant would have to change drastically, to £81,42. For the ICER to be at the higher end of the threshold at £30,000 the cost of fulvestrant would have to be £217.04.
Probabilistic sensitivity analysis
The probabilistic sensitivity analysis was conducted to vary all parameters simultaneously. This involved running 5000 Monte Carlo simulations in Excel. The results from the PSA were plotted on the cost-effectiveness plane, shown in figure 6, demonstrated that fulvestrant fell in the north-east quadrant, meaning that it was more effective and more costly than anastrozole. The probabilistic ICER that was generated from the PSA was £59,744.40 per QALY, which is very similar to the base case ICER. The probabilistic ICER for LYG was £31,698.74, which was slightly higher than the base case cost per LYG.
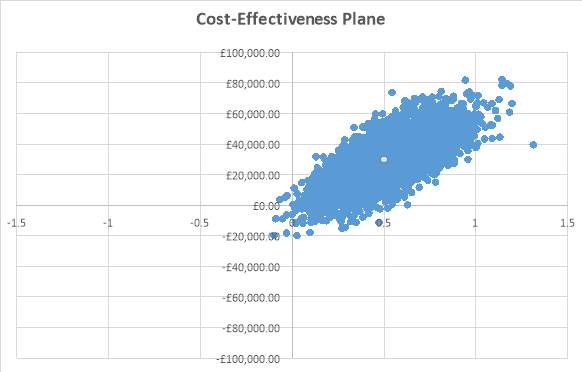
Figure 6: Cost-effectiveness plane
The CEAC was plotted to demonstrate the uncertainty around the ICER for the QALY. It demonstrated the probability that fulvestrant was cost-effective in comparison to anastrozole. From looking at the CEAC in figure 7 it was evident that there was a lot of uncertainty around the ICER. At a willingness to pay threshold of £20,000 the probability of fulvestrant being cost-effective was 5.58%. At a threshold of £30,0000 the probability was 10.02%. At a threshold of £50,000 the probability of fulvestrant being cost-effective was less than anastrozole at 32.18%. At a willingness to pay threshold of £100,000 the probability of fulvestrant being cost-effective was 95.40%, however this is a very high WTP threshold and far too high compared to the £20,000 – £30,000 threshold set by NICE.
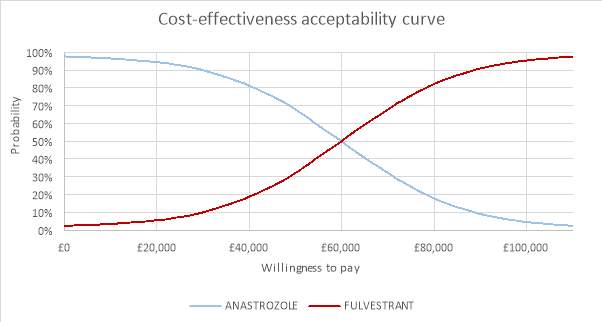
Figure 7: Cost-effectiveness acceptability curve
Scenario analysis
Changing the discount rate to 1.5% for both costs and outcomes resulted in a minor change to the ICERs. The cost per QALY changed from £59,914.38 to £59,660.15. This demonstrates that the discount rate does not have a huge impact on the ICER. The cost per LYG changed from £28,824.68 to £28,171.02, also resulting in a very small change.
A scenario analysis was conducted using different distributions for extrapolating the survival data. The log-logistic distribution was used for all curves as it was the second-best fit for all three curves based on the AIC. This resulted in the cost for the anastrozole arm changing to £86,265.47 and the fulvestrant arm changing to £106,684.28, resulting in a smaller difference of £20,418.82. The QALYs were 2.356 and 1.967 for fulvestrant and anastrozole respectively, a difference of 0.389. The LYG for fulvestrant was 5.244 and for anastrozole was 4.540, a difference of 0.704. This resulted in a small change in the cost per QALY, which was £52,516.42, a decrease of just over £7,000. The cost per LYG resulted in a very minor change to £28,985.97.
Discussion
From a UK NHS perspective, fulvestrant is not considered cost-effective for treating postmenopausal women with ER-positive LABC or MBC. Although fulvestrant resulted in one additional life year and an additional 0.51 QALYs in comparison to anastrozole, it was too costly. Reasons for this may be the difference in price between fulvestrant and anastrozole. Fulvestrant costs £522.41 which is much more than anastrozole which only costs £1.08. Anastrozole previously cost £68.56, however the NHS indicative price is £1.08. It is also important to note that administration costs for both drugs differ considerably. Anastrozole has low administration costs as it is given as a prescribed tablet that patients take daily.
However, as fulvestrant is administered given as intramuscular injections it must be administered by a nurse every month, which has higher costs. As well as the high costs associated with its administration it has been considered as inconvenient as it requires a monthly visit to a nurse in a hospital or GP practice. However, uptake can be controlled by health professionals whereas patients taking tablets by themselves can forget to take them or potentially misplace them, resulting in wastage.
The deterministic sensitivity analysis showed that the hazard ratio that was calculated from the meta-analysis and used to obtain the PFS for the fulvestrant arm had the highest level of uncertainty. Conducting a meta-analysis on hazard ratios has some challenges as there may be variations in the way studies report progression or survival (Bartolucci and Hillegass, 2010). However, both studies did use the same criteria for assessing progression, which involved tumour assessments done by local investigators and was determined by Response Evaluation Criteria in Solid Tumours (RECIST), or surgery or radiotherapy for deteriorating disease or death (Robertson et al., 2016, Robertson et al., 2009).
Another challenge faced when using a hazard ratio from a meta-analysis is that heterogeneity might be introduced if the follow-up time differs between the studies (Bartolucci and Hillegass, 2010). The FALCON trial had a follow up time of 36 months for PFS (Robertson et al., 2016) and the FIRST trial had a follow-up time of 44 months (Robertson et al., 2012). Although the follow-up time was different between trials and could have resulted in heterogeneity, the I2 value was 0% meaning there was no observed heterogeneity.
The threshold analysis that was conducted on the cost of fulvestrant showed that in order for the ICER to be equal to £20,000 the price of fulvestrant would have to become £81.42. However, for the ICER to be equal to £30,000 it would need to be £217.04, which is a less drastic change. This further emphasises that the price of fulvestrant and the difference of price compared to anastrozole could be a key driver in the high cost per QALY. The PSA confirmed that fulvestrant is not cost-effective. The probabilistic ICER was £59,744.40. The cost-effectiveness plane showed that it fell in the north-east quadrant, meaning it was more effective and more costly. From the CEAC it was evident that there was a lot of uncertainty around the cost per QALY as the probability of the true ICER being £59,000 was 48.16%.The probability of the ICER being equal to the £20,000 threshold set by NICE was 5.58%.
Scenario analysis showed that the discount rate had little influence on the results, as changing the rate to 1.5% resulted in very minor differences. When the different parametric curves were used to extrapolate survival, there were some changes in the results. For example, the difference in cost was smaller as well as the difference in QALYs. The ICER was reduced to £52,516.42, but still failed to be within the acceptable threshold.
Limitations
The decision model used was a partitioned survival model, which is a common way of modelling advanced cancer (Woods et al., 2017). Woods et al. (2017) reviewed 30 NICE technology appraisals of cancer treatments from May 2013 to February 2016 and discovered that a partitioned survival model was used in 73% of the appraisals. There are some limitations of using a partitioned survival model with the main limitation being that the survival functions they depend on are independent (Woods et al., 2017). This leads to further issues such as the survival endpoints might include some of the same events, for example, OS and PFS might include the same deaths.
Also, it has been a common issue that sometimes partitioned survival models result in a PFS curve that lies above the OS curve (Woods et al., 2017). However, both the OS and PFS curves for the fulvestrant and anastrozole arms were checked and neither resulted in a PFS curve that was above the OS curve. Figures ? and ? in the appendix shows the graphical proof. Although the partitioned survival model has its limitations, it is regularly used for cost-effectiveness analyses of cancer treatments and NICE approves the use of them.
The model assumed that patients did not receive prior endocrine therapy as that was the criteria for the FALCON trial. However, it is very likely that most patients that have advanced BC, are experiencing a recurrence, and have therefore received prior treatment when they were first diagnosed with BC at an earlier stage. As their ER status would have been known, they would have received prior endocrine therapy. Therefore, it might be necessary that the efficacy of fulvestrant is assessed in people who have received prior endocrine therapy for early disease, in order for it to be a true representation of real world settings.
The model did not compare fulvestrant to other AIs that are available to this patient group, however there are disagreements on whether anastrozole is as effective as other AIs, especially letrozole. Although anastrozole is one of the most prescribed AIs to this patient group, letrozole is also available, and some studies have reported it to be more effective than anastrozole, but also more potent (Geisler, 2011). Also, the network-meta analysis conducted by Zhang et al. (2017) showed that fulvestrant was more efficacious than anastrozole and exemestane, but not more efficacious than letrozole.
The progressed disease health state assumes that patients receive chemotherapy treatment until death. Once patients have progressed on endocrine therapy NICE recommends that they receive chemotherapy, however, some patients may not be receiving chemotherapy until death due to their illness progressing and toxic side effects. For example, in the cost-effectiveness model by Das et al. (2013) only a proportion of the patients with progressed disease were allocated to receiving chemotherapy, however, their model was based on chemotherapy being administered as third-line therapy, whereas the current model was based on chemotherapy being administered in second line therapy, therefore patients would be at a less severe stage of disease than in Das et al.’s (2013) model and therefore more would receive chemotherapy. Overall, including chemotherapy in the progressed disease state may be a slight misrepresentation, and could also account for higher costs in this health state, as docetaxel is a costly drug.
It is also very likely that patients receiving chemotherapy in the progressed disease health state would experience SAEs, therefore they would have had a lower utility score. This was unable to be incorporated in to the model as there is a lack of evidence on the proportion of patients experiencing SAEs from chemotherapy as second-line treatment after receiving fulvestrant or anastrozole. However, the utility of progressed disease was used, and has been used for other cost-effectiveness models where chemotherapy has been used after endocrine therapy (Das et al., 2013, Fleeman et al., 2011).
Also, it is possible that patients would receive different chemotherapy drugs, as there are other chemotherapy options available. Sometimes combination chemotherapy is used, and it is possible that a patient may receive two sequences of chemotherapy. Das et al. (2013) took the average cost of the different chemotherapy options that NICE recommends and used that cost in their progressed disease state. However, this model chose to include docetaxel which is recommended by NICE as the first chemotherapy drug to give patients with LABC and MBC (NICE, 2009).
The model only takes in to account disutilities from two SAEs, gastroenteritis in the fulvestrant arm and deep vein thrombosis in the anastrozole arm, and has no disutility associated with the other SAEs. This was due to limited data being available in the literature for these SAEs. The disutility for gastroenteritis was taken from the Lloyd et al., (2006) study, which is consistent with the other utilities used in the model. However, the disutility for deep vein thrombosis was obtained from the Delea et al. (2007) study. As there is an inconsistency in where the disutilities came from, this could hinder their reliability.
Also, the disutility associated with deep vein thrombosis was taken from a study that was conducted on patients with early BC, not LABC or MBC (Delea et al., 2007). Therefore, this could further hinder the reliability of the disutility as it is a potential that the disutility would be greater for those with LABC or MBC. Although the disutilities are lacking in efficiency, it is unlikely that they had a huge impact on the results. This is because such a small proportion of patients experienced SAEs and it is was evident from the deterministic sensitivity analysis that they had a small impact on the ICER. Some cost-effectiveness analysis of fulvestrant versus anastrozole did not include disutilities for SAEs due to a small percentage of patients experiencing them (Ding et al., 2017).
It is important to note that using digitized curves is not as accurate as using individual patient level data from the RCT. However, the Hoyle and Henley (2011) method was used which has been adopted and tested and has shown to be effective in recreating individual patient level data. There are some limitations associated with the Hoyle and Henley (2011) method, including that it assumes constant censoring across time intervals, which isn’t always the case (Wan 2015). Also, the method only allows the Weibull, Exponential, Logistic, Log-logistic and Log-normal distributions to be used, which could exclude a distribution which is a better fit.
The model assumes that all patients in the PFS health state are responding to treatment, and therefore applies the responding to treatment utility. However, this is usually not the case for everyone on treatment. Response rates can be important indicators for how well a drug works, and it would be useful to include response rates from the trial and include them in the model to improve its reliability.
Although the model showed that fulvestrant is not cost-effective, the model contained some flaws and future research should be conducted to further assess the effects of fulvestrant for this patient group. Once OS data is available from the FALCON trial, it will be useful to include it in the model to improve the reliability of the data. Also, comparing fulvestrant to other AIs would be useful as there is conflicting evidence about whether anastrozole is less effective or as effective than letrozole.
Research in to the best sequence of treatment is also needed for this patient group. For example, if patients progress on fulvestrant should they have more endocrine therapy such as an AI or receive chemotherapy.
Appendix
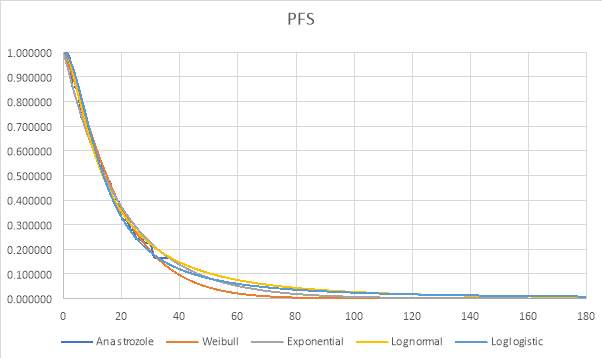
Graph 1: Parametric and Kaplan-Meier estimates of PFS for Anastrozole (FALCON trial)
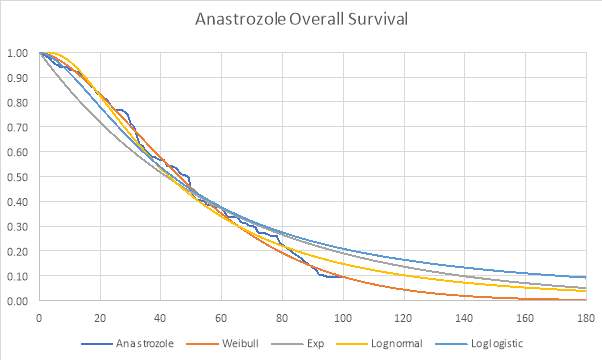
Graph 2: Parametric and Kaplan-Meier estimates of OS for Anastrozole (FIRST trial)
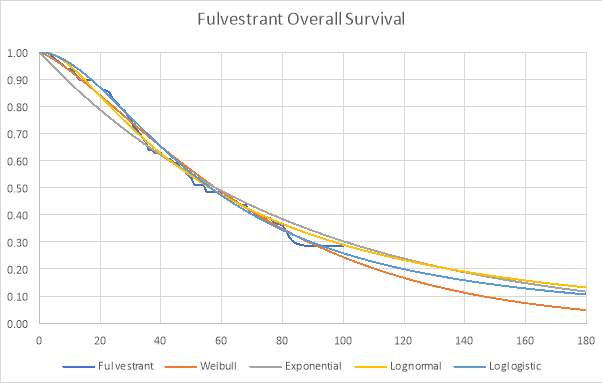
Graph 3: Parametric and Kaplan-Meier estimates of OS for Fulvestrant (FIRST trial)
Graphical representation of the partitioned survival model for the fulvestrant arm (also known as area under the curve).
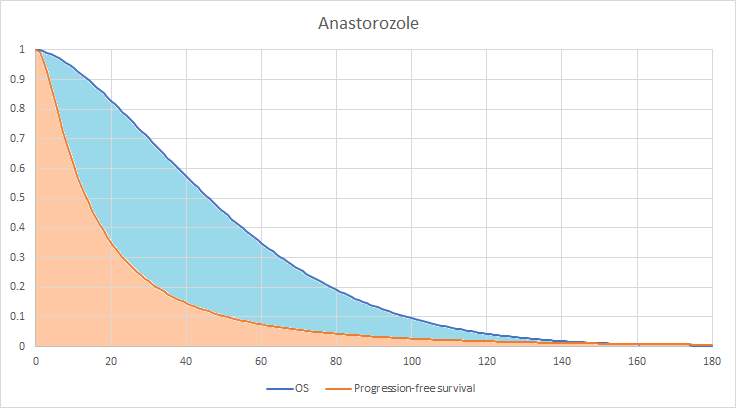
Graphical representation of the partitioned survival model for the anastrozole arm (also known as area under the curve).
Cite This Work
To export a reference to this article please select a referencing stye below:
Related Services
View all


Related Content
All TagsContent relating to: "Biomedical Science"
Biomedical Science focuses on how cells, organs and systems function in the human body and underpins much of modern medicine. Biomedical Science applies parts of natural and/or formal sciences to help develop advances in healthcare.
Related Articles

DMCA / Removal Request
If you are the original writer of this dissertation and no longer wish to have your work published on the UKDiss.com website then please: