Diluted Magnetic Semiconductors
Info: 9750 words (39 pages) Dissertation
Published: 9th Dec 2019
Tagged: EngineeringElectronics
ABSTRACT
INTRODUCTION
DILUTED MAGNETIC SEMICONDUCTORS
Dilute magnetic semiconductors (DMS) are semiconductors that have been doped with transition metals with unpaired d electrons. These materials has achieved a great interest due to their potential application in Spintronics[1].
Spintronics is considered as a promising approach towards the improvement of electronic devices by offering simultaneous control over electric and magnetic properties i.e. simultaneous control over intrinsic spin of the electron and its associated magnetic moment alongside its fundamental charge. Transition metal silicides and germanides have been widely investigated for they exhibit a variety of magnetic and electric properties that could be exploited according to the requirement. These properties have led them to their various applications in spintronics as well as in some GMR applications. From the experimental results which show a significant change in Curie temperature with change in concentration of Mn in MnxGe1-x and the p- type semiconducting property of the same, reported by Park et. al.[2], Ge-Mn system seems promising in allowing simultaneous control over magnetic and electric properties. This lead to many experimentations and studies on magnetic properties of this system[3][4][5][6][7]. Although many have tried to synthesize metastable phases of Mn-Ge system, they were synthesized under high temperature and high-pressure synthesis techniques[8][9][10][11], by relatively low temperature molecular beam epitaxy growth technique[12][13][2], or by doping Mn into Ge crystals [14] and all of these techniques have their limitations and practical difficulties.
Current work involves the synthesis of metastable MnGe phase at room temperature and pressure using mechanochemical processing technique i.e. by mechanically inducing solid state reactions. This technique has been used previously to synthesize many intermetallic compounds [15][16][17][18] including a metastable phase of Ni-Ge system under room temperature and pressure [19].
(More to be added)
NON EQUILIRBRIUM PROCESSING
Research for development of materials with improved properties has been increasing through increasing with increase in demand for advanced materials designed specifically for demanding applications. These advanced materials are designed by controlling the structure such that they are tailored specifically to obtain a set of properties[20]. Non-equilibrium processing techniques such as rapid solidification from liquid state, vapor deposition, plasma processing, mechanical alloying(MA) as well as irradiation/Ion implantation can producing/synthesize such materials with unique and improvised properties. The basic process underlying in these techniques is to synthesize materials in a non-equilibrium state by ‘energizing and quenching’ as shown in Figure below
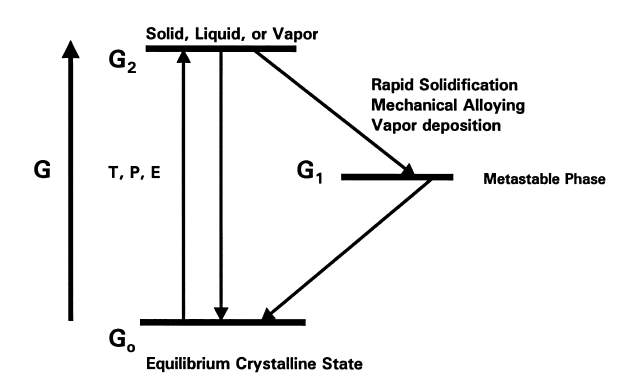
Figure 1 The basic concept of “energize and quench” to synthesize non-equilibrium materials. |
The energizing process involves exciting the material to a non-equilibrium state by external dynamical force such as melting, evaporating, irradiation, application of pressure or storing of mechanical energy by plastic deformation (as in MA)[21]. The material is then quenched to configurationally frozen state which if necessary can then be used for subsequent heat treatment. These techniques have been widely used and are rapidly developing to erase or minimize material limitations on many applications using new and improved materials.
The feasibility of synthesising a metastable structure using a certain synthesis technique can be evaluated by determining/estimating the departure from equilibrium[20] which determines that maximum energy that can stored in excess than that in equilibrium state. This far from equilibrium processing shows significant departures from equilibrium. The departure values for various processes are shown in table below.
Table 6 Departure from equilibrium achieved in various processes [22]
| Process | Maximum departure from equilibrium | |
| (KJ mol-1) | ||
| Solid state quench | 16a | |
| Quench from liquid (rapid solidification) | 24b | |
| Condensation from vapor | 160c | |
| Irradiation / Ion implantation | 30d | |
| Mechanical cold work | 1e | |
| Mechanical alloying | 30d | |
| a Assuming disordering of an ordered intermetallic (not ordered to MP) (6 KJ mol-1) and a supersaturated solid solution (10 KJ mol-1) | ||
| b Assuming disordering of an ordered intermetallic (not ordered to MP) (6 kJ mol-1), amorphous phase formation (8 kJ mol-1) and a supersaturated solid solution (10 kJ mol-1). | ||
| c Assuming a super cooled vapor transforms to a solid (160 kJ mol-1). | ||
| d Assuming a strongly ordered intermetallic (ordered to MP) disorders (12 kJ mol-1) and becomes amorphous (8 kJ mol-1), and is a supersaturated solid solution (10 kJ mol-1) | ||
| e Assuming 1016 dislocations m-2 (2 kJ mol-1). | ||
| MP, melting point. | ||
The departure from equilibrium in MA is exceeded only by condensation from vapor and compared to rapid solidification technique, it has larger departures. This departure from equilibrium in mechanical alloying leads to following attributes shown in table below:
Table 7 Attributes of mechanical alloying[22]
|
| 2. Extension of solubility limits |
| 3. Refinement of the matrix microstructure down to the |
| nanometre range |
| 4. Synthesis of novel crystalline phases |
| 5. Development of amorphous (glassy) phases |
| 6. Possibility of alloying of difficult-to-alloy elements |
| 7. Inducement of chemical reactions at low temperatures |
| 8. scalable process |
Mechanical alloying (MA) is an inexpensive non-equilibrium processing techniques. Wide range of alloys including ODS alloys; ceramics, intermetallics, amorphous materials, solid-state solutions including super saturated solid solutions, metastable crystalline and quasi crystalline phases including nanocrystalline structures have been developed using Mechanical alloying technique[20]. This method has become common in industries for production of such materials[23]. This technique was first developed and used by John Benjamin and his colleagues in 1966 at Paul D. Merica Research Laboratory of the International Nickel Company (INCO). MA has currently been shown that it can be used to synthesize a range of equilibrium as well as non-equilibrium alloy phases ranging from homogenized elemental to prealloyed powders. One thought that ought to be avoided is a possible contamination from the milling media which was reported previously[19].
MECHANICAL ALLOYING PROCESS
This technique has been known as a ‘mechanochemical synthesis’ technique, ‘solid-state processing’ technique, ‘far from equilibrium’ or a ‘Non-equilibrium’ synthesis technique because of the way it functions. It involves continual deformation of materials/powders by repeated fracturing and rewelding of powder particles. This deformation is carried out by extremely energetic collisions of grinding media (balls) moving with high KE and the powders with themselves and the inner walls of the vial.
A blend of initial powders is taken in required composition and is added into a suitable vial. A suitable grinding media mostly steel balls, are used provide the required energy transfer. Whenever these two steel balls collide, some quantity of powder is captured in between them. The force of the impact plastically distorts the powder particles resulting in work hardening and fracture. The new surfaces created alter the particles to weld along and this results in a rise in particle size as in the early stages of milling process, the particles are soft, and hence their tendency to weld along and form massive particles is high. The process schematic is shown in Figures below.
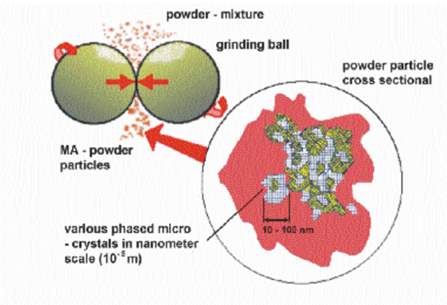
Figure 2 Schematic of collision as the main event of energy transfer [24] |
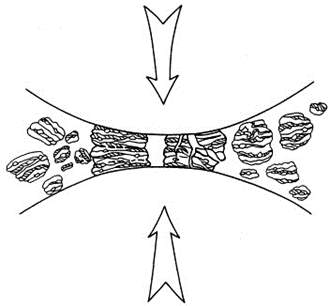
Figure 3 Particles getting trapped between the grinding media [22] |
This milling process is carried out until the desired steady state composition is achieved i.e. every powder particle has the same proportion as of starting elements taken in powder form. The obtained powder is subjected to heat treatment if necessary to obtain a required compound with desired microstructure and properties. Although the process appears simple, there are a number of variables/parameters that can be or need to be adjusted to obtain desired compound/ microstructure without or with least contamination. Some of the parameters that effect the final product we obtain are:
- Type of Mill
- Milling Container
- Milling Speed
- Milling Time
- Type, Size and size distribution of grinding medium
- Ball to powder ratio
- Extent to filling the vial
- Milling atmosphere
- Process control agent
- Temperature of Milling
Some of these parameters are interrelated as the Milling speed is mostly specific to Type of mill. Also, the optimum milling time depends on the type of mill, ball to powder ratio, type, size and size distribution of grinding medium and the extent to filling the vial. It also depends on the type and the amount of process control agent used.
TYPE OF MILL
For the processing of materials using high kinetic energy techniques, equipment like Conventional Horizontal Ball Mills, Horizontal ball mill controlled by magnetic force, Vertical mill, Attritor mill and shaker ball mill have been in use for the past decade, each being modified and upgraded to process different types of materials.
In mechanical alloying, the powder mixture which may contain either the elemental particles or the alloying particles is loaded into the container of the ball mill which is also known as the vial or the bowl or the jar alongside some steel or ceramic balls. The powder particles are subjected to high energy collisions of the balls when the vials are rotated or shaken with high kinetic energy. Hence the basic equipment for mechanical alloying is a Ball mill.
The alloying process can be done in various equipment namely Attritor mill, SPEX shaker mill, Planetary ball mill or a horizontal mill, whichever equipment is used, the principle behind the mechanical alloying is the same. The particles are repeatedly fractured and cold welded during the process and hence is important to maintain a balance between the two to alloy successfully. It is believed that the key to successful synthesis is to select appropriate impact energy for the milling process.
The well-known Planetary ball mill, the shaker mill or the vertical Attritor are often used to produce mechanically alloyed powders for laboratory purpose. The Simoloyer (horizontal rotary ball mill) is a modern and advanced device for processing of Hem/MA/RM and allows the advantage of a direct scaling up for means of an industrial purpose.
To process a small quantity of powder mixture for use in laboratory, Shaker ball mills are often used. A typical example of such shaker mill is SPEX 8000 which was originally developed to pulverize spectrographic samples.
LITERATURE REVIEW AND BACKGROUND
Many metallic Germanides have been studied and synthesised so far including Transition metal germanides, rare-earth metal germanides and rare-earth transition metal germanides as they exhibit wide array of intriguing properties including but not limited to High thermal stability (limited to some transition metals) and oxidation resistance(limited to some transition metals) useful in Thermoelectric power generation at high temperatures[25] along with variety of electric and magnetic properties which in turn are used in semiconductor applications[19] and Spintronics applications like GMR technology[26]. Some of these are mentioned below in the literature. 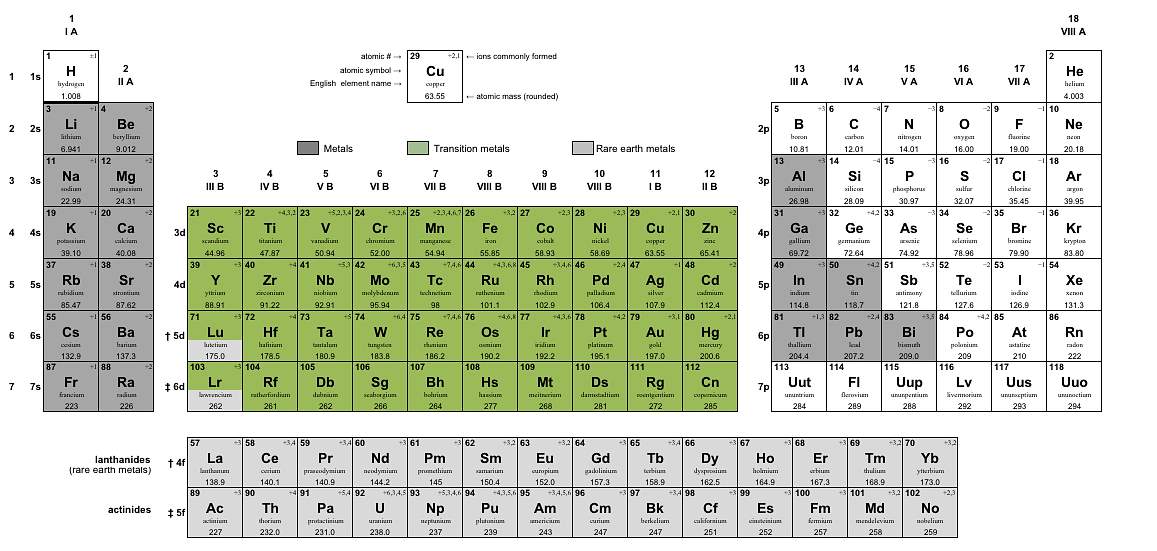
Figure 4 Periodic Table with metals, rare-earths and transition metals highlighted
METALLIC GERMANIDES
In 2004, Hiroshi Fukuoka et. al.[27] synthesised a new binary germanium rich germanide, SrGe6-(= 0.5) using the High-pressure synthesis technique. This synthesis was performed in two steps, with first step being, reacting flakes of Strontium and Germanium with high purity and with molar ratios varying between 1:5 to 1:6 in an Ar-filled arc furnace and grinding them inside an Ar-filled glove box to prevent oxidation of Germanium. The products obtained in the first step were found to be mixture of SrGe2 and Ge. In the subsequent step, they subjected this mixture to a high pressure of 5 GPa and were heated at 1200°C for 30 min.
The samples obtained were each characterized using an X-Ray diffractometer and an electron probe analyzer was used on 12 single crystals to determine the composition of the obtained germanide. The analysis performed on these 12 single crystals showed that the Ge composition ranged from 5.43 to 5.86 and hence the compound was described as SrGe6-. X-ray single crystal structure analysis was performed on a suitable single crystal and the structure was solved using CrystalStructure crystallography software package and the composition was determined to be SrGe5.6. The structure of this compound was found to be a cage like structure with a Ge covalent network having each Sr atom surrounded by 14 Ge atoms.
They performed physical property measurements such as temperature dependence of electrical conductivity on a disk-shaped sample from room temperature to 2K using Van der Pauw method and on a bar shaped sample which as in Figure 2. showed that the electrical resistivity of the obtained sample decreased with decreasing temperature with small amount of residual resistance ~0.28 mΩ cm and the resistivity ratio between 300K and 2K temperature was found to be approximately 4, thermoelectric power measurements were performed using MMR Seebeck effect measurement technique and this revealed positive thermoelectric power indicating that the primary charge carriers are Holes. The thermo electric power shown in Figure 3 of this compound at room temperature was found to be 13 μV/K, not high enough for thermoelectric applications.
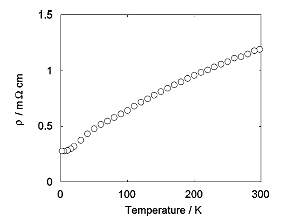
Figure 5 Temperature dependence of the electrical resistivity of SrGe5.6 |
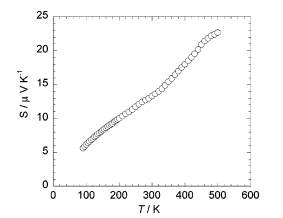
Figure 6 Temperature dependence of the thermoelectric power of SrGe5.6 measured from 500 to 90K |
This low conductivity was assumed to be due to Ge vacancy. The electron count of this compound SrGe5.6 (as determined by single crystal analysis) was approximated to be such that the two electrons donated by the Sr atom to the Ge network are consumed by 0.5Ge vacancy per Sr atom to from four lone pairs of neighboring four Ge atoms. This was assumed to be the possible reason for SrGe5.6 showing low conductivity.
TRANSITIONMETAL GERMANIDES
In 1966, I. Mayer et. al. [28] synthesised silicides and germanides of various metals at relatively low temperatures using Amalgam method. Although some metals are not readily soluble in mercury including Germanium being sparsely soluble, with increase in temperature the solubility could be improved. Also, for the formation of desired compounds, the elemental metals should not only dissolve in mercury to form amalgams but also be able to dissociate from it. They studied the optimum conditions for synthesising silicides and germanides by this method varying several parameters.
They started with filings of metals namely Mn, Fe, Ni and Pt (chemically pure) and rare earth metals with 99.9% purity along with powders of Germanium and Silicon also 99.9% pure. The blend of these metal filings and Germanium/Silicon were placed inside a Pyrex tube. The tube was then filled with mercury such that the blend is I% of mercury and was sealed after purging 3-4 times with Argon. This tube is then heated in an electric furnace for 10-15 hrs between 450-500 C followed by cooling over 2-3 hrs. This process was desirable to improve solubility of blend in mercury. The amalgam so obtained was then distilled to separate out distilled mercury and amalgam. The residual amalgam was then heated for 10-15hrs at 500-600 C. This treatment decomposed the amalgams and the reactions required to form desired compound occurred i.e. reactions between metal and the germanium or silicon.
They performed X-ray analysis on the obtained silicides and germanides. It showed that they were free from any metal-mercury compounds although some germanium and silicon lines were observed, this could be because of non-stochiometric silicides and germanides formation.
The preparation conditions and crystal type of all the silicides and germanides prepared by this method are show in Table 1 below in which the first stage represents formation of amalgams, second stage is the distillation of mercury and the third stage is decomposition of the metal-mercury compounds.
Table 1 Preparation conditions and crystal type of Rare-Earth Disilicides, Digermanides and Transition-metal silicides and germanides[28]
| Disilicide of | First stage | Second Stage | Third stage | Crystal type | |||
| Temp (°C) | Duration of Heating (h) | Temp (°C) | Duration
of Heating (h) |
Temp
(°C) |
Duration
of Heating (h) |
||
| La | 550 | 18 | 180 | 3 | 550 | 25 | GdSi2 |
| Ce | 550 | 18 | 180 | 3 | 550 | 6 | ThSi2 |
| Pr | 445 | 8 | 180 | 8 | 500 | 5 | GdSi2 |
| Nd | 450 | 8 | 180 | 8 | 500 | 5 | GdSi2 |
| Gd | 450 | 10 | 200 | 2 | 550 | 10 | AlB2 |
| Tb | 450 | 16 | 210 | 3 | 550 | 10 | AlB2 |
| Dy | 450 | 16 | 200 | 3 | 550 | 10 | AlB2 |
| Ho | 450 | 16 | 200 | 3 | 550 | 10 | AlB2 |
| Er | 450 | 8 | 200 | 3 | 550 | 10 | AlB2 |
| Tm | 450 | 16 | 180 | 3 | 550 | 12 | AlB2 |
| Yb | 450 | 20 | 210 | 3 | 550 | 10 | AlB2 |
| Lu | 450 | 20 | 190 | 3 | 550 | 10 | AlB2 |
| Y | 450 | 10 | 200 | 3 | 550 | 10 | AlB2 |
| Digermanide of | Temp (°C) | Duration of Heating (h) | Temp (°C) | Duration
of Heating (h) |
Temp
(°C) |
Duration
of Heating (h) |
|
| La, Ce | 450 | 15 | 190 | 5 | 550 | 10 | GdSi2 |
| Pr-Dy, y | 450 | 15 | 190 | 5 | 550 | 10 | ThSi2 |
| Ho-Lu | 450 | 15 | 190 | 5 | 550 | 10 | Mixed Phase |
| Compound | First stage | Second Stage | Third stage | Crystal type | |||
| Temp (°C) | Duration of Heating (h) | Temp (°C) | Duration
of Heating (h) |
Temp
(°C) |
Duration
of Heating (h) |
||
| Mn5Si3 | 450 | 15 | 190 | 10 | 550 | 20 | Mn5Si3 |
| Mn5Ge3 | 500 | 15 | 240 | 1 | 700-800 | 5 | Mn5Si3 |
| Ni2Si | 450 | 15 | 200 | 10 | 500 | 10 | PbCl2 |
| Pt2Si | 450 | 12 | 190 | 5 | 500 | 10 | _____ |
They concluded that even if only one of the component metals are reactive to mercury, intermetallic compounds can still be formed using Amalgam method as the metal powder obtained after amalgam formation and dissociation is highly reactive and will immediately start reaction by interdiffusion with other metals at slightly elevated temperatures and in some cases even at room temperatures.
In 1980, V. M. Agoshkov et. al. [29] synthesised/Crystallized both α and β phases of WGe2 and MoGe2 using High pressure and High temperature synthesis technique. They prepared the sample from powdered molybdenum, tungsten and germanium with purity >99.9%. The blend of these powders Mo-Ge and W-Ge were placed in the heater inside a high-pressure chamber and were treated with high pressure and temperature over a period from 10-40 min.
Each sample obtained after those specific treatments were studied under room temperature and pressure conditions. X-ray powder photography was performed on the samples to determine the phases present and they found that both α and β phases of WGe2 in W-Ge system and MoGe2 in Mo-Ge system were present. Tungsten digermanides crystallized at 870K with molybdenum digermanides close to 800K. α-MoGe2 was obtained at 20Kbar whereas the β-MoGe2 was obtained at high pressure and similarly in W-Ge system α-WGe2 was obtained at pressures < 30Kbar compared to high pressures for obtaining β-WGe2. To determine the unit cell dimension of the phases obtained, they used a mixture with NaCl. X-ray microanalysis was used to determine the composition of the alloys obtained and they concluded that all the phases were prepared in pure form with a stoichiometric composition.
Along with studying the thermal stability of the obtained samples at high temperatures ~1000 °C, they also determined the dependence of resistivity on temperature between 4.2 and 270K range using a four-contact scheme and an alternating current of frequency 30Hz. On annealing, the samples for 5h at 1000 °C at atmospheric pressure in an evacuated quartz tube, the α-WGe2 and β-WGe2 decomposed into elements whereas β-MoGe2 got converted to α-MoGe2.
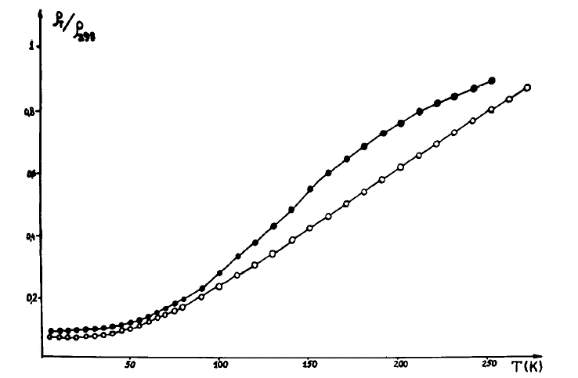
Figure 7 electrical resistivity vs. temperature for α-MoGe2 and β-MoGe2[29]
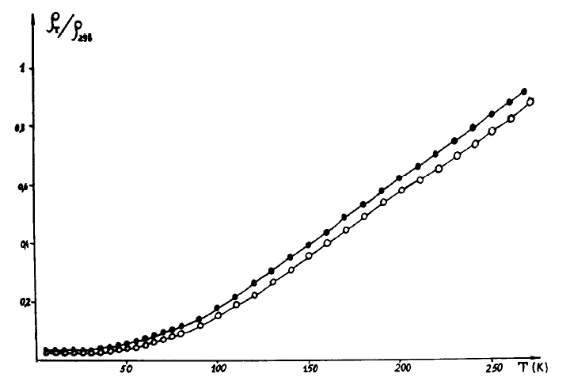
Figure 8electrical resistivity vs. temperature for α-WGe2 and β-WGe2[29]
They concluded from the electrical resistivity measurements performed on these samples as shown in Figures 4 and 5 that these samples show conductivity like metals at low temperatures.
In 1987, H. Takizawa et. al. synthesized Mn3Ge5, a germanium-rich manganese germanide using High Pressure and High-temperature synthesis technique. As shown in the phase diagram Figure 6, in Mn-Ge system there exists five intermetallic compounds, Mn3.25Ge, Mn5Ge2, Mn2Ge, Mn5Ge3, and Mn11Ge8, under equilibrium conditions [TMG6,7]. By the time of their study, germanium-rich germanides were not synthesized or we could say that there existed no germanides on the phase diagram which contained more than 50% germanium. In this study, they were aiming to prepare a Germanium-rich Manganese germanides i.e. Mn3Ge5 which was expected to be semiconductor.
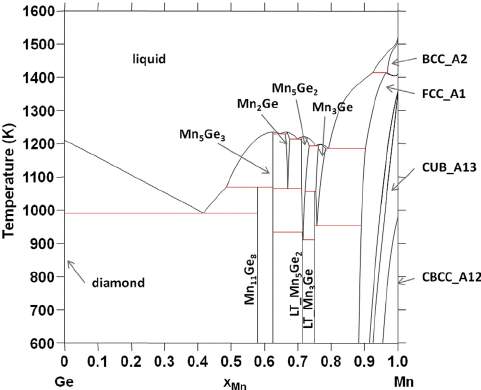
Figure 9 Mn-Ge phase diagram[30]
They started with powders of Manganese and germanium with purities >99% in case of manganese and >99.99% in case of germanium. A blend of these powders with varying atomic ratios from1.5 to 2.0 was prepared and pressed to form pellets of dimensions 5mm diameter by 3mm thickness. These pellets were placed into a cylindrical BN capsule which was then placed in a carbon heater. This entire assembly was placed in a cell filled with NaCl and was subjected to a high pressure of 4GPa and a varying temperature between 600 -1000°C using Belt-Type apparatus. The duration of these reactions was varied from 1-8 hr followed by quenching to room temperature. The detailed experimental procedure is mention in their paper[8].
At 900 °C, they obtained Mn11Ge8 while at 600-100 °C and 4GPa, two new phases were observed which had mixed phases of Mn11Si19 type and FeSi type structures. At 800 °C and 4 GPa for 8 hr, they obtained single phase containing Mn11Si19 structure type along with some residual germanium. The structure type was determined by leaching out the residual germanium using HNO3 solution. X-ray powder diffraction analysis was performed on the obtained sample and the data is shown in the below Table 2. The analytical results they obtained were in good agreement with the calculated values for the chemical formula Mn3Ge5 as shown in Table 3 below and the crystallographic parameters of this is shown in Table 4
Thermal analysis of Mn3Ge5 was performed along with the study of temperature dependence of electrical resistivity and thermoelectric power as shown in Figures 5 and 6. They found that the compound Mn3Ge5 was stable up to 300 °C, between 300-350 °C it decomposed to MnGe, Mn11Ge8 and Ge under atmospheric pressure.
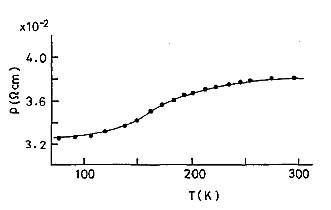
Figure 10 Temperature dependence of electrical resistivity of Mn3Ge5[8] |
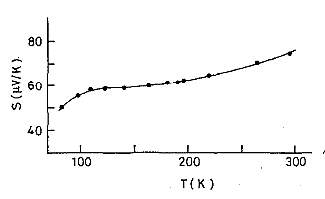
Figure 11 Temperature dependence of thermoelectric power of Mn3Ge5[8] |
They observed that the electrical resistivity increases with increasing temperature in the range of 80-200K and was almost constant above 200K. Over the range of 80-300K, 50-70 μV/K thermoelectric power was observed with a positive sign which was relatively large. From these results, they concluded that the Mn3Ge5 compound is a p-type degenerate semiconductor or a semimetal.
Table 2 X-Ray powder diffraction data of Mn3Ge5[8]
|
Table 3 Chemical compositions of Mn3Ge5[8]
|
|||||||||||||||||||||||||||||||||||||||||||||||||||||||||||||||||||||||||||||||||||||||||||||||||||||||||||||||||||||||||||||||||||||||||||||||||||||||||||||||||||||||||||||||||||||||||||||||||||||||||||||||||||||||||||||||||||||||||||||||||||||||||||||||||||||||||||||||||||||||||||||||||||||||||||
Table 4 Crystallographic parameters of Mn3Ge5[8]
|
||||||||||||||||||||||||||||||||||||||||||||||||||||||||||||||||||||||||||||||||||||||||||||||||||||||||||||||||||||||||||||||||||||||||||||||||||||||||||||||||||||||||||||||||||||||||||||||||||||||||||||||||||||||||||||||||||||||||||||||||||||||||||||||||||||||||||||||||||||||||||||||||||||||||||||
In 1988, H. Takizawa et. al. [9] synthesized another metastable MnGe phase alongside CoGe both with the cubic B20 structure using High-pressure synthesis technique. In this synthesis, a blend of Manganese and cobalt powders with >99.9% purity and germanium powder >99.99% purity was prepared with desirable molar ratios and pellets were formed out of them at room temperature using agate mortar, by uniaxially pressing at 100MPa. The pellets of Mn-Ge so obtained were subjected to similar High pressure and temperature treatment as explained above[8] (Synthesis of Mn3Ge5) with pressure varying between 4-5.5 GPa and between 600-1000 °C for 1-3 hr. Before releasing the applied pressure, the samples were quenched to room temperature.
X-ray powder diffraction was performed on the obtained sample to determine the phases obtained and least squares method was used to determine the lattice parameters. The diffraction data is mentioned in Table 5. All the diffraction patterns were indexed as FeSi structure type cubic B20 structure and the lattice constant of a=0.4795nm was determined from calculations.
Table 5 X-ray powder diffraction data of MnGe
| h | k | l | d-2obs. | d-2calc. | Iobs. | Icalc.a | ||||
| (nm-2) | (nm-2) | |||||||||
| 1 | 1 | 0 | 8.7 | 8.699 | vw | 0.9 | ||||
| 1 | 1 | 1 | 13.04 | 13.048 | m | 7.7 | ||||
| 2 | 0 | 0 | 17.4 | 17.397 | m | 5.2 | ||||
| 2 | 1 | 0 | 21.73 | 21.746 | vs | 100 | ||||
| 2 | 1 | 1 | 26.11 | 26.096 | s | 26.5 | ||||
| 2 | 2 | 0 | – | 34.794 | – | 0.3 | ||||
| 2 | 2 | 1 | 39.16 | 39.144 | w | 3.3 | ||||
| 3 | 1 | 0 | 43.51 | 43.493 | vw | 0.2 | ||||
| 3 | 1 | 1 | 47.83 | 47.842 | w | 4.8 | ||||
| 2 | 2 | 2 | – | 52.192 | – | 0.005 | ||||
| 3 | 2 | 0 | 56.53 | 56.541 | vw | 0.7 | ||||
| 3 | 2 | 1 | 60.94 | 60.891 | m | 3 | ||||
| 4 | 0 | 0 | 69.56 | 69.589 | vw | 3.9 |
a intensities were calculated using the u parameter of 0.14 for Mn and 0.845 for Ge
Based on thermal analysis on the sample, they determined that MnGe is metastable at room temperature and by annealing at 600 °C, it decomposed to Mn11Ge8 and Ge. The temperature dependence of electrical resistivity and thermoelectric power were studied using suitable setups between 80-300K and the results are as shown in Figures 9 and 10.
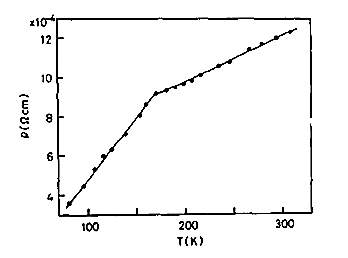
Figure 12 Temperature dependence of electrical resistivity of MnGe[9] |
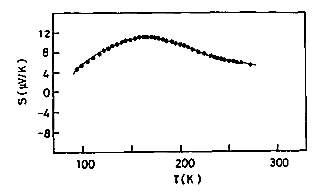
Figure 13 Temperature dependence of thermoelectric power of MnGe[9] |
The electrical resistivity increased linearly up to 170K which is an indication of metallic behavior. The slope change was observed at 170K in resistivity vs temperature curve at which the thermoelectric power was observed to be maximum. Magnetic susceptibility measurements with varying temperature between 80-300K were carried out and the results are shown in figure 11. The results indicated that MnGe is antiferromagnetic with Kneel temperature of 197K.
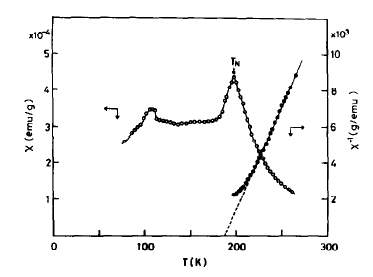
Figure 14 Temperature dependence of magnetic susceptibility and reciprocal magnetic susceptibility of MnGe[9]
ꭓg obeyed Curie-Wiess type relation of Mꭓg = Mꭓp + C/(T-θp), In the paramagnetic region of the curve. The Pauli paramagnetic susceptibility was calculated to be 2.17*10-6 emu/g at paramagnetic Curie temperature, θp of 187 K with Curie constant, C of 1.138 emu. K/mol. The larger θp value indicated that Mn-Mn ferromagnetic exchange interactions exist in MnGe, the first nearest magnetic exchange interactions. They mentioned that the small hump in magnetic susceptibility curve could be due to a small amount of impurities which X-ray powder diffraction could not detect.
The pellets of Co-Ge were subjected to a high pressure of 4Gpa and temperature between 800-1000 °C for 1-3 hr to obtain CoGe phase. The lattice constant was calculated to be a = 0.4631 nm and was in good agreement with the one reported previously by Larchev and Popova[31]. The CoGe high-pressure phase obtained with cubic B20 structure was metastable at room temperature and pressure and transformed to stable monoclinic phase by annealing to 600 C in an evacuated silica tube. The electric resistivity, thermoelectric power, and magnetic susceptibility measurements were performed on the cubic B20 structure type CoGe over the range of 80-300K and the results are shown in the Figures 12, 13 and 14.
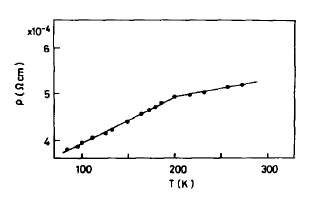
Figure 15 Temperature dependence of electrical resistivity of CoGe with B20 structure[9] |
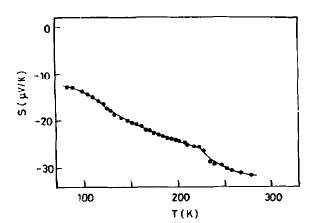
Figure 16 Temperature defence of thermoelectric power of CoGe with B20 structure[9] |
Monoclinic CoGe phase showed metallic behavior with an electrical resistivity of 5.1*10-5 Ω cm at 80K and 1.6*10-4 Ω cm at 300K. It was observed that the cubic B20 structure type CoGe although showed metallic behavior, had noticeably higher electrical resistivity than the monoclinic phase and the the thermoelectric power relatively larger. Similar to MnGe, the change in slope was observed in resistivity curve at ~200K at which an anomolous change in thermoelectric power was observed.
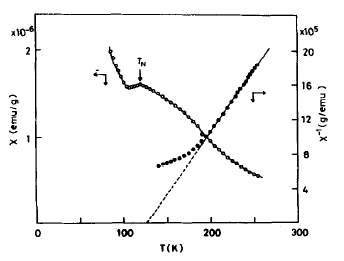
Figure 17 Temperature defence of magnetic susceptibility and reciprocal of magnetic susceptibility of CoGe with B20 structure[9] |
The magnetic suceptability curved showed that the high pressure B20 type CoGe phase was antiferromagnetic with neel temperature of 120K. Also, the material showed Pauli paramagnetism with magnetic susceptibility of 1.3*10-6 emu/g. At elevated temperatures, ꭓg obeyed Curie-Wiess type relation with paramagnetic susceptibility of 1.02*10-7 emu/g, C = 0.0082 emu. K/mol and θp of 132 K. They concluded from this value of θp that ferromagnetic exchange interactions are dominant similar to MnGe. In the paramagnetic region, below 200K the deviation from Curie-Wiess law was overserved which is where the anomalous change in electrical resistivity and thermoelectric power was observed.
The 3d-electrons in intermetallic compounds show essentially itinerant character. The spin fluctuation in the narrow d-band plays an important role on magnetic and transport behaviours[ ][32]. The spin fluctuation observed in weakly ferromagnetic or nearly ferromagnetic metals is small and variable but in a localized moment system, it is large and fixed [ ] [ ]. The 3d-electrons in the B20 monogermanides are expected to have localized character and larger amplitude of spin fluctuation as the large distances between the metal atoms increase the localization of 3-d electrons. Moriya [ ] reported cases where the spin fluctuation is highly dependent on temperature and reaches saturation at a finite temperature. Above this point, spin fluctuation is considered as a set of local moments in Heisenberg model. The anomalies found above in magnetic behaviours of MnGe and CoGe were considered to be the effect of “temperature-induced local moment” (TILM) model. From the magnetic susceptibility measurements of CoGe, the saturation point is considered to be at 200K as the change in transport behaviours occur at this point. In case of MnGe, this occurred at 170K which was observed from change in resistivity and thermoelectric power measurements.
The effective moment of MnGe and CoGe along with CrGe6 and FeGe6 values reported previously are shown in Figure 15.
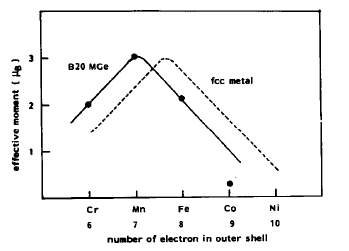
Figure 18 Effective moment per first rom transition metal atom as a function of the number of electron in outer shell of B20 germanides.[9] |
From the figure above, they concluded that the effective moments of B20 mono germanides changed by 1µB in the series CrGe-MnGe-FeGe like the fcc metals represented with dotted line in Figure 15. Also, the value of CoGe is smaller compared to other mono germanides. The plot shows the shift of B20 germanides from the fcc metals, to the left and this shift magnitude is equivalent to 0.7 d-electron. This indicated that each Germanium atom donated 0.7 electron to the d-band of the transition metal.
The antiferromagnetic MnGe and CoGe are considered to have helical spin structure as all the B20 compounds are reported to have helical magnetic structure [ ] [ ] [ ] [ ] due toDzyaloshinsky-Moriya interaction as the B20 structure is noncentrosymmetric [ ][ ].
It is known that the magnetic interaction in alloys or intermetallics containing Mn is closely related to nearest Mn-Mn distance. The nearest Mn-Mn distance in MnGe was found to be 0.294 nm. They concluded that this long distance of 0.294 nm and the increase in number of electrons in 3d obtained from germanium atom might lead to ferromagnetic exchange interaction between Mn atoms in MnGe with B20 structure.
MOTIVATION
In the recent years, the growth in powder metallurgy (PM) has been tremendous as there is very less wastage i.e. ~97% of the starting powders are converted to Product. Also, the ability and the ease of formation to net Shape or near net shape using powders has led to increasing demand for the requirement of materials in a powder state. Mechanical Milling/Alloying is one such technique that allows us to obtain materials in powders up to nanoscale. Most intermetallic and metastable compounds that couldn’t be synthesized using other methods were synthesized using mechanical alloying.
Other techniques although can produce intermetallic compounds, their yield compared to MA is very less as in this case all the elemental powders that go in, comes out as a compound with the loss of very small amount due to powder going into vial walls and milling media (Balls) surface.
EXPERIMENTAL PROCEDURE
A blend of powders of (99.99% pure Mn and 99.999% pure Ge) / (With _____% oxygen contamination) were taken with the composition close to the stoichiometric ratio of the desired alloy i.e. Mn-50 at. % Ge and were alloyed in a SPEX 8000D, high energy ball mill. To help prevent welding of balls due to high impacts and to prevent cold welding between powder particles and the wall, a small amount of stearic acid ~2wt% was added. Each sample (as shown in Figure representing XRD of all the as-prepared samples) is a result of continuous alloying* without any intermediate disturbance and hence multiple alloying runs were performed. For each alloying run, 5g of blended powder, ~41g equivalent of stainless steel balls were chosen to maintain ball to powder ratio of 8:1 along with ~2wt% stearic acid as a process control agent. These powders along with balls are loaded into a SPEX 8007 stainless steel vial, filling about 20% to 30% of the vial space, leaving ~70% empty space for the milling/Alloying process to be effective. The vial is sealed tight inside the glove box filled with Argon and at~0.0% Oxygen to prevent oxidation during milling.
Milling was performed in intervals such that the powder undergoes 3 hrs of continuous blasting and ~30 minutes of cooling in air. This not only helps the vial and the powders to cooldown but also reduces the load on the Mill. The temperature of the vial was noted after every 3 hrs of continuous milling. Samples were removed after a certain time and a detailed analysis was performed on each sample to study the phase evolution, particle size distribution and the changes in magnetic properties as the phases changed/evolved. All sample handling was performed under inert atmosphere i.e. inside a glove box filled with Argon and ~0.0% Oxygen. The process control agent was added only before the start of each milling runs, (no intermediate addition of stearic acid was performed.)
Each sample obtained after continuous milling was characterized using Rigaku-Miniflex600 X-Ray diffractometer, Philips XL30 SEM and Quantum Design’s Vibrating Sample Magnetometer. A detailed analysis was performed using software’s JADE, EDAX, and Image-J.
Other methods such as removing small amount of sample at intermediate stages inside the glove box to perform X-ray diffraction and to study the phase evolution during the process can be implemented. But once the analysis is done, the sample must be kept back into the vial in order to continue milling so that the ball to powder ratio remains constant. Although this might not affect the process, there is a chance that the small amount that has been exposed to air might get oxidised and might ruin the entire sample when placed back in the vial. To prevent this, entire sample was removed after the milling was complete, was analysed thoroughly and then stored in the glovebox.
From the literature on mechanical milling/alloying, it was noticed that the milling media (balls) and the powders get cold welded with themselves and the walls of the vial after a certain period of milling/alloying as the effectiveness of the process control agent (PCA) keeps detoriating with increasing milling time. As a result, the effectiveness of the milling/alloying decreases. In the present scenario, it was observed that the temperature of the outside wall of the vial decreased drastically at = >15 hr of continuous milling.
RESULTS
MnGe:
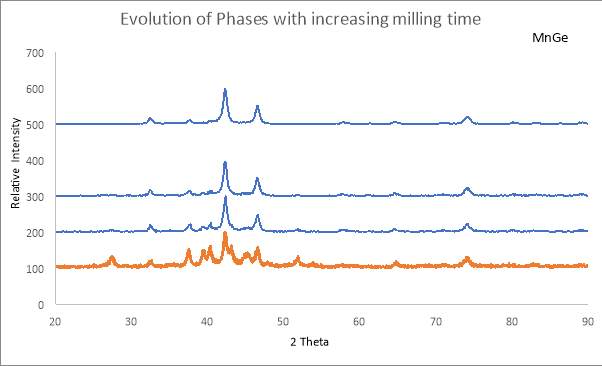
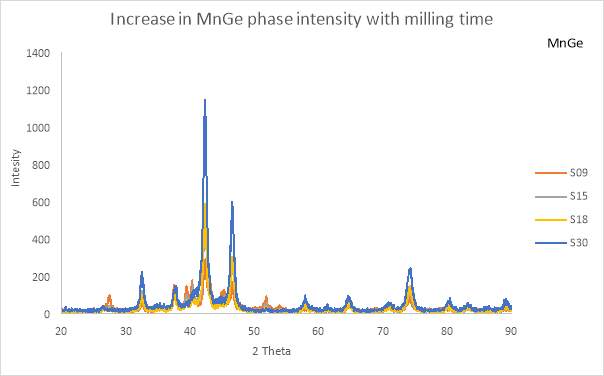
Table 8 Lattice parameters obtained using least squares/ Cohen’s method
| 2 Theta | h | k | l | a | ||
| 32.58 | 1 | 1 | 1 | 4.756491927 | ||
| 37.86 | 2 | 0 | 0 | 4.756491927 | ||
| 42.24 | 2 | 1 | 0 | 4.756491927 | ||
| 46.58 | 2 | 1 | 1 | 4.756491927 | ||
| 58.14 | 2 | 2 | 1 | 4.756491927 | ||
| 64.9 | 3 | 1 | 1 | 4.756491927 | ||
| 71.34 | 3 | 2 | 0 | 4.756491927 | ||
| 74.32 | 3 | 2 | 1 | 4.756491927 | ||
| 80.56 | 4 | 0 | 0 | 4.756491927 | ||
| 83.48 | 4 | 1 | 0 | 4.756491927 | ||
| 89.54 | 3 | 3 | 1 | 4.756491927 |
Table 9 Mechanical alloying parameters

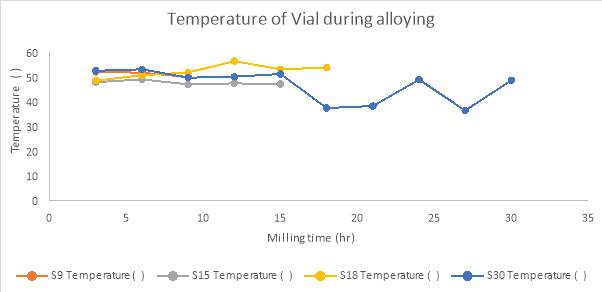
Figure 19 Temperature variation in samples after every 3hr of continuous alloying
REFERENCES
[1] H. Ohno, “Making Nonmagnetic Semiconductors Ferromagnetic,” Science (80-. )., vol. 281, no. 5379, p. 951 LP-956, Aug. 1998.
[2] Y. D. Park et al., “A Group-IV Ferromagnetic Semiconductor: MnxGe1-x,” Science (80-. )., vol. 295, no. 5555, pp. 651–654, 2002.
[3] S. Ahlers et al., “Magnetic and structural properties of GexMn1-x films: Precipitation of intermetallic nanomagnets,” Phys. Rev. B, vol. 74, no. 21, p. 214411, Dec. 2006.
[4] C. Bihler et al., “Structural and magnetic properties of Mn5Ge3 clusters in a dilute magnetic germanium matrix,” Appl. Phys. Lett., vol. 88, no. 11, p. 112506, Mar. 2006.
[5] D. Bougeard, S. Ahlers, A. Trampert, N. Sircar, and G. Abstreiter, “Clustering in a Precipitate-Free GeMn Magnetic Semiconductor,” Phys. Rev. Lett., vol. 97, no. 23, p. 237202, Dec. 2006.
[6] T. Devillers et al., “Structure and magnetism of self-organized Ge1-xMnx nanocolumns on Ge(001),” Phys. Rev. B, vol. 76, no. 20, p. 205306, Nov. 2007.
[7] M. Jamet et al., “High-Curie-temperature ferromagnetism in self-organized Ge1-xMnx nanocolumns,” Nat Mater, vol. 5, no. 8, pp. 653–659, Aug. 2006.
[8] H. Takizawa, T. Sato, T. Endo, and M. Shimada, “High-pressure synthesis and electrical properties of Mn3Ge5 with Mn11Si19-type structure,” J. Solid State Chem., vol. 68, no. 2, pp. 234–238, Jun. 1987.
[9] H. Takizawa, T. Sato, T. Endo, and M. Shimada, “High-pressure synthesis and electrical and magnetic properties of MnGe and CoGe with the cubic B20 structure,” J. Solid State Chem., vol. 73, no. 1, pp. 40–46, 1988.
[10] H. Takizawa, T. Sato, T. Endo, and M. Shimada, “High pressure synthesis and electrical and magnetic properties of MnGe4 and CoGe4,” J. Solid State Chem., vol. 88, no. 2, pp. 384–390, 1990.
[11] A. V Tsvyashchenko et al., “High Pressure Synthesis and Magnetic Properties of Cubic B20 MnGe and CoGe,” Solid State Phenom., vol. 190, pp. 225–228, 2012.
[12] A. S. Ahmed, B. D. Esser, J. Rowland, D. W. McComb, and R. K. Kawakami, “Molecular beam epitaxy growth of [CrGe/MnGe/FeGe] superlattices: Toward artificial B20 skyrmion materials with tunable interactions,” J. Cryst. Growth, vol. 467, pp. 38–46, Jun. 2017.
[13] R. Tsuchida, J. T. Asubar, Y. Jinbo, and N. Uchitomi, “MBE growth and properties of GeMn thin films on (001) GaAs,” J. Cryst. Growth, vol. 311, no. 3, pp. 937–940, 2009.
[14] S. Cho et al., “Ferromagnetism in Mn-doped Ge,” Phys. Rev. B, vol. 66, no. 3, p. 33303, Jul. 2002.
[15] M. M. Moshksar and M. Mirzaee, “Formation of NiAl intermetallic by gradual and explosive exothermic reaction mechanism during ball milling,” Intermetallics, vol. 12, no. 12, pp. 1361–1366, 2004.
[16] S. Yoon, S. J. Choi, and Y. S. Kwon, “Synthesis of MnBi intermetallic compounds by mechanical alloying method,” Proceedings. The 8th Russian-Korean International Symposium on Science and Technology, 2004. KORUS 2004., vol. 3. pp. 149–151 vol. 3, 2004.
[17] D. Panda, P. Bhuyan, L. Kumar, and S. N. Alam, “Synthesis of Fe 3 Al Intermetallic Compound by Mechanical Alloying,” Arab. J. Sci. Eng., pp. 1–11, 2017.
[18] K. Kobayashi and K. Miwa, “Synthesis of Ti, Mo and W Silicide Intermetallic Compounds by Mechanical Alloying,” J. Japan Soc. Powder Powder Metall., vol. 42, no. 1, pp. 103–107, 1995.
[19] A. A. Al-Joubori and C. Suryanarayana, “Synthesis of metastable NiGe2 by mechanical alloying,” Mater. Des., vol. 87, pp. 520–526, 2015.
[20] C. Suryanarayana, “Mechanical alloying and milling,” Prog. Mater. Sci., vol. 46, no. 1, pp. 1–184, 2001.
[21] D. Turnbull, “Metastable structures in metallurgy,” Metall. Trans. A, vol. 12, no. 5, pp. 695–708, 1981.
[22] F. H. (Sam)Froes, C. Suryanarayana, K. Russell, and C.-G. Li, “Synthesis of intermetallics by mechanical alloying,” Mater. Sci. Eng. A, vol. 192–193, pp. 612–623, Feb. 1995.
[23] A. . Bhattacharya and E. Arzt, “Temperature rise during mechanical alloying,” Scr. Metall. Mater., vol. 27, no. 6, pp. 749–754, Sep. 1992.
[24] H. Zoz, D. Ernst, and R. Reichardt, “High Energy Milling/Mechanical Alloying/Reactive Milling,” in 3rd International Symposium of the school of chemical engineering, University of Mexico City, 1998.
[25] F. Yuan, S. Forbes, K. K. Ramachandran, and Y. Mozharivskyj, “Structure and physical properties of Cr5B3-type Ta5Si3 and Ta5Ge3,” J. Alloys Compd., vol. 650, pp. 712–717, 2015.
[26] E. Arras, D. Caliste, T. Deutsch, F. Lanifmmode mboxccelse çfion, and P. Pochet, “Phase diagram, structure, and magnetic properties of the Ge-Mn system: A first-principles study,” Phys. Rev. B, vol. 83, no. 17, p. 174103, May 2011.
[27] H. Fukuoka, S. Yamanaka, E. Matsuoka, and T. Takabatake, “High-Pressure Synthesis and Transport Properties of a New Binary Germanide, SrGe6-δ (δ ≅ 0.5), with a Cagelike Structure,” Inorg. Chem., vol. 44, no. 5, pp. 1460–1465, Mar. 2005.
[28] I. Mayer, I. Shidlovsky, and E. Yanir, “Low-temperature synthesis of metallic silicides and germanides by an amalgam method,” J. Less Common Met., vol. 12, no. 1, pp. 46–50, Jan. 1967.
[29] V. M. Agoshkov, V. D. Gorbatenkov, S. V. Popova, and L. N. Fomicheva, “Crystallization of MoGe2 and WGe2 at high pressure and some properties of these phases,” J. Less-Common Met., vol. 78, no. 2, pp. 235–243, Apr. 1981.
[30] A. Berche, J. C. Tedenac, and P. Jund, “Thermodynamic modeling of the germanium–manganese system,” Intermetallics, vol. 47, pp. 23–30, Apr. 2014.
[31] V. I. Larchev and S. V. Popova, “The polymorphism of transition metal monogermanides at high pressures and temperatures,” J. Less Common Met., vol. 87, no. 1, pp. 53–57, Sep. 1982.
[32] M. Richardson, “The partial equilibrium diagram of the Fe-Ge system in the range 40–72 at.% Ge, and the crystallisation of some iron germanides by chemical transport reactions,” Acta Chem. Scand, vol. 21, no. 9, 1967.
Cite This Work
To export a reference to this article please select a referencing stye below:
Related Services
View allRelated Content
All TagsContent relating to: "Electronics"
Electronics regards the science and technology involved in the development of electrical circuits and electronic devices and equipment that use them.
Related Articles
DMCA / Removal Request
If you are the original writer of this dissertation and no longer wish to have your work published on the UKDiss.com website then please:


