The Effectiveness of Current Flood Defences in the UK
Info: 9022 words (36 pages) Dissertation
Published: 4th Jan 2022
ABSTRACT
This literature review will examine literature relating to the 2015 Cumbria flood event and other high-risk flood areas in the UK. This is in preparation for the final dissertation discussion on ‘the effectiveness of current flood defences in the UK’, whereby the proposed methodology for which is also contained within this report.
Table of Contents
Click to expand Table of Contents
INTRODUCTION
LITERATURE REVIEW
1 STORM DESMOND
1.1 Overview
1.2 Eden catchment area
1.3 Cumbria Flood Defence Mechanisms
1.3.1 Effectiveness of Flood Defences in Cockermouth
1.3.2 Effectiveness of Flood Defences in Keswick
2 THAMES FLOOD BARRIER (1982)
2.1 Overview
2.2 Success of the Thames Barrier
3 FLOODING IN GLOUCESTERSHIRE (2007)
3.1 Overview
3.1.1 Gloucestershire Flood Facts
3.2 Impacts of Flooding in Gloucestershire
3.2.1 Impacts of Mythe Water Treatment Plant Closure
3.2.2 Impacts on Additional Water Treatment Works
3.3 Flood Defence Mechanisms
4 SANDWICH TOWN TIDAL DEFENCE SCHEME (2008)
4.1 Overview
4.2 Success of the Tidal Defences
PROPOSED METHODOLOGY
APPENDICES
List of Figures
Figure 1 – Rainfall & Wind Speed in Worst Hit Areas – Storm Desmond
Figure 2: Map of Cumbria
Figure 3: Eden Catchment Area
Figure 4: Eden catchment area locations and number of properties at risk of flooding
Figure 5: Extent of Flooding in Keswick on 5th & 6th December 2015
Figure 6: Diagram of the Thames Barrier
Figure 7: Positioning of the Thames Flood Barrier
Figure 8: Thames Barrier closures during flood season in years 1982-2017
Figure 9: Simulation of London Flooding when no barrier present
Figure 10: Thames Barrier Closed
Figure 11: Map – Gloucestershire
Figure 12: Affected areas in Gloucestershire floods, 2007
Figure 13: Photograph view south from above Tewkesbury
Figure 14: Map – Mythe Water Treatment Works, Tewkesbury
Figure 15: Aerial photograph: Mythe WTW site under water
Figure 16: Mythe Water Treatment Works flooding
Figure 17: Flood defences holding back the River Severn at Deerhurst
Figure 18: Sandwich Town, Kent
Figure 19: Sandwich Town, Kent located on UK map
Figure 20: Flood warning areas in and around Sandwich
Figure 21: Location of Stonar Cut
Figure 22: Aerial view of Stonar Cut
Figure 23: Aerial view of Stonar Cut: sluice gates
Figure 24: Sluice flood gates at Stonar Cut
Figure 25: The Sluice at Sonar Cut
List of Tables
Table 1: HadUKP Data: Seasonal rainfall figures between 1982-2016
Table 2: Areas and properties affected in 2007
List of Appendices
APPENDIX 1: Flooding and Flood Defence in Sandwich Town, Kent………………….38
APPENDIX 2: Rainfall 67-day average running totals 11 Dec 2013 to 15 February 2015 % of Winter 1981-2010 average……39
APPENDIX 3: Looking inside the Thames Barrier………………………………40
INTRODUCTION
Naturally occurring floods can be difficult to prevent, however, effective control is required to significantly reduce the impacts socially, economically and environmentally. Flooding can lead to extensive damage to property, business and also result in loss of life, therefore the requirement for better flood defences in the UK is rapidly becoming a necessity with the growing population and notable changes in climate in recent years (Smart Flood Protection, 2014).
Focussing mainly on the flood-related impacts caused by Storm Desmond in Cumbria, 2015, this literature review will examine information relating to the effectiveness of current flood defences in the UK. The aim is to achieve a better understanding of current flood defence systems and evaluate how in the future, the engineering of smarter flood defence systems might reduce the negative impacts of flooding in the UK.
Using academic journals and other online resources, this review will look at other areas susceptible to flooding and consider different flood defence systems currently in place or those being improved. More specifically, there will be an examination of;
- The Thames flood barrier in London,
- 2007 flooding in Gloucestershire, and
- the Sandwich Town tidal defence scheme.
This research will highlight the differences between various flood defence systems and will link these to the individual risks of flooding in their specific areas. This will also allow for the comparison of smarter flood defence systems and how their operation contributes to minimising the impacts when there is a high risk of major flooding.
LITERATURE REVIEW
1 STORM DESMOND
1.1 Overview
Bringing extreme gales of wind with gusts reaching 81 mph in December 2015, Storm Desmond brought devastation to many areas and thousands more homes, particularly across the north of England.
Cumbria was considered one of the worst hit areas, suffering the most significant impacts of the storm. In just 38 hours, 405mm of rainfall was recorded in Thirlmere between the 4th and 6th December 2015 (Met Office, 2015a). Three previous named storms in the same season and more than double the expected rainfall in the previous month were recorded. This resulted in the already highly-saturated ground adding to the effects of the record-breaking rainfall, which caused severe flooding and major disruption to thousands of people over the following days, weeks and months (Met Office, 2015a).
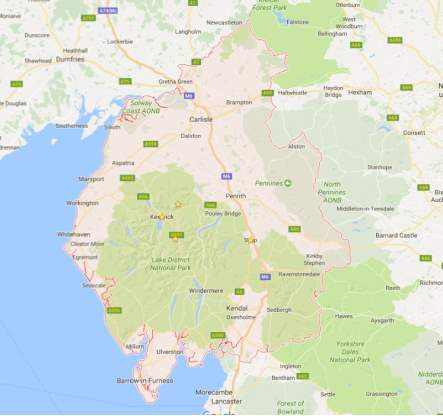
Reported by Tonkin and Glanfield (2015), within days of the initial rainfall, flooding and disruption continued to affect power to around 5,000 homes and the impacts of the storm brought disruption to local schools, hospitals and transport networks in the flooded areas. The flooding was described to be the worst impact of the storm with many businesses and homes being affected. The 1764 Pooley Bridge in Ullswater [Figure 2] was swept away along with several other bridges and directly because of the flooding, were two fatalities (Met Office, 2015b).
As recorded by the Met Office (2015a), Figure 1 shows the levels of rainfall and high wind speeds across the north of England recorded during this period, and Figure 2 marks the four areas situated in Cumbria that received the highest levels of rainfall in 48 hours.
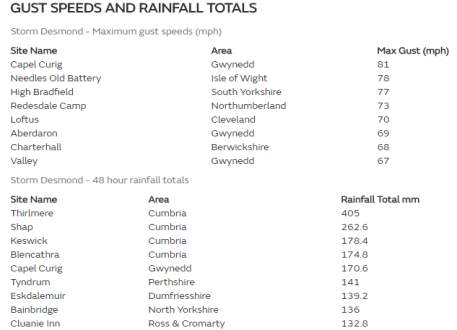
Figure 1 – Rainfall & Wind Speed in Worst Hit Areas – Storm Desmond (Met Office, 2015a)
- Keswick
- Blencathra
- Thirlmere
- Shap
- Pooley Bridge
Figure 2: Map of Cumbria (Google, 2017a)
1.2 Eden catchment area
According to a number of newspaper reports, £45 billion had been previously spent on flood defence schemes since similar flooding occurred in Cumbria in the year 2005.
Reporting for the Express [Online], Heffer (2015) quotes the Environment Secretary as claiming up to 8000 homes had been saved by the flood defences in the north of England during Storm Desmond, despite allegations made against the Government that many promises to improve flood defences since 2005 had been “shelved”.
Reviewing the details of the flood defence management plans made since the major flooding occurred in 2005, a Government publication by the Environment Agency (2009) covers principal watercourses in the 2400 km² Eden catchment area. These watercourses include the rivers Eden, Eamont, Irthing, Petteril and Caldew and the publication summarises flood management plans for the next fifty to one hundred years.
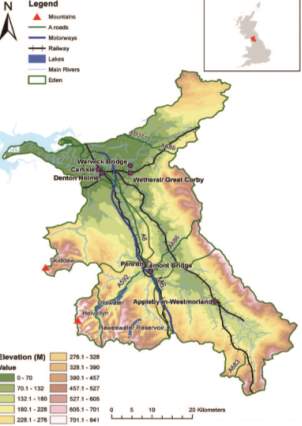
Figure 3: Eden Catchment Area (Environment Agency, 2009)
There have been several recorded historical flooding events categorised as severe within the Eden catchment area leading up to 2005 and beyond. Shown in Figure 3, the main source of flooding comes from fluvial or river flooding, namely that arising from the River Eden itself.
The River Eden has a steep middle course, contributing to flooding in the areas of Appleby, Wetheral and Warwick Bridge. This is in addition to tributary inflows influencing the River Eden’s wide floodplain in Carlisle, and tributaries contributing to the vulnerability of flooding in Penrith and Eamont Bridge (Environment Agency, 2009).
There are over 4500 properties and 1000 commercial properties all situated within the Eden catchment area that are at a 1% risk of flooding in any one year. This also includes such critical infrastructure as electricity sub stations, waste water treatment works, schools and medical centres (Environment Agency, 2009).
Figure 4 shows the areas and number of properties specified as being at a 1% risk of flooding in any one year in the Eden Catchment area.
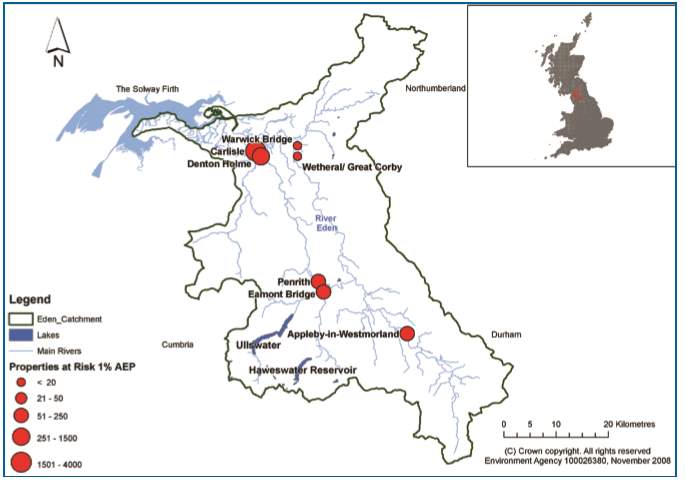
Figure 4: Eden catchment area locations and number of properties at risk of flooding (Environment Agency, 2008)
1.3 Cumbria Flood Defence Mechanisms
The Cumbria floods of 2005 had an annual exceedance probability (AEP) of around 1.33%, and impacted areas across the county. For example, in Keswick, flooding from the River Greta caused the failure of a pumping station at Greta Grove, which in turn resulted in sewage and surface water flooding to many homes in the area (Shah and McCall, 2016).
In Keswick during the flood events of 2009,
In 2009, Cockermouth in Cumbria was affected by flooding. Permission was then granted by Allerdale Borough Council in 2012 for the Environment Agency to improve flood defences in the area, which would include various embankments, walls and flood gates along Rivers Cocker and Derwent (Anonymous, 2012).
1.3.1 Effectiveness of Flood Defences in Cockermouth
Cockermouth has suffered the impacts from frequent floods, therefore in recent years, the response has been to build bigger and more effective defences.
In the last 18 years, there have been three major flood defence schemes initiated in Cockermouth, with each defence mechanism upgraded and added to the last. There are now walls, gates, glass panels, waterproof windows on houses and businesses and more significantly, a self-raising barrier, which is considered the first of its kind in the UK (UK Flood Barriers, 2015).
The self-raising barrier along the River Cocker upgraded a wall built in 1999 which had proved inadequate in 2009. It was tested in December 2015, when it was necessary for the barriers to be fully activated, protecting the houses situated behind from flooding. However, as a result, the water continued downstream causing flooding elsewhere (UK Flood Barriers, 2015).
In December 2015, many homes and businesses were protected on one side of the river Cocker, however the community on the other side was impacted by flooding. According to the Environment Agency (2016a), it is believed that the impacts were significantly less than those caused by the floods of 2009. The Environment Agency (2016a) also stated that in the previous month of November, the flood defences had proved their effectiveness in protecting Cockermouth from flooding numerous times.
1.3.2 Effectiveness of Flood Defences in Keswick
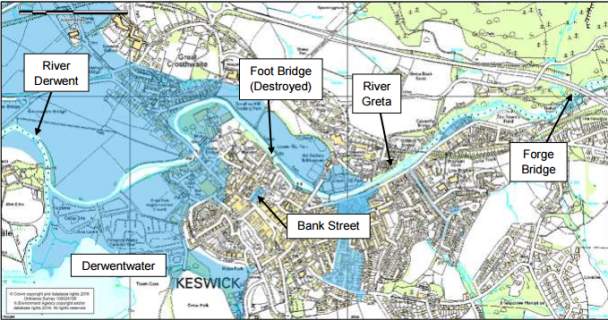
Figure 5: Extent of Flooding in Keswick on 5th & 6th December 2015 (Shah and McCall, 2016)
2 THAMES FLOOD BARRIER (1982)
2.1 Overview
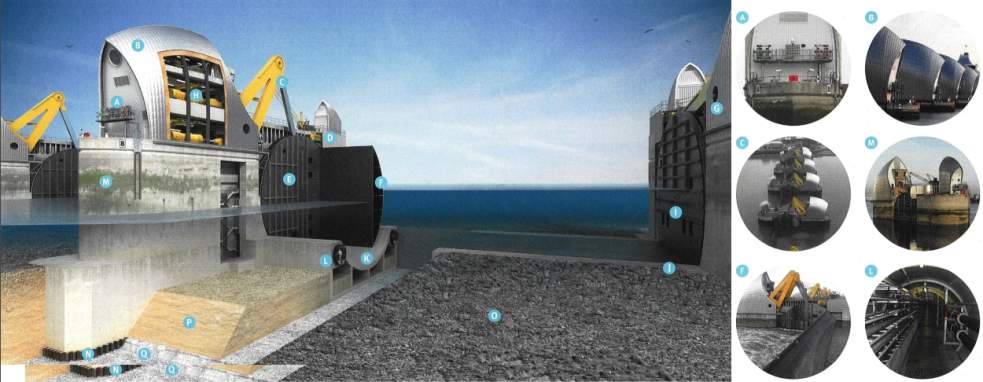
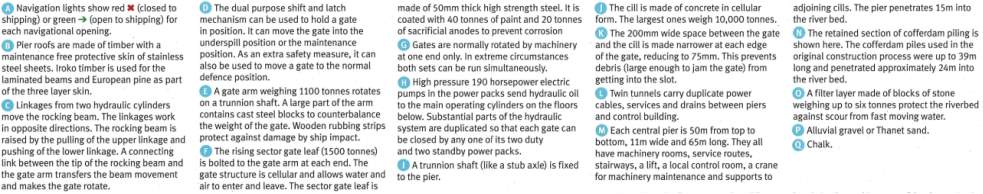
Opened in 1982, the movable ten-gate Thames Flood Barrier [Appendix 3] can be used to create a solid steel wall that holds back around 9,000 tonnes of water per gate when fully raised at a section across the River Thames in London. The call for an effective flood defence mechanism came after 307 people had lost their lives in the North Sea flood in 1953 (Environment Agency, 2014 and Zolfagharifard, 2014).
The flood barrier is made up of two different types of gate; the ‘Rising Sector Gates’ resting on the bed of the river, and the ‘Falling Radial Gates’ above the river, which are used to stop the upstream flow of the river from flooding the city. The flood gates are attached to cofferdam piles, which stand at a total of 39 metres tall, but penetrate 24 metres below the river bed, locking them in place (Environment Agency, 2014a and Zolfagharifard, 2014).
The flood protection mechanism works by controlling the flow of the river either by closing the flood gates individually, taking around 10 minutes each, or by closing all of the gates and raising the barrier to full height, completely blocking the flow and taking a total of an hour and a half. (Environment Agency, 2014b and Zolfagharifard, 2014).
Figure 6 shows a diagram of the Thames Barrier along with the size of the gates relative to the average height of a person and Figure 7 shows how the various positions of the gates can control the flow of the river.
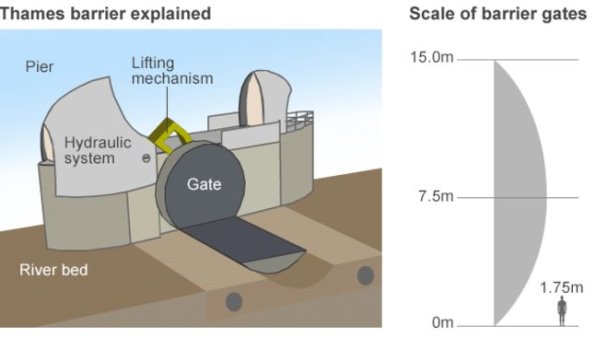
Figure 6: Diagram of the Thames Barrier (de Castella, 2014)
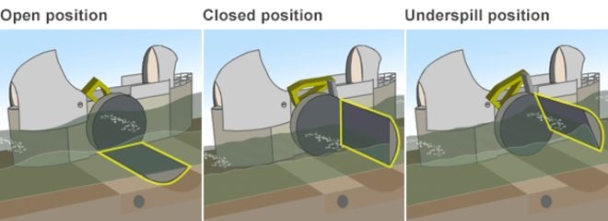
Figure 7: Positioning of the Thames Flood Barrier (de Castella, 2014)
2.2 Success of the Thames Barrier
The Thames Barrier has been largely successful thus far, whereby it has seen 176 successful closures between its first operations in 1982 and April 2016, covering either tidal flooding, fluvial flooding or a combination of both (Environment Agency, 2014b).
In recent years, the success of the barrier falls can be considered relative to climate change and increased rainfall. Table 1 shows the total annual recorded rainfall in south east England between the 1982, when the barrier opened, and 2016. In 2014, the total annual rainfall in the south east of England exceeded 1012 mm and the winter of 2013-14 was the wettest in at least 30 years when it received 450.8 mm of rainfall in those three months alone (Met Office, 2017).
Provided by the Environment Agency, Figure 7 demonstrates the number of barrier closures during flood season (April-September) from 1982 to February 2017 in graph format, enabling a clear view of how in recent years, the necessity to close the barrier more frequently has been critical to protecting the city of London.
| Year | Rainfall
Dec-Feb (mm) |
Rainfall Mar-May (mm) | Rainfall
Jun-Aug (mm) |
Rainfall
Sep-Nov (mm) |
Total Annual Rainfall
(mm) |
| 1982 | 162.2 | 156.0 | 174.1 | 308.1 | 803.0 |
| 1983 | 182.8 | 237.8 | 99.8 | 154.4 | 659.9 |
| 1984 | 222.9 | 156.3 | 92.5 | 275.3 | 750.7 |
| 1985 | 166.3 | 144.9 | 231.1 | 95.5 | 665.8 |
| 1986 | 229.8 | 192.2 | 170.8 | 217.8 | 796.6 |
| 1987 | 144.8 | 172.0 | 202.8 | 311.1 | 769.0 |
| 1988 | 211.1 | 159.7 | 162.4 | 138.7 | 661.8 |
| 1989 | 109.6 | 157.3 | 100.5 | 128.1 | 621.6 |
| 1990 | 364.8 | 58.1 | 105.5 | 159.1 | 603.9 |
| 1991 | 186.4 | 122.6 | 200.9 | 163.8 | 633.8 |
| 1992 | 72.7 | 177.6 | 217.3 | 302.0 | 806.0 |
| 1993 | 153.6 | 170.5 | 152.7 | 296.7 | 851.1 |
| 1994 | 312.0 | 207.4 | 120.3 | 248.2 | 853.6 |
| 1995 | 335.1 | 103.3 | 56.4 | 221.3 | 711.8 |
| 1996 | 222.4 | 109.7 | 124.0 | 197.4 | 582.8 |
| 1997 | 122.8 | 75.5 | 215.2 | 173.8 | 638.3 |
| 1998 | 168.4 | 181.2 | 142.6 | 306.8 | 801.7 |
| 1999 | 202.1 | 132.6 | 214.6 | 209.6 | 789.8 |
| 2000 | 211.3 | 274.0 | 115.5 | 418.6 | 1020.6 |
| 2001 | 296.1 | 230.3 | 160.7 | 246.1 | 848.2 |
| 2002 | 173.7 | 165.9 | 170.8 | 301.3 | 923.8 |
| 2003 | 245.0 | 106.5 | 112.1 | 206.4 | 607.0 |
| 2004 | 190.3 | 171.0 | 184.9 | 181.1 | 708.9 |
| 2005 | 111.3 | 123.5 | 142.9 | 190.0 | 572.3 |
| 2006 | 141.6 | 192.7 | 121.4 | 247.9 | 727.6 |
| 2007 | 265.4 | 168.5 | 253.3 | 155.9 | 812.9 |
| 2008 | 180.4 | 254.0 | 179.7 | 224.0 | 819.0 |
| 2009 | 198.1 | 111.2 | 146.3 | 266.2 | 790.3 |
| 2010 | 272.6 | 108.8 | 171.2 | 191.4 | 665.7 |
| 2011 | 185.5 | 46.0 | 208.4 | 109.4 | 611.7 |
| 2012 | 161.3 | 199.5 | 275.6 | 267.2 | 950.7 |
| 2013 | 241.0 | 162.6 | 104.9 | 268.8 | 777.0 |
| 2014 | 450.8 | 185.2 | 201.2 | 257.6 | 1012.0 |
| 2015 | 204.9 | 111.2 | 200.4 | 192.6 | 723.5 |
| 2016 | 233.4 | 196.6 | 167.0 | 170.0 | 714.3 |
Table 1: HadUKP Data: Seasonal rainfall figures between 1982-2016 (Met Office, 2017)
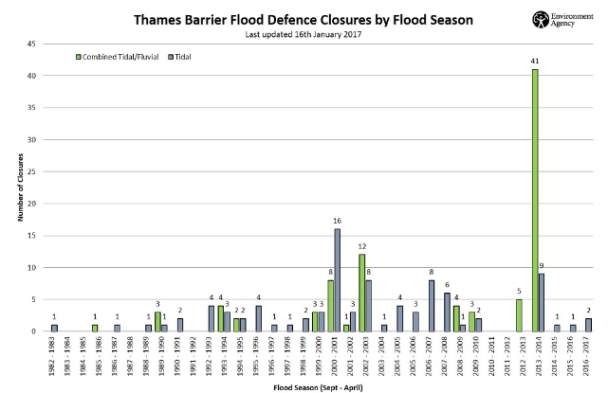
Figure 8: Thames Barrier closures during flood season in years 1982-2017 (Environment Agency, 2014b)
Figure 8 simulates how 125 square kilometres of modern-day London might be affected during a tidal surge if the Thames Barrier did not exist. Thousands of homes and businesses would be affected by flooding as the high-tide flowing up the estuary into London pushes the river water back.
Figure 9 shows a photograph of how the barrier currently holds back the river for the gradual release of water when the tide turns (Royal Geographical Society, 2017).
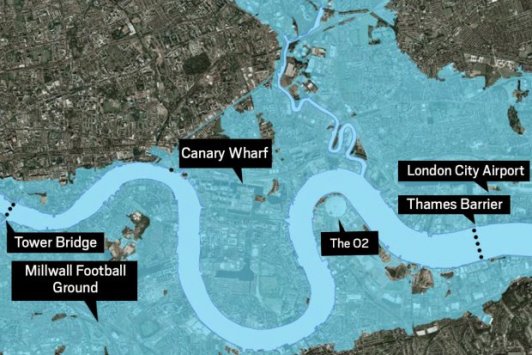
Figure 9: Simulation of London Flooding when no barrier present (Environment Agency in Robb, 2016)
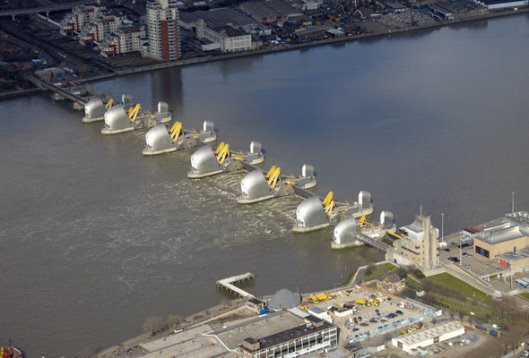
Figure 10: Thames Barrier Closed (Mansfield, 2016)
3 FLOODING IN GLOUCESTERSHIRE (2007)
3.1 Overview
In the summer of 2007, prolonged and heavy rainfall caused major flooding on 20th July across most of Gloucestershire, UK. As a direct result of the flooding, thousands of homes and businesses were severely impacted by damage, loss of electricity and loss of access to clean water (BBC, 2014).
The Mythe Water Treatment Plant, responsible for supplying clean water to over 150,000 properties in the county, was temporarily closed due to flooding and water contamination.
The flooding in Gloucestershire [Figure 10], which affected 4000 homes and around 500 businesses, devastated the community and limited access to many local services. Thousands of people were also left stranded and unable to travel due to fast, high-rising flood waters over the days following 20th July when transport routes and services came to a halt (BBC, 2014).
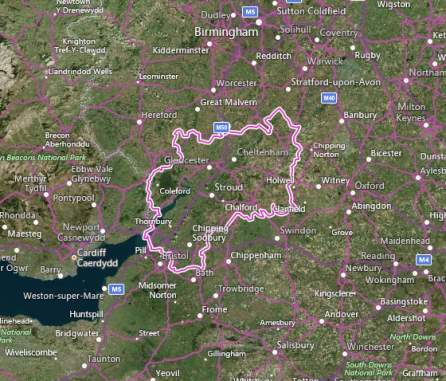
Figure 11: Map – Gloucestershire (Microsoft, 2017)
3.1.1 Gloucestershire Flood Facts
Table 2 outlines the extent of the Gloucestershire flooding event in 2007, which lists the areas and corresponding number of properties affected. The affected areas as located on a map can be seen in Figure 11.
| Area affected | Number of properties affected |
| Tewkesbury Borough | 1831 |
| Gloucester City | 965 |
| Cotswold District | 900 |
| Cheltenham Borough | 623 |
| Stroud District | 200 |
| Forest of Dean District | 93 |
Table 2: Areas and properties affected in 2007 (Gloucestershire County Council, 2007)
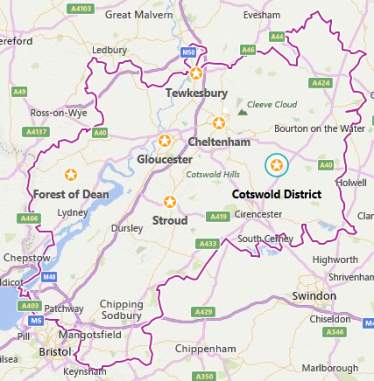
Figure 12: Affected areas in Gloucestershire floods, 2007 (Microsoft, 2017)
3.2 Impacts of Flooding in Gloucestershire
In addition to the number of properties, businesses and transport mechanisms affected by the flood water, a major electricity supply was also faced with risk of outage, putting people at further risk of the loss or reduction to emergency services.
More significantly, causing a national crisis, Tewkesbury Water Treatment Works [Figures 12 and 13], situated on the outskirts of Tewkesbury, was unable to provide clean tap water for around half of the county’s population estimated at 350,000 people for around 17 days due to severe flooding (BBC, 2014 and Waterbriefing, 2017).
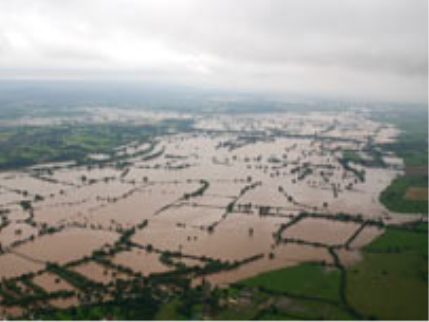
Figure 13: Photograph view south from above Tewkesbury (BBC, 2014b)
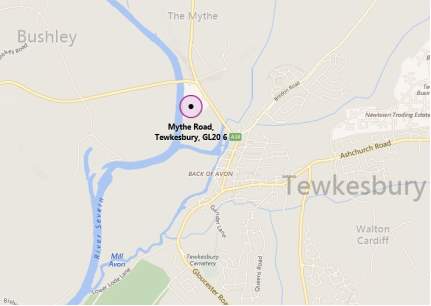
Figure 14: Map – Mythe Water Treatment Works, Tewkesbury (Microsoft, 2017a)
3.2.1 Impacts of Mythe Water Treatment Plant Closure
Two days following the start of the flood event on 22nd July 2007, the Mythe Water Treatment Plant had to stop their operations to supply clean drinking water to around 140,000 homes in Gloucestershire due to the flooding of its entire site as shown in Figure 5 and an overall cost of £29.6 million (Environment Agency, 2010).
Contaminated water penetrated water supplies on site [Figures 14 and 15], therefore the water company, Severn Trent Water were required to connect around 20,000 people to an alternative water supply from Mitcheldean Water Treatment Works. The remaining population without water were supplied by bottles, bowsers and tanks (Walliman, 2010).
In order to protect critical parts of the site following warnings of more adverse weather, there was an urgent requirement for new flood defences to be constructed (Walliman, 2010).
Temporary flood defences had been erected at the Mythe Water Treatment Plant one year after the event, however it would be years until more permanent defences would be put in place (Walliman, 2010 and Waterbriefing, 2011).
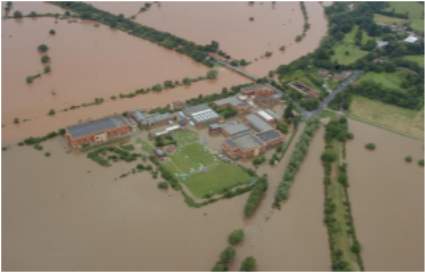
Figure 15: Aerial photograph: Mythe WTW site under water (Walliman, 2010)
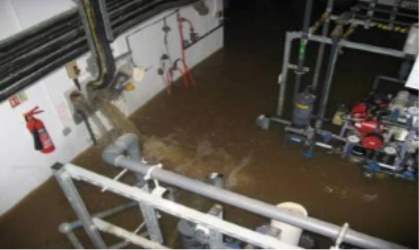
Figure 16: Mythe Water Treatment Works flooding (Walliman, 2010)
3.2.2 Impacts on Additional Water Treatment Works
By 2008, Severn Trent Water had been required to take measures to improve flood defences and emergency procedures across all of its Gloucestershire sites, costing approximately £40 million (Walliman, 2010) and a £12 million programme of works had been scheduled with the aim of alleviating future sewage flooding problems and health risks in Gloucester (BBC, 2014).
In the first twelve months after the floods, expansion work to the value of around £3.3 million at a sewage pumping station in Longlevens, Gloucester had taken place (BBC, 2014).
Ulley Reservoir dam faced a near breach in the 2007 event, causing potentially significant impacts to the M1 motorway, a large electricity substation and gas network in the vicinity (Waterbriefing, 2017).
3.3 Flood Defence Mechanisms
With regards to the flood events that halted operations in July 2007 to Mythe Water Treatment Works, Severn Trent Water took measures to reduce the impacts in the event of a future flood event (Waterbriefing, 2011).
Costing around £5.5 million, after removing the temporary flood defences, Severn Trent Water arranged for a flood defence system including sheet piling, dwarf walls and earth embankments to be completed by 2011. The flood defence mechanisms in place can now protect the plant in excess of a 1-in-200-year flooding event (Waterbriefing, 2011).
The timber-clad sheet piling was erected on the banks of the River Severn along with other flood defence mechanisms being put in place in Gloucestershire, such as flood barriers as seen in Figure 16.
In 2014, the Environment Agency stated that flood defence mechanisms were currently working to protect Alney Island during an episode of adverse weather and heavy rainfall on 14th February (BBC, 2014).
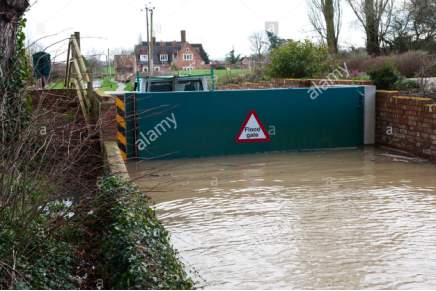
Figure 17: Flood defences holding back the River Severn at Deerhurst, near Tewkesbury, Gloucestershire UK – February 2014 (Alamy, 2017)
4 SANDWICH TOWN TIDAL DEFENCE SCHEME (2008)
4.1 Overview
With a population of 4,985 and located on the River Stour in Kent, Sandwich is a historic town and civil parish in the district of Dover (Microsoft, 2017).
Prior to 2008, Sandwich Town [Figures 17 and 18] was protected from a 1-in-20 standard of tidal flooding, despite being at high risk of flooding. Therefore, in 2008, the Environment Agency developed a flood defence strategy to provide Sandwich with a 1-in-200 flood event protection by means of installing 16 sections of defences along the banks of the River Stour (Environment Agency, 2015).
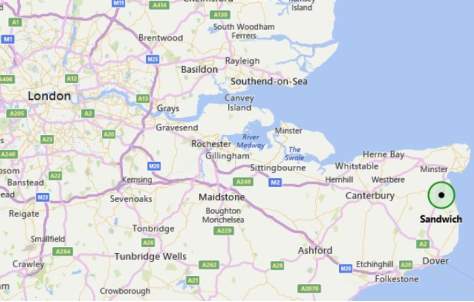
Figure 18: Sandwich Town, Kent (Microsoft, 2017b)
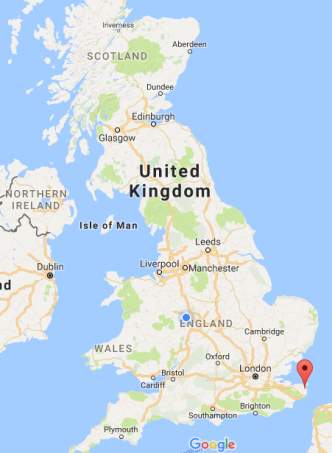
Figure 19: Sandwich Town, Kent located on UK map (Google, 2017)
The flood defence strategy to cover flood risk areas [Figure 19] entailed a partnership between Pfizer, Kent County Council and the Environment Agency providing this new standard of protection to 488 homes and 94 commercial properties. The protection would be created by installing;
- Off-line tidal flood relief areas and new tidal flood storage at Broadsalts
- Raised flood embankments on both banks of the River Stour
- Sheet piled and reinforced concrete flood walls on both banks of the river Stour
- A flood wall at Sandwich Quay standing at 1 metre high (Environment Agency, 2015 and Planancy, 2015).
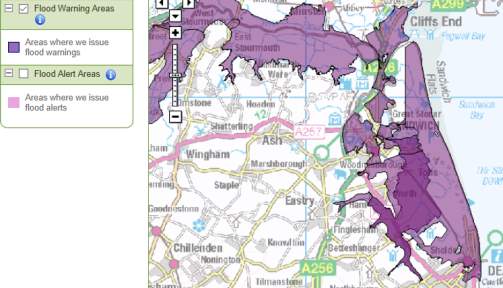
Figure 20: Flood warning areas in and around Sandwich (Environment Agency, 2017)
The new flood defence scheme, priced at £24.6 million, would also provide additional protection for the Pfizer site Discovery Park, main coastal access routes and many important areas for employment and tourists in the Town (Environment Agency, 2015).
The construction of the new tidal defence scheme began in March 2013 and was completed by September 2015, specifically to include the following;
- Embankment works north of Richborough Road and the raising of the existing access track
- The replacement of a temporary sandbag wall with a new brick-clad reinforced concrete wall at the rear of Aynsley Court
- Embankment works near the Princes Golf Course, Black Sluice, Monks Wall Nature Reserve and also behind the Highway Marine Boat Yard (Environment Agency, 2015)
Images of flooding and one section of a flood wall erected in Sandwich Town can be seen in Appendix 1.
4.2 Success of the TidalDefences
Focusing on the flood defence mechanism in place at Stonar Cut, Sandwich [Figures 20 and 21], the effectiveness of such a defence can be analysed.
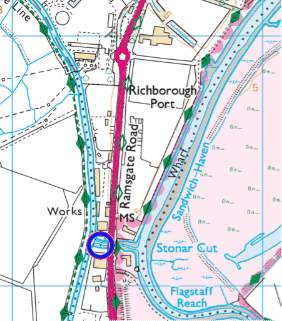
Figure 21: Location of Stonar Cut (Ordnance Survey, 2017 in Geograph, 2017)
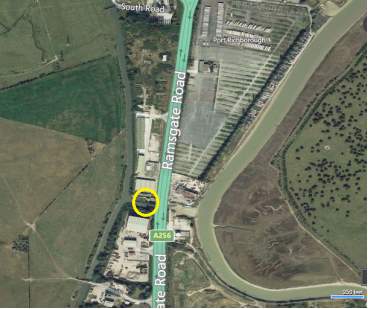
Figure 22: Aerial view of Stonar Cut (Microsoft, 2017c)
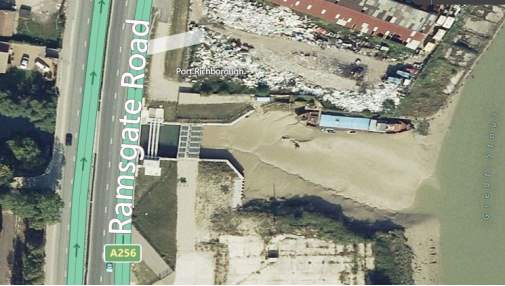
Figure 23: Aerial view of Stonar Cut: sluice gates (Microsoft, 2017c)
The motor-operated sluice flood gates at Stonar Cut are located across the neck of a large loop in the River Stour [Figures 22-24] and have been designed to divert some of the flow of the river during heavy rainfall, providing protection to around 3000 acres of land in Sandwich (River Stour (Kent) Internal Drainage Board, 2017).
The flood gates provide an effective flood defence when the River Stour is running full during adverse weather, allowing the diverted flow to bypass Sandwich and be directed down Stonar Cut to the sea (River Stour (Kent) Internal Drainage Board). In a meeting held by Kent County Council (2014), Nunn (2014) states that “excess water in the Sandwich area was managed at Stonar Cut, which meant that a lot of the fluvial flow was not going through Sandwich at all”.
It is also said that the flood gates had been in operation on only four occasions between the 2013/14 winter floods in Kent and November 2014, which during the winter floods, had seen the defence in operation 143 times (Kent County Council, 2014).
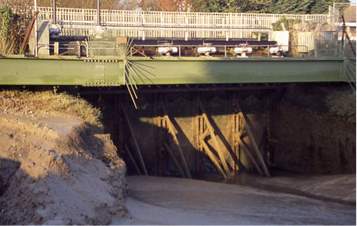
Figure 24: Sluice flood gates at Stonar Cut (Boast and Moody, 2006)
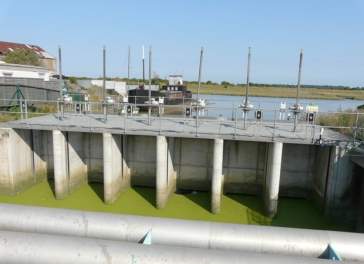
Figure 25: The Sluice at Sonar Cut (Baker, 2013)
PROPOSED METHODOLODY
In order to conclude on the effectiveness of current flood defences in the UK, the scope of the final dissertation report will be to compare the facts of the floods of Cumbria in 2015 against those of the Thames Barrier, the 2007 Gloucester floods and the Sandwich Town tidal defence scheme, and measure these against climate change data.
The information collated in this literature review will be used to comparatively discuss the key issues for the UK’s flood defences, which includes the review of a wide range of literature and summarisation of the above information, as well as further discussion to specify the future risks of flooding in the UK as a result of how effective the current flood defence systems are in limiting the impacts of flooding. This will entail the examination of pre-existing data and the collation of statistics namely relating to the flooding in Cumbria in 2015, other high-risk flood areas in the UK and climate change.
The discussion will also link together the available information to support recommendations for improving flood defences in the UK over the coming decades.
The proposed headings and subheadings for the discussion and final chapters of the dissertation are as follows;
- CLIMATE CHANGE IN THE UK
- Overview
This overview of climate change in the UK will examine and discuss the general changes in climate, which will include statistical information relating to rainfall and sea levels between the years 1980 and 2017. This section will also discuss climate change predictions and how based on these, climate change is expected to impact on the risk of flooding in the UK over the coming decades.
FAILINGS IN CUMBRIA, 2015
This section will make several suggestions based on the available data as to why the flood defences in Cumbria during Storm Desmond, were unable to cope during that time.
These conclusions will be supported by information examined regarding the Thames Flood Barrier, Gloucestershire floods of 2007 and the Sandwich Tidal Defence Scheme in Kent, in addition to comparative rainfall data.
- THE FUTURE OF UK FLOOD DEFENCES
- Climate Change and Flooding in Cumbria, London, Gloucestershire and Sandwich
This part of the discussion will consider how climate change is impacting on areas Cumbria, London, Gloucestershire and Sandwich., more specifically, in terms of increases in rainfall frequency and intensities. This data will be used to discuss how climate change predictions might contribute to the risk of flooding and impact on the effectiveness of current flood defences in the UK in the future.
A timeline of events from the flood incidents and defence schemes examined in the literature review will be used to directly compare against climate change data for those periods. This will allow for an evaluation of how future climate change predictions are likely to impact on current flood defences, particularly in Cumbria, but also the rest of the UK.
CONCLUSION
This section will contain a final summary of reviewed literature and relevant data so that firm conclusions can be made on the principal observations and findings on the effectiveness of current flood defences in the UK.
RECOMMENDATIONS
This section will contain a derivation of logical recommendations and future work, which will consider the UK flood defences currently in use and how in accordance with climate change predictions, they might be improved to cope with future flood events. Some international examples of successful flood defences may be used to support these recommendations.
- REFERENCES
- APPENDICES
REFERENCES AND BIBLIOGRAPHY
Abel, N., Gorddard, R., Harman, B., Leitch, A., Langridge, J., Ryan, A. and Heyenga, S. (2011) Sea level rise, coastal development and planned retreat: analytical framework, governance principles and an Australian case study. Environmental Science and Policy, 14(3), pp. 279-288
Alamy (2017) Stock Photo – Flood defences holding back the River Severn at Deerhurst, near Tewkesbury, Gloucestershire UK – February 2014 [Online]. Available at: http://www.alamy.com/stock-photo-flood-defences-holding-back-the-river-severn-at-deerhurst-near-tewkesbury-66926987.html Accessed on 15/5/17
Anonymous (2012) Flood defence measures approved in Cumbria. Planning; London. 1932(14). Haymarket Business Publications Ltd., London, UK.
Anonymous (2015) Environment Agency warns of potential for significant flooding Christmas night into Boxing Day[Online]. M2 Presswire; Coventry. Normans Media Ltd, ProQuest Document 1751965302. Available at ProQuest
Baker, J. (2013) The sluice at Stonar Cut [Online]. Available at: http://www.geograph.org.uk/photo/3646577 Accessed on 22/5/17
BBC (2014) Gloucestershire floods: Flood defences ‘did their job’ [Online]. Available at: http://www.bbc.co.uk/news/uk-england-gloucestershire-26185691 Accessed on 20/5/17
BBC (2014b) Image: Photograph view south from above Tewkesbury [Online]. Available at: http://www.bbc.co.uk/gloucestershire/content/articles/2007/12/28/flood_documentary_feature.shtml Accessed on 14/05/17
BBC (2015) How do you stop flooding? [Online]. Available at: http://www.bbc.co.uk/news/uk-25929644. Accessed on 20/10/16
Caters News Agency (2014) Thames Barrier Photographs in Zolfagharifard, E (2014) Thames Barrier turns 30: Stunning images reveal the complex machinery that’s shielding London from the floods [Online]. Available at: http://www.dailymail.co.uk/sciencetech/article-2559399/Thames-Barrier-turns-30-Stunning-images-reveal-complex-machinery-thats-shielding-London-floods.html Accessed on 22/5/17
Cumbria Crack (2012) New flood gates to be operated in Keswick during times of flood [Online]. Available at: http://www.cumbriacrack.com/2012/08/22/new-flood-gates-to-be-operated-in-keswick-during-times-of-flood/. Accessed on 19/10/16
de Castella, T. (2014) How does the Thames Barrier stop London flooding? [Online]. Available at: http://www.bbc.co.uk/news/magazine-26133660 Accessed on 23/5/17
Djordjević, S., Butler, D., Gourbesville, P., Mark, O. and Pasche, E. (2011) New policies to deal with climate change and other drivers impacting on resilience to flooding in urban areas: the CORFU approach. Environmental Science and Policy, 14(7), pp. 864-873
Earth Science Communications Team (NASA) (2016) Sea Level [Online]. Available at: http://climate.nasa.gov/vital-signs/sea-level/. Accessed on 10/10/16
Environment Agency (2009a) Eden Catchment Flood Management Plan: Summary Report [Online]. Policy Paper. First published 1 December 2009 as part of Catchment flood management plansandFlooding and coastal change. Available at: https://www.gov.uk/government/publications/eden-catchment-flood-management-plan Accessed on 30/1/17
Environment Agency (2009b) Flooding in England: A National Assessment of Flood Risk. Environment Agency – Bristol, UK. Available at: https://www.gov.uk/government/uploads/system/uploads/attachment_data/file/292928/geho0609bqds-e-e.pdf. Accessed on 18/10/16
Environment Agency (2010) The costs of the summer 2007 floods in England. Projects SC070039/R1. Environment Agency, Bristol, UK
Environment Agency (2012) Sandwich Town Tidal Flood Defences [Online]. Updated on 22 September 2015. Available at: https://www.gov.uk/government/publications/sandwich-town-tidal-defences/sandwich-town-tidal-defences. Accessed on 19/10/16
Environment Agency (2014a) Looking Inside the Thames Barrier [Online]. Available at: http://webarchive.nationalarchives.gov.uk/20140328084622/http://www.environment-agency.gov.uk/static/documents/Leisure/lookinsidethebarrierPDF.pdf Accessed on 14/6/17
Environment Agency (2014b) The Thames Barrier [Online]. Updated on 25 April 2017. Available at: https://www.gov.uk/guidance/the-thames-barrier Accessed on 24/5/17
Environment Agency (2015) Environment Agency warns of potential for significant flooding Christmas night into Boxing Day [Online]. Available at: https://www.gov.uk/government/news/environment-agency-warns-of-potential-for-significant-flooding-christmas-night-into-boxing-day Accessed on 22/5/17
Environment Agency (2016a) Keswick Flood Investigation Report [Online]. Available at: http://www.cumbria.gov.uk/eLibrary/Content/Internet/536/6181/42503135122.pdf Accessed on 23/5/17
Environment Agency (2016b) Policy Paper: Exeter flood defence scheme [Online]. Available at: https://www.gov.uk/government/publications/exeter-flood-defence-scheme/exeter-flood-defence-scheme#phase-1-is-complete Accessed on 20/5/17
Environment Agency in Robb, S. (2016) Image: Simulation of London Flooding when no barrier present [Online]. Available at: http://metro.co.uk/2016/08/18/terrorists-could-blow-up-the-thames-barrier-police-fear-6075207/ Accessed on 23/5/17
Environment OnSite (2015) Cumbria Floods: Investment insufficient to deal with climate change [Online]. Available at: https://environmentonsite.com/43989/cumbria-floods-investment-insufficient-to-deal-with-climate-change Accessed on 30/1/17
Escarameia, M. (2016) Improving urban resilience to flooding: a vital role for civil engineers. Proceedings of the Institution of Civil Engineers – Civil Engineering, 169(3), pp. 101-101
French, J.R. (2008) Hydrodynamic Modelling of Estuarine Flood Defence Realignment as an Adaptive Management Response to Sea-Level Rise. Journal of Coastal Research, 24(2B), pp. 1-12
Gloucestershire County Council (2007) Summer 2007 Floods – Facts and Figures [Online]. Available at: http://www.gloucestershire.gov.uk/index.cfm?articl eid=19605 Accessed on 14/5/17
Google (2016) Image of Google Maps: Cumbria [Online]. Available at: https://www.google.co.uk/maps/place/Cumbria/@54.621027,-2.4352964,8.75z/data=!4m5!3m4!1s0x48632ab0a13de7c5:0x16e1925b0544819a!8m2!3d54.5772323!4d-2.7974835. Accessed on 13/10/16
Google (2017) Sandwich Town, Kent located on UK map [Online]. Available at: https://www.google.co.uk/maps/place/Sandwich/@54.0814841,-5.8838343,6z/data=!4m5!3m4!1s0x47deac22fa0cfa75:0x2159b380452d4c9d!8m2!3d51.274017!4d1.337427 Accessed on 21/5/17
Grinham, N. (2013) Flood risk: planning, design and management of flood defence infrastructure: Proceedings of the Institution of Civil Engineers, 166(2), pp. 58
Harvey, H., Hall, J. and Manning, L. (2014) Computing flood risk in areas protected by flood defences. PROCEEDINGS OF THE INSTITUTION OF CIVIL ENGINEERS-WATER MANAGEMENT, 167(1), pp. 38-50
Heffer, G. (2015) Cumbria Floods – Minister vows to ‘learn lessons’ amid claims defence schemes were shelved. Express [Online]. Published 7 December 2015. London, UK. Accessed on 30/1/17
Hoek, V.D., Ronald, E., Brugnach, M., Mulder, J.P.M. and Hoekstra, A.Y. (2014) Analysing the cascades of uncertainty in flood defence projects: How “not knowing enough” is related to “knowing differently”. Global Environmental Change, 24(1), pp. 373-388
International Civil Defence Organisation (ICDO) (2016) Floods [Online]. Available at: http://www.icdo.org/en/disasters/natural-disasters/floods/ Accessed on 20/10/16MetOffice (2015) Flooding in Cumbria December 2015 [Online]. Updated on 27th January 2016. Available at: http://www.metoffice.gov.uk/climate/uk/interesting/december2015. Accessed on 13/10/16
Jackson (2015) Award winning flood defence scheme completed in Sandwich: YouTube video: Sandwich Town Tidal Flood Defence Scheme – Living Waterways Award Winners [Online]. Available at: http://www.jackson-civils.co.uk/component/k2/item/70-award-winning-flood-defence-scheme-completed-in-sandwich Accessed on 21/5/17
Kent County Council (2014) Minutes of the Kent Flood Risk Management Committee Meeting [Online]. Available at: https://democracy.kent.gov.uk/documents/s51432/Minutes%2017112014%20Kent%20Flood%20Risk%20Management%20Committee.pdf Accessed on 21/5/17
Kinver, M (2015) Storm Desmond: Defences against indefensible floods [Online]. Available at: http://www.bbc.co.uk/news/science-environment-35028180 Accessed on 22/5/15
Lamond, J.E. and Proverbs, D.G. (2009) Resilience to flooding: lessons from international comparison. Proceedings of the Institution of Civil Engineers – Urban Design and Planning, 162(2), pp. 63-70
Liao, K. (2012) A Theory on Urban Resilience to Floods – A Basis for Alternative Planning Practices. Ecology and Society, 17(4), pp. 48
Mansfield, K. (2016) Image: Thames Barrier Closed [Online]. Available at: http://cdn.images.express.co.uk/img/dynamic/1/590x/secondary/Thames-Barrier-461775.jpg Accessed on 24/05/17
MetOffice (2012) Heavy Rainfall and Flooding in Cornwall, November 2010 [Online]. Available at: http://www.metoffice.gov.uk/climate/uk/interesting/nov2010. Accessed on 18/10/16
Met Office (2014) Winter storms, January to February 2014: Rainfall 67-day running totals 11 Dec 2013 to 15 February 2014 % of Winter 1981-2010 average [Online]. Available at: http://www.metoffice.gov.uk/climate/uk/interesting/2014-janwind Accessed on 22/5/17
Met Office (2015a) Barometer: Storm Desmond [Online]. Available at: http://www.metoffice.gov.uk/barometer/uk-storm-centre/storm-desmond Accessed on 27/01/17
Met Office (2015b) Flooding in Cumbria December 2015 [Online]. Available at: http://www.metoffice.gov.uk/climate/uk/interesting/december2015 Accessed on 27/1/17
Met Office (2017) Seasonal rainfall figures between 1982-2016: Hadley Centre Observation Data: HadUKP Data [Online]. Available at: http://www.metoffice.gov.uk/hadobs/hadukp/data/seasonal/HadSEEP_ssn.dat Accessed on 22/5/17
Microsoft (2017a) Maps of Gloucestershire [Online]. Available at: https://www.bing.com/maps?q=Cheltenham%2c+United+Kingdom&mkt=en&FORM=HDRSC4 Accessed on 14/5/17
Microsoft (2017b) Map of Sandwich Town, Kent [Online]. Available at: https://www.bing.com/maps?q=sandwich+town&mkt=en&FORM=HDRSC4 Accessed on 14/5/17
Microsoft (2017c) Aerial view of Stonar Cut [Online]. Available at: https://www.bing.com/maps?q=stonar+cut&mkt=en&FORM=HDRSC4 Accessed on 22/5/17
NASA Goddard Space Flight Center (2016) Image of Rising Sea Level Chart [Online]. Available at: http://climate.nasa.gov/vital-signs/sea-level/. Accessed on 10/10/16
Nunn (2014) in Kent County Council (2014) Minutes of the Kent Flood Risk Management Committee Meeting [Online]. Available at: https://democracy.kent.gov.uk/documents/s51432/Minutes%2017112014%20Kent%20Flood%20Risk%20Management%20Committee.pdf Accessed on 21/5/17
Planancy (2015) Sandwich Town Tidal Defences [Online]. Available at: http://www.planancy.co.uk/sandwich_tidal_defences.aspx Accessed on 21/5/17
River Stour (Kent) Internal Drainage Board (2017) History [Online]. Available at: http://www.riverstouridb.org.uk/history.php Accessed on 22/5/17
Royal Geographical Society (2017) The Thames Barrier [Online]. Available at: https://21stcenturychallenges.org/the-thames-barrier/ Accessed on 24/5/17
Shah, S. and McCall, I. (2016) Keswick: Flood Investigation Report: Flood Event 5-6th December 2015 [Online]. Available at: http://www.cumbria.gov.uk/eLibrary/Content/Internet/536/6181/42503135122.pdf Accessed on 14/6/17
Smart Flood Protection (2014) SMART Flood Protection: The SMARTeST Project [Online]. Available at: http://www.smartfloodprotection.com/the-smartest-project-2/ Accessed on 20/10/16
The Rivers Trust (2016) ALFA Project [Online]. Available at: http://www.theriverstrust.org/projects/alfa/index.html. Accessed on 19/10/16
Tonkin, S. and Glanfield, E. (2015) Mail Online: The chaos after the storm: Thousands of devastated families face eight months away from their homes after they were ruined by flooding as insurers prepare for payouts of £500MILLION [Online]. Available at: http://www.dailymail.co.uk/news/article-3349027/Nightmare-Christmas-Families-forced-homes-soul-destroying-floods-told-eight-months-return-forecasters-warn-SEVEN-INCHES-rain-record-fall-13ins-just-24-hours.html Accessed on 13/10/16
UK Climate Projections (2016a) Case Studies [Online]. Available at: http://ukclimateprojections.metoffice.gov.uk/23081. Accessed on 19/10/16
UK Climate Projections (2016b) UK Climate Projections Project: Newsletter: August 2016. [Online]. Available at: http://ukclimateprojections.metoffice.gov.uk/media.jsp?mediaid=88737&filetype=pdf. Accessed on 19/10/16
Wadey, M.P., Cope, S.N., Nicholls, R.J., McHugh, K., Grewcock, G. and Mason, T. (2015) Coastal flood analysis and visualisation for a small town. Ocean & Coastal Management, 116. pp. 237-247
Walliman, N (2010) Case Study: Gloucestershire, GB Flood 2007: Fact sheet [Online]. Available at: http://www.floodprobe.eu/partner/assets/documents/Floodprobe-Factsheet-casestudy-gloucester.pdf Accessed on 11/5/17
Wanless, G. (2008) The Gloucestershire experience – resilience to flooding [online]. Stevenage: IET, pp.83-91Available at: ProQuest
Waterbriefing (2011) Costain completes Mythe WTW flood defences scheme [Online]. Available at: https://www.waterbriefing.org/home/company-news/item/4142-costain-completes-mythe-wtw-flood-defences-scheme Accessed on 16/5/17
Waterbriefing (2017) National Grid flood defence spend highlights need to protect critical UK infrastructure [Online]. Available at: https://www.waterbriefing.org/home/flooding/item/8660-national-grid-flood-defence-spend-highlights-need-to-protect-uk-critical-infrastructure Accessed on 12/05/17
WordPress.com (2015) Image of Cumbria Map [Online]. Available at: https://ddecoverley.files.wordpress.com/2015/12/cumbriamap.jpg. Accessed on 13/10/16
Zolfagharifard, E (2014) Thames Barrier turns 30: Stunning images reveal the complex machinery that’s shielding London from the floods [Online]. Available at: http://www.dailymail.co.uk/sciencetech/article-2559399/Thames-Barrier-turns-30-Stunning-images-reveal-complex-machinery-thats-shielding-London-floods.html Accessed on 22/5/17
APPENDICES
APPENDIX 1 Flooding and Flood Defence in Sandwich Town, Kent
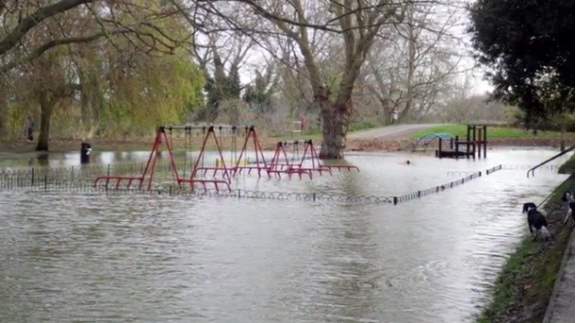
Park flooded in Sandwich Town (Jackson, 2015)
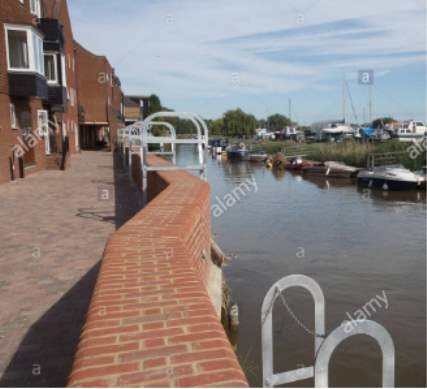
Flood defence wall in Sandwich Town, Kent (Alamy, 2014)
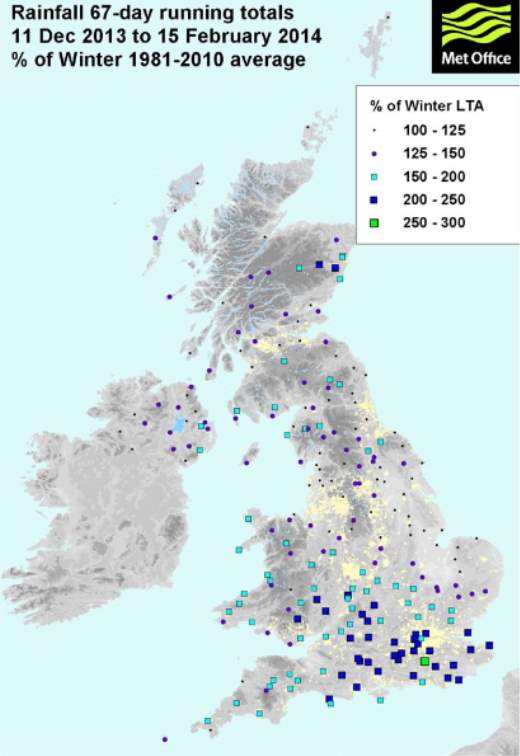
APPENDIX 2
Rainfall 67-day average running totals 11 Dec 2013 to 15 February 2014 % of Winter 1981-2010 average (Met Office, 2014)
APPENDIX 3 Looking Inside the Thames Barrier (Environment Agency, 2014a)
Cite This Work
To export a reference to this article please select a referencing stye below:
Related Services
View all


Related Content
All TagsContent relating to: "Civil Engineering"
Civil Engineering is a branch of engineering that focuses on public works and facilities such as roads, bridges, dams, harbours etc. including their design, construction, and maintenance.
Related Articles

DMCA / Removal Request
If you are the original writer of this dissertation and no longer wish to have your work published on the UKDiss.com website then please: