Empirical Analysis of Efficiency of English Premier League (EPL) Football Clubs (2005-2015)
Info: 24030 words (96 pages) Dissertation
Published: 2nd Mar 2022
Tagged: BusinessSportsBusiness Analysis
Abstract
The aims of this study are in two folds; first to examine if any EPL club could maintain efficiency over the period (2005 – 2015) and second, to identify the most efficient club(s) within the same period using Data Envelopment Analysis (DEA).
There are limited studies on this type of investigation. Contrary to Gerrard (2010) the result shows that there is a high degree of inefficiency among EPL clubs and that only one club (Aston Villa) could maintain efficiency over the research period.
The results further confirm that efficiency is not an absolute privilege of national league champions or big clubs, which motivated the study in the first place. However, inefficiency is largely due to waste of productive resources among EPL clubs.
Keywords: Performance, Efficiency, input-oriented, output-oriented, Football
Introduction
Football; a household event that has literarily metamorphosed into a “religion” was born in England some decades back and has established itself as a way of life and of the feeling of the society, it moves masses, creates joy, and generates billions worldwide (Gasquez & Royuela, 2016)[2].
This is the second study after Gerrard, (2010) to ever use a large data panel in recent times to analyze performance and efficiency of English clubs, but Gerrard failed to carry out trend analysis which creates the opportunity for this research. The aims of this study are in two folds; first to examine if any EPL club could maintain efficiency over the period (2005 – 2015) and second, to identify the most efficient club(s) within the same period.
The study uses a non-parametric time-series approach in DEA otherwise known as DEA-window analysis and based on the output-oriented model to carry out trend analysis of performance and efficiency among EPL clubs during the period researched. Thereby, identified not only the most efficient EPL club(s) but also clubs that maintained performance and efficiency over the same period.
DEA is a linear programming based technique for measuring the relative performance and efficiency of decision-making units (DMUs) where operation involves the use of multiple inputs to produce multiple outputs.
The subsequent sections of this paper are structured as follows: Next section provides the theoretical framework and a brief overview of relevant studies relating to issues being investigated, followed by Section 3 which elaborates on research methodology (DEA-Window Analysis) and describes the dataset. Section 4 presents and discusses the results obtained in this paper, while the final section shows the conclusion and perspectives for future studies.
Theoretical Framework
Efficiency theory stipulates that managers witness a negative correlation between resources (inputs) and the resultant output as against stardom theory which lean more on positive correlation as evidenced by the relationship between sporting success and team wages (Hoegele et al., 2014).
Professional team sports, of which football is the taste of the majority, use multiple inputs to produce multiple outputs. How efficient these resources are being utilized by clubs could be the clubs’ strength to achieving competitive advantage and therefore set the benchmark for peers. The concepts of performance management and efficiency measurements are common features in the field of human resource management. The concept entails a continuous process of identifying, measuring and developing the performance of an entity, aligning performance with strategic goals and available resources within such entity (Mlambo, 2010).
A different explanation of the concept of performance management has appeared in many studies, signifying that there is no single universally accepted model of performance management. Frangopol (2011) built on Mabey et al, (1999) ‘performance management cycle’ to establish that performance management system should be implemented in an organization to include: objectives setting; performance measuring or appraising; feedback of performance results; reward based on performance outcomes; and objectives or activities amendments. What seems to be a unified bedrock and cuts across these theories is the concept of ‘goal-setting’ and ‘expectancy’ concept.
These two concepts led to the choice of theoretical framework adopted in this study looking at performance and efficiency of football clubs from the management and stakeholders’ point of view. Establishing individual goals not only form a benchmark against which performance might be measured but also play an important role in motivating one for superior performance. This is because we keep following our goals and whenever these goals are not achieved, we either improve on our performance or modify the goals to make them more realistic and attainable (Yadav & Dabhade, 2013).
Performing at a high level may be a source of satisfaction, with feelings of mastery and pride (Suleiman et al., 2013). Succinctly, a performance management system involves the gathering of data, analysis of results, identifying corrective actions, and feedback the information in appraising system. Therefore, the metric used to quantify the efficiency and/or effectiveness of an action or process is explained by the theory of performance measurement. Thus, measuring aggregate performance and efficiency of football clubs has continued to impend on issues like clubs’ ranking, sports results, and resource utilization.
Overview of Relevant Studies
The efficiency and performance of football clubs have been researched by several authors over the past few decades using various approaches. While analyzing the performance of professional football clubs in term of sports results, there seems to be a consensus on indicators of play-performance; the number of points per season, goal difference, goals scored, and trophies won in competitive tournaments etc. Among those associated sport performance of football clubs with the number of points scored in a season were Haas, (2003); Frick & Simmons, (2007); Gerrard, (2010); McNamara et al., (2011); Soleimani-Damaneh et al., (2011); Zambom-Ferraresi et al., (2015); and Villa & Lozano, (2016).
In the classical paper of Haas (2003), he analyzed the sports performance of 20 English football clubs during 2000/01 season and concluded that improvement of sports performance requires not only reduction of inputs player’s and coach’s salaries but also increase in outputs-point scored.
The skills and experience of the management at making performance enhancing decisions, setting achievable goals and encourage making players rather than buying players might improve sports performance. The choice of head coach employed, his knowledge about players’ potentials and forms, and how he can blend players to achieve results enhance efficiency.
Frick & Simmons, (2007) with DEA approach analyzed a few points attained per season as an indicator of sports efficiency and found that coach’s wages growth affects sports performance of German clubs, they, however, failed to identify that the rate at which football clubs hires and fires coaches contributed to the increasing growth in wages paid to coaches. When analyzing the relationship between sports performance and wages, Soleimani-Damaneh et al., (2011) revealed that high salary reduces the efficiency of football clubs.
While measuring the ratio of sporting performance (i.e. output) to financial expenditure (i.e. input) Gerrard used wage cost per league point standardized across 12 English football seasons up to 2007 to allow for changes in the general level of player wages in addition to league restructuring. With cluster analysis, Gerrard grouped EPL clubs into five performance groups namely; Big Four (Tier 1), and Tiers 2 to 5 based on their participation in Premier League. Gerrard submitted that winning points in the Premier League require a constantly increasing amount of money and that most inefficient performances were made mostly by big-spending clubs who eventually finished below expectations. The study further showed that most efficient performances over the 12-year investigated were made mostly by newly promoted teams that avoided an immediate relegation. Gerrard study reflects the state of English football in 2006 which may or may not stand the test of present time unless re-examined. Though the study identified efficient and inefficient teams but was unable to measure changes in efficiencies over the period analyzed. The study also failed to identify the most efficient club(s), season(s), and club(s) that could maintain efficiency over the period investigated.
Zambom-Farraresi et al., (2015) evaluated the sports performance of clubs that participated in the Union of European Football Association (UEFA) Champions League (UCL) between 2004/05 and 2013/14 using DEA. Their results showed that there is a high level of inefficiency in UCL over the period analyzed resulting from a waste of sports resources and selection of sporting tactics. They submitted that many teams had the problem in maintaining their efficiencies over the period studied which informs our investigation on trend analysis of English football clubs’ performances. Their study only evaluated the sporting efficiency and mentioned sporting tactics as one of the factors influencing clubs’ efficiency.
However, the current study investigates how consistent are EPL clubs in maintaining efficiency and performance.
Methodology
We are interested in analyzing the trend of performances and efficiencies of English Premier League (EPL) football clubs over a period of eleven (11) seasons up to 2015 season using non-parametric DEA methodology to investigate whether efficiency is the absolute privilege of national league champions or big clubs, thereby, identify the EPL club(s) that could maintain efficiency and performance over time and equally identify the most efficient club(s) on EPL. Unlike the univariate analysis techniques which measure one ratio at a time based on company’s financial statements, DEA derives performance efficiency index based on a mixture of quantitative and qualitative data hence, the attractiveness of DEA in recent literature on corporate performance measurement (Paradi & Zhu, 2013).
DEA is based on observed best practices, therefore, any change made to the input/output profile of one unit will affect the efficiency scores of numerous other units.
In this study, the initial variable includes three inputs and three outputs as given in figure 1 below;
Fig. 1
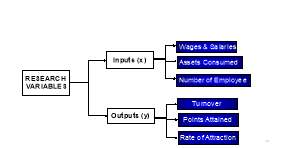
Source: author’s analysis of the research variables.
Inputs include: (i) Total wages and salaries (made up of players’ salaries, salaries of coaching crew and other staff costs); (ii) Assets consumed (comprises of depreciation on fixed assets, players’ amortization and other impairments) and (iii) The number of employee including players, trainers, management and other line-staff, while outputs are: (i) Points attained per season; (ii) Team’s turnover per season and (iii) a discretionary variable Spectators’ or Games’ Rate of Attraction (ROA) is introduced to enhance the objectivity of the chosen data analysis model (DEA).
ROA; a win percentage multiply by the population of the league base (UK) captures the totality of football viewers rather than the absolute attendance figure at games’ venues. This variable is introduced; to stress the homogeneity assumption of DEA as football teams are often from different locations with different population densities and different demand for football entertainment; to capture the totality of fans attracted to a match at the stadium or viewing via media relay. The higher the clubs’ win percentage, the more attracted are the fans to the clubs’ games. Nevertheless, ticket takings from match venue and sponsorship fee on media broadcast are incomes reflecting on clubs’ turnovers. In this way sport, financial and social variables are combined in estimating technical efficiency of multi-objective organizations (Carrillo & Jorge, 2016), thereby, allowing a more comprehensive performance measure.
The current study chooses from available variables identified above based on a rank comparison between “X – Y plot” incorporated in the new DEA-solver 4; a facility that measures the correlation between variables (input and output). The correlation may either be negative or positive, whilst we reject negative correlations all positive values were accepted. Therefore, negative correlation values are not included in the definitive analysis as it has the tendency to overestimate efficiency scores (Djordjevic et al., 2015).
Its’ consideration for operational scale while calculating efficiency makes DEA model more relevant in this study than any other techniques. However, DEA suffers some limitations which include its inability to allow for random errors in efficiency measurements, it does not allow for statistical inference and could, therefore, overestimate efficiency score (Zambom-Ferraresi et al., 2015).
The efficiency in the classical DEA is the ratio of the sum of the weighted outputs to the sum of weighted inputs (Zambom-Ferraresi et al., 2015). Using mathematical notation, efficiency score of unit ‘a’ is given as:
Max Øa =
∑j=1sUjYja / ∑i=1rViXia
Subject to;
Max Øa =
∑j=1sUjYja / ∑i=1rViXia≤ 1
Where a = {1, 2…n}, and
Uj,
Vi> 0 With ‘n’ units (DMUs) in the data set and ‘a’ is a subset of ‘n’,
Uj;
is the weight applied to jth output;
Yja;
is the quantity of jth output produced by DMU ‘a’;
Vi
; is the weight applied to ith input;
Xia
; is the quantity of ith input used by DMU ‘a’;
‘a’ is the DMU assessed, and Øa is DEA score for DMUa.
This model definition contains ‘weighted variables’ (Uj, Vi) that are to be determined, where j = 1, 2………, s and i = 1, 2……., r. The values of these weights are determined objectively by the solution of the DEA algorithm with the constraint that no DMU can be more than 1 or 100% efficient as depicted by the equation above. The efficiency score derived for each DMU is on a scale of zero to one (0 – 1), while ‘0′ represents an extremely inefficient unit, a score of ‘1′ denotes an efficient unit. It, therefore, means that efficiency scores range from 0 to 1 and are relative (not absolute) compare with other DMUs in the data set being analyzed.
DEA Window Analysis
A tabular method that allows an analysis of efficiency changes over time. With the practical application of DEA in clubs’ efficiency measures and since data is available for Football Clubs (FC) periodically, usually on yearly basis, with ‘n’ units (DMUs) and inputs/outputs levels attributable to each of the ‘t’ periods, a few analyses may be conducted giving distinct performance evaluations. Basically, there are two different approaches to which efficiency changes over time could be explored. The first approach is to treat each decision-making unit as a separate unit in each time ‘t’ period, giving (‘n’ x ‘t’) units in the analysis. The second approach being the one adopted in this study is known as ‘window analysis’ (Charnes et al., 1985). A ‘window’ of period ‘p’ is defined and assessments carried out for (‘n’ X ‘p’) units. If data is available yearly as in this case, over a period of eleven seasons/years, then each unit is treated as being different in each of the ‘windows’. If a ‘window’ period of (3) seasons/years is assumed, the first ‘window’ has the first 3 years’ data set. After the analysis is carried out, the first year is then dropped from the set and data for the fourth year is included in the second ‘window’ (see appendix 1). The ‘window analysis’ approach explain periods where seasonal factors affect performance and so this can be held constant whilst analyzing changes in efficiency. It equally leads to an increase in the number of pieces of data for the units being analyzed, which enhances the discrimination in the DEA results.
DEA Dataset
A crossed panel data of English Premier League (EPL) clubs is obtained for eleven seasons (2005 – 2015) and based on 100% participation across the research period (see appendix 2). A sample size of 8 clubs was chosen per season out of a population of twenty seasonal clubs. Representing a seasonal 40% of the population. In all, a total of 220 units featured in the EPL during the period analysed representing 36 football clubs due to the relegation and promotion system adopted by the EPL. Therefore, a total of 88 clubs were sampled from the population of 220 clubs based on 100% participation during the research period (see appendix 2).
DEA Input/output Orientations
Output-orientation is a term used in conjunction with DEA (BCC and CCR) models to indicate that an inefficient unit could be made efficient by increasing the proportions of its outputs while keeping the input proportions constant (Zambom-Ferraresi et al., 2015). The output-orientation explains how much the output can be expanded without altering the input. Like output oriented, the term input orientation is also used in conjunction with both CCR and BCC models in DEA to indicate that an inefficient unit may be made efficient by reducing the proportions of its inputs while keeping the outputs proportions constant (Haas, 2003). Whether the DEA algorithm problem is input minimization or output maximization, the CCR model will yield the same efficiency score regardless of input or output orientations but this is not the case with the BCC model. However, as revealed in DEA, the output/input-oriented provide an equivalent measure of technical efficiency when constant return to scale exist (CCR).
Results and Discussion
From the results inAppendix 5, several observations emerged from DEA analysis. First, the CCR calculation indicates that efficiency score remains the same regardless of input/output-orientations, stressing the fact that CCR measures the overall efficiencies, showing the efficient clubs and the more efficient seasons. Second, the inefficient clubs (CCR
Aston Villa remains efficient in all DEA models using BCC (Variable return to scale) and CCR (Constant return to scale) until 2014/15 season. Aston Villa is therefore a super-efficient club (BCC = 1, CCR = 1 and SE = 1). Though DEA showed the efficient and inefficient EPL clubs in each of the seasons investigated, most of the clubs investigated were inefficient. Only about 10.91% (24 out of 220) clubs were efficient in all DEA models in all season. Among these few efficient clubs, only Aston Villa football club could be consistent at efficiency level during the period analyzed (Typed red in Appendix 5).
In terms of technical efficiency (TE) as measured by CCR, seasonal analysis of the results revealed that the degree of inefficiency among the EPL was very high during the period investigated. As many as 196 DMUs out of 220 DMUs have CCR
Whilst decomposing CCR inefficiency (CCR
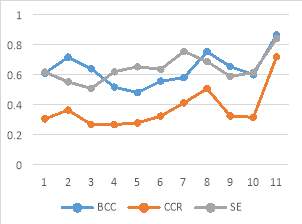
Table 1. Average Efficiency Scores
| Output Oriented | Input Oriented | |||||
| Season | BCC | CCR | SE | BCC | CCR | SE |
| 2004/05 | 0.828 | 0.305 | 0.352 | 0.609 | 0.305 | 0.616 |
| 2005/06 | 0.860 | 0.363 | 0.411 | 0.716 | 0.363 | 0.551 |
| 2006/07 | 0.818 | 0.267 | 0.325 | 0.639 | 0.267 | 0.507 |
| 2007/08 | 0.746 | 0.267 | 0.360 | 0.516 | 0.267 | 0.619 |
| 2008/09 | 0.728 | 0.278 | 0.367 | 0.480 | 0.278 | 0.652 |
| 2009/10 | 0.786 | 0.323 | 0.389 | 0.556 | 0.323 | 0.635 |
| 2010/11 | 0.858 | 0.411 | 0.462 | 0.579 | 0.411 | 0.754 |
| 2011/12 | 0.845 | 0.506 | 0.596 | 0.752 | 0.506 | 0.687 |
| 2012/13 | 0.853 | 0.324 | 0.372 | 0.653 | 0.324 | 0.588 |
| 2013/14 | 0.793 | 0.315 | 0.389 | 0.599 | 0.315 | 0.613 |
| 2014/15 | 0.906 | 0.719 | 0.791 | 0.864 | 0.719 | 0.840 |
Fig. 2 Output Oriented
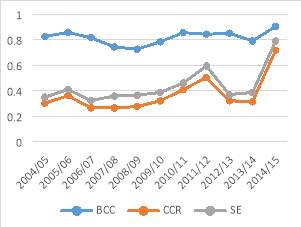
Fig. 3 Input Oriented
Any increase or decrease in operational size, the efficiency of the clubs will further drop.
Fig. 4 Distribution of Efficiency Scores
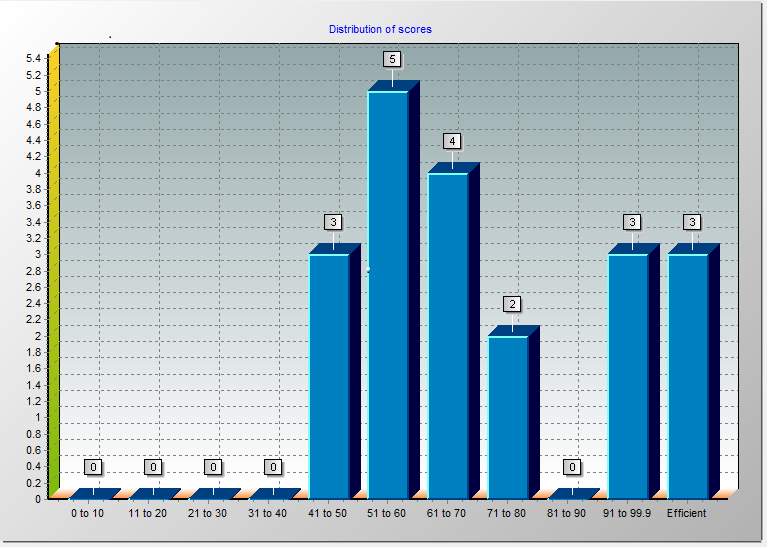
Three clubs were efficient in 2014/15 season using DEA-CCR model, three clubs had efficiency scores between 91% and 99.9%, two clubs had between 71% and 80%, four clubs had between 61% and 70%, five clubs had between 51% and 60%, and the remaining three clubs had between 41% and 50%. In this season, though only three clubs were efficient, fourteen clubs out of 20 clubs that played on EPL in 2014/15 had efficiency scores above 50%.
The three efficient clubs in 2014/15 were Aston Villa FC, Burnley FC, and Stoke City FC. One or more of these efficient clubs formed a peer group or reference set for the inefficient clubs. A peer is a unit which is found to be efficient, with a similar combination of weights as that of an inefficient unit. Where two or more of these efficient units act as a peer for an inefficient unit, they provide a “peer group” for the inefficient unit.
In 2014/15 season, the peer group for the inefficient clubs (Arsenal, Liverpool, Manchester City, Queens Park rangers, New castle and Sunderland) is Aston Villa FC and
Burnley FC; Leicester FC has Stoke city FC and Aston Villa as its peer group; Swansea City and west Bromwich followed the pairs of Burnley FC and Stoke City FC; other clubs (Chelsea, Crystal Palace, Everton, Hull City, Manchester United, Southampton, West Ham and Tottenham Hotspur) had Burnley FC as peer unit (see Reference Frequency below).
Fig.5 Reference Frequency
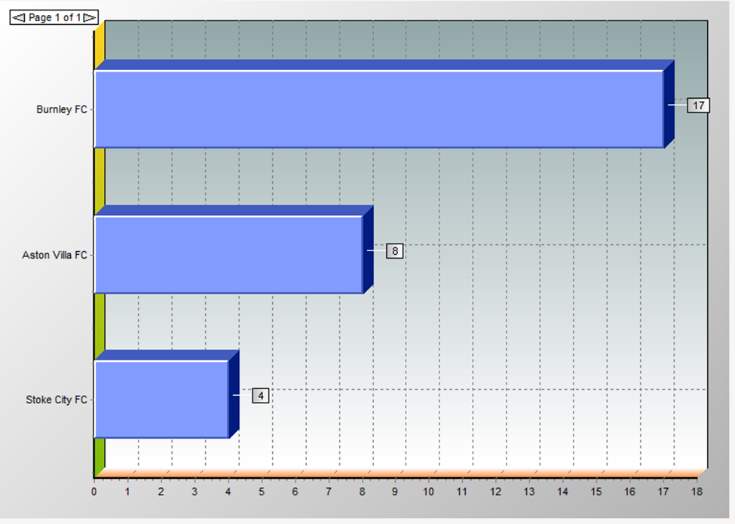
It shows that Burnley FC appeared 17 times, Aston Villa FC 8 times while Stoke City FC appeared 4 times as peer units to the inefficient clubs.
Overall, DEA suggests potential improvements in terms of the variable to the inefficient clubs for 2014/15 season as revealed in total potential improvements chart below.
Fig.6 Total Potential Improvements
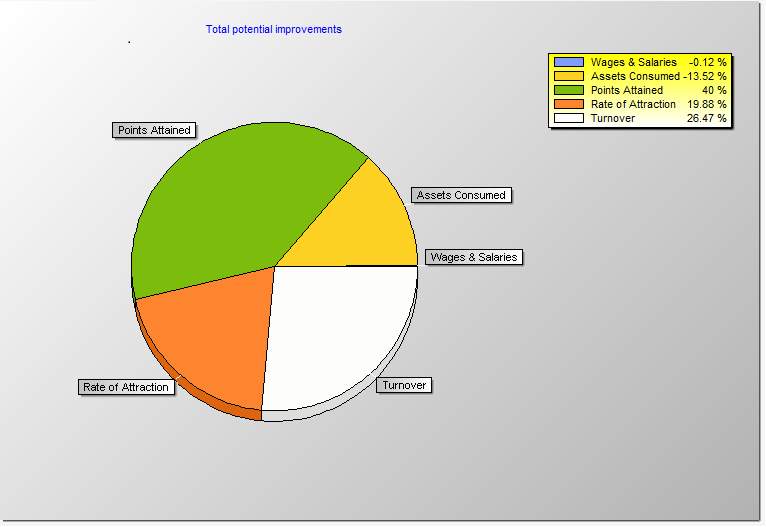
The total improvement chart above shows that on average Wages and Salaries; and Assets Consumed in 2014/15 need to be reduced by 0.12% and 13.52% respectively, while Points attained; Games’ rate of Attraction; and Turnover should be increased by 40%, 19.88% and 26.47% respectively for the inefficient clubs to become efficient.
Changes in efficiency over a period
Efficiency scores estimated in Appendix 5 showed some level of consistency on both DEA models (BCC-Variable return to scale; and CCR-Constant return to scale) with Aston Villa FC having efficiency score of 1.0 throughout the period analyzed. Surprisingly, more variations were noticed in the efficiency scores displayed among most of the clubs tagged “the big four”; Manchester United; Chelsea; Liverpool; and Arsenal (Gerrard, 2010).
Although all the “big four” clubs (highlighted gray table 3) remained consistent on EPL during the period analyzed, but their aggregate performance do not warrant the accolade. From the DEA-window analysis (table 2), 8 clubs (Arsenal FC, Aston Villa FC, Chelsea FC, Everton FC, Liverpool FC, Manchester City FC, Manchester United FC, and Tottenham Hot Spur FC) remained consistent on the English Premier League throughout the period analyzed. An analysis of change in efficiencies over the 11 seasons researched showed on average regardless of input or output orientation using BCC and CCR that Aston Villa FC remains the best with around 99% efficiency score. Though not efficient, EPL clubs showed a high level of inefficiencies for the entire research period.
Looking at the change in efficiency over the period analyzed, TGD less GD (TGD – GD) is equal zero (0) for Arsenal FC and Aston Villa FC using BCC (input or output orientations) and remain zero for Aston Villa FC only using CCR model. These two clubs are relatively more stable in performance as measured by the change in their efficiencies over the period analyzed. With BCC model, Aston Villa FC has the minimal efficiency variance of 0.081 and 0.058 for input oriented and output oriented respectively. Though, Aston Villa FC has 10.7% variance in efficiency score using CCR model as indicated above against Chelsea FC’s 6.1%, but the difference between TGD and GD remain Zero (0) for Aston Villa FC as against Chelsea’s (0.017) efficiency variance over the period analyzed. Using any DEA window analysis model (BCC or CCR), Aston Villa FC remained the only football club that was relatively stable on EPL between 2005 and 2015 season. Therefore, it could be fair to say Aston Villa football club is the most efficient club to have played in EPL in the period analyzed using DEA model. Though, some EPL clubs were efficient in their operations during the research period (highlighted in orange in Appendix 5), a high level of inefficiency operated across the EPL seasons researched. So, to what extent does EPL rank evaluates efficiency?
Table 3 DEA-Window Average/variance Efficiency Scores.
| DMU | CCR-INPUT/OUTPUT ORIENTED | DEA Rank | ||
| MEAN | GD* | TGD* | ||
| AR | 0.403 | 0.068 | 0.846 | 2ND |
| AV | 0.983 | 0.107 | 0.107 | 1ST |
| CH | 0.162 | 0.044 | 0.061 | 7TH |
| EV | 0.329 | 0.253 | 0.594 | 4TH |
| LP | 0.294 | 0.224 | 0.793 | 5TH |
| MC | 0.161 | 0.041 | 0.287 | 8TH |
| MU | 0.207 | 0.074 | 0.114 | 6TH |
| TH | 0.400 | 0.077 | 0.820 | 3RD |
| DMU | BCC-INPUT ORIENTED | BCC-OUTPUT ORIENTED | DEA Rank | ||||
| MEAN | GD* | TGD* | MEAN | GD* | TGD* | ||
| AR | 0.934 | 0.269 | 0.269 | 0.966 | 0.154 | 0.154 | 3rd |
| AV | 0.997 | 0.081 | 0.081 | 0.998 | 0.058 | 0.058 | 1st |
| CH | 0.825 | 0.312 | 0.459 | 0.949 | 0.181 | 0.214 | 4th |
| EV | 0.584 | 0.494 | 0.805 | 0.875 | 0.138 | 0.292 | 7th |
| LP | 0.789 | 0.200 | 0.401 | 0.887 | 0.102 | 0.232 | 6th |
| MC | 0.502 | 0.270 | 0.873 | 0.791 | 0.098 | 0.406 | 8th |
| MU | 0.949 | 0.085 | 0.332 | 0.974 | 0.023 | 0.212 | 2nd |
| TH | 0.802 | 0.309 | 0.459 | 0.914 | 0.113 | 0.209 | 5th |
Mean – Average Efficiency Score for 9 windows.
GD – The greatest difference in yearly efficiency scores but different windows.
TGD – Total greatest difference in efficiency scores for the entire period regardless of the window.
Based on BCC results, which measures pure technical efficiency, table 4 shows that Sunderland FC, Queens Park Rangers FC, and Hull City FC came behind with 20th, 19th, and 18th positions respectively. Among the three clubs relegated in 2014/15 EPL season are the Queens Park Rangers FC and Hull City FC. Whilst BCC model recommended that the Sunderland FC be relegated in 2014/15, EPL relegated Burnley FC which was adjudged to have performed efficiently by DEA-BCC model. This showed that 2 out of 3 clubs relegated in 2014/15 by EPL ranking correlated with DEA-BCC model; a correlation coefficient of 66.67%. Again, only 1 out of 3 clubs relegated by EPL ranking correlated with DEA-CCR model which indicate a correlation coefficient of 33.33%.
Table 4. Efficiency Ranking (DEA & EPL)
| 2014/15 SEASON (Output Oriented) | ||||
| DMU | BCC-Rank | CCR-Rank | SE-Rank | EPL-Rank |
| Arsenal FC | 1st | 17th | *19th | 3rd |
| Aston Villa FC | 1st | 1st | 1st | 17th |
| Burnley FC | 1st | 1st | 1st | *19th |
| Chelsea FC | 1st | 15th | *18th | 1st |
| Crystal P. FC | 13th | 7th | 7th | 10th |
| Everton FC | 16th | 12th | 11th | 11th |
| Hull City FC | *18th | 13th | 8th | *18th |
| Leicester FC | 10th | 6th | 4th | 14th |
| Liverpool FC | 11th | *19th | *20th | 6th |
| Man. City FC | 1st | 14th | 17th | 2nd |
| Man. United FC | 12th | 16th | 16th | 4th |
| Newcastle Utd. FC | 15th | 11th | 10th | 15th |
| Southampton FC | 1st | 4th | 5th | 7th |
| Stoke City FC | 1st | 1st | 1st | 9th |
| Sunderland FC | *20th | *20th | 15th | 16th |
| Swansea City FC | 1st | 5th | 6th | 8th |
| T. Hotspur FC | 1st | 8th | 13th | 5th |
| W. Bromwich FC | 16th | 10th | 9th | 13th |
| West Ham Utd. FC | 14th | 9th | 12th | 12th |
| Queens Park R. FC | *19th | *18th | 14th | *20th |
It is apparent that EPL does not measure scale efficiency as there is any correlation between DEA-scale efficient and EPL ranking in 2014/15 season.
From all indications both DEA-CCR and DEA-BCC models using either output-oriented or input-oriented show that Burnley FC should not have been relegated in 2014/15 as it performed better than both Sunderland FC and Liverpool FC in 2014/15 EPL season should overall efficiency as measured by DEA models, were considered.
Discussion
Given the multi-performance perspective of football clubs, namely sporting, financial and social success, three output variables have been selected; points attained per season, total turnover for the corresponding financial year and the games’ rate of attraction. Points attained per EPL season measures the clubs’ sporting performance on a regular basis over the period researched given that each football club plays 38 league matches per season. Similarly, points won has been used as a proxy for successful sporting performance in other recent studies on professional football (Haas et al.,2004; Carmicheal et al., 2010; and Kern et al., 2012). Derived from the clubs’ financial statements are the total turnover; an indicator of clubs’ financial success (Kern et al., 2012).
While differences exist in clubs’ structures, some clubs are part of a group of companies, others are independent liability companies. By using turnover figure reported in the Deloitte and Touche football financial reviews, together with the annual account of relevant football clubs as filed and published by the companies’ house enhance the consistency of the turnover figure ensuring that data therein was adjusted to exclude figure related to non-football activities. Total turnover has been used by previous studies (Aglietta et al., 2010; Barros et al., 2011; and Halkos & Tzeremes, 2011) as measures of economic success of football clubs regardless of whether it is derived from gate fees, merchandising, media broadcasting, sponsorship or other incomes from football related activities. Appropriate accounting marching concept was adopted to ensure that expenses incurred by the football clubs were met from the total revenue generated from football related activities.
The current study introduces “Games’ rate of Attraction” as a measure of social esteem for spectators and motivates fans to be attracted to football match either by physical presence at games’ venue or watched as relayed by media. The significance of this variable is seen in its positive influence on fans loyalty, determination of fan’s size based, and its existence as a readily available market for the sponsors to increase the market shares of their products. Inputs selected are various football expenses range from wages and salaries to assets consumed and number of employees.
Table 2 DEA-Window Analysis (BCC-Input Oriented)
| SEASON | 04/05 | 05/06 | 06/07 | 07/08 | 08/09 | 09/10 | 10/11 | 11/12 | 12/13 | 13/14 | 14/15 | MEAN | GD | TGD | |
| YEAR | 1 | 2 | 3 | 4 | 5 | 6 | 7 | 8 | 9 | 10 | 11 | ||||
| AR |
0.966 |
0.154 |
0.154 |
||||||||||||
| WINDOW 1 | 1.000 | 1.000 | 1.000 | ||||||||||||
| WINDOW 2 | 0.909 | 0.846 | 1.000 | ||||||||||||
| WINDOW 3 | 0.855 | 1.000 | 0.968 | ||||||||||||
| WINDOW 4 | 1.000 | 0.988 | 1.000 | ||||||||||||
| WINDOW 5 | 0.949 | 1.000 | 1.000 | ||||||||||||
| WINDOW 6 | 1.000 | 0.977 | 1.000 | ||||||||||||
| WINDOW 7 | 0.997 | 1.000 | 0.921 | ||||||||||||
| WINDOW 8 | 1.000 | 0.859 | 1.000 | ||||||||||||
| WINDOW 9 | 0.860 | 1.000 | 0.963 | ||||||||||||
| AV |
0.998 |
0.058 |
0.058 |
||||||||||||
| WINDOW 1 | 1.000 | 0.942 | 1.000 | ||||||||||||
| WINDOW 2 | 1.000 | 1.000 | 1.000 | ||||||||||||
| WINDOW 3 | 1.000 | 1.000 | 1.000 | ||||||||||||
| WINDOW 4 | 1.000 | 1.000 | 1.000 | ||||||||||||
| WINDOW 5 | 1.000 | 1.000 | 1.000 | ||||||||||||
| WINDOW 6 | 1.000 | 1.000 | 1.000 | ||||||||||||
| WINDOW 7 | 1.000 | 1.000 | 1.000 | ||||||||||||
| WINDOW 8 | 1.000 | 1.000 | 1.000 | ||||||||||||
| WINDOW 9 | 1.000 | 1.000 | 1.000 | ||||||||||||
| CH |
0.949 |
0.181 |
0.214 |
||||||||||||
| WINDOW 1 | 1.000 | 1.000 | 1.000 | ||||||||||||
| WINDOW 2 | 1.000 | 0.950 | 1.000 | ||||||||||||
| WINDOW 3 | 0.946 | 1.000 | 0.927 | ||||||||||||
| WINDOW 4 | 1.000 | 0.927 | 0.998 | ||||||||||||
| WINDOW 5 | 0.936 | 0.993 | 0.963 | ||||||||||||
| WINDOW 6 | 0.972 | 0.891 | 0.966 | ||||||||||||
| WINDOW 7 | 0.876 | 0.911 | 0.929 | ||||||||||||
| WINDOW 8 | 0.785 | 0.866 | 0.962 | ||||||||||||
| WINDOW 9 | 0.868 | 0.962 | 1.000 | ||||||||||||
| EV |
0.875 |
0.138 |
0.292 |
||||||||||||
| WINDOW 1 | 1.000 | 0.737 | 0.824 | ||||||||||||
| WINDOW 2 | 0.708 | 0.805 | 0.871 | ||||||||||||
| WINDOW 3 | 0.786 | 0.854 | 0.851 | ||||||||||||
| WINDOW 4 | 0.865 | 0.856 | 0.938 | ||||||||||||
| WINDOW 5 | 0.856 | 0.920 | 0.812 | ||||||||||||
| WINDOW 6 | 0.914 | 0.804 | 0.765 | ||||||||||||
| WINDOW 7 | 0.942 | 0.873 | 1.000 | ||||||||||||
| WINDOW 8 | 0.871 | 1.000 | 1.000 | ||||||||||||
| WINDOW 9 | 1.000 | 1.000 | 0.783 |
| SEASON | 04/05 | 05/06 | 06/07 | 07/08 | 08/09 | 09/10 | 10/11 | 11/12 | 12/13 | 13/14 | 14/15 | MEAN | GD | TGD | |
| YEAR | 1 | 2 | 3 | 4 | 5 | 6 | 7 | 8 | 9 | 10 | 11 | ||||
| LP |
0.887 |
0.102
|
0.232 |
||||||||||||
| WINDOW 1 | 0.905 | 0.963 | 0.937 | ||||||||||||
| WINDOW 2 | 0.982 | 0.859 | 0.920 | ||||||||||||
| WINDOW 3 | 0.855 | 0.917 | 0.960 | ||||||||||||
| WINDOW 4 | 0.913 | 0.975 | 0.798 | ||||||||||||
| WINDOW 5 | 0.975 | 0.849 | 0.876 | ||||||||||||
| WINDOW 6 | 0.833 | 0.825 | 0.798 | ||||||||||||
| WINDOW 7 | 0.824 | 0.805 | 0.912 | ||||||||||||
| WINDOW 8 | 0.768 | 0.810 | 1.000 | ||||||||||||
| WINDOW 9 | 0.810 | 1.000 | 0.882 | ||||||||||||
| MC |
0.791 |
0.098 |
0.406 |
||||||||||||
| WINDOW 1 | 0.836 | 0.715 | 0.645 | ||||||||||||
| WINDOW 2 | 0.659 | 0.597 | 0.697 | ||||||||||||
| WINDOW 3 | 0.594 | 0.689 | 0.588 | ||||||||||||
| WINDOW 4 | 0.695 | 0.598 | 0.744 | ||||||||||||
| WINDOW 5 | 0.598 | 0.744 | 0.789 | ||||||||||||
| WINDOW 6 | 0.765 | 0.798 | 1.000 | ||||||||||||
| WINDOW 7 | 0.798 | 1.000 | 1.000 | ||||||||||||
| WINDOW 8 | 1.000 | 0.902 | 1.000 | ||||||||||||
| WINDOW 9 | 0.902 | 1.000 | 1.000 | ||||||||||||
| MU |
0.974 |
0.023 |
0.212 |
||||||||||||
| WINDOW 1 | 0.924 | 0.973 | 1.000 | ||||||||||||
| WINDOW 2 | 0.995 | 1.000 | 1.000 | ||||||||||||
| WINDOW 3 | 1.000 | 1.000 | 1.000 | ||||||||||||
| WINDOW 4 | 1.000 | 1.000 | 0.977 | ||||||||||||
| WINDOW 5 | 1.000 | 0.977 | 1.000 | ||||||||||||
| WINDOW 6 | 1.000 | 0.996 | 1.000 | ||||||||||||
| WINDOW 7 | 1.000 | 1.000 | 1.000 | ||||||||||||
| WINDOW 8 | 1.000 | 1.000 | 0.788 | ||||||||||||
| WINDOW 9 | 1.000 | 0.788 | 0.880 | ||||||||||||
| TH |
0.914 |
0.113 |
0.209 |
||||||||||||
| WINDOW 1 | 1.000 | 1.000 | 0.947 | ||||||||||||
| WINDOW 2 | 1.000 | 0.842 | 0.819 | ||||||||||||
| WINDOW 3 | 0.834 | 0.819 | 1.000 | ||||||||||||
| WINDOW 4 | 0.794 | 1.000 | 0.914 | ||||||||||||
| WINDOW 5 | 1.000 | 0.914 | 0.791 | ||||||||||||
| WINDOW 6 | 0.933 | 0.811 | 0.864 | ||||||||||||
| WINDOW 7 | 0.887 | 0.940 | 0.963 | ||||||||||||
| WINDOW 8 | 0.914 | 0.943 | 0.910 | ||||||||||||
| WINDOW 9 | 0.949 | 0.908 | 0.986 |
At first, these three inputs were used in the initial analysis, but the negative effect of the number of employees on the initial analysis thereby overestimating the efficiency scores led to the number of employees being dropped in the definitive analysis (see appendix 3 and 4). The wages and salaries derived from the financial statements of the football clubs include directors’ remunerations as their boardroom decisions on whom to employ as coach or manager, and buy as player significantly influence club’s performance (Haas et al., 2004; Carmicheal et al., 2010; Kern et al., 2012; and Kulikova & Goshunova, 2013).
It is evident that wages and salaries constitute the bulk of clubs’ total cost accounting for about 90% of the cost, and wage cost per league point in EPL varies considerably across clubs according to the presence of superstars, with financially strong teams spending more per league point than the other clubs (Carmicheal et al., 2014).
Different accounting policies adopted by different football clubs might be a major source of inefficiency as revealed by the DEA model where little returns are generated from large investment, but clubs that received large returns from little investments are more efficient in the use of the productive resources.
From the fans point of view, “The Champion is the best” and is expected to spend heavily on playing talents to achieve this status. In the broader context of DEA, efficiency is not the absolute privilege of the champions as there is always enough space for improvements. Whilst Haas, (2003) submitted that EPL ranking is not significantly related to the ranking based on efficiency scores, this study affirms that EPL ranking is significantly correlated with DEA efficiency scores. Though, EPL ranking do not measure scale efficiency as does by the DEA efficiency score, but the existence of a correlation between the two ranking models in this study confirms the submissions of Haas et al., (2004).
As in Gerrard (2010), Carlsson-Wall et al., (2016) submitted that success in football is often costly, requiring huge investment and ongoing expenses, and financially rewarding. Both studies agreed that football clubs that are successful on-pitch performance benefit considerably from prize money and attract new sponsors and fans to their games and buy their merchandise. Whilst this study agrees with them, it opines that such success is uncertain and are not the absolute privilege of big and financially strong clubs, but only a few clubs with adequate managerial capabilities and skills will experience a virtuous cycle of this kind.
From the results, few of the EPL clubs could manage to maintain efficiency in one or more of the seasons studied (highlighted in orange), except for one club (Aston Villa FC) who remained efficient in all DEA model throughout the eleven seasons analysed.
Surprisingly, what was classified as tier 1 in (Oberstone, 2009 and Gerrard, 2010) and named ‘The Top 4’ and ‘The Big 4′ respectively could not justify such accolade as clubs in these groups experienced the greatest variations in efficiencies over the period researched. An indication that the state of English football has changed from what it was in 2006 and 2008 when Gerrard and Oberstone conducted their respective research.
The results from this study show that none of the EPL ‘Champions’ is CCR efficient during the period analysed. Though, the champions might have used their productive resources without wastage (CCR
The results further show that the dominant source of inefficiency is scale as all technically efficient (CCR = 1) clubs are also pure technical efficient (BCC = 1) due to their managerial capabilities and skills (Arsenal FC, Chelsea FC, Manchester City FC, Southampton FC, Swansea City FC, and Tottenham Hotspur FC). Other clubs that worth examining are those whose SE = 1, but BCC
The general conclusion is that there is a high degree of overall inefficiency among EPL clubs confirming the submissions of previous studies (Haas et al.,2004; Gerrard, 2010; Carmicheal et al., 2010; and Kern et al., 2012) and that only two seasons out of 11 seasons investigated had average efficiency scores above 50% with the best season being 2014/15 with 71.9% efficiency score. Though there were dimensional differences, and therefore some clubs experienced decreasing returns to scale (DRS), most English Premier League football clubs may be argued to be better managed in 2014/15 season as depicted by highest average efficiency score in all DEA models (BCC, CCR, and SE. Only Aston Villa football club remained consistent throughout the period researched. Aston Villa FC is therefore regarded as a “super-efficient” club.
Surprisingly, the big clubs (Gerrard’s “Big 4” and Oberstone’s “Top 4”) though were among the eight consistent clubs on EPL but could not maintain efficiency trend over the period analyzed as they were found to be efficient in either one or two seasons. The results further revealed that efficiency is not the absolute privilege of the EPL Champions as none of the EPL winners were CCR efficient in any of the 11 seasons analyzed.
Among the eight EPL clubs with 100% participation in EPL during the period investigated, Aston Villa FC remained the most consistent club with an average of 98.3% CCR efficiency score and almost zero (0) percent efficiency variation over the period researched. These indicate that Aston Villa FC is the most efficient EPL club during the research period.
DEA-BCC in its output orientation is recommended to be used when comparing sports clubs’ efficiency scores with Premier League ranking. The model has an average correlation coefficient of 69.69% if compared with EPL ranking. However, since no correlation exists between EPL rank and DEA-Scale efficiency scores, one might conclude that EPL does not measure scale efficiency.
From the extant literature, none of the previous studies has ever combined DEA methodology with Naturalistic Approach to bring the views of stakeholders to confirm or refute the findings of DEA approach. Therefore, future researchers might consider the advantages of this mixed method over the traditional DEA or stochastic frontier approaches.
References
Aglietta, M., W. Andreff & B. Drut, (2010) Floating European football clubs in the stock market. EconomiX, Available at http://economix.fr/pdf/dt/2010/WP_EcoX_2010-24.pdf [Accessed 14 January 2013].
Barros, C. P., A.G. Assaf & A.F. de Araujo Jr., (2011) Cost performance of Brazilian soccer clubs: A Bayesian varying efficiency distribution model. Economic Modelling, 28(6); pp. 2730-2735.
Carlsson-Wall, M., et al., (2016) Performance measurement systems and the enactment of different institutional logics: Insights from a football organization. Management Accounting Research, http://dx.doi.org/10.1016/j.mar.2016.01.006
Carmichael, F., McHale, I., & Thomas, D., (2010) Maintaining Market Position: Team Performance, Revenue, and Wage Expenditure in the English Premier League, Bulleting of Economic Research, doi: 10.1111/j.1467-8586.2009. 00340.x
Carmichael, F., Thomas, D. & Rossi, G., (2014) Production, efficiency, and corruption in Italian Serie A football. Journal of Sports Economics, p.1527002514551802.
Carrillo, M., and Jorge, J.M., (2016) A multi-objective DEA approach to ranking alternatives. Expert Systems with Applications, 50, pp. 130-139.
Charnes, A., Cooper, W. W., Gollany, B., Seiford, L., & Stutz, J., (1985) Foundations of data envelopment analysis for Pareto-Koopmans efficient empirical productions functions, Journal of Econometrics, 30: pp. 91-107.
Djordjevic, P. D., M. Vujosevic, & M. Martic, (2015) Measuring Efficiency of Football Teams by Multi-stage DEA Model, The Journal Technical Gazette, 22(3); pp. 763-770.
Frangopol, D.M., (2011) Life-cycle performance, management, and optimization of structural systems under uncertainty: accomplishments and challenges, Structure and Infrastructure Engineering, 7(6), pp. 389-413.
Frick, B. & R. Simmons, (2007) The Impact of Managerial Quality on Organizational Performance: Evidence from German Soccer. Working Paper Series.
Gasquez, R. & Royuela, V. (2016) The Determinants of International Football Success: A Panel Data Analysis of the Elo Rating, Social Science Quarterly, Vol. 97(2): pp. 125-141.
Gerrard, B. (2010) Analysing sporting efficiency using standardized win cost: Evidence from the FA Premier League (1995-2007). International Journal of Sports Science and Coaching, 5; pp. 13–35.
Haas, D. J., (2003) Productive Efficiency of English Football Teams – A Data Envelopment Analysis Approach, Managerial and Decision Economics, 24: pp. 403-410.
Haas, D. J., Kocher, M. G. & Sutter, M. (2004) Measuring efficiency of German football teams by data envelopment analysis. Central European Journal of Operation Research Economics, 12; pp. 251-268.
Halkos, G. & N. Tzeremes, (2011) Modelling regional welfare efficiency applying conditional full frontiers Spatial Economic Analysis, 6; pp. 451-471
Hoegele, D., S. L. Schmidt, & B. Torgler, (2014)Superstars as Drivers of Organizational Identification: Empirical Findings from Professional Soccer, Psychology & Marketing, (31); pp. 736–757.
Kern, A., Schwarzmann, M., & Wiedenegger, A., (2012) Measuring the efficiency of English Premier League football: A two-stage data envelopment analysis approach, Sport, Business, and Management: An International Journal, 2(3); pp.177-195.
Kulikova, L.I., and A.V. Goshunova, (2013) Measuring efficiency of the professional football club in contemporary studies. World Applied Sciences Journal, 25(2); pp. 247-257.
McNamara, P., S. Peck and A. Sasson, (2011) Competing Business Models, Value Creation and Appropriation in English Football. Long Range Planning, 46; pp. 475–487.
Mlambo, Z.L., (2010) A performance management system in the office of the premier of the Limpopo provincial government: a critical analysis, Doctoral dissertation, North-West University.
Oberstone J., (2009) “Differentiating the Top English Premier League Football Clubs from the Rest of the Pack: Identifying the Keys to Success,” Journal of Quantitative Analysis in Sports, 5(3); Article 10.
Paradi, J. C. & Zhu, H. (2013) “A Survey of Bank Branch Efficiency and Performance Research with Data Envelopment Analysis”. Omega, 41; pp. 61–79.
Soleimani-Damaneh, J., Hamidi, M., & Sajadi, N. (2011) Evaluating the Performance of Iranian Football Teams Utilizing Linear Programming,American Journal of Operations Research, 1; pp. 65-72.
Sulaiman, W. S. W., Almsafir, M. K. & Ahmad, Z. A., (2013) Job Performance: Relationship between Competency and Attitude towards Achieving Tnb’s Vision. Journal of Advanced Social Research, 3(1); pp. 1-11.
Villa, G. & S. Lozano, (2016) Assessing the Scoring Efficiency of a Football Match, European Journal of Operational Research.www.premierleague.com
Yadav, R.K. & Dabhade, N., (2013) Performance management system in Maharatna Companies (a leading public sector undertaking) of India–a case study of BHEL, Bhopal (MP). International Letters of Social and Humanistic Sciences, 4(49), pp. 49-69.
Zambom-Farraresi, F., L. I. Garcia-Cebrian, F. Lera-Lopez, & B. Iraizoz, (2015) Performance Evaluation in the UEFA Champions League, Journal of Sports Economics, pp. 1-23
Appendices
Appendix 1
DEA Window Analysis
| Season | 1 | 2 | 3 | 4 | 5 | 6 | 7 | 8 | 9 | 10 | 11 |
| Year | 04/05 | 05/06 | 06/07 | 07/08 | .. | .. | .. | 11/12 | 12/13 | 13/14 | 14/15 |
| Club 1 | |||||||||||
| Window 1 | ** | ** | ** | ||||||||
| Window 2 | ** | ** | ** | ||||||||
| “ | .. | .. | .. | ||||||||
| “ | .. | .. | .. | ||||||||
| Window 9 | ** | ** | ** | ||||||||
| Club 2 | |||||||||||
| Window 1 | ** | ** | ** | ||||||||
| Window 2 | ** | ** | ** | ||||||||
| “ | .. | .. | .. | ||||||||
| “ | .. | .. | .. | ||||||||
| Window 9 | ** | ** | ** | ||||||||
| Club n | |||||||||||
| Window 1 | ** | ** | ** | ||||||||
| Window 2 | ** | ** | ** | ||||||||
| “ | .. | .. | .. | ||||||||
| “ | .. | .. | .. | ||||||||
| Window 9 | ** | ** | ** |
Source: Adapted from DEA-Solver 4.2 manual released by BANXIA Frontier Analyst in (2013). Window analysis-relative efficiency scores (**)
Appendix 2
Research Population/Window Sample
| S/N | CLUB | 04/05 | 05/06 | 06/07 | 07/08 | 08/09 | 09/10 | 10/11 | 11/12 | 12/13 | 13/14 | 14/15 | REMARK | Participation % |
| 1 | Chelsea fc | * | * | * | * | * | * | * | * | * | * | * | WU | 100 |
| 2 | Arsenal fc | * | * | * | * | * | * | * | * | * | * | * | WU | 100 |
| 3 | Man. united fc | * | * | * | * | * | * | * | * | * | * | * | WU | 100 |
| 4 | Everton fc | * | * | * | * | * | * | * | * | * | * | * | WU | 100 |
| 5 | Liverpool fc | * | * | * | * | * | * | * | * | * | * | * | WU | 100 |
| 6 | Bolton wan. fc | * | * | * | * | * | * | * | * | n/a | n/a | n/a | NI | 72.7 |
| 7 | Middleborough fc | * | * | * | * | * | n/a | n/a | n/a | n/a | n/a | n/a | NI | 45.5 |
| 8 | Man. city fc | * | * | * | * | * | * | * | * | * | * | * | WU | 100 |
| 9 | Totten ham fc | * | * | * | * | * | * | * | * | * | * | * | WU | 100 |
| 10 | Aston villa fc | * | * | * | * | * | * | * | * | * | * | * | WU | 100 |
| 11 | Charlton at. fc | * | * | * | n/a | n/a | n/a | n/a | n/a | n/a | n/a | n/a | NI | 27.3 |
| 12 | Birmingham city fc | * | * | n/a | * | n/a | * | * | n/a | n/a | n/a | n/a | NI | 45.5 |
| 13 | Fulham fc | * | * | * | * | * | * | * | * | * | * | n/a | NI | 90.9 |
| 14 | Newcastle fc | * | * | * | * | * | n/a | * | * | * | * | * | NI | 90.9 |
| 15 | Blackburn r. fc | * | * | * | * | * | * | * | * | n/a | n/a | n/a | NI | 72.7 |
| 16 | Portsmouth fc | * | * | * | * | * | * | n/a | n/a | n/a | n/a | n/a | NI | 54.6 |
| 17 | West Bromwich fc | * | * | n/a | n/a | * | n/a | * | * | * | * | * | NI | 72.7 |
| 18 | Crystal palace fc | * | n/a | n/a | n/a | n/a | n/a | n/a | n/a | n/a | * | * | NI | 27.3 |
| 19 | Norwich city fc | * | n/a | n/a | n/a | n/a | n/a | n/a | * | * | * | n/a | NI | 36.4 |
| 20 | Southampton fc | * | n/a | n/a | n/a | n/a | n/a | n/a | n/a | * | * | * | NI | 36.4 |
| 21 | Wigan at. fc | n/a | * | * | * | * | * | * | * | * | n/a | n/a | NI | 72.7 |
| 22 | west ham united fc | n/a | * | * | * | * | * | * | n/a | * | * | * | NI | 81.8 |
| 23 | Sunderland fc | n/a | * | n/a | * | * | * | * | * | * | * | * | NI | 81.8 |
| 24 | Reading fc | n/a | n/a | * | * | n/a | n/a | n/a | n/a | * | n/a | n/a | NI | 27.3 |
| 25 | Sheffield fc | n/a | n/a | * | n/a | n/a | n/a | n/a | n/a | n/a | n/a | n/a | NI | 9.1 |
| 26 | Watford fc | n/a | n/a | * | n/a | n/a | n/a | n/a | n/a | n/a | n/a | n/a | NI | 9.1 |
| 27 | Derby county fc | n/a | n/a | n/a | * | n/a | n/a | n/a | n/a | n/a | n/a | n/a | NI | 9.1 |
| 28 | Stoke city fc | n/a | n/a | n/a | n/a | * | * | * | * | * | * | * | NI | 63.6 |
| 29 | Hull city fc | n/a | n/a | n/a | n/a | * | * | n/a | n/a | n/a | * | * | NI | 36.4 |
| 30 | Wolver Hampton fc | n/a | n/a | n/a | n/a | n/a | * | * | * | n/a | n/a | n/a | NI | 27.3 |
| 31 | Burnley fc | n/a | n/a | n/a | n/a | n/a | * | n/a | n/a | n/a | n/a | * | NI | 18.2 |
| 32 | Black pool fc | n/a | n/a | n/a | n/a | n/a | n/a | * | n/a | n/a | n/a | n/a | NI | 9.1 |
| 33 | Swansea city fc | n/a | n/a | n/a | n/a | n/a | n/a | n/a | * | * | * | * | NI | 36.4 |
| 34 | Queens p. rangers | n/a | n/a | n/a | n/a | n/a | n/a | n/a | * | * | n/a | * | NI | 27.3 |
| 35 | Cardiff city fc | n/a | n/a | n/a | n/a | n/a | n/a | n/a | n/a | n/a | * | n/a | NI | 9.1 |
| 36 | Leicester city fc | n/a | n/a | n/a | n/a | n/a | n/a | n/a | n/a | n/a | n/a | * | NI | 9.1 |
| TOTAL | 20 | 20 | 20 | 20 | 20 | 20 | 20 | 20 | 20 | 20 | 20 | 220 |
Note: ‘n/a’ indicates Not Available, * Represents participating club, NI indicates Not Included in window analysis, while WU represents window units. Therefore, only 8 clubs were included in ‘window’ analyses across 11 seasons given a sample size of 88.
Appendix 3
Correlation between inputs (X) and output (Y) in the Preliminary Model (three outputs/three inputs)
| Output
Input |
Year 1 | Year 2 | Year 3 | Year 4 | Year 5 | |||||||||||
| P/A | T/O | ROA | P/A | T/O | ROA | P/A | T/O | ROA | P/A | T/O | ROA | P/A | T/O | ROA | ||
| Wages & Salaries | 0.84 | 0.90 | 0.82 | 0.83 | 0.93 | 0.82 | 0.77 | 0.92 | 0.76 | 0.75 | 0.90 | 0.76 | 0.71 | 0.86 | 0.73 | |
| Assets Consumed | 0.73 | 0.68 | 0.71 | 0.61 | 0.66 | 0.62 | 0.66 | 0.83 | 0.66 | 0.65 | 0.80 | 0.64 | 0.61 | 0.66 | 0.65 | |
| Number of Employee | -0.11* | 0.04* | -0.09* | 0.01* | 0.02* | 0.03* | -0.24* | -0.07* | -0.25* | 0.07* | -0.05* | 0.06* | 0.20* | 0.07* | 0.18* | |
 Output Output
Input |
Year 6 | Year 7 | Year 8 | Year 9 | Year 10 | |||||||||||
| P/A | T/O | ROA | P/A | T/O | ROA | P/A | T/O | ROA | P/A | T/O | ROA | P/A | T/O | ROA | ||
| Wages & Salaries | 0.73 | 0.85 | 0.75 | 0.85 | 0.88 | 0.87 | 0.81 | 0.95 | 0.83 | 0.80 | 0.97 | 0.79 | 0.84 | 0.95 | 0.84 | |
| Assets Consumed | 0.60 | 0.69 | 0.60 | 0.62 | 0.57 | 0.65 | 0.68 | 0.61 | 0.69 | 0.73 | 0.94 | 0.72 | 0.59 | 0.73 | 0.61 | |
| Number of Employee | 0.09* | 0.07* | 0.05* | -0.03* | 0.06* | -0.06* | -0.02* | 0.08* | -0.09* | -0.05 | 0.00 | -0.05 | -0.12 | 0.01 | -0.19 | |
 Output Output
Input |
Year 11 | |||||||||||||||
| P/A | T/O | ROA | ||||||||||||||
| Wages & Salaries | 0.89 | 0.92 | 0.89 | |||||||||||||
| Assets Consumed | 0.72 | 0.85 | 0.70 | |||||||||||||
| Number of Employee | 0.02 | 0.17 | -0.25 | |||||||||||||
Appendix 4
Yearly average correlation between variables (X, Y)
| Year 1 | Year 2 | Year 3 | Year 4 | Year 5 | Year 6 | Year 7 | Year 8 | Year 9 | Year 10 | Year 11 | |
| Wages & Salaries | 0.85 | 0.86 | 0.82 | 0.80 | 0.77 | 0.78 | 0.87 | 0.86 | 0.85 | 0.88 | 0.90 |
| Assets Consumed | 0.71 | 0.63 | 0.72 | 0.70 | 0.64 | 0.63 | 0.61 | 0.66 | 0.80 | 0.64 | 0.76 |
| Number of Employees* | -0.05 | 0.02 | -0.19 | 0.03 | 0.09 | 0.07 | -0.01 | -0.01 | -0.03 | 0.07 | -0.02 |
| SEASON | 2004/2005 | 2005/2006 | 2006/2007 | |||||||||||||||
| DEA MODEL | Output Oriented | Input Oriented | Output Oriented | Input Oriented | Output Oriented | Input Oriented | ||||||||||||
| DMU | BCC | CCR | SE | BCC | CCR | SE | BCC | CCR | SE | BCC | CCR | SE | BCC | CCR | SE | BCC | CCR | SE |
| Arsenal FC | 1.000 | 0.207 | 0.207 | 1.000 | 0.207 | 0.207 | 1.000 | 0.218 | 0.218 | 1.000 | 0.218 | 0.218 | 1.000 | 0.240 | 0.240 | 1.000 | 0.240 | 0.240 |
| Aston Villa FC | 1.000 | 1.000 | 1.000 | 1.000 | 1.000 | 1.000 | 1.000 | 1.000 | 1.000 | 1.000 | 1.000 | 1.000 | 1.000 | 1.000 | 1.000 | 1.000 | 1.000 | 1.000 |
| Birmingham FC | 0.749 | 0.210 | 0.280 | 0.219 | 0.210 | 0.959 | 0.606 | 0.191 | 0.315 | 0.227 | 0.191 | 0.841 | ||||||
| Blackburn R. FC | 0.670 | 0.170 | 0.254 | 0.190 | 0.170 | 0.895 | 1.000 | 0.361 | 0.361 | 1.000 | 0.361 | 0.361 | 1.000 | 0.338 | 0.338 | 1.000 | 0.338 | 0.338 |
| B. Wanderers FC | 1.000 | 0.414 | 0.414 | 1.000 | 0.414 | 0.414 | 0.961 | 0.351 | 0.365 | 0.891 | 0.351 | 0.394 | 1.000 | 0.306 | 0.306 | 1.000 | 0.306 | 0.306 |
| Charlton A. FC | 0.754 | 0.208 | 0.276 | 0.208 | 0.208 | 1.000 | 0.756 | 0.241 | 0.319 | 0.445 | 0.241 | 0.542 | 0.528 | 0.142 | 0.269 | 0.195 | 0.142 | 0.728 |
| Chelsea FC | 1.000 | 0.147 | 0.147 | 1.000 | 0.147 | 0.147 | 1.000 | 0.177 | 0.177 | 1.000 | 0.177 | 0.177 | 1.000 | 0.163 | 0.163 | 1.000 | 0.163 | 0.163 |
| Crystal P. FC | 0.605 | 0.228 | 0.377 | 0.325 | 0.228 | 0.702 | ||||||||||||
| Everton FC | 1.000 | 0.286 | 0.286 | 1.000 | 0.286 | 0.286 | 0.797 | 0.234 | 0.294 | 0.577 | 0.234 | 0.406 | 0.859 | 0.227 | 0.264 | 0.603 | 0.227 | 0.377 |
| Fulham FC | 0.690 | 0.180 | 0.261 | 0.180 | 0.180 | 1.000 | 0.797 | 0.295 | 0.370 | 0.602 | 0.295 | 0.490 | 0.636 | 0.150 | 0.236 | 0.193 | 0.150 | 0.777 |
| Liverpool FC | 1.000 | 0.215 | 0.215 | 1.000 | 0.215 | 0.215 | 1.000 | 0.221 | 0.221 | 1.000 | 0.221 | 0.221 | 0.937 | 0.209 | 0.223 | 0.896 | 0.209 | 0.233 |
| Man. City FC | 0.937 | 0.391 | 0.417 | 0.631 | 0.391 | 0.620 | 0.815 | 0.234 | 0.287 | 0.584 | 0.234 | 0.401 | 0.666 | 0.190 | 0.285 | 0.271 | 0.190 | 0.701 |
| Man. United FC | 0.924 | 0.187 | 0.202 | 0.856 | 0.187 | 0.219 | 1.000 | 0.227 | 0.227 | 1.000 | 0.227 | 0.227 | 1.000 | 0.227 | 0.227 | 1.000 | 0.227 | 0.227 |
| Middlesbrough FC | 0.893 | 0.236 | 0.264 | 0.640 | 0.236 | 0.369 | 0.689 | 0.186 | 0.270 | 0.322 | 0.186 | 0.578 | 0.700 | 0.198 | 0.283 | 0.301 | 0.198 | 0.658 |
| Newcastle Utd. FC | 0.917 | 0.202 | 0.220 | 0.831 | 0.202 | 0.243 | 0.914 | 0.218 | 0.239 | 0.836 | 0.218 | 0.261 | 0.721 | 0.179 | 0.248 | 0.562 | 0.179 | 0.319 |
| Norwich FC | 0.612 | 0.252 | 0.412 | 0.348 | 0.252 | 0.724 | ||||||||||||
| Portsmouth FC | 0.666 | 0.196 | 0.294 | 0.235 | 0.196 | 0.834 | 0.681 | 0.249 | 0.366 | 0.249 | 0.249 | 1.000 | 0.850 | 0.220 | 0.259 | 0.556 | 0.220 | 0.396 |
| Reading FC | 0.990 | 0.331 | 0.334 | 0.976 | 0.331 | 0.339 | ||||||||||||
| Sheffield United FC | 0.693 | 0.280 | 0.404 | 0.308 | 0.280 | 0.909 | ||||||||||||
| Southampton FC | 0.534 | 0.169 | 0.317 | 0.222 | 0.169 | 0.761 | ||||||||||||
| Sunderland FC | 0.639 | 0.291 | 0.455 | 0.359 | 0.291 | 0.811 | ||||||||||||
| T. Hotspur FC | 1.000 | 1.000 | 1.000 | 1.000 | 1.000 | 1.000 | 1.000 | 1.000 | 1.000 | 1.000 | 1.000 | 1.000 | 0.947 | 0.268 | 0.283 | 0.905 | 0.268 | 0.296 |
| Watford FC | 0.534 | 0.293 | 0.549 | 0.523 | 0.293 | 0.560 | ||||||||||||
| W. Bromwich FC | 0.604 | 0.206 | 0.341 | 0.285 | 0.206 | 0.723 | 0.585 | 0.223 | 0.381 | 0.311 | 0.223 | 0.717 | ||||||
| West Ham Utd. FC | 0.963 | 0.348 | 0.361 | 0.912 | 0.348 | 0.382 | 0.627 | 0.169 | 0.270 | 0.256 | 0.169 | 0.660 | ||||||
| Wigan Athletic FC | 1.000 | 1.000 | 1.000 | 1.000 | 1.000 | 1.000 | 0.664 | 0.212 | 0.319 | 0.233 | 0.212 | 0.910 | ||||||
| AVERAGE* | 0.828 | 0.305 | 0.352 | 0.609 | 0.305 | 0.616 | 0.860 | 0.363 | 0.411 | 0.716 | 0.363 | 0.551 | 0.818 | 0.267 | 0.325 | 0.639 | 0.267 | 0.507 |
Appendix 5
DEA-BCC; CCR; and SE; Efficiency Scores using both Output and Input Orientations
| SEASON | 2007/2008 | 2008/2009 | 2009/2010 | |||||||||||||||
| DEA MODEL | Output Oriented | Input Oriented | Output Oriented | Input Oriented | Output Oriented | Input Oriented | ||||||||||||
| DMU | BCC | CCR | SE | BCC | CCR | SE | BCC | CCR | SE | BCC | CCR | SE | BCC | CCR | SE | BCC | CCR | SE |
| Arsenal FC | 1.000 | 0.276 | 0.276 | 1.000 | 0.276 | 0.276 | 1.000 | 0.276 | 0.276 | 1.000 | 0.276 | 0.276 | 1.000 | 0.351 | 0.351 | 1.000 | 0.351 | 0.351 |
| Aston Villa FC | 1.000 | 1.000 | 1.000 | 1.000 | 1.000 | 1.000 | 1.000 | 1.000 | 1.000 | 1.000 | 1.000 | 1.000 | 1.000 | 1.000 | 1.000 | 1.000 | 1.000 | 1.000 |
| Birmingham FC | 0.546 | 0.259 | 0.474 | 0.424 | 0.259 | 0.611 | 0.725 | 0.231 | 0.319 | 0.294 | 0.231 | 0.786 | ||||||
| Blackburn R. FC | 0.854 | 0.262 | 0.307 | 0.271 | 0.262 | 0.967 | 0.614 | 0.213 | 0.347 | 0.316 | 0.213 | 0.674 | 0.729 | 0.240 | 0.329 | 0.287 | 0.240 | 0.837 |
| B. Wanderers FC | 0.544 | 0.184 | 0.338 | 0.270 | 0.184 | 0.682 | 0.577 | 0.159 | 0.276 | 0.240 | 0.159 | 0.663 | 0.793 | 0.532 | 0.671 | 0.561 | 0.532 | 0.948 |
| Burnley FC | ||||||||||||||||||
| Chelsea FC | 1.000 | 0.164 | 0.164 | 1.000 | 0.164 | 0.164 | 0.942 | 0.140 | 0.149 | 0.661 | 0.140 | 0.212 | 1.000 | 0.187 | 0.187 | 1.000 | 0.187 | 0.187 |
| Derby County FC | 0.510 | 0.257 | 0.504 | 0.400 | 0.257 | 0.643 | ||||||||||||
| Everton FC | 0.948 | 0.279 | 0.294 | 0.802 | 0.279 | 0.348 | 0.870 | 0.204 | 0.235 | 0.272 | 0.204 | 0.750 | 0.940 | 0.479 | 0.510 | 0.641 | 0.479 | 0.747 |
| Fulham FC | 0.526 | 0.183 | 0.348 | 0.263 | 0.183 | 0.696 | 0.741 | 0.178 | 0.240 | 0.208 | 0.178 | 0.856 | 0.643 | 0.193 | 0.300 | 0.217 | 0.193 | 0.889 |
| Hull City FC | 0.546 | 0.282 | 0.517 | 0.469 | 0.282 | 0.601 | 0.440 | 0.185 | 0.421 | 0.316 | 0.185 | 0.585 | ||||||
| Liverpool FC | 0.927 | 0.245 | 0.264 | 0.862 | 0.245 | 0.284 | 0.978 | 0.207 | 0.212 | 0.930 | 0.207 | 0.223 | 0.861 | 0.186 | 0.216 | 0.663 | 0.186 | 0.281 |
| Man. City FC | 0.756 | 0.210 | 0.278 | 0.292 | 0.210 | 0.719 | 0.602 | 0.123 | 0.204 | 0.147 | 0.123 | 0.837 | 0.785 | 0.117 | 0.149 | 0.284 | 0.117 | 0.412 |
| Man. United FC | 1.000 | 0.244 | 0.244 | 1.000 | 0.244 | 0.244 | 1.000 | 0.222 | 0.222 | 1.000 | 0.222 | 0.222 | 1.000 | 0.210 | 0.210 | 1.000 | 0.210 | 0.210 |
| Middlesbrough FC | 0.653 | 0.291 | 0.446 | 0.415 | 0.291 | 0.701 | 0.497 | 0.251 | 0.505 | 0.478 | 0.251 | 0.525 | ||||||
| Newcastle Utd. FC | 0.663 | 0.196 | 0.296 | 0.423 | 0.196 | 0.463 | 0.534 | 0.145 | 0.272 | 0.172 | 0.145 | 0.843 | ||||||
| Portsmouth FC | 0.789 | 0.191 | 0.242 | 0.191 | 0.191 | 1.000 | ||||||||||||
| Reading FC | 0.545 | 0.229 | 0.420 | 0.336 | 0.229 | 0.682 | ||||||||||||
| Stoke City FC | 0.673 | 0.241 | 0.358 | 0.332 | 0.241 | 0.726 | 0.680 | 0.213 | 0.313 | 0.280 | 0.213 | 0.761 | ||||||
| Sunderland FC | 0.590 | 0.238 | 0.403 | 0.282 | 0.238 | 0.844 | 0.493 | 0.153 | 0.310 | 0.194 | 0.153 | 0.789 | 0.600 | 0.148 | 0.247 | 0.190 | 0.148 | 0.779 |
| T. Hotspur FC | 0.819 | 0.279 | 0.341 | 0.643 | 0.279 | 0.434 | 1.000 | 1.000 | 1.000 | 1.000 | 1.000 | 1.000 | 0.939 | 0.213 | 0.227 | 0.786 | 0.213 | 0.271 |
| W. Bromwich FC | 0.472 | 0.179 | 0.379 | 0.314 | 0.179 | 0.570 | ||||||||||||
| West Ham Utd. FC | 0.654 | 0.160 | 0.245 | 0.169 | 0.160 | 0.947 | 0.652 | 0.133 | 0.204 | 0.148 | 0.133 | 0.899 | 0.498 | 0.164 | 0.329 | 0.203 | 0.164 | 0.808 |
| Wigan Athletic FC | 0.588 | 0.182 | 0.310 | 0.272 | 0.182 | 0.669 | 0.638 | 0.170 | 0.267 | 0.234 | 0.170 | 0.727 | 0.521 | 0.165 | 0.230 | 0.290 | 0.165 | 0.569 |
| Wolverhampton FC | 1.000 | 1.000 | 1.000 | 1.000 | 1.000 | 1.000 | ||||||||||||
| AVERAGE* | 0.746 | 0.267 | 0.360 | 0.516 | 0.267 | 0.619 | 0.728 | 0.278 | 0.367 | 0.480 | 0.278 | 0.652 | 0.786 | 0.323 | 0.389 | 0.556 | 0.323 | 0.635 |
| SEASON | 2010/2011 | 2011/2012 | 2012/2013 | |||||||||||||||
| DEA MODEL | Output Oriented | Input Oriented | Output Oriented | Input Oriented | Output Oriented | Input Oriented | ||||||||||||
| DMU | BCC | CCR | SE | BCC | CCR | SE | BCC | CCR | SE | BCC | CCR | SE | BCC | CCR | SE | BCC | CCR | SE |
| Arsenal FC | 1.000 | 1.000 | 1.000 | 1.000 | 1.000 | 1.000 | 1.000 | 1.000 | 1.000 | 1.000 | 1.000 | 1.000 | 1.000 | 0.220 | 0.220 | 1.000 | 0.220 | 0.220 |
| Aston Villa FC | 1.000 | 1.000 | 1.000 | 1.000 | 1.000 | 1.000 | 1.000 | 1.000 | 1.000 | 1.000 | 1.000 | 1.000 | 1.000 | 1.000 | 1.000 | 1.000 | 1.000 | 1.000 |
| Birmingham FC | 0.682 | 0.205 | 0.301 | 0.252 | 0.205 | 0.813 | ||||||||||||
| Blackburn R. FC | 0.763 | 0.343 | 0.450 | 0.348 | 0.343 | 0.986 | 0.559 | 0.378 | 0.676 | 0.409 | 0.378 | 0.924 | ||||||
| Blackpool FC | 1.000 | 1.000 | 1.000 | 1.000 | 1.000 | 1.000 | ||||||||||||
| B. Wanderers FC | 0.769 | 0.208 | 0.271 | 0.208 | 0.208 | 1.000 | 0.613 | 0.332 | 0.542 | 0.438 | 0.332 | 0.758 | ||||||
| Chelsea FC | 0.963 | 0.202 | 0.210 | 0.691 | 0.202 | 0.292 | 0.966 | 0.214 | 0.222 | 0.853 | 0.214 | 0.251 | 0.973 | 0.181 | 0.186 | 0.959 | 0.181 | 0.189 |
| Everton FC | 0.950 | 0.628 | 0.661 | 0.778 | 0.628 | 0.807 | 0.869 | 0.461 | 0.531 | 0.730 | 0.461 | 0.632 | 1.000 | 0.397 | 0.397 | 1.000 | 0.397 | 0.397 |
| Fulham FC | 0.839 | 0.317 | 0.378 | 0.343 | 0.317 | 0.924 | 0.818 | 0.317 | 0.388 | 0.670 | 0.317 | 0.473 | 0.684 | 0.170 | 0.249 | 0.268 | 0.170 | 0.634 |
| Liverpool FC | 0.876 | 0.190 | 0.217 | 0.757 | 0.190 | 0.251 | 0.814 | 0.715 | 0.878 | 0.722 | 0.715 | 0.990 | 0.979 | 0.197 | 0.201 | 0.965 | 0.197 | 0.204 |
| Man. City FC | 0.913 | 0.111 | 0.122 | 0.600 | 0.111 | 0.185 | 1.000 | 0.195 | 0.195 | 1.000 | 0.195 | 0.195 | 1.000 | 0.186 | 0.186 | 1.000 | 0.186 | 0.186 |
| Man. United FC | 1.000 | 0.225 | 0.225 | 1.000 | 0.225 | 0.225 | 1.000 | 0.368 | 0.368 | 1.000 | 0.368 | 0.368 | 1.000 | 0.240 | 0.240 | 1.000 | 0.240 | 0.240 |
| Newcastle Utd. FC | 0.906 | 0.841 | 0.928 | 0.843 | 0.841 | 0.998 | 1.000 | 0.635 | 0.635 | 1.000 | 0.635 | 0.635 | 0.835 | 0.313 | 0.375 | 0.587 | 0.313 | 0.533 |
| Norwich FC | 0.931 | 0.665 | 0.714 | 0.893 | 0.665 | 0.745 | 0.778 | 0.262 | 0.337 | 0.341 | 0.262 | 0.768 | ||||||
| Queens Park R. FC | 0.681 | 0.514 | 0.755 | 0.524 | 0.514 | 0.981 | 0.872 | 0.310 | 0.356 | 0.699 | 0.310 | 0.443 | ||||||
| Reading FC | 0.522 | 0.187 | 0.359 | 0.257 | 0.187 | 0.728 | ||||||||||||
| Southampton FC | 0.756 | 0.255 | 0.337 | 0.256 | 0.255 | 0.996 | ||||||||||||
| Stoke City FC | 0.851 | 0.304 | 0.357 | 0.481 | 0.304 | 0.632 | 0.760 | 0.358 | 0.471 | 0.528 | 0.358 | 0.678 | 0.688 | 0.175 | 0.254 | 0.211 | 0.175 | 0.829 |
| Sunderland FC | 0.761 | 0.184 | 0.242 | 0.184 | 0.184 | 1.000 | 0.715 | 0.275 | 0.385 | 0.435 | 0.275 | 0.632 | 0.665 | 0.171 | 0.257 | 0.180 | 0.171 | 0.950 |
| Swansea City FC | 1.000 | 1.000 | 1.000 | 1.000 | 1.000 | 1.000 | 0.858 | 0.468 | 0.545 | 0.596 | 0.468 | 0.785 | ||||||
| T. Hotspur FC | 0.899 | 0.209 | 0.233 | 0.758 | 0.209 | 0.276 | 0.967 | 0.377 | 0.390 | 0.936 | 0.377 | 0.403 | 1.000 | 0.276 | 0.276 | 1.000 | 0.276 | 0.276 |
| W. Bromwich FC | 0.856 | 0.438 | 0.512 | 0.471 | 0.438 | 0.930 | 0.816 | 0.558 | 0.684 | 0.742 | 0.558 | 0.752 | 1.000 | 1.000 | 1.000 | 1.000 | 1.000 | 1.000 |
| West Ham Utd. FC | 0.600 | 0.188 | 0.313 | 0.205 | 0.188 | 0.917 | 0.795 | 0.220 | 0.277 | 0.452 | 0.220 | 0.497 | ||||||
| Wigan Athletic FC | 0.749 | 0.255 | 0.341 | 0.289 | 0.255 | 0.882 | 0.839 | 0.464 | 0.553 | 0.745 | 0.464 | 0.623 | 0.657 | 0.254 | 0.387 | 0.288 | 0.254 | 0.882 |
| Wolverhampton FC | 0.772 | 0.361 | 0.468 | 0.378 | 0.361 | 0.955 | 0.547 | 0.289 | 0.528 | 0.408 | 0.289 | 0.708 | ||||||
| AVERAGE* | 0.858 | 0.411 | 0.462 | 0.579 | 0.411 | 0.754 | 0.845 | 0.506 | 0.596 | 0.752 | 0.506 | 0.687 | 0.853 | 0.324 | 0.372 | 0.653 | 0.324 | 0.588 |
| SEASON | 2013/2014 | 2014/2015 | ||||||||||
| Output Oriented | Input Oriented | Output Oriented | Input Oriented | |||||||||
| DMU | BCC | CCR | SE | BCC | CCR | SE | BCC | CCR | SE | BCC | CCR | SE |
| Arsenal FC | 1.000 | 0.249 | 0.249 | 1.000 | 0.249 | 0.249 | 1.000 | 0.529 | 0.529 | 1.000 | 0.529 | 0.529 |
| Aston Villa FC | 1.000 | 1.000 | 1.000 | 1.000 | 1.000 | 1.000 | 1.000 | 1.000 | 1.000 | 1.000 | 1.000 | 1.000 |
| Burnley FC | 1.000 | 1.000 | 1.000 | 1.000 | 1.000 | 1.000 | ||||||
| Cardiff City FC | 0.543 | 0.157 | 0.289 | 0.198 | 0.157 | 0.793 | ||||||
| Chelsea FC | 0.964 | 0.157 | 0.163 | 0.917 | 0.157 | 0.171 | 1.000 | 0.546 | 0.546 | 1.000 | 0.546 | 0.546 |
| Crystal P. FC | 0.798 | 0.348 | 0.436 | 0.605 | 0.348 | 0.575 | 0.877 | 0.803 | 0.916 | 0.847 | 0.803 | 0.948 |
| Everton FC | 1.000 | 0.343 | 0.343 | 1.000 | 0.343 | 0.343 | 0.812 | 0.650 | 0.800 | 0.755 | 0.650 | 0.861 |
| Fulham FC | 0.540 | 0.139 | 0.257 | 0.154 | 0.139 | 0.903 | ||||||
| Hull City FC | 0.675 | 0.240 | 0.356 | 0.240 | 0.240 | 1.000 | 0.695 | 0.604 | 0.869 | 0.618 | 0.604 | 0.977 |
| Leicester FC | 0.989 | 0.956 | 0.967 | 0.972 | 0.956 | 0.984 | ||||||
| Liverpool FC | 1.000 | 1.000 | 1.000 | 1.000 | 1.000 | 1.000 | 0.988 | 0.508 | 0.514 | 0.982 | 0.508 | 0.517 |
| Man. City FC | 1.000 | 0.161 | 0.161 | 1.000 | 0.161 | 0.161 | 1.000 | 0.559 | 0.559 | 1.000 | 0.559 | 0.559 |
| Man. United FC | 0.788 | 0.142 | 0.180 | 0.668 | 0.142 | 0.213 | 0.900 | 0.531 | 0.590 | 0.783 | 0.531 | 0.678 |
| Newcastle Utd. FC | 0.774 | 0.265 | 0.342 | 0.542 | 0.265 | 0.489 | 0.831 | 0.668 | 0.804 | 0.792 | 0.668 | 0.843 |
| Norwich FC | 0.612 | 0.169 | 0.276 | 0.194 | 0.169 | 0.871 | ||||||
| Southampton FC | 0.849 | 0.265 | 0.312 | 0.699 | 0.265 | 0.379 | 1.000 | 0.966 | 0.966 | 1.000 | 0.966 | 0.966 |
| Stoke City FC | 0.776 | 0.291 | 0.375 | 0.559 | 0.291 | 0.521 | 1.000 | 1.000 | 1.000 | 1.000 | 1.000 | 1.000 |
| Sunderland FC | 0.624 | 0.154 | 0.267 | 0.154 | 0.154 | 1.000 | 0.662 | 0.413 | 0.624 | 0.442 | 0.413 | 0.934 |
| Swansea City FC | 0.677 | 0.206 | 0.304 | 0.286 | 0.206 | 0.720 | 1.000 | 0.962 | 0.962 | 1.000 | 0.962 | 0.962 |
| T. Hotspur FC | 0.910 | 0.218 | 0.240 | 0.840 | 0.218 | 0.260 | 1.000 | 0.791 | 0.791 | 1.000 | 0.791 | 0.791 |
| W. Bromwich FC | 0.628 | 0.610 | 0.971 | 0.643 | 0.610 | 0.949 | 0.812 | 0.681 | 0.839 | 0.711 | 0.681 | 0.958 |
| West Ham Utd. FC | 0.705 | 0.186 | 0.264 | 0.285 | 0.186 | 0.653 | 0.869 | 0.693 | 0.797 | 0.804 | 0.693 | 0.862 |
| Queens Park R. FC | 0.688 | 0.509 | 0.740 | 0.576 | 0.509 | 0.884 | ||||||
| AVERAGE* | 0.793 | 0.315 | 0.389 | 0.599 | 0.315 | 0.613 | 0.906 | 0.719 | 0.791 | 0.864 | 0.719 | 0.840 |
[2] The Determinants of International Football Success: A Panel Data Analysis of the Elo Rating.
Cite This Work
To export a reference to this article please select a referencing stye below:
Related Services
View all


Related Content
All TagsContent relating to: "Business Analysis"
Business Analysis is a research discipline that looks to identify business needs and recommend solutions to problems within a business. Providing solutions to identified problems enables change management and may include changes to things such as systems, process, organisational structure etc.
Related Articles

DMCA / Removal Request
If you are the original writer of this dissertation and no longer wish to have your work published on the UKDiss.com website then please: