Dissertation on Energy Piles for Geothermal Energy
Info: 11442 words (46 pages) Dissertation
Published: 17th Nov 2021
Tagged: EngineeringEnergy
An Investigation into the Mobilised Bearing Capacity and Head Displacement of Energy Piles
Abstract
Energy piles offer a promising new method of reducing CO2 emissions by utilising geothermal energy to heat and cool buildings. Despite an increase in implementation over recent years a lack of understanding of energy pile behaviour due to thermal effects remains, with current designs either based upon the structural requirements alone or exacerbated safety factors. Existing literature has demonstrated that thermal loading has a significant impact on pile strains. However, little investigation has been conducted into the effect of thermal loading on the mobilised bearing capacity, or pile head displacements which are imperative to the design integrity of the pile and founded superstructure.
This dissertation aimed to assess if varying material properties and increasing thermal loads affect the pile factor of safety and head displacements. A parametric study was conducted where a finite element model, validated against a known field experiment, tested varying values of pile length, pile diameter, soil shear modulus and soil strength under thermal loading. The results of the testing indicated that while the factor of safety showed little variation, pile head displacements were quite sensitive to thermal loads. It was further demonstrated that pile length was the most critical property, as results showed the most significant trend in this data.
It is clear from this research that further industry understanding and formalised design codes are required for the design of energy piles, as the current approach does not account for the substantial change in pile head displacements indicated by this study.
Click to expand Table of Contents and Symbols
Contents
1 Introduction
2 Literature Review
2.1 Energy Piles
2.2 Framework
2.3 Field Testing
2.4 Numerical Modelling
3 Numerical Model
3.1 Model Description
3.2 Validation
4 Parametric Study
4.1 Analysis Arrangement
4.2 Results
4.3 Critical Evaluation
5 Conclusion
6 References
List of Figures
Figure 1: Annual Relationship between Surface Air Temperature and Ground Temperature, (Preene & Prowrie, 2009)
Figure 2: UK Energy Pile Installations 2005-10, (Laloui & Donna, 2011)
Figure 3: Typical Energy Pile Arrangement, (Laloui & Donna, 2011)
Figure 4: Thermal Behaviour Pile Profiles (a) unrestrained heating (b) unrestrained cooling (c) fixed heating (d) fixed cooling, (Bourne-Webb, et al., 2012)
Figure 5: Thermal Behaviour Pile Profiles (a) shaft restraint heating (b) shaft restraint cooling (c) shaft and end restraint heating (d) shaft and end restraint cooling, (Bourne-Webb, et al., 2012)
Figure 6: Mechanical Behaviour Pile Profile
Figure 7: Thermomechanical Behaviour Pile Profiles (a) shaft restraint heating (b) shaft restraint cooling (c) shaft and end restraint heating (d) shaft and end restraint cooling, (Bourne-Webb, et al., 2012)
Figure 8: Strain Profiles (a) Lambeth College (b) Lausanne
Figure 9: T-z Beam Spring Method
Figure 10: T-z Load Transfer Curve
Figure 11: Lambeth College Test Pile, (Bourne-Webb, et al., 2009)
Figure 12: Lambeth College Test Temperature Variation
Figure 13: Verification Mechanical Loading Results
Figure 14: Verification Heating Results
Figure 15: Verification Cooling Results
Figure 16: Finite Element Results for E=40MPa
Figure 17: Finite Element Model Varying Properties
Figure 18: Test A – Strain Profiles (a) Heating (b) Cooling
Figure 19: Test A – Mobilised Shaft Friction Profiles (a) Heating (b) Cooling
Figure 20: Test A – Pile Head Displacements due to Thermal Loading only
Figure 21: Test A – Factor of Safety
Figure 22: Test B – Pile Head Displacement due to Thermal Loading only
Figure 23: Test B – Factor of Safety
Figure 24: Test C – Pile Head Displacements due to Thermal Loading only
Figure 25: Test C – Factor of Safety
Figure 26: Test D – Pile Head Displacement due to Thermal Loading only
Figure 27: Test D – Factor of Safety
Figure 28: Test E – Pile Head Displacements due to Thermal Loading only
Figure 29: Test E – Factor of Safety
Figure 30: Test F – Pile Head Displacement due to Thermal Loading only
Figure 31: Test F – Factor of Safety
Figure 32: Test G – Pile Head Displacements due to Thermal Loading only
Figure 33: Test G – Factor of Safety
Figure 34: Test H – Pile Head Displacement due to Thermal Loading only
Figure 35: Test H – Factor of Safety
Figure 36: Test I – Pile Head Displacement due to Thermal Loading only
Figure 37: Test I – Factor of Safety
Figure 38: Test J – Pile Displacement due to Thermal Loading only
Figure 39: Test J – Factor of Safety
Figure 40: Test K – Pile Head Displacement due to Thermal Loading only
Figure 41: Test K – Factor of Safety
Figure 42: Test L – Pile Head Displacement due to Thermal Loading
Figure 43: Test L – Factor of Safety
Figure 44: Test M – Pile Displacement due to Thermal Loading only
Figure 45: Test M – Factor of Safety
Figure 46: Test N – Pile Displacement due to Thermal Loading only
Figure 47: Test N – Factor of Safety
Figure 48: Test O – Pile Displacement due to Thermal Loading only
Figure 49: Test O – Factor of Safety
Figure 50: Test P – Pile Head Displacement due to Thermal Loading only
Figure 51: Test P – Factor of Safety
Figure 52: Factor of Safety Change for Increasing Loading
Figure 53: Pile Head Displacement Change for Increasing Loading (a) 80% (b) 90%
Figure 54: Factor of Safety for Varied Pile Lengths
Figure 55: Pile Head Displacement under Thermal Loading Only for Varied Pile Lengths
Figure 56: Factor of Safety for Varied Pile Diameters
Figure 57: Pile Head Displacement under Thermal Loading Only for Varied Pile Diameters
Figure 58: Factor of Safety for Varied Soil Shear Modulus
Figure 59: Pile Head Displacement under Thermal Loading Only for Varied Soil Shear Modulus
Figure 60: Factor of Safety for Varied Soil Strength
Figure 61: Pile Head Displacement under Thermal Loading Only for Varied Soil Strength
List of Tables
Table 1: Verification Model Loading
Table 2: Verification Model Pile Properties
Table 3: Verification Model Soil Properties
Table 4: Model Varying Properties Values
Table 5: Parametric Study Constant Properties
Table 6: Test A – Input Values
Table 7: Test B – Input Values
Table 8: Test C – Input Values
Table 9: Test D – Input Values
Table 10: Test E – Input Values
Table 11: Test F – Input Values
Table 12: Test G – Input Values
Table 13: Test H – Input Values
Table 14: Test I – Input Values
Table 15: Test J – Input Values
Table 16: Test K – Input Values
Table 17: Test L – Input Values
Table 18: Test M – Input Values
Table 19: Test N – Input Values
Table 20: Test O – Input Values
Table 21: Test P – Input Values
Table 22: Summary of Results
List of Symbols
| GSHP | Ground Source Heat Pump |
| αc | Coefficient of thermal expansion |
| ΔT | Temperature Change |
| εT-Free | Unrestrained pile strains |
| εT-Fixed | Fixed pile strains |
| εT-Obs | Observed pile strains |
| εT-Rest | Restrained pile strains |
| PT | Thermal loading |
| E | Young’s Modulus |
| A | Pile cross-sectional area |
| kEL | Local beam element stiffness matrix |
| kspring | Local spring element stiffness matrix |
| t | Shaft friction |
| z | Pile displacements (t-z model) |
| tm,undrained | Maximum shaft friction undrained soil |
| tm,drained | Maximum shaft friction drained soil |
| α | Soil adhesion factor |
| Su | Soil undrained shear strength |
| As | Area of pile in contact with soil |
| k0 | Coefficient of earth pressure |
| ϕ’ | Soil friction angle |
| σ’v | Effective vertical soil stress |
| km | Maximum stiffness for displacement |
| G | Soil shear modulus |
| r | Pile radius |
| L | Pile length |
| ν | Poisson’s Ratio |
| γ | Unit weight of soil |
| h | Hardening parameter |
| d | Degradation parameter (t-z model) |
| k | Global stiffness matrix |
| kp | Global pile stiffness matrix |
| ks | Global soil stiffness matrix |
| P | Mechanical load |
| u | Displacements |
| c’ | Soil cohesion factor |
| d | Pile diameter |
| Nc | Empirical factor |
| Qult | Ultimate pile bearing capacity |
| Qmob | Mobilised pile bearing capacity |
| Ab | Area of pile base |
1 Introduction
Geothermal energy is heat which is stored within the ground. It is considered a good source of renewable energy and is receiving increasing interest with the ever-growing pressures regarding carbon reductions. One method of accessing this energy is with a ground source heat pump system (GSHP). The GSHP involves laying a series of tubes below the ground surface, which allow for the circulation of a fluid. As the ground remains at a constant temperature throughout the year, as shown in Figure 1, a transfer of heat energy takes place with the fluid heated or cooled depending on the seasonal surface temperature. This energy can be exchanged using a heat pump to meet the heating requirements of buildings.
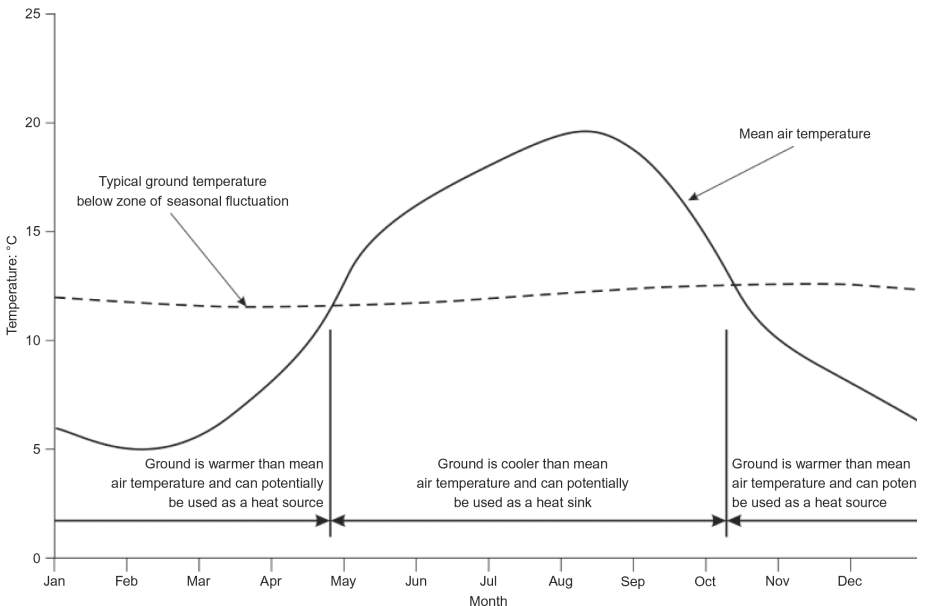
Figure 1: Annual Relationship between Surface Air Temperature and Ground Temperature, (Preene & Prowrie, 2009)
A more recent innovation the integration of the GSHP with foundation piles. This system is termed ‘energy pile’ and, in theory, is an excellent idea as it utilises an element which is already structurally required, resulting in a significant reduction in construction costs. This has led to an increase in energy pile installations in recent years, as shown in Figure 2.
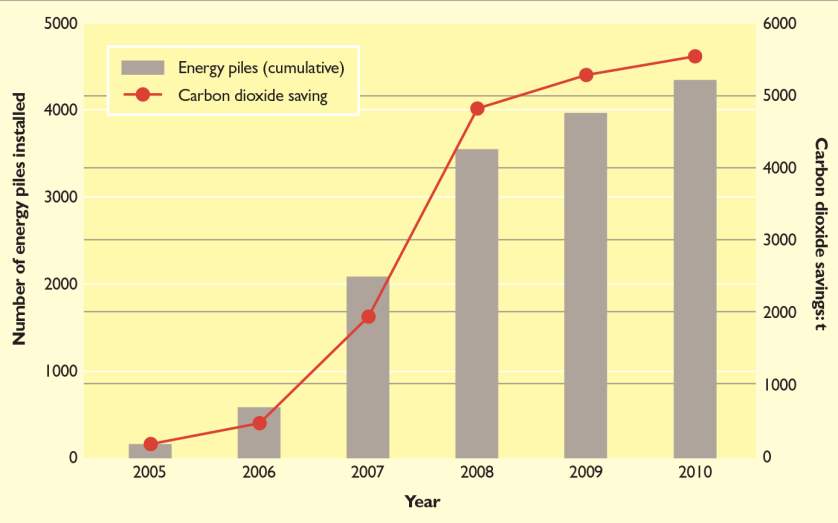
Figure 2: UK Energy Pile Installations 2005-10, (Laloui & Donna, 2011)
However, concerns have been raised as to the effects of the heating and cooling cycles on the pile structure. Without a comprehensive understanding of the energy pile behaviour, it is hypothesised that the structure expansion and contraction associated with the temperature cycles may have a detrimental effect on the pile-soil interaction and the overall bearing capacity of the foundation.
This project aims to expand the current understanding of energy pile behaviour, specifically the effect of varied properties and temperature cycles on the mobilised bearing capacity and head displacements. The objectives are detailed below:
- Research current understanding of energy pile behaviour
- Validate a finite element model against existing field data
- Perform a parametric study using a finite element model in order to simulate energy pile behaviour under different parameters
- Analyse produced results in order to form an understanding of the energy pile behaviour throughout testing
2 Literature Review
This section aims to explain current understanding of energy piles and identify gaps in the knowledge which require further study.
2.1 Energy Piles
Energy pile installation involves the incorporation of U-shaped tubes into the pile structure which is usually achieved by attaching them to the reinforcement, as shown in Figure 3.
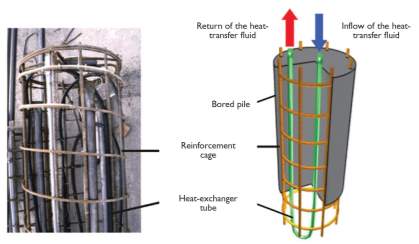
Figure 3: Typical Energy Pile Arrangement, (Laloui & Donna, 2011)
This simple system has shown to produce 20-100W per m of pile of renewable heating energy, which is popular with developers as it assists in meeting the 10% on site renewable energy obligation enforced for medium and large scale developments in the UK (Laloui & Donna, 2011; Boennec, 2008). Despite a significant increase in the number of energy piles installed around the world, concerns remain regarding their structural integrity (Laloui & Donna, 2011). This stems predominantly from a lack of understanding in the behaviour of the piles during the heating and cooling cycles associated with their geothermal applications (Laloui & Donna, 2011). Furthermore, few design codes exist with those that do based upon limited field testing (Laloui & Donna, 2011). Today most energy piles are either designed based purely upon their structural requirements, or with significantly increased safety factors (Ouyang, et al., 2011; Abuel-Naga, et al., 2015). Neither approach specifically addresses thermal behaviour, leading to potentially dangerous or over conservative designs. Therefore, the development of standardised design practices and wider industry understanding is crucial for the successful widespread usage of energy piles.
2.2 Framework
A framework for the behaviour of energy piles was first suggested by Bourne-Webb et al. (2009) which was further developed by Bourne-Webb et al. (2012) and Amatya et al. (2012). Energy piles are subjected to two loads; mechanical and thermal. Mechanical loading is specified by the above ground superstructure, the traditional application of piles. Thermal loading induced by the heating or cooling effects associated with the geothermal applications. Each load has a specific effect on the behaviour of a pile and each will now be analyses separately before their combined effects are considered.
2.2.1 Thermal Loading
First, the pile response under thermal loading only is considered. If the pile is unrestrained it will expand or contract in proportion to the coefficient of thermal expansion (αc) and temperature change (ΔT):
εT-Free=αc∆T
(1)
Thus, when the pile is heated (+ΔT) it expands and contracts when cooled (-ΔT). Similarly, under fully fixed conditions, where movement is restricted in all directions, thermal strains will be induced within the pile (εT-Fixed). Under heating conditions, where the pile wants to expand compressive strains will be induced and tensile strains will be induced where the pile wishes to contract under cooling, as illustrated in Figure 4.
εT-Fixed
εT-Fixed
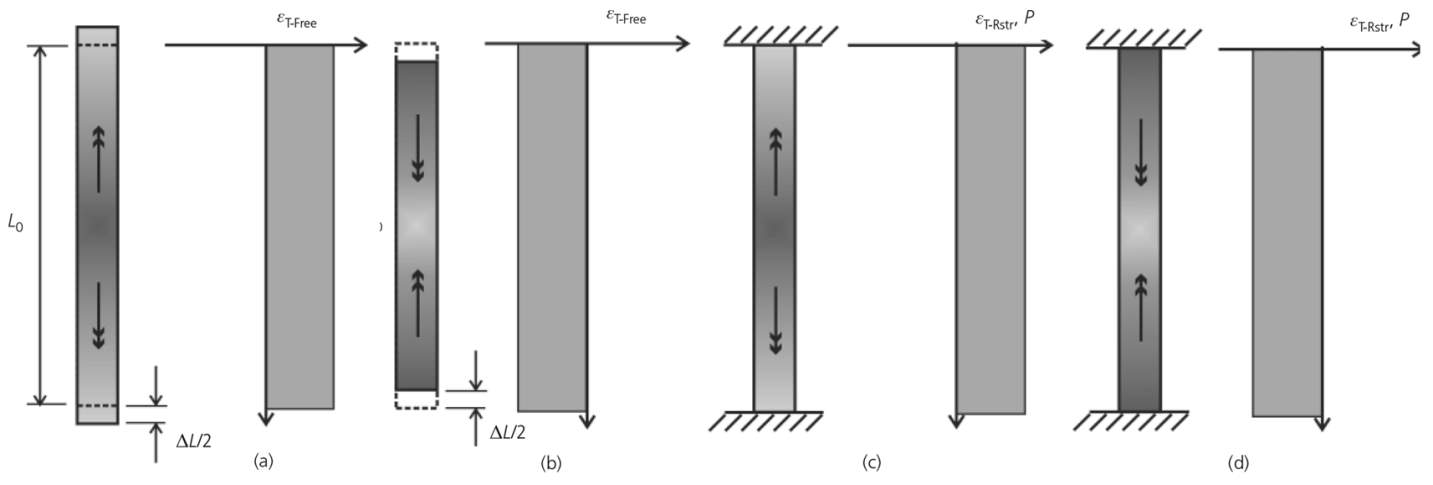
Figure 4: Thermal Behaviour Pile Profiles (a) unrestrained heating (b) unrestrained cooling (c) fixed heating (d) fixed cooling, (Bourne-Webb, et al., 2012)
However, in reality, a pile is unlikely to act either as a free body or fully restrained. It will be somewhere in between due to partially restrained conditions from the soil surrounding the pile. The degree of pile restraint will depend upon the individual site conditions, but it can be stated that:
εT-Free≥εT-Obs
(2)
where
εT-Obsrepresents the limited expansion or contraction of the pile under the partially restrained conditions. Therefore, it can be said that the restrained strains within the pile (resulting from the pile being unable to move freely) are expressed as:
εT-Rest=εT-Free-εT-Obs
(3)
The restrained strains will induce axial loading within the pile which is expressed as a function of pile cross sectional area, A, and Young’s Modulus, E:
PT=EAεT-Rest
(4)
Assuming that the temperature change is constant over the entire pile length (Bourne-Webb, et al., 2009), the shaft friction can be seen to be mobilised in the upwards and downwards direction of the pile, meeting at a zero movement point which will vary in position depending upon the ground conditions. This behaviour can be visualised, Figure 5, for a pile with and without end restraint.
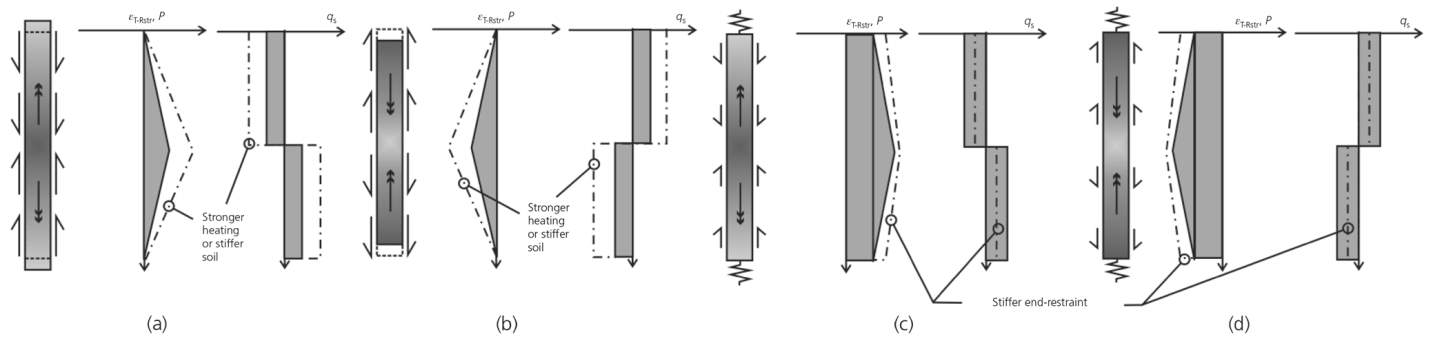
Figure 5: Thermal Behaviour Pile Profiles (a) shaft restraint heating (b) shaft restraint cooling (c) shaft and end restraint heating (d) shaft and end restraint cooling, (Bourne-Webb, et al., 2012)
2.2.2 Mechanical Loading
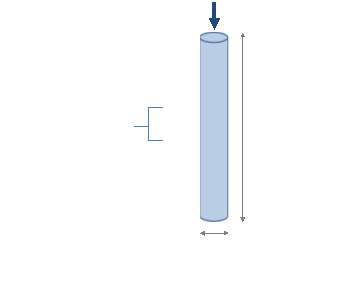
Mechanical behaviour of the pile results from the structural load bearing requirements. Vertical loading is applied to the top of the pile inducing compressive strains which reduce over the length, as shown in Figure 6.
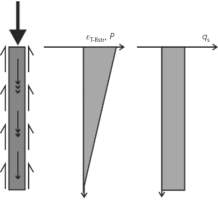
Figure 6: Mechanical Behaviour Pile Profile
2.2.3 Thermomechanical Loading
Thermomechanical loading results as a combination of mechanical and thermal loading. Thus, the behaviour of the pile under combined loading is formed from a superposition of the individual mechanical and thermal profiles, as shown in Figure 7.
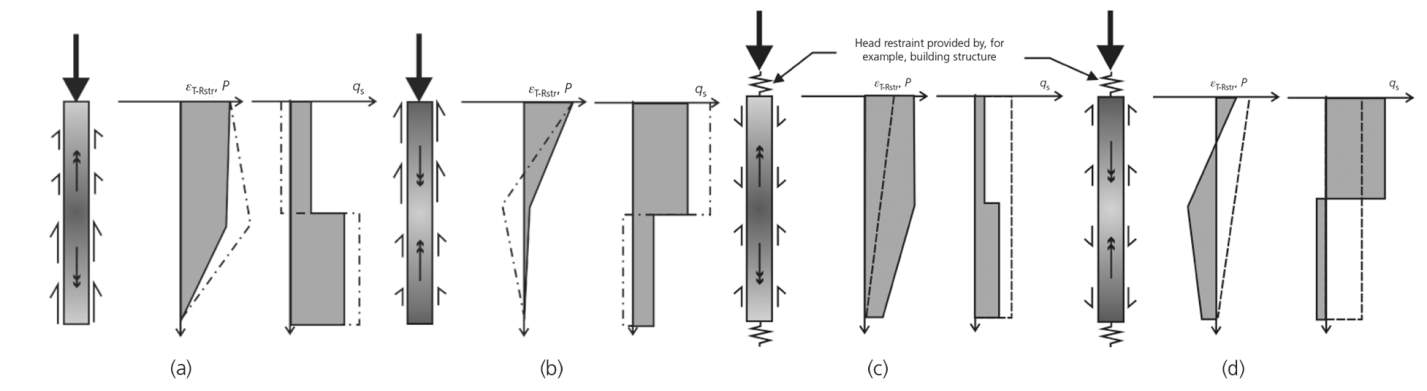
Figure 7: Thermomechanical Behaviour Pile Profiles (a) shaft restraint heating (b) shaft restraint cooling (c) shaft and end restraint heating (d) shaft and end restraint cooling, (Bourne-Webb, et al., 2012)
As shown in Equation 1, when a pile is cooled tensile strains occur. This can have a positive effect on the pile, in reducing the compressive strains caused by the mechanical loading to reduce. However, as shown in Figure 7b, if the cooling effect is significant and the mechanical loading is minimal this can lead to tensile strains within the pile, which have detrimental effects on the concrete structure.
2.3 Field Testing
Field testing has been limited due to its costly and time-consuming nature. However, two notable investigations have been performed in recent years. The first was conducted by Laloui, et al., (2006) at the Swiss Federal Institute of Technology in Lausanne, where a pile was subjected to thermal and mechanical loads after the completion of the construction of each storey of the building structure, allowing the observation of how the behaviour changed with increasing load. The pile was restrained at the shaft, top and base for testing as it was part of a larger pile raft (Knellwolf, et al., 2011). The second was conducted by Bourne-Webb, et al. (2009) at Clapham Centre of Lambeth College, South London, where a single test pile was subjected to thermal and mechanical loading in order to measure the behaviour after heating and cooling cycles. The pile was restrained at the shaft, and free at the ends due to a lack of top fixity (Knellwolf, et al., 2011).
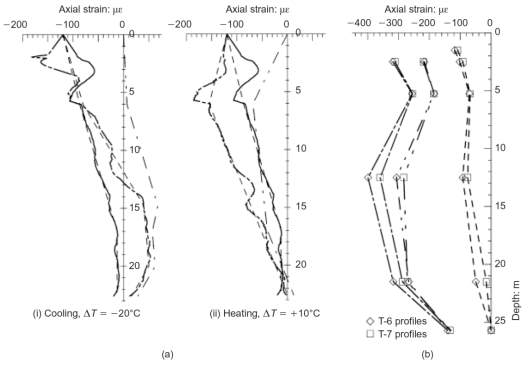
Figure 8: Strain Profiles (a) Lambeth College (b) Lausanne
The in-situ tests produced some notable results, with the most important of these strain profiles shown in Figure 8. These profiles demonstrated that the pile strains were significantly affected by the temperature cycles and that tensile strains were generated in the cooling case.
The results produced from these in-situ tests were the basis for the framework described above. As can be seen from Figure 8 the in-situ testing approximately follows the expected profiles: Lambeth College and Figure 7a and Figure 7b; Lausanne and Figure 7c and Figure 7d. This assists somewhat to explain energy pile behaviour, however, is limited to the two sites where the investigations were performed.
2.4 Numerical Modelling
Restraints surrounding in-situ testing of energy piles have led to the development of a number of numerical models, which aim to further the current understanding. Most methods utilise finite elements with two popular approaches applied:
- T-z load transfer curve
- Numerical mesh analysis
The t-z load transfer curve has been successfully utilised by Ouyang, et al. (2011) and Knellwolf, et al. (2011), to back-analyse the Lambeth College and Lausanne field tests producing a good correlation between results. Similar simulations have been performed by Gawecka, et al. (2016) with comparable outcomes. Thus, previous numerical tests have demonstrated via back-analysis that they are a viable method to analyse the behaviour of energy piles. However, as this approach is still relatively new, literature has not advanced much past developing and validating these models.
Research has now provided a solid understanding of energy pile strain behaviour. However, tests regarding the mobilised bearing capacity and pile head displacements are currently limited, often produced alongside strain data for limited conditions without further exploration. Therefore, a gap in the knowledge remains surrounding the impact of temperature cycles on the mobilised bearing capacity and head displacements of energy piles for a variety of pile and soil properties.
3 Numerical Model
This section outlines the finite element model, defining how it works and verifying it using a back-analysis against existing field data.
3.1 Model Description
A finite element model developed in MATLAB is to be used to conduct a parametric study of an energy pile. This model adopts a t-z beam spring method where the pile is split into a number of equally sized, linear beam elements connected by nodes, as shown in Figure 9.
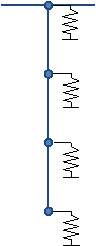
Figure 9: T-z Beam Spring Method
Each node has one degree of freedom, due to free vertical movements. The local beam element stiffness matrix, kEL, is based on standard finite element formulation, (Bathe, 2014):
kEL, pile=EALEL1-1-11
(5)
The soil is simplified as a series of nonlinear springs which connect to the beams simulating the pile-soil interaction. Each spring has one degree of freedom, due to free vertical movement, with the stiffness of the spring, kspring, based upon the load transfer (t-z) curve, shown in Figure 10.
kspring=tz
(6)
The t-z curve defines the shaft friction, t, and pile displacements, z, due to the pile-soil interaction. Maximum shaft friction can be calculated for drained and undrained conditions, (Craig & Knappett, 2012):
tm, undrained=αSuAs
(7)
tm, drained=K0σv’tanφ’As
(8)
Where the terms are defined; soil adhesion factor, α; undrained shear strength of soil, Su; area of pile in contact with soil, As; coefficient of earth pressure, K0; effective vertical soil stress,
σv’; soil friction angle, δ’.
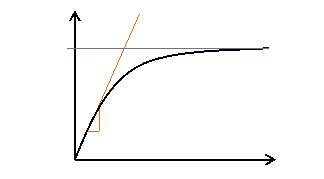
Figure 10: T-z Load Transfer Curve
The maximum stiffness for displacement, km, was defined by Randolph and Wroth (1978):
km=Grln2.5L(1-ν)γ
(9)
Where the terms are defined; soil shear modulus, G; pile radius, r; pile length, L; soil Poisson’s ratio, ν; soil unit weight, γ.
The shaft friction along the load transfer curve has subsequently been defined, (Pelecanos, et al., 2018):
t=kmz1+kmztmhdd
(10)
Where the terms are defined; hardening parameter, h; degradation parameter, d.
Substituting into Equation 6 allows the calculation of the local spring stiffness. The global stiffness matrices for the pile, kp, and the soil, ks, can then be formed by combining the local values for each element. Considering the equilibrium of the model an expression for pile displacements can be derived, (Bathe, 2014):
P=ku
(11)
Displacements, u, are calculated by multiplying the applied mechanical loads, P, against the inverse of the combined global stiffness matrix, k. Where
k=kp+ksthe equation can be stated:
P=kp+ksu
(12)
However, in the case of thermomechanical analysis temperature loading, specified by Equation 4, will also need to be included within the equilibrium equation:
P + αcEA∆T=kp+ksu
(13)
Thus, when the properties and loading are specified the finite element model is able to determine the unknown displacement values.
3.2 Validation
The finite element model will now be validated by performing a back-analysis of a known field study and comparing the test results to ensure that the model appropriately simulates energy pile behaviour.
3.2.1 Lambeth College
Bourne-Webb, et al. (2009) conducted one of the first energy pile field tests at the Clapham Centre of Lambeth College, South London. The study was performed prior to construction of a five storey building supported on 143 bored pile foundations all of which were utilised as a GSHP system. The experiment aimed to determine the behaviour of a single test pile for cycles of heating and cooling under a sustained load (Bourne-Webb, et al., 2009).
The 23m test pile, shown in Figure 11, was designed based purely on the geotechnical requirements with a safety factor of 2.5. The pile diameter varied with depth, 0.610m for the first 5m and 0.550m for the subsequent 18m. U-shaped heat exchanger loops were attached to 32mm reinforcement which extended for the full length of the pile. Continuous strain and temperature measurements were supplied by 18 vibrating-wire strain gauges, 6 thermistors and optical fibre sensors (Bourne-Webb, et al., 2009).
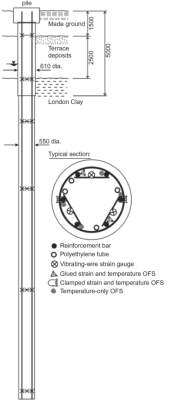
Figure 11: Lambeth College Test Pile, (Bourne-Webb, et al., 2009)
Ground conditions are shown in Figure 11, showed 1.5m of made ground and 2.5m of terrace gravel overlying a layer of London clay. The groundwater table was found within the terrace gravel at depth 3m. Throughout testing a mechanical load of 1200kN was sustained through several cycles of heating and cooling. As seen from Figure 12, the temperature change under cooling ~∆T=-18℃ and ~∆T=+10℃ under heating (Bourne-Webb, et al., 2009).
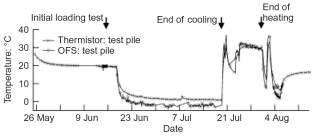
Figure 12: Lambeth College Test Temperature Variation
Testing was conducted in over a three month period in 2007, with the series of tests specified below:
- 1800kN applied, pile unloaded;
- 1200kN applied;
- Cooling cycles;
- Heating cycles ;
- Maximum load test to 3600kN, unloaded (Bourne-Webb, et al., 2009).
The study results, displayed in Figure 8a, significantly improved the understanding of energy pile behaviour. The Lambeth College study has subsequently been successfully used to by multiple studies validate numerical models (Ouyang, et al., 2011; Gawecka, et al., 2016; Knellwolf, et al., 2011). Therefore, a back-analysis of this field data will be performed using the finite element model.
3.2.2 Comparison
Three tests were conducted and compared to Lambeth College data, with the parameters based upon data obtained from a previous back-analysis by Ouyang, et al., (2011). The applied loading and model parameters are displayed in the tables below.
Table 1: Verification Model Loading
| Test | Mechanical Load | Thermal Load |
| Mechanical | 1.2MN | ΔT = 0°C |
| Heating | 1.2MN | ΔT = +10°C |
| Cooling | 1.2MN | ΔT = -18°C |
Table 2: Verification Model Pile Properties
| Pile Properties | Mechanical Load |
| Length, L (m) | 23 |
| Diameter, d (m) | 0.610 for Depth 0-5m
0.550 for Depth 5-23m |
| Coefficient of thermal expansion, αc (με) | 8.5 |
| Young’s Modulus, E (MPa) | 30 |
For simplicity, the made ground and terrace gravel are combined into a single 4m layer.
Table 3: Verification Model Soil Properties
| Soil Layer | Shear Modulus,
G (MPa) |
Cohesion Factor,
c’ (kPa) |
Friction Angle,
φ’ (degrees) |
Unit Weight,
γ (kN/m3) |
| Made Ground
Depth 0-4m |
42 | 0 | 35 | 20 |
| London Clay
Depth 4-23m |
52 | 5 | 25 | 20 |
The verification test results are displayed in the following figures.
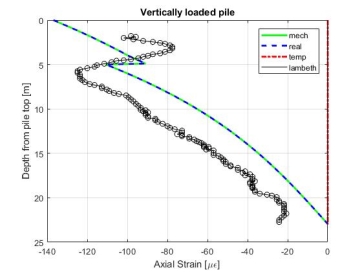
Figure 13: Verification Mechanical Loading Results
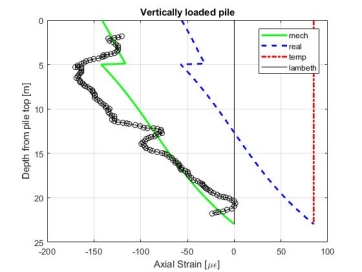
Figure 14: Verification Heating Results
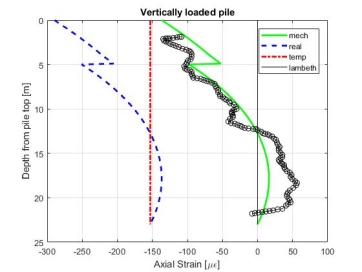
Figure 15: Verification Cooling Results
A good agreement between the Lambeth College and finite element results is observed, which has utilised a Young’s Modulus of 30MPa. However, it is alternatively suggested by Ouyang, et al. (2011) that 40MPa is more appropriate.
When the increased value of 40MPa is input into the finite element model, a considerable variation between the results occurs, shown in Figure 16.
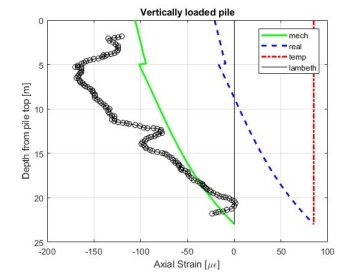
Figure 16: Finite Element Results for E=40MPa
Performing a back-calculation based on values taken from Bourne-Webb, et al. (2009), it is established, equation 14, that 30MPa is a more appropriate value for the back-analysis.
E=PεA=Pε(πr2)=1200130(π0.3052)=31.6MPa
(14)
Where: mechanical loading, P = 1200kN; pile strain, ε = 130με; and pile radius, r = 0.305m.
Therefore, based upon the comparison between the finite element model and Lambeth College data it is determined that the model appropriately simulates energy pile behaviour and can be used to perform the subsequent parametric study.
4 Parametric Study
Using the finite element model described and validated in the previous section a parametric study will now be conducted. The aim of this study is to assess the effect of a number of properties on the mobilised bearing capacity and pile head displacements of energy piles.
4.1 Analysis Arrangement
A nonlinear analysis will be performed for a pile unrestrained at the ends in simple ground conditions, of a single, undrained soil layer. Within this investigation four model properties are altered in order to try to understand their effects on the factor of safety and displacements of the pile. To sufficiently test all combinations of values sixteen tests will be conducted, the varying properties are defined in Table 4.
Table 4: Model Varying Properties Values
| Varying Properties | 1 | 2 |
| Pile Length (L) | 5m | 20m |
| Pile Diameter (d) | 0.5m | 2m |
| Soil Shear Modulus (G) | 20MPa | 100MPa |
| Soil Undrained Shear Strength (Su) | 20MPa | 100MPa |
To ensure that the results are dependent only upon the varying values all other model properties remain constant, as stated in Table 5.
Table 5: Parametric Study Constant Properties
| Property | Value |
| Young’s Modulus (E) | 30MPa |
| Coefficient of Thermal Expansion (αc) | 8.5με |
| Poisson’s Ratio (ν) | 0.3 |
| Soil Adhesion Factor (α) | 0.5 |
| Bulk Unit Weight of Soil (γ) | 20kN/m3 |
| Empirical Factor Nc | 9 |
| Degradation Parameter | 1 |
| Hardening Parameter | 1 |
Equally, the imposed loading will also remain constant, with mechanical loading (P) defined as 30% of the ultimate bearing capacity and thermal loading (heating and cooling) specified:
ΔT = 0°C, ±0.01°C, ±10°C, ±20°C, ±30°C
The finite element model provides results in the form of displacements and safety factors. Safety factors are defined as the ratio between the ultimate bearing capacity, Qult, of the pile and the mobilised bearing capacity, Qmob. The calculations for this are expressed below.
Qult=αSuAs+SuNcAb
(15)
Qmob=2π∫0Lt*r dz+SuNcAb
(16)
Factor of Safety= QmobQult
(17)
Displacements are calculated using the finite element matrix defined in Equation 13. The results produced for each test can then be analysed in order to conclude the impact of the varying factors on pile head displacements and mobilised bearing capacity of the pile.
4.2 Results
The following section displays the results from the sixteen finite element tests, which illustrate the change in safety factor and pile head displacement for increasing thermal loading.
4.2.1 Test A
Table 6: Test A – Input Values
| Test A | L [m] | d [m] | G [MPa] | Su [MPa] |
| Varying Properties | 20 | 0.5 | 20 | 100 |
Qult=1.755 MN
P=0.3Qult=0.5265 MN
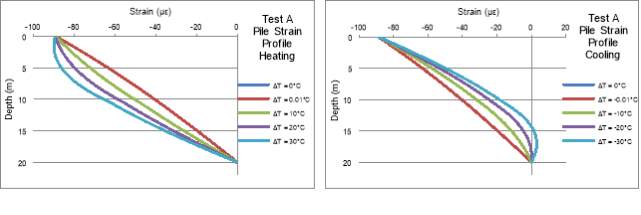
Figure 18: Test A – Strain Profiles (a) Heating (b) Cooling
The strain profiles for Test A are displayed in Figure 18, these graphs demonstrate good agreement with the expected behaviour defined by the energy pile framework in Section 2.2. Graph 18a shows the increase in compressive strain under heating conditions and Graph 18b shows the decreasing compressive strains under cooling conditions, which develop tensile strains in the most extreme case. While understanding these profiles is vital for the design integrity of the pile, particularly when tensile strains develop as this can lead to cracking of the pile concrete structure, they have been investigated by other literature. Therefore, strain profiles are not considered within the scope of this dissertation and will not be displayed for further tests.
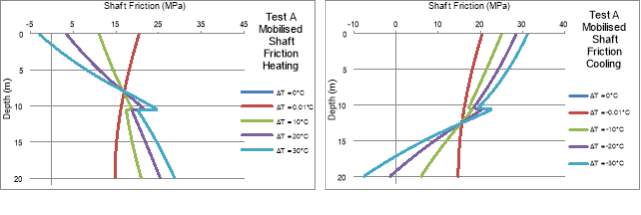
Figure 19: Test A – Mobilised Shaft Friction Profiles (a) Heating (b) Cooling
Similarly, the shaft friction profiles for Test A, displayed in Figure 19, also demonstrate good agreement with the energy pile framework. These profiles are a crucial visualisation as they show the mobilised shaft friction over the length of the pile, which is utilised in the factor of safety calculation defined in Equation 17. Plotting the safety factors, Figure 21, is a simpler method of comparison for the varying properties. Therefore, the shaft friction profiles will not be provided for further tests.
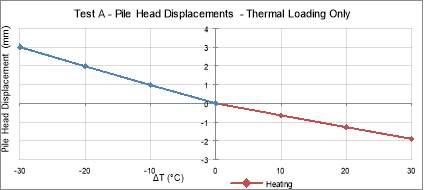
Figure 20: Test A – Pile Head Displacements due to Thermal Loading only
The graph displayed in Figure 20 shows the Test A pile head displacements under thermal loading only. The initial displacements due to mechanical loading have been omitted, allowing for the impact of thermal conditions only to be considered. For all results, displacement in the vertical downwards direction is taken as positive.
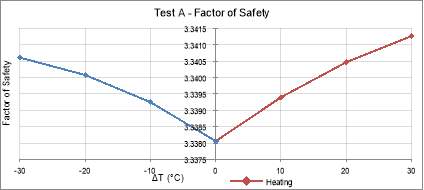
Figure 21: Test A – Factor of Safety
4.2.2 Test B
Table 7: Test B – Input Values
| Test B | L [m] | d [m] | G [MPa] | Su [MPa] |
| Varying Properties | 20 | 0.5 | 100 | 100 |
Qult=1.755 MN
P=0.3Qult=0.5265 MN
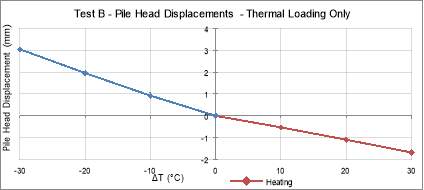
Figure 22: Test B – Pile Head Displacement due to Thermal Loading only
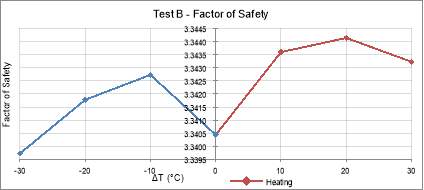
Figure 23: Test B – Factor of Safety
4.2.3 Test C
Table 8: Test C – Input Values
| Test C | L [m] | d [m] | G [MPa] | Su [MPa] |
| Varying Properties | 20 | 2 | 20 | 100 |
Qult=9.142 MN
P=0.3Qult=2.7426 MN
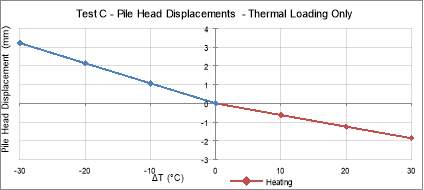
Figure 24: Test C – Pile Head Displacements due to Thermal Loading only
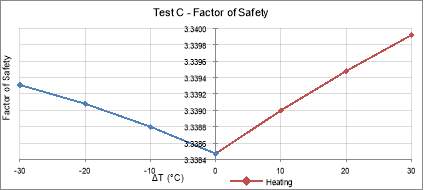
Figure 25: Test C – Factor of Safety
4.2.4 Test D
Table 9: Test D – Input Values
| Test D | L [m] | d [m] | G [MPa] | Su [MPa] |
| Varying Properties | 20 | 2 | 100 | 100 |
Qult=9.142 MN
P=0.3Qult=2.7426 MN
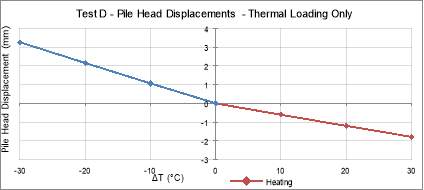
Figure 26: Test D – Pile Head Displacement due to Thermal Loading only
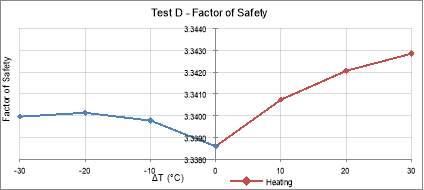
Figure 27: Test D – Factor of Safety
4.2.5 Test E
Table 10: Test E – Input Values
| Test E | L [m] | d [m] | G [MPa] | Su [MPa] |
| Varying Properties | 20 | 0.5 | 20 | 20 |
Qult=0.351 MN
P=0.3Qult=0.1053 MN
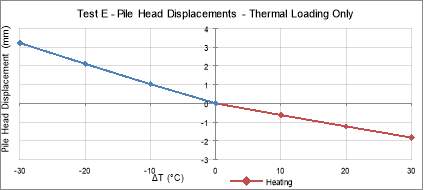
Figure 28: Test E – Pile Head Displacements due to Thermal Loading only
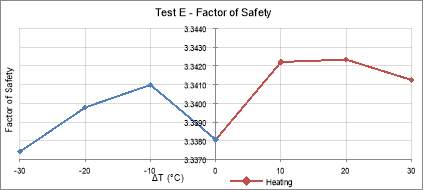
Figure 29: Test E – Factor of Safety
4.2.6 Test F
Table 11: Test F – Input Values
| Test F | L [m] | d [m] | G [MPa] | Su [MPa] |
| Varying Properties | 20 | 0.5 | 100 | 20 |
Qult=0.351 MN
P=0.3Qult=0.1053 MN
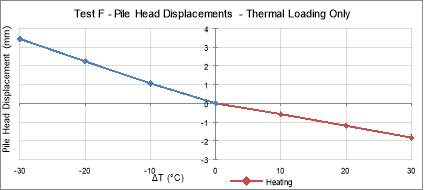
Figure 30: Test F – Pile Head Displacement due to Thermal Loading only
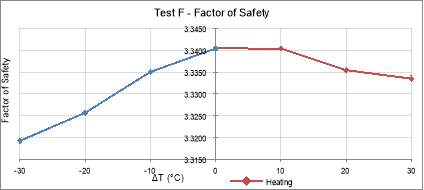
Figure 31: Test F – Factor of Safety
4.2.7 Test G
Table 12: Test G – Input Values
| Test G | L [m] | d [m] | G [MPa] | Su [MPa] |
| Varying Properties | 20 | 2 | 20 | 20 |
Qult=1.828 MN
P=0.3Qult=0.5484 MN

Figure 32: Test G – Pile Head Displacements due to Thermal Loading only
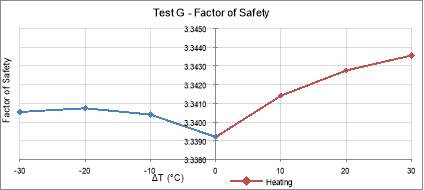
Figure 33: Test G – Factor of Safety
4.2.8 Test H
Table 13: Test H – Input Values
| Test H | L [m] | d [m] | G [MPa] | Su [MPa] |
| Varying Properties | 20 | 2 | 100 | 20 |
Qult=1.828 MN
P=0.3Qult=0.5484 MN
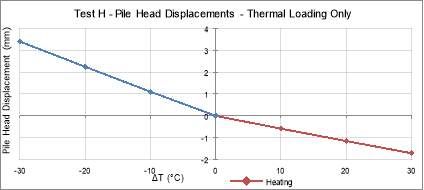
Figure 34: Test H – Pile Head Displacement due to Thermal Loading only
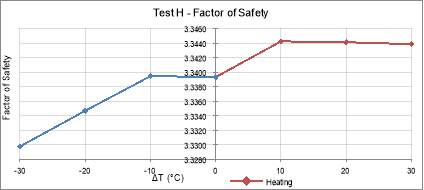
Figure 35: Test H – Factor of Safety
4.2.9 Test I
Table 14: Test I – Input Values
| Test I | L [m] | d [m] | G [MPa] | Su [MPa] |
| Varying Properties | 5 | 0.5 | 20 | 100 |
Qult=0.577 MN
P=0.3Qult=0.1731 MN
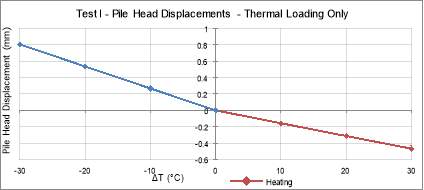
Figure 36: Test I – Pile Head Displacement due to Thermal Loading only
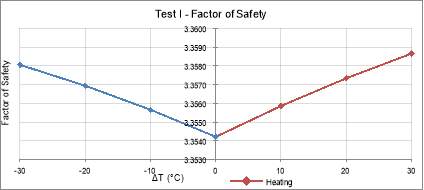
Figure 37: Test I – Factor of Safety
4.2.10 Test J
Table 15: Test J – Input Values
| Test J | L [m] | d [m] | G [MPa] | Su [MPa] |
| Varying Properties | 5 | 0.5 | 100 | 100 |
Qult=0.577 MN
P=0.3Qult=0.1731 MN
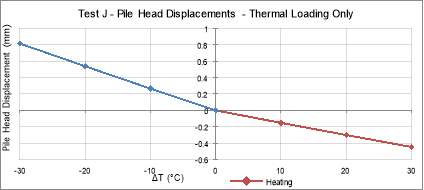
Figure 38: Test J – Pile Displacement due to Thermal Loading only
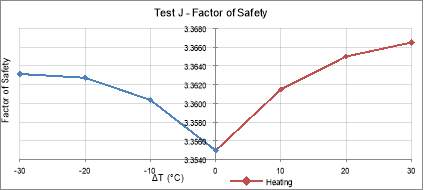
Figure 39: Test J – Factor of Safety
4.2.11 Test K
Table 16: Test K – Input Values
| Test K | L [m] | d [m] | G [MPa] | Su [MPa] |
| Varying Properties | 5 | 2 | 20 | 100 |
Qult=4.43 MN
P=0.3Qult=1.329 MN
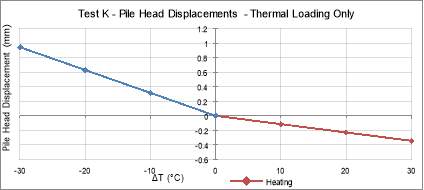
Figure 40: Test K – Pile Head Displacement due to Thermal Loading only
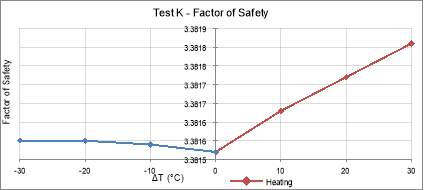
Figure 41: Test K – Factor of Safety
4.2.12 Test L
Table 17: Test L – Input Values
| Test L | L [m] | d [m] | G [MPa] | Su [MPa] |
| Varying Properties | 5 | 2 | 100 | 100 |
Qult=4.43 MN
P=0.3Qult=1.329 MN
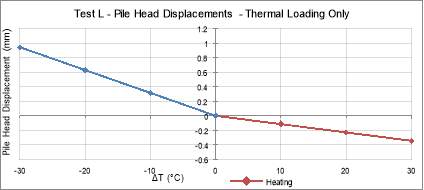
Figure 42: Test L – Pile Head Displacement due to Thermal Loading
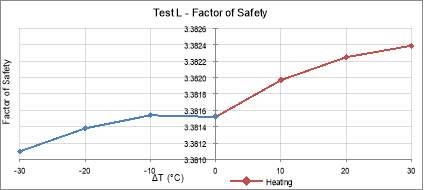
Figure 43: Test L – Factor of Safety
4.2.13 Test M
Table 18: Test M – Input Values
| Test M | L [m] | d [m] | G [MPa] | Su [MPa] |
| Varying Properties | 5 | 0.5 | 20 | 20 |
Qult=0.115 MN
P=0.3Qult=0.0345 MN
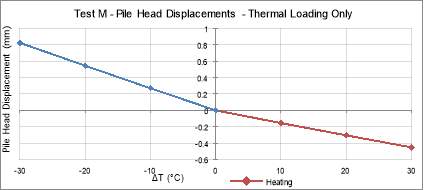
Figure 44: Test M – Pile Displacement due to Thermal Loading only
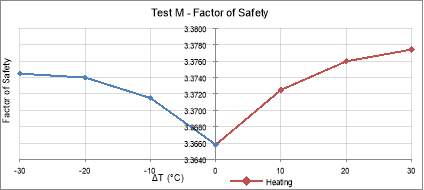
Figure 45: Test M – Factor of Safety
4.2.14 Test N
Table 19: Test N – Input Values
| Test N | L [m] | d [m] | G [MPa] | Su [MPa] |
| Varying Properties | 5 | 0.5 | 100 | 20 |
Qult=0.115 MN
P=0.3Qult=0.0345 MN
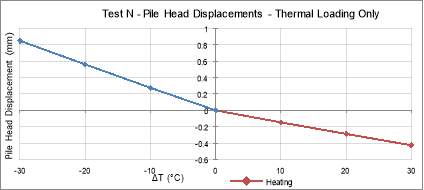
Figure 46: Test N – Pile Displacement due to Thermal Loading only
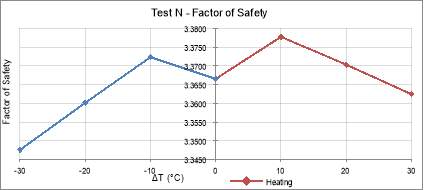
Figure 47: Test N – Factor of Safety
4.2.15 Test O
Table 20: Test O – Input Values
| Test O | L [m] | d [m] | G [MPa] | Su [MPa] |
| Varying Properties | 5 | 2 | 20 | 20 |
Qult=0.886 MN
P=0.3Qult=0.2658 MN

Figure 48: Test O – Pile Displacement due to Thermal Loading only
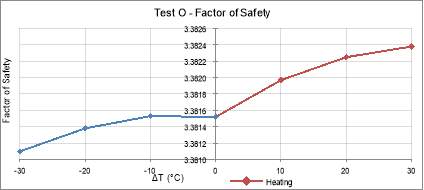
Figure 49: Test O – Factor of Safety
4.2.16 Test P
Table 21: Test P – Input Values
| Test P | L [m] | d [m] | G [MPa] | Su [MPa] |
| Varying Properties | 5 | 2 | 100 | 20 |
Qult=0.886 MN
P=0.3Qult=0.2658 MN
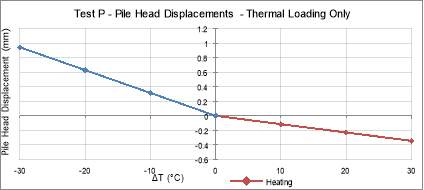
Figure 50: Test P – Pile Head Displacement due to Thermal Loading only
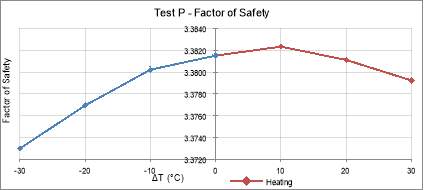
Figure 51: Test P – Factor of Safety
4.2.17 Increased Loading
A final analysis was conducted, where Test A was remodelled using the same thermal loading, but with increasing mechanical loading. The results displayed in Figure 52 and Figure 53 illustrate the change in factor of safety and pile head displacement for mechanical loading increasing in 10% increments of the ultimate bearing capacity.
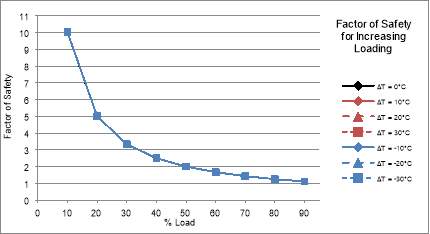
Figure 52: Factor of Safety Change for Increasing Loading
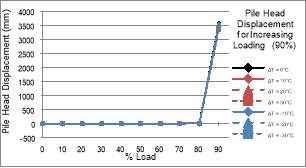
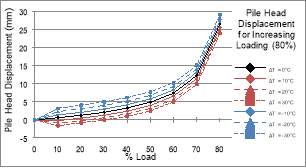
(b)
(a)
Figure 53: Pile Head Displacement Change for Increasing Loading (a) 80% (b) 90%
Figure 53b shows loading applied to 90%, where the displacements become very large. Behaviour which is expected for highly loaded piles. Figure 53a restricts the loading to 80% in order for the displacement relationships to be seen clearly.
4.3 Critical Evaluation
In the following section all sixteen tests are compiled and compared in order to assess the effect of the varied parameters. The results have been coloured to indicate pairs of data, highlighting the change in property for each test.
4.3.1 Varied Pile Lengths
Two pile lengths were considered; L = 5m and L = 20m.
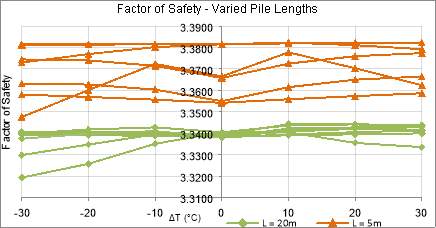
Figure 54: Factor of Safety for Varied Pile Lengths
Figure 54 shows the factor of safety for all tests, it can be seen that the shorter pile (L=5m) provides higher values for all thermal loads. This suggests that thermal effects have more significant effect on longer piles.
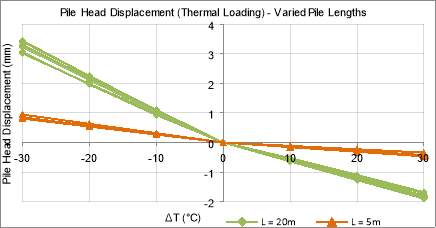
Figure 55: Pile Head Displacement under Thermal Loading Only for Varied Pile Lengths
Figure 55 further suggests this relationship, as it is shown that displacements are higher for the longer pile. This can be explained by Equation 1:
ε=∆LL=αc∆T
(18)
Assuming:
u≈∆L
u=Lαc∆T
(19)
The proportional relationship between displacement, pile length and thermal loading is clear from Equation 19. Thus, the model results have verified that length is a crucial consideration for energy piles, implying that thermal effects should be considered for the design of longer length piles.
4.3.2 Varied Pile Diameters
Two pile diameters were considered; d = 0.5m and d = 2m.
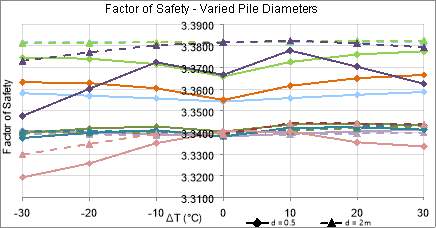
Figure 56: Factor of Safety for Varied Pile Diameters
The varied pile diameter produced a more diverse result, with two different trends seen in Figure 56. For the L=5m pile, the larger diameter (d=2m) demonstrates a higher factor of safety in all performed testing. While the L=20m pile only shows a higher safety factor for the larger diameter when combined with higher soil strength. Due to this indistinct result, it is difficult to qualify which variable has the more significant impact in the case of the longer pile; therefore, further investigation is required to fully explain this behaviour.
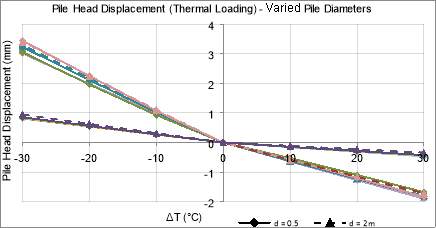
Figure 57: Pile Head Displacement under Thermal Loading Only for Varied Pile Diameters
Figure 57 displays a more apparent trend where it is shown that pile displacement is lower when d=2m in the heating case and when d=0.5m in the cooling case. However, the differences in displacement between the two tested diameters are relatively small, thus, indicating that the pile diameter does not have a significant effect on the performance under thermal effects.
4.3.3 Varied Soil Shear Modulus
Two soil shear moduli were considered; G = 20MPa and G = 100MPa.
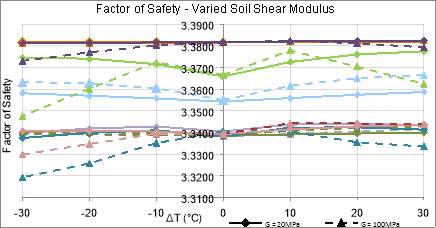
Figure 58: Factor of Safety for Varied Soil Shear Modulus
The results from this test fluctuated, with Figure 58 and Figure 59 showing no apparent data trend. This indicates that the shear modulus does not have a specific effect on the energy pile under thermal loading and that other properties have a more considerable impact on the factor of safety and pile head displacements.
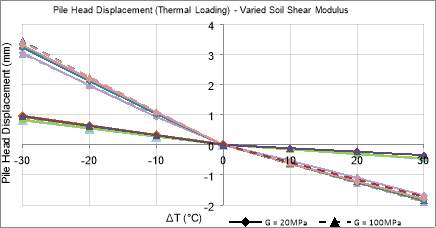
Figure 59: Pile Head Displacement under Thermal Loading Only for Varied Soil Shear Modulus
4.3.4 Varied Soil Strength
Two soil strengths were considered; Su = 20MPa and Su = 100MPa.
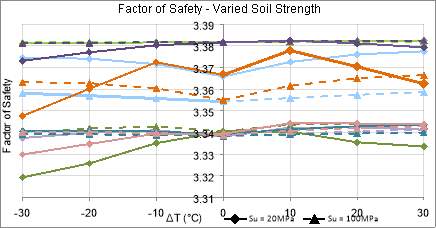
Figure 60: Factor of Safety for Varied Soil Strength
Under heating conditions, the factor of safety, Figure 60, was shown to increase for high strength soils. However, no such trend could be identified for cooling. This indicates that soil strength has a more significant effect on the energy pile under heating conditions.
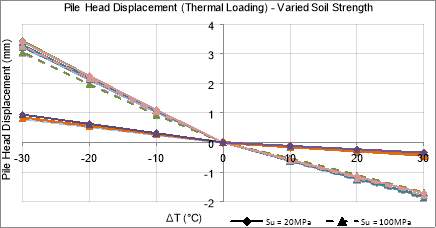
Figure 61: Pile Head Displacement under Thermal Loading Only for Varied Soil Strength
It was shown, Figure 61, that under heating conditions pile displacement was lower when Su=20MPa and when S=100MPa under cooling conditions.
4.3.5 Increased Loading
The effect of increased mechanical loading was investigated with a limited test. Figure 52 establishes that the safety factors converge to 1 for increasing mechanical loading, as expected from equation 17. However, it is shown that there is minimal variation in the data due to the thermal loading, with the thermomechanical plots overlaying the mechanical data. This suggests that thermal effects have a small impact on the safety of the pile, even under highly loaded conditions. The pile head displacements, Figure 53a, are shown initially have a wider variation due to thermal loading which decreases as the mechanical load reaches 70% of the ultimate bearing capacity. While these results are restricted to a single test case, it has demonstrated that displacements are likely to be a more significant consideration in the design of energy piles, particularly in instances of high thermal loads. Therefore, further testing should be performed to investigate the relationship between displacements and thermal and mechanical loading for cases of different pile and soil properties.
4.3.6 Summary
Table 22 summarises the findings of this study.
Table 22: Summary of Results
| Varying Property | Factor of Safety | Pile Head Displacement |
| Length | Higher, L=5m | Lower, L=5m |
| Diameter | Higher, L=5m d=2m
Higher, L=20m d=0.5m Su=100MPa |
Lower, Heating d=2m
Lower, Cooling d=0.5m |
| Shear Modulus | No trend | No trend |
| Soil Strength | Higher, Heating Su=100MPa | Lower, Heating Su=20MPa
Lower, Cooling Su=100MPa |
The primary results observed from the data are detailed below:
- The length of the pile showed the most prominent trend, indicating that this property is a significant concern in the design of energy piles, particularly for longer length piles.
- The shear modulus testing showed no data trend, suggesting that this property did not have a meaningful impact on the performance of the energy pile.
- The factor of safety data varied by minimal amounts (
- The pile head displacements were shown to be significant in all performed tests, which is a critical consideration for structural design. This crucial observation demonstrates the necessity for thermal displacements to be accounted for in the design of energy piles.
- Soil strength was shown to have a contracting effect under heating and cooling conditions. Displacements were shown to be smaller when soil strength was lower under heating and when soil strength was higher under cooling.
5 Conclusion
In conclusion, this dissertation has assessed the impact of a number of varying properties on the factor of safety and pile head displacements of a thermomechanically loaded energy pile. Due to the increased implementation of energy piles in recent years, lack of formalised design codes and limited industry understanding, the behaviour of energy piles is a crucial geotechnical concern. Current literature has extensively investigated pile strains under thermal loading, an essential consideration for pile performance. However, studies into factor of safety and displacement are often limited to one set of design properties. Therefore, by considering the impact of varying properties, this dissertation broadens the current understanding of energy piles and provides indications of crucial factors which require further study.
These objectives were achieved with a nonlinear t-z beam spring finite element model. In order to validate the usage of this model, a back analysis of known, Lambeth College, data was initially performed. The results demonstrated good agreement with the pre-existing data, and thus, the model was assessed to be viable for use for further testing.
An extensive parametric study was then conducted. Due to their fundamental impact on pile design the properties chosen as the subject of the analysis were decided as; pile length, pile diameter, soil shear modulus and, soil shear strength. All other model properties remained constant throughout testing, to ensure that only the varied values were affecting the produced results. Additionally, pile loading also remained constant, where the mechanical load was specified as 30% of the pile ultimate bearing capacity and thermal loading, for heating and cooling, was defined as; ΔT = 0°C, ±0.01°C, ±10°C, ±20°C, ±30°C. A further test, where mechanical loading was increased at 10% increments of the ultimate bearing capacity, was also conducted. Results were produced in the form of factor of safety and pile head displacement graphs, the observations from these are summarised below.
- The length of the pile showed the most prominent trend, showing a decreased factor of safety and increased displacements for longer length piles.
- The shear modulus testing showed no data trend
- Pile diameter was shown to have an insignificant effect on the performance of the pile.
- Soil strength was shown to have a contracting effect under heating and cooling conditions. Displacements were shown to be smaller when soil strength was lower under heating and when soil strength was higher under cooling.
- The factor of safety data varied by minimal amounts (
- Pile head displacements were shown to be significant in all performed tests
- The range of displacements resulting from thermal loading was shown to decrease as mechanical loading increased above 70% of the ultimate bearing capacity. However, this was limited to a single test case.
The results demonstrate an evident requirement for formalised design codes as performance is shown to fluctuate based upon energy piles properties, the most noteworthy of which is pile length. While it has been demonstrated that the factor of safety was minimally impacted by varying properties and thermal load, the significant displacements are a cause for concern, particularly for structural engineers as foundation movement can have hugely detrimental effects on the superstructure above. Furthermore, differential settlements are of potential importance for schemes where not all piles are utilised geothermally, a common occurrence, as it has been shown that thermomechanical piles are likely to displace differently to those solely under mechanical loading. While the performed test has sufficiently demonstrated essential pile-property relationships, further testing is required to further investigate these associations due to the modelling limitations:
- A single soil layer was considered, while actual site conditions are expected to be more complex.
- Undrained soil conditions only were considered, which does not account for the behaviour of sandy soils which act under drained conditions.
- Storage of heat within the soil due to thermal cycles has not been considered which could impact the behaviour of the pile.
- Lack of field data restricts numerical models, as they are generally validated using only two tests (Lausanne or Lambeth College). Further field testing, which is costly and time-consuming, will be invaluable for developing more accurate numerical models in future years.
6 References
Abuel-Naga, H., Raouf, M. I. N., Raouf, A. M. & Nasser, A. G., 2015. Energy piles: current state of knowledge and design challenges. Environmental Geotechnics, 2(4), pp. 195-210.
Amatya, B. L. et al., 2012. Thermo-mechanical behaviour of energy piles. Geotechnique, 62(6), pp. 503-519.
Bathe, K.-J., 2014. Finite Element Procedures. 2nd ed. Watertown: K.J. Bathe.
Boennec, O., 2008. Shallow ground energy systems. Proceedings of the Institution of Civil Engineers – Energy, 161(2), pp. 57-61.
Bourne-Webb, P. J., Amatya, B. & Soga, K., 2012. A framework for understanding energy pile behaviour. Geotechnical Engineering , 166(GE2), pp. 170-177.
Bourne-Webb, P. J. et al., 2009. Energy pile test at Lambeth College, London: geotechnical and thermodynamic aspects of pile response to heat cycles. Geotechnique, 59(3), pp. 237-248.
Craig, R. F. & Knappett, J. A., 2012. Craig’s Soil Mechanics. 8th ed. Abindon: Spon Press.
Gawecka, K. A. et al., 2016. Numerical modelling of thermo-active piles in London Clay. Proceedings of the Institution of Civil Engineers – Geotechnical Engineering, 170(3), pp. 201-219.
Knellwolf, C., Peron, H. & Laloui, L., 2011. Geotechnical Analysis of Heat Exchanger Piles. Journal of Geotechnical and Geoenvironmental Engineering, 137(10).
Laloui, L. & Donna, A. D., 2011. Understanding the behaviour of energy geo-structures. Proceedings of the ICE, 164(4), pp. 184-191.
Laloui, L., Nuth, M. & Vulliet, L., 2006. Experimental and numerical investigation of the behaviour of a heat exchanger pile. International Journal for Numerical and Analytical Method in Geomechanics, 30(8), pp. 763-781.
Ouyang, Y., Soga, K. & Leung, Y. F., 2011. Numerical Back-analysis of Energy Pile Test at Lambeth College, London. Dallas, American Society of Civil Engineers.
Pelecanos, L. et al., 2018. Distributed Fiber Optic Sensing of Axially Loaded Bored Piles. Journal of Geotechnical and Geoenvironmental Engineering, 144(3).
Preene, M. & Prowrie, W., 2009. Ground energy systems: from analysis to geotechnical design. Géotechnique, 59(3), pp. 261-271.
Randolph, M. F. & Wroth, C. P., 1978. Analysis of Deformations of Vertically Loaded Piles. Journal of the Geotechnical Engineering Division, 104(12), pp. 1465-1488.
Wang, C.-l.et al., 2016. Model tests of energy piles with and without a vertical load. Environmental Geotechnics, 3(4), pp. 203-213.
Cite This Work
To export a reference to this article please select a referencing stye below:
Related Services
View all


Related Content
All TagsContent relating to: "Energy"
Energy regards the power derived from a fuel source such as electricity or gas that can do work such as provide light or heat. Energy sources can be non-renewable such as fossil fuels or nuclear, or renewable such as solar, wind, hydro or geothermal. Renewable energies are also known as green energy with reference to the environmental benefits they provide.
Related Articles

DMCA / Removal Request
If you are the original writer of this dissertation and no longer wish to have your work published on the UKDiss.com website then please: