Students Role in Reducing University Energy Consumption
Info: 12861 words (51 pages) Dissertation
Published: 15th Jun 2021
Contents
How is a lecture room controlled in university buildings?
Electric lighting – Fluorescent lamps
Electric lighting – Incandescent Lamps
Natural ventilation strategies
Explain different way of collecting survey data
Piloting of the Questionnaire analysis
Survey monkey –data collection
List of figures
Figure 1 natural ventation stratgey in the Queens buildings
Figure 2 a typical natural ventilation strategy at the Anglia Polytechnic
Figure 3: single – sided opening ventilation
Figure 5: Number of response by gender
Figure 6: Number of response by buildings location
Figure 7: – Number of response by average time spend in lecture room
Figure 8: -Number of response if students feel comfortable in the lecture rooms
Figure 9: Number of response on students how they feel
Figure 10: – Number of response on actions if they are too hot or cold in the room
Figure 11: Number of response on awareness of saving energy
Figure 12- Number of response who had an opportunity to reduce energy use in university
Figure 14: Number of response by gender
Figure 15: respondents comments on 2nd question
Figure 16: number of response by building locations of how they feel
Figure 17: number of response by building locations of how they feel
Figure 18: showing respondent’s answer of problems in rooms
Figure 19: shows respondents answer whether finding library too hot or too cold
Figure 20: Number of response on room locations if they are too hot or cold in the library.
Figure 21: Number of responses of students if they know what the estates department is
Figure 22: number on response on how to complain
Figure 23: number of responses of actions taken when complaining
Figure 24: number of responses on saving energy activities
List of tables
Table 1: showing comparison between qualitative data and Quantitative data
Table 2; showing different methods of Qualitative data
Table 3: showing different methods of Quantitative data
Abstract
This study is concentrating on student’s experience on how to reduce energy consumptions use in university buildings (heating, lighting, switching off unused electrical appliances water, ventilation). in addition, this study is to identify whether students are too hot or too cold in university buildings such as lecture rooms.
This study carried out more than one method of data collection of research on students, for instance online survey and focus group. In like manner, the study was taken from survey monkey where students administered an online survey on existing thermal comfort and energy use. Lastly, analysis of survey had been made and also recommendations is made including how to improve student experiences in buildings.
This study undertook a mixed method approach to research, specifically through online survey and focus group. An online survey was created on survey monkey which was then emailed to all students in the course. Also, the research was taken from a small sample size of students in purposeful sampling approach.
What are your conclusions?
To conclude
How will your work help students reduce energy consumption in buildings?
This project has been analysing the data collected from students on thermal comfort and this will help students reduce energy consumptions in buildings. Having the data collected, this can help students to take this further to estates department. The estates department will then sort this problem out. to conclude
What further research should be carried out?
Futher reasehc will be carried on how
Chapter 1: Introduction
This study concentrates on investigating the role student’s play in the energy process and to what level students feel they are involved in saving energy within university buildings. The purpose of this project is to understand the opportunities available for students to reduce energy consumption use in DMU buildings (heating, lighting, switching off unused electrical appliances water, ventilation) by trying to understand what would encourage them(students) to provide better feedback in university buildings. This study will undertake a mixed method approach to research. A mixed method approach to research implements both the qualitative and quantitative research approach to research which allows for more varied approach to attaining findings. This research plans to use focus group and online surveys for conducting research. Likewise, the research is going be taken from fellow students in the course in purposeful sampling approach. From there on people’s observation of behaviour will help me understand and what impact they have towards the consumption.
The structure of this project is based on the following approach. Chapter 1 covers the introduction, that will be talking about how students can affect the energy consumptions and to have a better understanding of student’s comfort in lectures or buildings. Chapter 2 is a literature review focused on the definitions and types of ventilation, lighting and heating. Chapter 3 explains the methodology of the project and what ways are there to collect data e.g. online survey. Also it covers the analysis of data’s that has been done on Survey Monkey. Lastly chapter 4 mentions conclusion and set of recommendation for future studies.
Aims and objectives
Aim: To provide a deeper understanding on the role of students in helping to reduce energy use in university buildings.
Key objectives:
- To understand the opportunities available for students to reduce energy consumption use in DMU buildings (heating, lighting, switching off unused electrical appliances water, ventilation)
- To administer an online survey on students on existing thermal comfort and energy use
- To conduct ways of collecting data method
- To establish the most appropriate way of collecting data from student’s
- To make a set of recommendation for future studies
- To have better understanding on student’s comfort in lectures
Background
Today, heating, ventilation and air conditioning (HVAC) system provide a significant portion of energy in the world. HVAC systems are becoming more popular as it seen as a good method against ventilation demand. The problem provided by HVAC are that they are very expensive and can cause energy wastage and poor indoor air quality. It was found that 20% of the HVAC consumes up to 20% less energy than a neglect one.
Chapter 2: literature review
http://www.esru.strath.ac.uk/Documents/MSc_2004/elsadig.pdf- If you think that this is a key reference, then describe it and show how your work has learnt from it.
use referencing style described in project guide
use peer reviewed international journal articles where possible, rather than web sites.
How is a lecture room controlled in university buildings?
In a normal lecture room, you got different buildings with different control strategies. In queens building you got ventilation through air movements. Some of the rooms in Queen’s building e.g. staff’s office temperatures are controlled by radiators and sensors. A sensor is normally on the walls but it can be on the radiators as well and that will control the temperature of the water. It can do two things, water flowing through the pipes can be constant temperature and then when air reaches certain temperatures the flow is shut off or it can be variable temperature, so when the air temperature reaches certain time the temperature in the room is reduced. On the other hand, it can be heating that is poor than ventilation, so you have got constant air movements and that air temperature varies or you can have cooling, which that will be used in summer and heating in winter. In some of the lecture room. you could open windows such as gateway house whereas in other rooms you can’t e.g. queen’s buildings.
The natural ventilation strategy that is used for queens building is thermal stack- induced cross ventilation. this figure gives an illustration of this ventilation. Passive stack ventilation is the most effective method ventilation strategy. It is combination of cross-ventilation, buoyancy and wind passing over terminals. this strategy has chimneys to generate the pressure difference along vertical distance between inside and outside. Also the chimneys are required to be warmer than ambient in order to provide stack effect and drive an upward displacement flow. Different strategies were used in queen’s building; e.g. mechanical laboratories are cross ventilated.
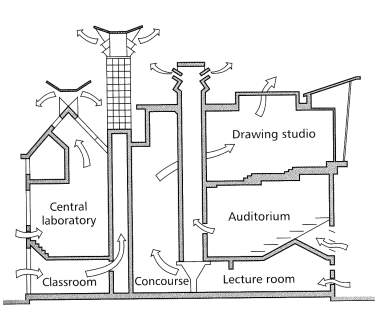
Figure 1 natural ventation stratgey in the Queens buildings
https://www.ucl.ac.uk/greenucl/what-we-do/UCL-Heating-Cooling-and-Ventilation-Policy
http://www.bath.ac.uk/estates/about/heating/index.html
BEMS
Building energy management systems (BEMS) has a significantly affect the control of building services. This idea was created in the early 1980’s, luckily it came into considerate only after having introduce of electronics devices that is able to retain data information for the purpose of managing services, for example ventilation systems, lighting and heating. The term Building energy management system (BEMS) is used in this context but also has different terms, for example building automation system (BAS), building management systems (BMS) and energy management system’s (EMS). All of these terms basically refers to the same equipment.
BEMS is a computer system that is used for to control heating, lighting and ventilation system in buildings such as universities. It allows to average thermostats in the ten different control zones that are ‘set back’ to allow night time cooling in summer.
There are many advantages of using BEMS. One of the main one is consistent checking of the plant and the capacity to review the observed data at a later time. This empowers the technicians and engineers to build up a good compression of the buildings. As an outcome, it prompts to improvement of plant and energy saving. In addition to the benefits of BEMS, there are disadvantages which is large user manual. This will lead to explain user many functions and operation. Also doing the training course is expensive which results few people to pass the course.
http://www.esru.strath.ac.uk/Documents/MSc_2009/Sinha.pdf
Research about
Heating
Heat emitters transfer the heat from the heating system to the room requiring warming. This is usually carried out by convection and radiation from a surfaced heated by the hot water. In domestic buildings heat is emitted to the rooms using radiators. Water is then heated to 80degress by the boiler flows into the radiator, raising its temperature, the radiator warms the room by losing heat to it. The radiator gives out hear partly by radiation but mainly by convection
Convection occurs when the radiator heats up the room air in contact with it. the air becomes less dense so rises to the ceiling where it mixes with the rest of the room air.
Radiant panel
The mechanical laboratory in Queens building (DMU) has a radiant panel. These heat emitters are composed of copper tubes welded onto metals plates. The panels which in labs or offices are perforated and painted, are hung to form part of the suspended ceiling. Water from the heating system is then passed through the tube causing temperature of the panel to increase. the space below is then heated by convection and radiation
The advantages of having radiant panel is that they do not take up any wall space and their heat output will not be affected by furniture. An example would be filling cabinets or desks pushed against walls.
Perimeter radiator
This radiator is constructed from a tube which has added fins added, to increase its surface area for heat output. Perimeter radiators are typically used along the entire outer edge of highly glazed spaces. Here their output counteracts cold down draughts from the glazing. In Queens building, most of the rooms have it and having a low height makes it unobtrusive.
Convector heater
Convector heaters are built from a cabinet in which there is a finned coil heated by water flowing through it from the heating systems. Air inside the casing is heated by contact with the heating coil causing it to rise up through the convector and out of the upper grille to heat the room.
Room thermostats
It’s a device which controls room temperatures. Control is made in relation to a preferred temperature setting made on the thermostat by the occupant. The thermostat is in fact a switched opened and closed as the room temperature rises above or falls below the temperature setting respectively.
Thermostatic radiator valves
This is a valve which is fitted to the inlet of the radiator. Gas is in the TRV head which expands the temperature and pushes a gate downwards blocking the inlet flow. This will restrict or even stop the flow of heat into the radiator. The heat output will then be reduced causing the room to begin to cool. As it does so the gas in the TRV head will contract and the valve will open up once more. TRV’s allow room by room control of temperatures to be achieved
Are all these forms of heating used in DMU buildings?
Yes. There is a variety of different heating systems that is used in DMU buildings. For example, in library pipe works was used to ensure students to be warm and comfortable. If the student is too hot mechanical ventilation also utilised e.g. air conditioning to cool the students down.
Lighting
According to international energy agency (2006) stated that lighting accounts for approximately 19% of the global electric consumptions. Lighting is essential for life, it provides and helps to see the visual tasks. Lighting at buildings is very important to the health and safety of
http://www.iar.unicamp.br/lab/luz/ld/Arquitetural/diversos/Lighting%20for%20Libraries.pdf
http://lighting.sustainablesources.com/
https://www.wbdg.org/resources/energy-efficient-lighting
Daylight
Daylight is the light received from the sun and the sky, which varies throughout the day as modified. Windows that admits daylight in buildings are very important for the view and also connection they provide with the outdoors. Daylight is also essential for its quality, spectral composition and variability. According to (Boyce 1998) stated that daylight is desired because it fulfils two basic requirements. Firstly, to be able to see both a task and the space well and to experience some environmental stimulation. (Hopkinson, Petherbridge and Longmore, 1966)
Electric lighting – Fluorescent lamps
Fluorescent lights deliver light by passing an electric current through a gas inside a glass tube. The empowered gas transmits its vitality to a covering within the tube, and the covering, in turn, changes this vitality into noticeable light. Fluorescent sources are effective (that is, they deliver a great deal of light for every watt of electric power they devour) and they have long life. In queen’s buildings T8 linear Fluorescent have been the most commonly used lamps since it saves more energy efficiency. This would be appropriate in general teaching areas etc. fluorescent lamps are the most common lights sources in commercial buildings, an example would be hospitals, malls and universities buildings. (Cayless and Marsden, 1983)
Electric lighting – Incandescent Lamps
Incandescent lamps are often considered the least energy efficient type of electric lighting. It produces light by passing an electric current through a filament. When the filament gets hot and radiates visible light. This sort of lamps is very unproductive and have relatively short lamp life. (Cayless and Marsden, 1983)
LEDs (Light-emitting diodes)
LEDs is one of today’s most energy efficient and rapidity developing lighting technologies. LEDs are solid state semiconductor devices which converts electrical energy to light directly. It can be extremely small and durable some of them can provide longer lamp life compared to other light sources such incandescent lamps. LED lighting is very different from other lighting sources such as incandescent lamps. The first difference is the LEDs produces light by direct change of electrical. energy to light energy where as incandescent light sources produce light by heating a filament until it grows red hot. (Cayless and Marsden, 1983)
Occupancy sensors
Lighting circuits should be turn on and off by a control system. This allows flexible timed programing for each circuit. This system is often controlled by Building Energy Management Systems (BEMS) which controls lighting and HVAC in large buildings such as university and warehouse. This is another simple way to reduce energy consumptions in areas that are not in use, such as lecture rooms, mechanical labs room etc.
Ventilation
Ventilation is the procedure by which ‘clean air’ (typically outside air) is purposefully given to a space and stale air is removed. This might be refined by either natural or mechanical means.
Air infiltration and exfiltration: in addition to deliberate ventilation, air is unavoidably enters a working by the procedure of ‘air penetration. This is the uncontrolled stream of air into a space through unusual or inadvertent cracks and breaks in the building envelope. The relating loss of air from an encased space is named ‘exfiltration. (Liddament, 1996)
Other air losses, e.g. duct leakage: air spillage shape the creases and joints of ventilation, warming and ventilating and cooling dissemination channels can be considerable. At the point when, as is normal, for example, ducting goes through clear spaces a huge vitality misfortune may happen. Modera (1993), for instance that as much as 20% of the warmth from run of the mill north American household warm air warming frameworks can lose through duct leakage. (Liddament, 1996)
Air recirculation: This sort of frameworks is generally used as a part of business structures to accommodate thermal conditioning. This normally ‘recycled air’ separated for clean expulsion yet since the oxygen is not filled and metabolic contaminations (CO2 and smell) are not expelled in this way distribution ought not as a rule be considered as contributing towards ventilation require. (Liddament, 1996)
Natural ventilation
Natural ventilation is a framework where the air is travelled through ventilation openings by regular strengths, for example, wind weight and stack impact. In numerous buildings, these openings are entrances, windows and spillage in the building envelope and walls and decks. This is on the grounds that; it doesn’t permit a decent control of the ventilation rate. (Liddament, 1996)
For the most part, ventilation needs have been met by “natural” ventilation in which the stream procedure is driven by wind and temperature. In mild situations, outline arrange has often relied on upon near the porosity of the building, joined with window opening. In colder situations, normal ventilation tends to be more specific and join purposely estimate air channels consolidated with latent ventilation. Distinctive airs may misuse a typical bend to drive the ventilation system. (Liddament, 1996)
Natural ventilation depends on moving air through a working under the normal powers of gravity and wind. Much of the time, the air is brought through the building exterior either through opening windows or reason gave ventilation openings. These force confinements on the arrangement type of the structures, in that all the ventilated spaces must be inside a specific greatest separation from an outside divider or ventilation outlet. A case of a typical natural ventilation technique is illustrated in Figure 1.1

Figure 2 a typical natural ventilation strategy at the Anglia Polytechnic
Since natural ventilation depends driving forces which are not completely controllable, close control of the interior condition is inappropriate. Be that as it may, there is expanding proof that extremely exact control is superfluous for occupant comfort. For sure, acknowledgment of a more extensive comfort band can permit temperature control to be set in the hands of tenant. This will diminish dependence on electromechanical systems. (Liddament, 1996)
This sort of ventilation more often than not gave where the arrangement type of the building implies that natural ventilation can’t infiltrate to the centre areas, where the building is liable to inadmissible levels of commotion, or where filtration or other air treatment is required. The advantage of mechanical ventilation is that the ventilation rate is controllable and ventilation air can be presented all the more consistently over the space. Mechanical ventilation indicates to the use of fans providing as well as separating air. The fans may be associated with rooms in the structures by ducts, in which case the fans and channels formal mechanical ventilation frameworks, or they may be sited separately in walls or windows. In the last case the fans are regularly exclusively controlled. (Liddament, 1996)
Why is ventilation needed?
This is expected to convey oxygen for absorption and to weaken metabolic contaminations, for example, CO2 and smell. It is furthermore used to help with keeping up great indoor air quality by weakening and emptying different toxins discharged inside a space. Ventilation is additionally used for cooling and (predominantly in residences) offer oxygen to combustion appliances. (Liddament, 1996)
Natural ventilation strategies
Single-sided ventilation depends on openings being on just a single side of the ventilated conclusion. a nearby estimation is cell working with opening windows on one side and close interior entryways on the opposite side. (Natural ventilation in non-domestic buildings, 1997)
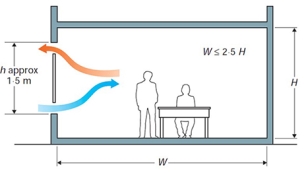
Figure: single – sided opening ventilation
Figure 3: single – sided opening ventilation
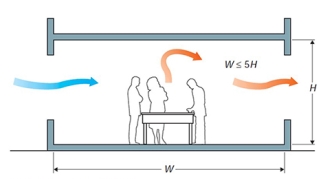
This happens when ventilation is opened on both sides of a space. It permits wind currents from one side of the buildings to the next and leaves through, for instance, another window or entryway. Cross – ventilation is normally wind driven. As the air moves over a possessed space, it gets warmth and pollutants. This sort of ventilation is effective up to five circumstances the floor to roof height. (Natural ventilation in non-domestic buildings, 1997)
Stack ventilation
This term is applied to represent those ventilation techniques where driving forces promote an outflow from the building, accordingly attracting fresh cool air by means of ventilation openings at low level. The technique has utilization of the effect in thickness between a section warm air and the encompassing cooler air. By its inclination, stack ventilation is basically cross-ventilation to the extent the individual possessed zones are worried, in that air enters one side of the space and leaves from the inverse side. The air may stream over the entire width of the building and be depleted by means of a pipe or it might spill out of the edges to the centre to be depleted through a central chimney or chamber. (Natural ventilation in non-domestic buildings, 1997)
What are your conclusions from the literature review?
Have you reviewed previous surveys on thermal comfort of students in university buildings? Has there been such research? If so, what did they do? How do you “build on “ this previous research
Chapter 3: methodology
The following methodology section will comprise of detailed mixed method approach in the project. The mixed method approach adopts both the qualitative and quantitative research methods and allows the researchers to use any of the methods from both quantitative and qualitative approach to research. Online survey was the chosen research approach for this mixed. The reason choosing this method was because its east to use, straightforward and Free. Also it allows to analyse data without doing it and this help time consuming. Another research method that was conducted was focus group. Focus groups are chosen for this study to delve further into the findings gathered from the online survey, this method was especially selected for the primary reason that students provide vital feedback that could only further be explored through direct questioning in a group setting. (Abowitz ,Toole, 2010)
Explain different way of collecting survey data
Data collection is a term which is utilised to portray a process of preparing and collecting data. The purpose of data collection is to acquire data, to continue on record, to make decisions about important issues and lastly to pass in formation on to others. Data collection has various methods and it is an imperative part of any type of research study. ( Hox, J.J.; Boeije, H.R,2005)
There are two types of data
- Primary data – a data that has been collected from first-hand experiences. it has more reliable, authentic and not been published anywhere. Primary data has not been changed by human being .
- Secondary data – a data which have already been collected by others and which have already passed through the statistical process. Secondary data may be available in the published or unpublished form. These are usually in journals, newspaper etc. ( Hox, J.J.; Boeije, H.R,2005)
| Areas of comparison | Qualitative data | Quantitative data |
| Type of information | Words | Numbers |
| Method of collection | Interviews, videos , audio recordings ,description, study cases | Counts, ratings , scores |
| Focus | Why?
How do things work |
What?
How many? |
| Quantity of data | Small | large |
Table 1: showing comparison between qualitative data and Quantitative data
Table 1.1- showing comparison between qualitative data and Quantitative data
Data are generally divided into two types, i.e. qualitative and quantitative. They differ in the type of information they provide. Qualitative (data about quality) is used to describe and narrate when conveying information. This method helps to answer questions i.e. how and why. Quantitative (data about quantities) is mainly dealing with numbers and anything that is measurable. A common forms quantitative methods are counting and measuring. This method helps to answer questions i.e. how much, how many and who etc. ( Hox, J.J.; Boeije, H.R,2005)
Qualitative data can be gathered in a variety of ways for example
| Questionnaires : | Couple of questions and other prompts for the purpose of gathering information from respondents i.e. business man |
| Interviews: | Conversation between two or more people where questions are asked by the interviews to obtain information from the interviewees |
| Focus groups: | A group of people are asked about their attitude towards a product, service, concept, an idea |
| Observation: | A group or single learners are asked to perform a specific task or action. Observation are then made of behaviours , processed , workflows etc. this normally happens in a real-life situations i.e. workplace |
| Case study: | Often used to provide context to other data, also having a clear picture of what happened and why. |
Table 2; showing different methods of Qualitative data
Quantitative data: method of collecting data
| Census: | A data collection about every unit in a group or population |
| Sample survey: | Only part of population is approached for data |
| Administrative data: | Collected as a result of an organisations day to day operations e.g. data on enrolment |
Table 3: showing different methods ofQuantitative data
Sampling
Sampling size
Sample size is a key element of research design because most common question posed to a survey methodologist is how big should a sample be. To determinate sample size is important because it ensures validity, accuracy, reliability, scientific and ethical integrity of research. In census, the sample size is equal to the population size. However, in research because of time constraint and budget, representative sample are usually used. Likewise, the larger sample size the more accurate the findings from a study. When determining an optimum, a sample size three thing is required to follow. Firstly, to allow for appropriate analysis and secondly to provide the desired level of accuracy. thirdly is to allow validity of significance test. The question is how big should a sample be? If the sample is too small, it may fail to detect important effect or association or whoever is conducting a study may fail to answer it research question. On other hand if the sample is too large, the study will be difficult and costly. Also a loss of actuary would occur and time constraints. Sample size can be determined by using a formula, nomogram or computer software. (Bryman, A. 2008), (Fink,2003)
Non probability sampling
Non- probability sampling is a method for choosing units from a population utilising a subjective such as non-random method. Meanwhile non-probability sampling does not need a complete survey frame, it is a fast, simple and cheap method for acquiring data. The issue with this sampling is it’s unclear whether it is conceivable to sum up the results from the sample to the population. The reason behind this is because the selection of units from the population for a non-probability sample can bring large bias. (P. Battaglia, 2011)
file:///H:/Downloads/5.2_Nonprobability%20Sampling.pdf
http://www.statcan.gc.ca/pub/12-587-x/12-587-x2003001-eng.pdf
Purposive sampling
Purposive sampling is part of non-probability sampling and it is also known as judgemental sampling. This is used in exploratory research or in field research. This involves the use of judgement of an expert in selecting case or it can be selecting cases with a specific purpose in mind. Normally in purposive sampling cases are selected rarely to represent the entire population and often to use to select members of a difficult to reach. This method is to identify particular types of cases for detailed analysis to gain deeper understanding of types. (Teddlie and Yu, 2007)
Research ethics
This chapter is very important and should take into consideration when doing an empirical investigation involving respondents. According to (Bryman and Bell,2007) stated it is crucial when collecting data that it does not harm the respondent in any way such as psychologically or physically. The respondent should feel safe, respected and comfortable throughout the whole research. Bryman and Bell,2007)
(http://lup.lub.lu.se/luur/download?func=downloadFile&recordOId=8032700&fileOId=8032710
Questionnaires
Questionnaire is another research approach when collecting data method. It is utilised a few diverse approaches when gathering primary data in quantitative research. It has been stated that the survey is frequently used method of data collection because it appears to be easy, cheap and straightforward (R.A. McQueen and Christian Kusssen). There are two most commonly used methods are (1) gathering data by observing participants and numbering their unmistakable demonstrations of conduct, and (2) questioning an individual to answer fixed- response or open ended questions. This method can be used to gather information about large numbers of respondents(populations) and even a small groups (samples).
Focus group
Focus groups are group discussions organised to explore a specific set of issues such as people’s views and experiences of contraception (Barker and Rich 1992, Zimmerman et al. 1990). The purpose of using focus group is to collect rich, detailed data. And also to draw upon respondents’ attitudes, feelings, beliefs, experiences and reactions in a way which would not be feasible using other groups. An example would be like observations, face to face interview. The disadvantages of having this method is it does not contribute towards statistical findings this research approach however offers a more detailed answers as well as allows for the students to give honest feedback based on their own naturalistic perspectives. This method of research has allowed for researchers to normally find the answers they are looking for through analysing the different opinions, experiences and input the different groups of people can provide a study and allows for the researcher to have the option of more than one answer. (Kitzinger, 1994)
Online surveys
Online surveys are progressively popular method of survey research; it involves the use of internet. It can be conducted completely via email; others are conducted via websites. The most common is potential respondents that receive an email asking them to go to web link where the survey resides. The reason choosing online surveys is because it’s a great way to reach and engage with your target audience. It increased response rates by reaching your target audience fast and it is easy to analyse data’s. (Fricker and Schonlau, 2002)
Advantages of using online surveys
- Faster – the time required to carry out an online survey is significantly shorter than that of an offline survey because information is gather instantly and there’s no waiting time for paper work and/or results to return.
- Convenient – allows you to carry out surveys and express yourself, views and beliefs from the comfort of your home.
- Cheaper – save money on resources such as paper and don’t need to spend any extra time entering the results into computers or data base.
- Quick to analyse – results can be analysed at any time on the computer quickly, even allows you to create charts and graphs.
(Fricker and Schonlau, 2002)
The main disadvantage of online surveys concerns the representative of the respondents. The disadvantages are particularly people who are poor or elderly. People who use the net is tend to be younger, more wealthy, and more highly educated than the rest of the target population. (Fricker and Schonlau, 2002)
- Data collection & analysis
Piloting of the Questionnaire analysis
The data collection was questionnaire; it has 11 questions. Around 10 people participated the questionnaire. The results from the survey have been converted into graphs. A sample of the questionnaire is shown on the appendix A.
Question 1
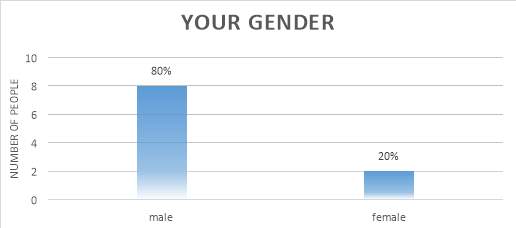
Figure 5: Number of response by gender
This question is a frequently asked question in every survey research. The first question is all about asking the student if they are male or female. One of the main purpose of asking this question is to find out who is playing the role on the outcome of the questionnaires. Also the question was used to target our main audience but we wanted to know what other types of audience think. As you can see Figure 5 above, it shows the result of the question. In this case, out of 10 people only 2 females took part in this questionnaire and the rest was males. From looking at the graph, it can be stated 80% was males and 20% was females.
Question 2
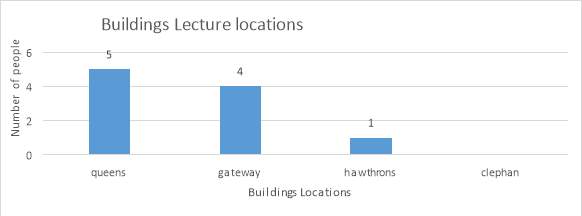
Figure 6: Number of response by buildings location
The second question was asking the students regarding which buildings is the lesson located at. From looking at Figure 6, we can state that majority was Queen’s buildings. But one of the students selected two of the choices ‘Queen’s building and Gateway house’ totalling to 11. The purpose of this question is to assess the thermal comfort conditions in each buildings and to see which buildings is used frequently. All 10 participants where engineering students who use the computer lab rooms in Queens building. The second most of the students use Gateway house which some of the student have their lecture at there.
Question 3
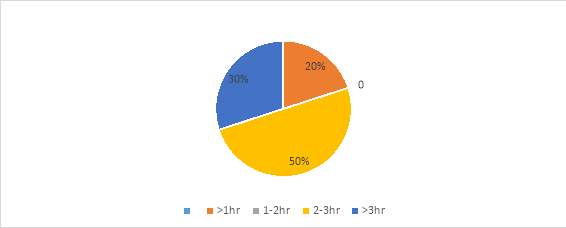
Figure 7: – Number of response by average time spend in lecture room
Question 3 looks into how many hours/time spent in university lecture. This could lead the students of responsibility towards the use of energy consumptions at the university. The result in figure 7 illustrates that the majority of the 10 participants said they are in lecture 2-3hr per week. The are many factors which could least students to feel sleepy or tired. One of them is because they eat large meal before the lesson, poor ventilation in the lecture. 30% of the students answered >3hr, this shows students are dedicated ready for study to get high grade. Lastly, 20% of the students answered >1hr, these are students who don’t go lectures often.
Question 4
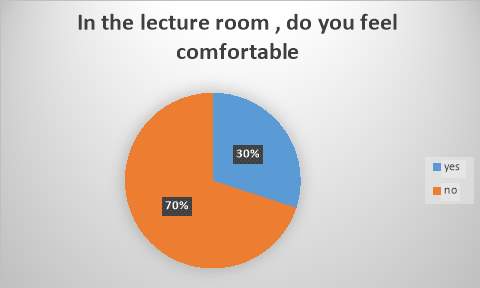
Figure 8: -Number of response if students feel comfortable in the lecture rooms
Question 4 is questioning the student if they feel comfortable in the lecture rooms. The result is showing that 70% of the students said ‘yes’ and 30% said ‘no’. Looking at the stats, 70% said they don’t feel comfortable which is quite high. For this reason, we going to find out the results in the next question.
Question 5
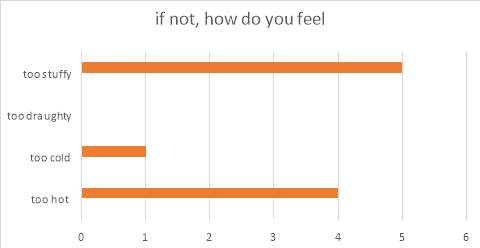
Figure 9: Number of response on students how they feel
The fifth question is related to question 4, as the bar graph shows that the lecture room was ‘too stuffy’ for the majority of the students. This is due to lack of fresh air and poor ventilation, this leads the students to be tired and sleepy. More than 30% saying the room was ‘too warm’. Another factor which could suggest the problem is that there are not enough windows opening or an air conditioning system (in summer) in place to control the room temperature. In order to prevent this, we need the ventilation to be controlled and keep a low temperature throughout the room. One way to remove this problem is to turn the heating up for a couple of hours then reducing the temperature to keep it balanced from morning onwards to evening. You also need ventilation to make sure the air is circulating around different parts of the lecture room. Lastly, one out 10 student picked too cold. That means his lectures in the mornings and another cause could be the clothing the students decide to wear within lectures. This can be due to the windows being opened and the room may have a high ceiling space for more air to be circulating. Another factor could be the lack of insulation in the room leaving, therefore the air circulates causing low temperatures around the room. Another reason why people could feel cold is somebody might have sat next to a window. If it’s a single glazed windows, it loses heat quickly than double glazed windows. So this could cause a person to feel cold.
Question 6
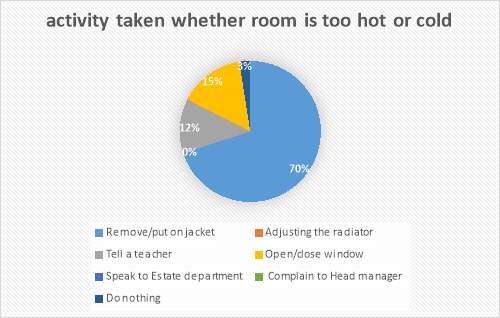
Figure 10: – Number of response on actions if they are too hot or cold in the room
Question 6
This question is analysing on students what they can do if a room is too hot or cold. Question 6 is exploring on students whether it can take any actions on students whether they feel uncomfortable because of the room conditions such as hotness or coldness. A large majority of those surveyed (70%) said ‘remove/put on jacket’, this action is most popularity what people do if a room is hot or cold. For an instance when you’re too hot, you feel to be uncomfortable and distracted., this will lead your mental energy distracted causing students not to learn. Another results indicates that 15% of the students will go for ‘open /close’ window, it will provide with them a quicker cool-down instead turning back he thermostats. This action is effective because it’s another way of not disturbing the classroom without asking the teacher. At least 12% of the students said they would ‘tell a teacher’. 3% of the respondents said they would ‘speak to estate department’. This will help the student with best possible quality and condition that ensures students and staff can operate in an environment that is comfortable for teaching and learning. Most of the student don’t acknowledge the purposes of this department. Also majority of them don’t know the location of the problem which causes the students not to notify any problems or queries. Lastly the last option would be ‘do nothing; these are the students that feel uncomfortable or shy taking part in other options available for them.
Question 7
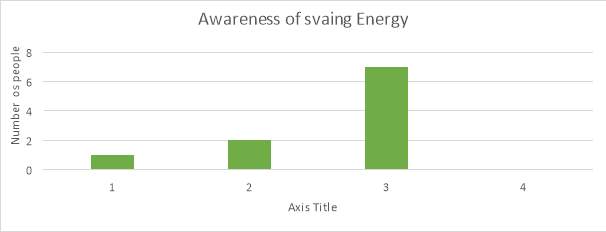
Figure 11: Number of response on awareness of saving energy
Question 7 is about awareness of saving energy. Out 10 participants, 7 of them have said they are aware of some basics ways of saving energy. The goal of this question is to reduce the amount of energy required to provide products and services. It could be said that majority of them knows simple and smart ways to actual saving money on energy consumptions. There are many ways of using energy wisely, most common one is switch off lights in empty rooms. Another way is switch appliances (such as laptops and microwaves) off rather leaving them, on standby; this will save money, energy and CO2. The bar graph shows that 20% and 10% of students that are aware 3-4 ways and a lot of ways of saving energy, while some students are clueless on how to save energy. Based on this observation it is likely energy savings competition would be of interested to more than more than the students who responded to not aware on saving energy.
Question 8
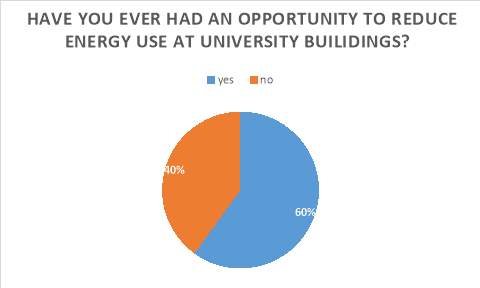
Figure 12- Number of response who had an opportunity to reduce energy use in university
There is not much information in the university buildings on how to reduce the energy consumptions by students as 60% students have stated ‘yes’. I specifically asked one student regarding the energy use you have done it in university buildings. He replied switching off lights when not in use. So in my next questionnaire I will amend this question on how to reduce energy consumptions in university
https://www.kent.ac.uk/newsd/environment/2330/students-motivated-to-reduce-energy-use
Question 9
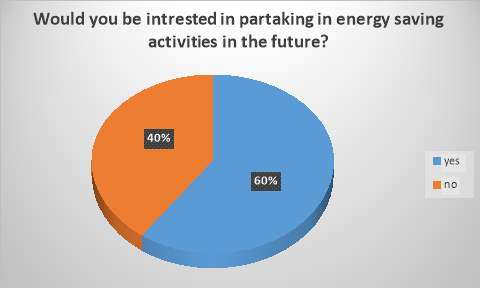
Figure 13: Number of response on students who are interested in energy saving activities in the future
The ninth question states that 60% of students are interested in partaking feel it is important to take part in energy saving activities whereas 40% of the students which is 4 out of a total of 10 students are not interested taking part towards saving energy activities in the future. It could be said that the 40% % of students who stated they are not interested is because people tend to feel busy and tedious. Whereas those who are fascinated is because they want to strengthen the energy saving publicity &education and also minimise cost as possible.
Question 10
My last question is general open to question it allows people to express what they think in their own word. Unfortunately, there wasn’t no comments to analyse.
Pilot testing conclusion
Pilot testing is a very important step in survey research. It is an absolute necessary step to ensure all kinds of errors that are associated with survey research are reduced. It also helps to improve the quality of data significantly. Before the actual survey was sent out a pilot study was conducted with ten respondents. after having a feedback from the pilot survey amendments were made to the wording of some couple questions. The pilot survey was administered by paper.
Survey Monkey –data collection
Describe the approach?
The survey asks undergraduates to provide feedback on thermal comfort in university buildings, there are 10 question, relating to the following aspects of the student’s experience. The survey was done on Survey Monkey, its free an online software that helps you to create and run professional online surveys. The way it was conducted was through web link and email invitation. Firstly, web link was sent to the Head of the year which he then posted the link on blackboard. From there students were able to complete the students. Using web link it had 31 respondents which wasn’t enough to be carried out. Therefore, email was sent to students individually from our own e mail address with a link to take the survey. The response rate based on the email was 39% and total responded was 51 fully completed.
Analysis
First question
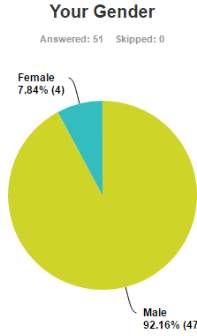
Figure 14: Number of response by gender
Figure 14 shows the response to the question of gender. The majority are men’s which had 92.16% out 100 and7.84% were female
Second question
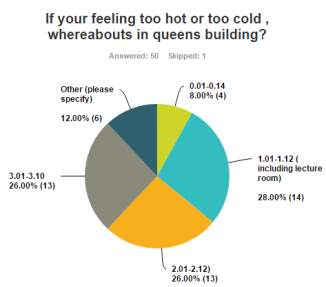
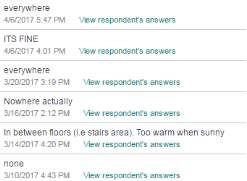
Figure 15: respondents comments on 2nd question
Figure 16: number of response by building locations of how they feel
In addition to Figure 15, the respondents were asked: If you’re feeling too hot or too cold, whereabouts in Queens building? The majority of respondents (28%) picked 1.01-1.12. and the second highest were 2.01-2.12 & 3.01-3.10 which had the same respondents (26%). 6 out 51 respondents picked ‘other’ while feeling hot and cold. They also express their comments in Figure 16 such as:
“in between floors (i.e. stairs area) Too warm when sunny”
“Everywhere”
“None”
“It’s okay”
Question 3
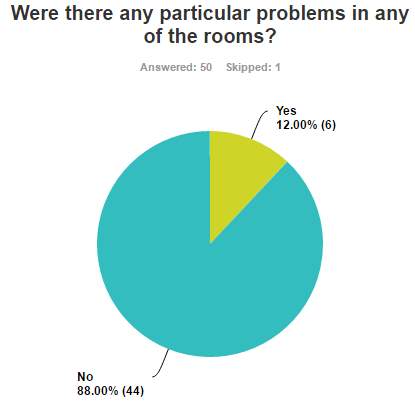
Figure 17: number of response by building locations of how they feel
Question 3 looks into any particular problems in any of the rooms. The result from question 3 which is seen in Figure 17 illustrates that 88% students answered No. It could be said that the 12% of students who answered yes.
Question 4
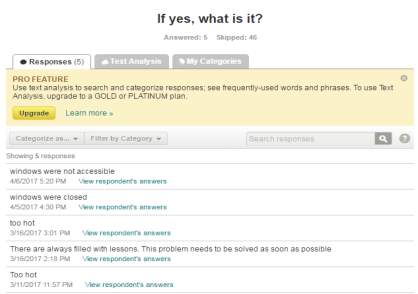
Figure 18: showing respondent’s answer of problems in rooms
Question 4 is linked to question 3. Figure 18 shows that problems were occurred in one of the rooms. As seen above comments was given by students and showed their expression such as:
“Windows were closed”
“Windows were not accessible”
“Too hot in the rooms”
“There are always filled with lesson, this problem needs to be solved as soon as possible”
Question 5
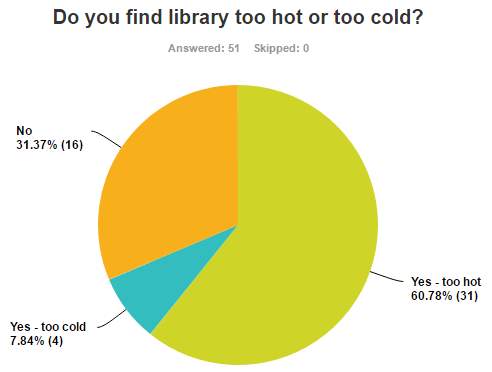
Figure 19: shows respondents answer whether finding library too hot or too cold
The fifth question tries to determine whether students find library too hot or too cold. The outcome result in figure 19 shows that 60.78% of the students find library too hot and 7.84% of the students feel too cold in the library. Out of the 51 respondents, 16 students feel like they are comfortable in library.
Question 6
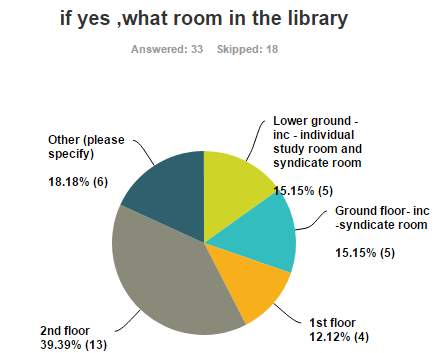
Figure 20: Number of response on room locations if they are too hot or cold in the library.
Question 6 is asking student if a room was too hot or too cold, where would it be. The result illustrates that majority of 39.39% of the participants picked second floor and 18.15% are other places in the library. The result also shows that 15.15% of the students answered lower ground and ground floor as having the same result. Regarding first floor, 12.12% of respondents picked that as an option.
Question 7
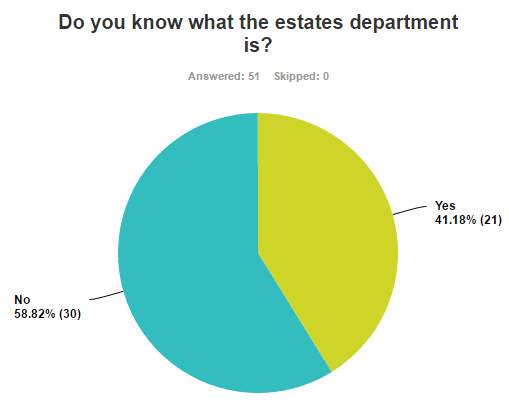
Figure 21: Number of responses of students if they know what the estates department is
Question 8 asked students if they have a clue on estates department does. It shows 58.82% of students don’t know what the estates department does and 41.18% knows the aims of estates department. Likewise, it could simply be that most students don’t know how to find the department or essentially don’t know how to approach notifying that estate department of their problems or queries. The purpose of the estates department is to deliver the university buildings with the best quality and condition that ensures students and staff can operate in an environment that is comfortable for teaching and learning.
Question 8

Figure 22: number on response on how to complain
The eight question asks student if they know how to complain. As seen in Figure 22, it can be seen that 50.98% of students know how to complain whereas 49.02% of respondents don’t know how to complain.
Question 9
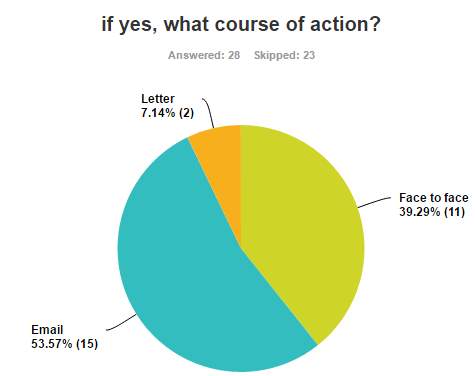
Figure 23: number of responses of actions taken when complaining
Question 9 investigates what actions would students take when complaining. The above data indicates that majority of students (53.57%) prefer emailing when complaining any problems or queries. The results also show that 39.29% of the students prefers face to face. 7.14% of the students they would do letter.
Question 10
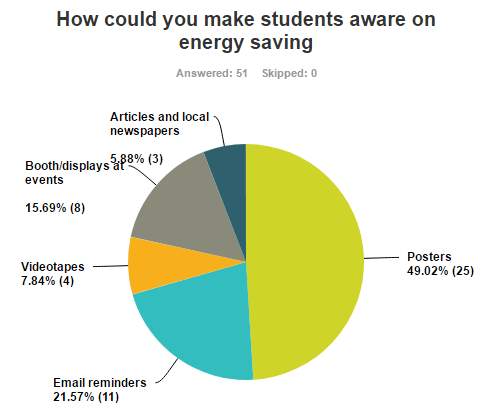
Figure 24: number of responses on saving energy activities
Question 10 talks about how student can be made aware of energy saving. Nearly 50% of the corresponding students answered posters would be the most ideal option. 4 out of 51 respondents chose videotapes as the best choice which was the lowest out of all. Email remainders produced the second largest alternative (21.57%), this was close to following by booth/displays at events (16%).
Chapter 4
Discussion/ recommendations
Focus group findings
Having spoken to couple of student’s, some said they feel too hot because windows are closed. I generally think they shouldn’t feel too hot because windows are open, they should feel too hot because too much heat is coming into the room. In library, inspection has been done where there are radiators pipes work and thermostats around. The reason why people are feeling too hot is because the pipe work could be uninsulated. If its uninsulated this mean it will give out heat.
http://greenview.dmu.ac.uk/up7loads/eceee-journal-paper.pdf
One of the recommendations would be that a lot of people in this room said “this room is to hot”. They only way they thinking is open the windows which is untrue. Another alternative could be insulate the pipework, if they open the windows, the pipe work is till giving out heat which is going out of the window.
Some people are hot – do something about it / student’s user
Discussion with students
I’ve done survey and I’ve got 5 responses why there are hot. I’ve looked in the room; I can see why there are feeling too hot. The reason could uninsulated pipes work or no thermostatic radiator valve. One student said turn the radiators down then we will be satisfied. One recommendation would be speaking to estates department because they have in control of Building energy management systems (BEMS). BEMS is a computer system which automatically monitors building services including heating lighting and ventilation etc. control. Another said “I turned the radiator down but the pipes are still hot”, this will make students not fulfilled.
Majority of the respondents of this question said “Library are too hot” and. that building is mechanical ventilated. One way to cool it down is to turn the set point down. Somewhere in library, a set point is located where a sensor will detect the temperature and that sensor will maintain the air temperature around that sensor at a certain point. If people are too hot, then feedback to the estates department where they will reduce the set point lower. This will always save money
Recommendations article
http://www.dmu.ac.uk/documents/dmu-staff/pod/workplacetemperatures.pdf
Conclusion
This study concludes on student’s experience on how to engage users to reduce energy consumption in university buildings. Looking at the results of methodology findings it can be seen the survey data that students were complaining to be too hot in university buildings.
Too hot- what do you do, what will recommend uni to do
- Do you recommend the uni to improve the heating systems?
https://www.theguardian.com/environment/2009/dec/21/central-heating-system
- Also find out recommendation
https://www.jisc.ac.uk/guides/engaging-users-to-reduce-energy-use – Engaging users to reduce energy use
References
Check that you are using the recommended referencing system – project guide. We more peer reviewed international journal articles.
Do you have some references to surveys of people and thermal comfort in buildings?
Referemces look “very thin”. No references to survey methodology for example.
Journals
- Dama, Alessandro, and Diego Angeli. “Wind And Buoyancy Driven Natural Ventilation In Double Skin Façades”. International Journal of Ventilation (2016): 1-14. Web.
Websites
- “Queens Building”. Bsria.co.uk. N.p., 2017. Web. 15 Apr. 2017.
- “Stack Effect Ventilation”. SantaCruzArchitect.wordpress.com. N.p., 2017. Web. 16 Apr. 2017
Ref works
DJAMILA, H. (2017) Indoor thermal comfort predictions: Selected issues and trends. Renewable and Sustainable Energy Reviews, 74, pp. 569-580.
P. BATTAGLIA, M. (2011) Nonprobability Sampling.
Kitzinger, J. (1994). The methodology of Focus Groups: the importance of interaction between research participants. Sociology of Health and Illness, 16(1), pp.103-121.
Fricker, R. and Schonlau, M. (2002). Advantages and Disadvantages of Internet Research Surveys: Evidence from the Literature. Field Methods, 14(4), pp.347-367.
s1st ed.
CIBSE. (1997). Natural ventilation in non-domestic building. Chartered Institution of Building Services Engineers, pp. 45-62
Santamouris, M. and Asimakopolous, D. (1996). Passive cooling of buildings. 1st ed. London: James & James.
Liddament, M. (1996). A guide to energy efficient ventilation. 1st ed. Coventry: AIVC, Air Infiltration and Ventilation Centre.
Hopkinson, R., Petherbridge, P. and Longmore, J. (1966). Daylighting. 1st ed. London: Heinemann.
Teddlie, C. and Yu, F. (2007). Mixed Methods Sampling. Journal of Mixed Methods Research, 1(1), pp.77-100.
Hox, J.J.; Boeije, H.R. (2005) Encyclopedia of social measurement, pp. 593 – 599
Bryman, A. & Bell, E. (2007), The ethics of management research: An exploratory content analysis, British Journal of Management, Vol. 18, pp. 63-77
Fink, A. (2003) How to Sample in Surveys. 2nd Edition. Thousand Oaks: Sage
Dattalo, P. (2008). Determining Sample Size. 4th ed. New York: Oxford University Press.
Awbi, H. (2008). Ventilation systems. 3rd ed. London: Taylor & Francis.
Morgan, D. (2009). Focus groups as qualitative research. 5th ed. Thousand Oaks, Calif. [u.a.]: Sage Publ.
Carey, M. and Asbury, J. (2016). Focus group research. 1st ed. Abingdon, Oxon: Routledge.
Chadderton, D. (1997). Air conditioning. 2nd ed. London: Spon, 1993.
Rubin, A. and Babbie, E. (2009). Essential research methods for social work. 2nd ed. Wadsworth Publishing Co Inc.
Website accesed _ https://energy.gov/energysaver/led-lighting
Comments
Think about how you have met your aims and objectives and think about what further work should be undertaken. 1?
Appendices A – Survey
Appendices B – Interim Report
Abstract
The purpose of this project is how can students can save energy consumptions (Less water, electricity and gas consumption) in university buildings by trying to understand what would encourage them to provide better feedback in university buildings.
Introduction
This study focuses on investigating the role student’s play in the energy process and to what extent students feel they are involved in saving energy within university buildings. This will have done by finding ways of saving energy consumptions in Queens building mainly. The reason picking this building is because most of the lectures and tutorials are located there.
Overall aim and objectives
Aim: To provide a deeper understanding on the role of students in helping to reduce energy use in university buildings.
Key objectives:
- To research the energy consumption use (lighting, water, ventilation)
- To obtain a survey on students on existing thermal comfort and energy use
- To conduct ways of collecting data method
- To review the analysis data of the methodology
- To make a set of recommendation for future studies
- Background
Energy itself is a vital commodity in our daily lives and the use of energy is growing with industrial development. Energy efficiency is one of the most effective ways when solving problems. It can save energy by reducing energy and reducing greenhouse gas emissions.
Today, heating, ventilation and air conditioning (HVAC) system provide a significant portion of energy in the world. HVAC systems are becoming more popular as it seen as a good method against ventilation demand. The problem provided by HVAC are that they are very expensive and can cause energy wastage and poor indoor air quality. It was found that 20% of the HVAC consumes up to 20% less energy than a neglect one.
- Literature research
Lighting
Natural illumination by penetration of direct solar and diffuse sky visible radiation requires correctly designed passive architecture. Large glazed area may provide sufficient daylighting at some distance into the building but can also cause glare, overheating and high heating and cooling energy costs,
Artificial lighting is provided to supplement daylight on a temporary or permanent basis. Local control of lights by manual or automatic switch aids economy in electricity consumptions.
Heating
Heat emitters giving radiation come into this type of heating. A steel single-board radiator transmits around 15% of its total heat output by radiation and the rest of convection. Radiant output multiple board and section sorts might be a lower rate of its percentages. Electric, gas and coal appliances delivers a lot of convection and is partly of convectors.
Types of radiators are:
- Hot water – single, double or triple radiators, skirting heaters
- Electricity – convectors, radiant ceiling systems and radiant appliances
- Gas, coal and oil- radiant appliances e.g. gas radiant appliances and fan room heater
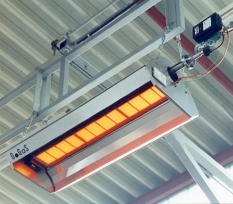
Figure 1: shows a gas radiant
Ventilation
Ventilation is a procedure where ‘clean air’ (typically outside air) is deliberately given to a space and stale air is removed. This might be refined by either natural or mechanical means.
Natural ventilation relies on moving air through a building under the natural forces of gravity and wind. In most cases, the air is brought through the building facade either through opening windows or purpose provided ventilation openings. This impose restrictions on the plan form of the buildings, in that all the ventilated spaces must be within a certain maximum distance from an external wall or ventilation outlet. An example of a typical natural ventilation strategy is illustrated in Figure 1.1
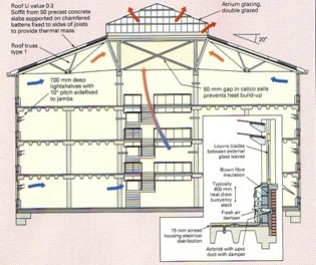
Figure 1.1: a typical natural ventilation strategy at the Anglia Polytechnic
Mechanical ventilation
This type of ventilation usually provided where the plan form of the building means that natural ventilation cannot penetrate to the core areas, where the building is subject to unacceptable levels of noise, or where filtration or other air treatment is required. The advantage of mechanical ventilation is that the ventilation rate is controllable and ventilation air can be introduced more uniformly across the space.
Methodology
Data collection is a term which is used to describe a process of preparing and collecting data. The purpose of data collection is to obtain information, to keep on record, to make decisions about important issues and lastly to pass in formation on to others. Data collection has various methods and it is an important aspect of any type of research study.
There are two types of data
- Primary data – a data that has been collected from first-hand experiences. it has more reliable, authentic and not been published anywhere. Primary data has not been changed by human being
- Secondary data – a data which have already been collected by others and which have already passed through the statistical process. Secondary data may be available in the published or unpublished form. These are usually in journals, newspaper etc.
| Areas of comparison | Qualitative data | Quantitative data |
| Type of information | Words | Numbers |
| Method of collection | Interviews, videos , audio recordings ,description, study cases | Counts, ratings , scores |
| Focus | Why?
How do things work |
What?
How many? |
| Quantity of data | Small | large |
Energy consumptions at Queens building 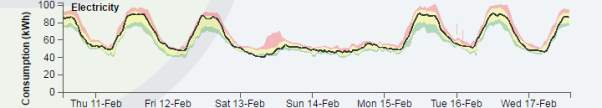
This above data shows an electricity consumptions data in queens building. The red zone represents high consumptions, yellow shows normal consumption and the last one represents low consumptions. The black line at the bottom shows energy consumptions day by day including night time. As seen on the graph, the highest usage of electricity is 87kWh
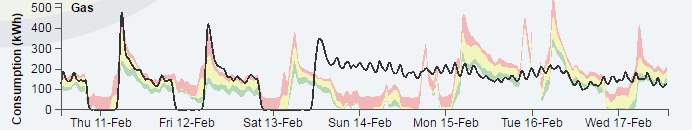
This above shows a gas consumptions data in queens building. The black line starting form Sunday 14th feb to Wednesday 17th feb shows someone left the gas /heating on.
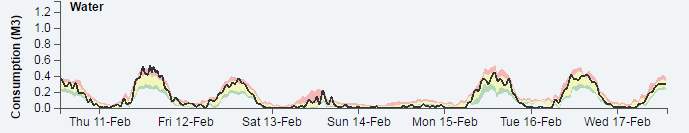
This is water consumption data showing water was switched on during daytime
https://www.staffs.ac.uk/support_depts/environment/energy/use/
- Progress thus far
| Task | Status |
| Literature Research | Finished |
| Submit Project Brief | Finished |
| Produce Interim Report | Finished |
- Plan for the next stage of the project with work breakdown structure and a Gantt chart.
Work Breakdown Structure and Gantt Chart
Tasks that need to be finished.
| Task | Status |
| To begin the main report | incomplete |
| To create surveys e.g. questionnaire in discussion forums | incomplete |
| Analysis of data | incomplete |
| Submit Final Report | incomplete |
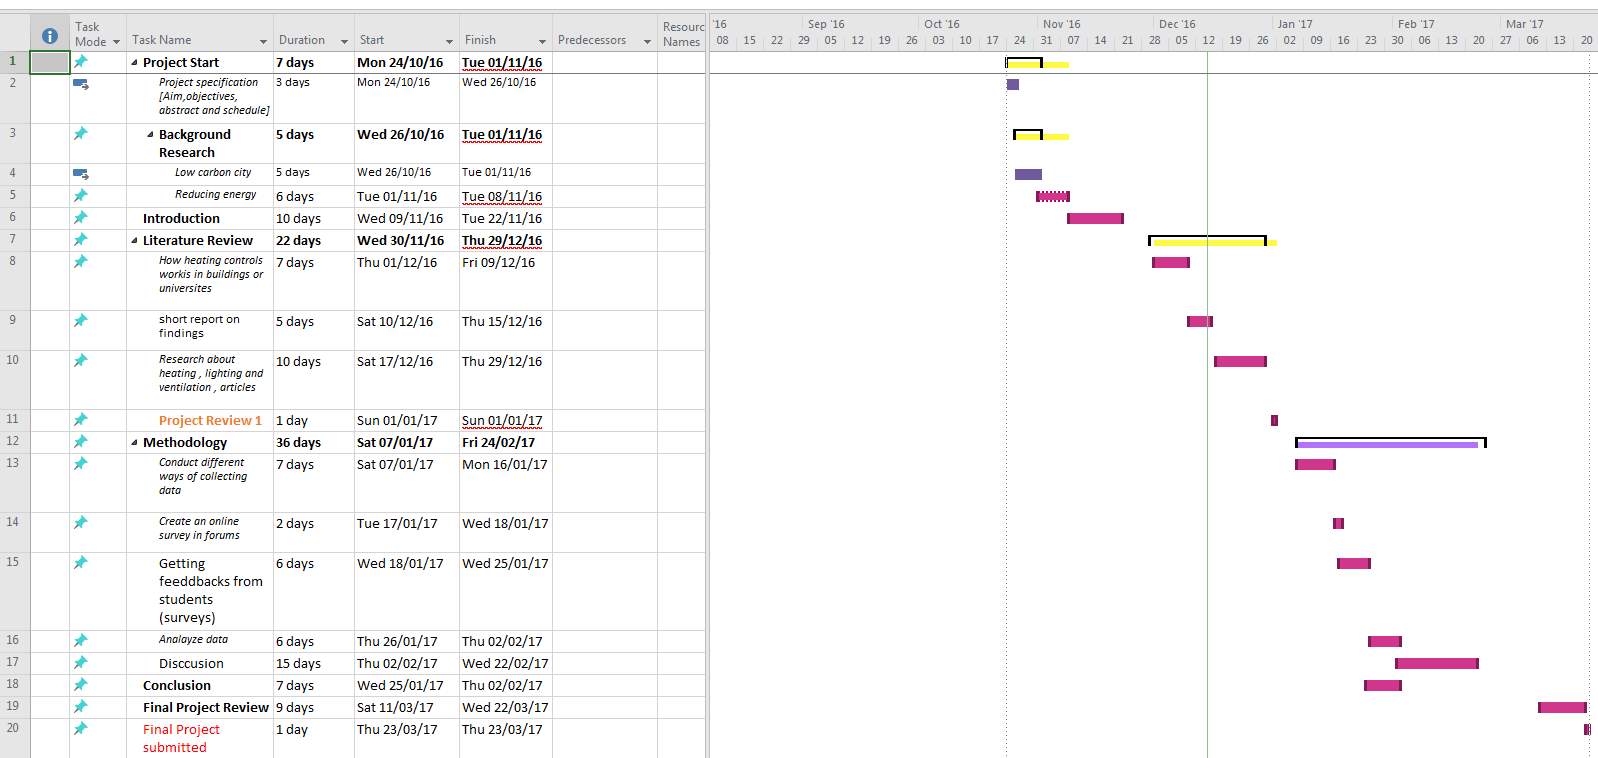
Gantt chart
Conclusions
In conclusion, the report will can achieve the objectives by following the Gantt chart and the work flow diagram show above.
At the end of the project plan, the report will include;
- Detailed research and analysis of reducing energy consumption in university buildings
- Ways of conducting data method
- Graphs on performance consumption data
References
Books – A guide to Energy efficient ventilation- Liddament, Martin W;
Books- heating, cooling and lighting – Norbert Lechne
Cite This Work
To export a reference to this article please select a referencing stye below:
Related Services
View all


Related Content
All TagsContent relating to: "Students"
Students are usually defined as someone enrolled in a school, college, or university, for learning or is in training for a particular profession, e.g. a student nurse.
Related Articles

DMCA / Removal Request
If you are the original writer of this dissertation and no longer wish to have your work published on the UKDiss.com website then please: