Groundwater Quality & Protection in Australia
Info: 10065 words (40 pages) Dissertation
Published: 10th Dec 2019
Tagged: Environmental StudiesGeology
GROUNDWATER QUALITY & PROTECTION IN AUSTRALIA
Abstract
The overall objectives of the research are to review the groundwater contamination and remediation. The approach relies on finding the best methods of groundwater remediation. The objectives for this capstone research is:
- To study the groundwater resources of Australia.
- To study the groundwater uses sectors of Australia and the sources of groundwater.
- To find the ground water uses in different states of Australia.
- To study the quality problems and contamination of groundwater in Australia.
- To state the quality improvement solutions for groundwater in Australia.
List of Tables
Table 2. 2 Total value of dependent production of groundwater (NWC, 2012)
Table 4. 1 The beneficial uses to be protected for various salinities (ANZECC & ARMCANZ 2000).
List of Figures
Figure 2. 1 The presentation of groundwater as part of the water cycle (NWC 2012).
Figure 2. 2 Australia’s groundwater resources (Harrington and Cook, 2014).
Figure 2. 3 Groundwater values in Australian economy (NWA, 2012).
Figure 2. 4 Australia’s major water storages (Water in Australia, 2014)
Figure 2. 5 Change in annual groundwater use (GL) between 1983–84, 1996–97 and 2009–10 (NWC 2012)
Figure 2. 8 Groundwater use as a percentage of total water use ((Harrington and Cook, 2014).
Figure 2. 9 Estimated total water use in Australia, 2013–14 (NWC, 2012).
Figure 3. 1 Groundwater Contamination – examples of potential sources and pathways (NWC 2012)
Figure 3. 2 Processes leading to dryland salinity
Figure 3. 3 Conceptual diagram of seawater intrusion (Werner, 2010).
Figure 3. 4 The distribution of places of the threat of seawater intrusion (Werner, 2010).
Table of Contents
2.2. Definition of Groundwater
2.3. Importance of groundwater
2.4. Groundwater resource in Australia
2.5. Economic values of groundwater
2.6. Water availability in Australia
2.7.2. Drinking water for livestock
2.8. Ground water uses in different states of Australia
Chapter 3 – Groundwater quality problems in Australia
3.1. Groundwater Contamination Source
3.2. Salinisation of groundwater resources
3.4. Effect of climate change on availability and quality of groundwater resources
3.5. Impact of mining in groundwater resources of Australia
Chapter 4 – Groundwater quality improvement solutions
4.3. Environment Protection and Biodiversity Act 1999
4.5. Environmental values of groundwater system
Chapter 1 – Introduction
Groundwater resources have been polluted by increasing anthropogenic emissions as a result of the intensive industrialization (An et al., 2013). Besides, for lack of the fundamental and awareness of protection of groundwater, the problem of contamination is getting worse. Because groundwater pollution is very complex and invisible and usually has a long-term impact (Shrestha et al., 2016), it becomes very difficult to restore compared to surface waters once groundwater is polluted by certain substances (Rahmati et al., 2015). In many parts of the world, groundwater serves as the sole source of drinking water in rural communities and urban areas. Inorganic anions are of great importance since these are toxic and harmful to humans and animals at very low concentrations (ppb). As there are usually no organoleptic changes in drinking water due to the presence of trace levels of toxic inorganic anions, it is therefore possible that some of them may remain undetected, thereby increasing the possible health risks. Presence of several naturally occurring, anthropogenic and industry generated ions such as fluoride, arsenic, nitrate, sulfate, iron, manganese, chloride, selenium, heavy metals, and radioactive materials may greatly compromise water quality, leading to health problems.
The most significant inorganic pollutants in groundwater affecting human health at the global scale, according to the WHO, are arsenic and fluoride (Thompson et al., 2007). Arsenic is well known for its carcinogenicity in kidney, lung, liver, skin, and bladder. At high concentrations, As causes gastrointestinal problems and arsenicosis, which arise mainly via consumption of water containing As and its subsequent accumulation in the body (Kadirvel et al., 2007). It is believed that high fluoride intake is associated with many health problems, cancer, impaired kidney function, digestive and nervous system disease, decreased immunity, Alzheimer’s disease, nausea, adverse pregnancy outcomes, respiratory problems, endocrine glands, liver and other organs (Bhatnagar et al., 2011). It is important to remove these pollutants from groundwater.
1.1 Sources of groundwater
Contamination of groundwater can occur from many natural or human activities. Housing, municipal, commercial, industrial and agricultural activities can affect the quality of groundwater. Pollutants can reach groundwater from the ground. For example, waste from stored industrial waste, sources below the ground, but above the groundwater table, such as septic systems or leaks of underground oil storage systems; structures below groundwater level, such as wells; or from contaminated refill water.
1.2 Remediation techniques
Different studies should be performed in order to turn around the situation of the groundwater pollution, and huge technical efforts should be conducted to improve the quality of groundwater systems. Accordingly, various technologies have been developed for groundwater remediation, i.e. air sparging, permeable reactive barriers, and pump-treat, et al. Many studies have focused on dis- cussing the technologies for groundwater remediation. For instance, Baciocchi et al. (2014) discussed the optimal site conditions for in-situ chemical oxidation to groundwater remediation, the management aspects and side effects related to in-situ chemical oxidation application, and the new protocol for in situ chemical oxidation. Tosco et al. (2014) have carried out a systematic over- view of nanoscale zero-valent iron particles for groundwater remediation. Thiruvenkatachari et al. (2008) provided an overview of the upcoming technology of permeable reactive barriers for groundwater remediation.
The most commonly used removal methods are for groundwater contaminants such as fluoride and arsenic are chemical treatment, adsorption onto adsorptive media, co-precipitation and adsorption onto coagulated flocs, ion exchange resin and membrane processes.
Chapter 2 – Literature Review
2.1. Introduction
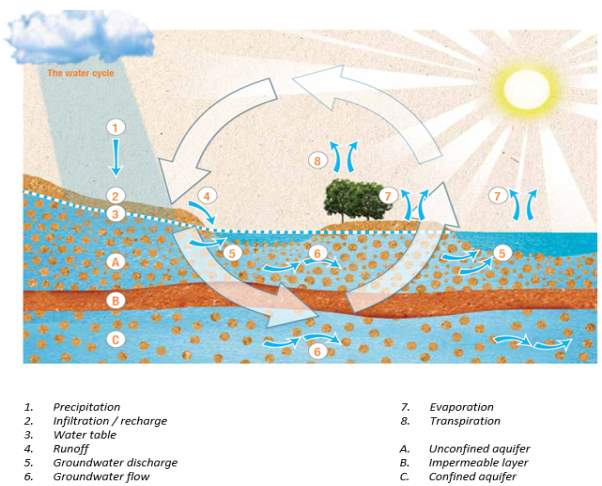
Groundwater is defined indifferently across Australia, and it is essential to get the idea and know the actual meaning that is relevant to the specific location being considered. The definition of groundwater is as water located under the ground in the area which is called saturated zone (i.e., aquifer) and originates from two primary sources (NWC 2012) and during raining, water infiltrates the soil and unsaturated bedrock and may reach the water table. Moreover, groundwater can also move between rivers, streams, and wetlands where they are connected to aquifers and can be lost from an aquifer via flow to surface water features such as rivers, streams, springs, wetlands, and oceans, as well as to other aquifers. Groundwater also losses from aquifers and also occur through evaporation from the water table, transpiration by vegetation, and groundwater pumping. Figure 2.1. shows the groundwater as part of the water cycle which describes different sources precipitation, infiltration, runoff, etc.
Figure 2. 1 The presentation of groundwater as part of the water cycle (NWC 2012).
2.2. Groundwater in Australia
National Water Association (2012) defines groundwater as the water located beneath the surface of the Earth. It is the surface water which migrates through the ground and becomes stored in porous soils and rocks. The Rocks and soils that hold and transmit usable quantities of water are called aquifers. Aquifers are discussed further in this report. There are two primary sources of groundwater: – Rainwater which seeps through the soil until it reaches the aquifer – Water from rivers and streams draining into the ground which entered the aquifer. Groundwater recharge refers to replenishment of water to a groundwater system from the ground surface (NWA 2012), and the infiltration of rainfall beneath the land surface and its movement to the aquifer is a form of natural recharge. Additionally, aquifers can also be recharged from surface water infiltrating the ground from water bodies such as rivers, creeks, dams, and wetlands. Further, aquifers can also be artificially recharged for subsequent recovery or environmental benefit. This is known as managed aquifer recharge (MAR) or aquifer storage and recovery (ASR). For example, MAR can be used to store desalinated seawater or recycled water in an underground aquifer to reduce transportation costs and water lost to evaporation. Bores and Wells Groundwater is extracted via a bore or well (NWA 2012) whereas a bore is a pipe or open hole which stay in the ground and intersects saturated ground and fills with groundwater. Usually, a pump is needed to bring water to the surface. A drill is generally used to build bores and can be formed to varying depths, depending on the aquifer to be reached, the type of rock and the desired water yield. Wells, on the other hand, are constructed by manual digging, driving or piling.
2.3. Importance of groundwater
Groundwater constitutes about 17% of Australia’s accessible water resources and accounts for up to 30% of total water consumption in particular regions (NWA 2012). It is essential due to following reasons such as remote indigenous communities, mining operations, and rural properties rely entirely on groundwater for their water supply. Depletion of groundwater can affect communities, agriculture and the industries such as mining which depend on groundwater supplies and it can also change the environment such as reduction of river flows. The river flows depend on streams from shallow groundwater. Or by drying out groundwater– dependent ecosystems and pollution of groundwater can lead to change in the water chemistry and potentially cause an entire species to die out at a local level rendering the groundwater unsafe for habitation.
2.4. Groundwater resources in Australia
Presently, groundwater usage is increasing, and it is the primary source of water for much of Australia’s dry interior. Groundwater has been considered to as the forgotten resource of Australia and despite the fact that it is currently stated as accounts for over 30 percent of Australia’s water consumption. But the problem is that we simply do not know enough about this vital water resource, and how to manage it and in the past groundwater was regarded as a resource to be mined, much like a mineral resource. Nowadays, however, generally managed as a renewable resource and recognised that it is recharged from rainfall and discharges from rivers, lakes, the oceans, and through vegetation and groundwater management faces many of the same sustainability issues such as of surface water. Although ecosystems depend on the groundwater discharge and over-extraction of groundwater, it can reduce the height of water tables or the pressure of water that impacts upon the dependent ecosystems and on other users.
But the main problem that arises with groundwater management in Australia is that aquifer recharge rates are notoriously difficult to measure and estimate, and it may take decades for the water table in the large aquifers or water pressure response to spread across the whole aquifer. However, there are the hidden added difficulties of groundwater below the surface and move slowly, for this reason, over-use may take many years to detect. Although the complex movement and interactions of different layers of water can be hard to detect, they have a particular effect on the sustainable use of the resource. The examples can be the protection of fresh groundwater from being polluted by nearby saline layers. Although, many groundwater systems are complex and poorly understood, as are their connections to the broader environment and ultimately, we do not know the full potential of groundwater in Australia even though pressures on the resource are growing. Figure 2.2. Describes an outline representation of the variety of aquifers and their productivity across Australia and the dark blue and green colour represents most productive aquifers.
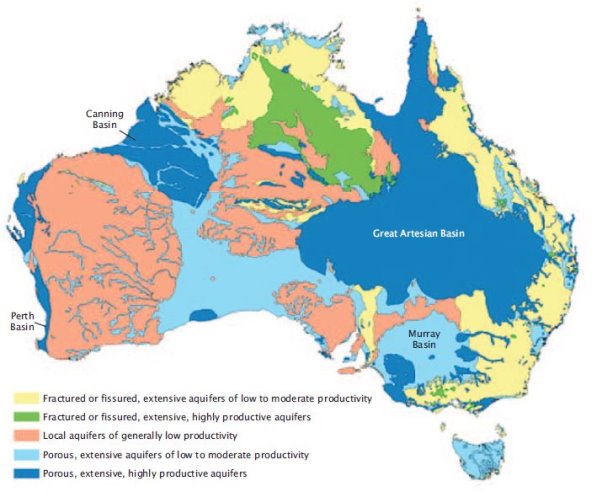
Figure 2. 2 Australia’s groundwater resources (Harrington and Cook, 2014).
In Australia, as groundwater use is increased as much as surface water resources become fully assigned, and as the demand grows for water in drier regions in which groundwater is the predominant or, at times only resource. Groundwater is found beneath the surface level but is only usable, and the water is not too deep. Moreover, the rock or soil is permeable, and where it has suitable quality, and a significant proportion of groundwater in Australia is unusable because of natural salinity.
2.5. Economic values of groundwater
The research to estimate the economic Value of Groundwater in Australia was carried out by the National Centre for Groundwater Research (NCGR) and by Deloitte Access Economics in 2013, and it was found that it contributes approximately figure of $34 billion in Australia’s gross domestic product (GDP) each year (NWC, 2012). Figure 2.3 describes the value of groundwater in the Australian economy. Australia currently uses about 3500 billion litres of groundwater in a year and agriculture typically used about 2GL of groundwater each year. It is used mainly for irrigation and livestock, and groundwater underpins $4.7B of production, On the other hand, mining used 410,000 megalitres (ML), and groundwater underpins mining production of $24.5B each year and manufacturing used 588,000ML, and groundwater underpins production of $4.4B to the economy a year.
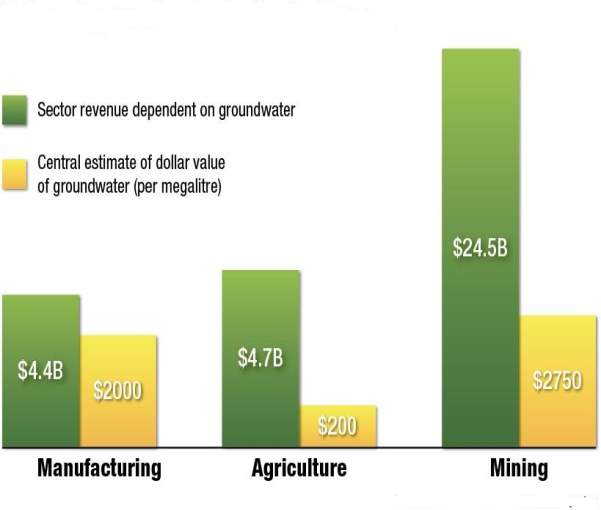
Figure 2. 3 Groundwater values in Australian economy (NWA, 2012).
2.6. Water availability in Australia
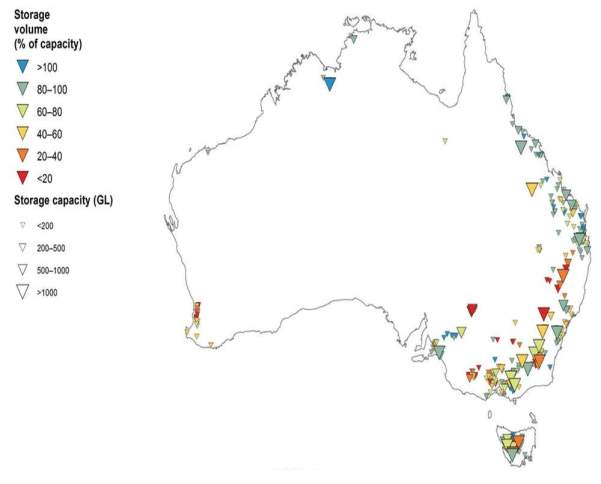
At the same time, greater protection is being afforded to the environment through the purchase of entitlements from water users and investments in water-saving infrastructure. Australia has extensive water supply and different administrations are used. Through the availability of water is being increased using recycled water and desalinated water. At the same time, the water saving is protected and afforded to the environment by purchase of the entitlement form the investors and the users. Figure 2.4. Presents the status of Australia’s major water storages on 30 June 2014 and it shows that the 100% capacity was on the border of Northern Territory and Western Australia and 80-100% is in New South Wales, Queensland, and Victoria, etc.
Figure 2. 4 Australia’s major water storages (Water in Australia, 2014)
Table 2. 1 represents the amounts of water available nationally in various categoriesand shows that groundwater availability was 7000 Gigalitres in Australia.
Table 2.1. Available water for use across Australia at 30 June 2014 (Water in Australia, 2014)
| Availability of category | Gigalitres
|
| Storages at 30 June 2014 (63% of capacity) | 51 600 |
| Groundwater entitlements | 7 000 |
| Marine desalinisation plant capacity | 630 |
| Recycling plant capacity | 940 |
| Surface water entitlements | 23 000 |
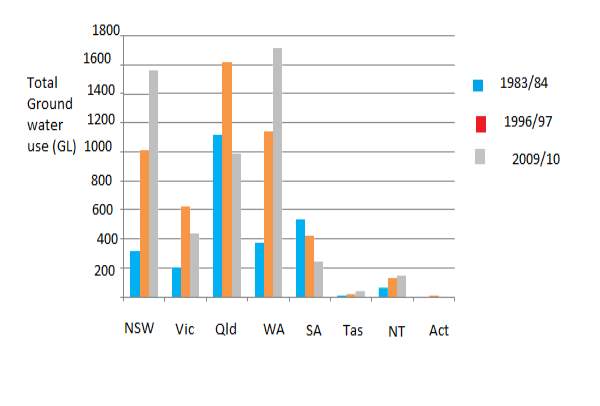
It is found that roughly 5,000 GL per annum, has been reported to be sourced from groundwater (Harrington and Cook, 2014) and many in the groundwater sector consider that actual groundwater use may be approximately double this. It is reported that groundwater use in Australia increased by approximately 60% between 1983–84 and 1996–97, from 2,600 GL/yr to 4,200 GL/yr (NWC, 2012) (Figure 2.5). Figure 2.5 presents change in annual groundwater use (GL) between 1983–84, 1996–97 and 2009–10 and shows an increase in groundwater use between 1996–97 and 2009–10 for some states, but a decrease for others. The apparent decrease may be a misrepresentation in some cases, due to the inconsistencies in data as described above. Moreover, the decreases in use over this time frame are plausible for those jurisdictions in the south-east of the Australian continent as irrigation is a major use of groundwater (e.g. SA and Victoria).
Figure 2. 5 Change in annual groundwater use (GL) between 1983–84, 1996–97 and 2009–10 (NWC 2012)
2.7. Groundwater use sectors
In Australia, groundwater is used in some different contexts. Among them, agriculture is a key user which cover approximately 60-70% of Australia’s total groundwater use. After that, the 30-40% of groundwater is used for other industries such as mining and manufacturing and also for other urban consumption (for commercial, industrial, municipal and domestic end uses. Groundwater will only be utilised in areas where reliable surface water is the main resource when surface water is temporarily unavailable. Although, in some cases, groundwater will be used to supplement surface water sources and can often be a cheaper source of supply and groundwater serves as the only reliable source of freshwater in arid and semi-arid Australia.
2.7.1. Irrigated agriculture
Generally, in Australia, groundwater is used in agriculture for irrigation of crops and pasture for livestock. Moreover, groundwater is used in some areas (such as Shepparton in Victoria) as a cheaper supplement for surface water. In these case, groundwater is ‘blended’ to meet quality requirements. In areas that would otherwise be too arid to cultivate, groundwater can enable agriculture to be feasible, and in semi-arid areas (where another supply source might exist in limited volumes), groundwater can improve agricultural productivity by increasing available water. Irrigated agriculture includes crops (cotton, rice, and sugarcane), vegetable growing, fruit and tree nut growing, livestock farming and other crops. It does not include agricultural support services, forestry or aquaculture.
2.7.2. Drinking water for livestock
For livestock in Australia, groundwater essentially provides the only source of drinking water without which livestock grazing could not occur, and this use predominantly consists of cattle and sheep grazing, but also includes water for some other livestock species.
2.7.3. Mining
Groundwater is a vital resource for many mining activities which includes coal, oil, gas, metal, minerals, quarries and exploration activities. Most of the large mining projects and much of the petroleum production industry are completely dependent on groundwater in Australia’s arid zones. The groundwater usages in the mining industry for the following operational activities such as:
- For the transportation of ore and waste in slurries and suspension.
- For the separation of minerals through chemical processes.
- For the physical separation of material such as in centrifugal separation.
- For the dust suppression during mineral processing and around roads and conveyors.
Table 2.2 shows that the total value of production as groundwater is a significant input into production is $33.8 in aggregate billion throughout Australia. Metal ore mining makes up 73% (or $24.4 billion) of this total, and this is not surprising as it is a large water-dependent industry. A lot of activity occurs in arid areas which are close to 100% groundwater dependent. On the other hand, irrigation in agriculture is the second major contributor with 11% (or $3.7 billion), which is a significant contribution showing 29% of water sourced for agriculture is from groundwater. Moreover a further $1 billion also occurs in agriculture, through the value of production from livestock in groundwater dependent areas.
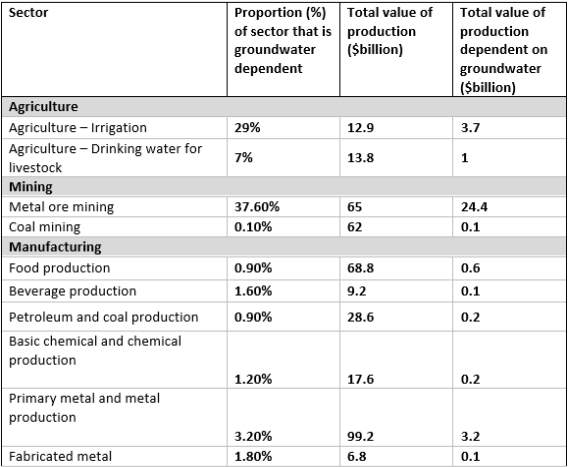
Table 2. 2 Total value of dependent production of groundwater (NWC, 2012)
2.8. Ground water uses in different states of Australia
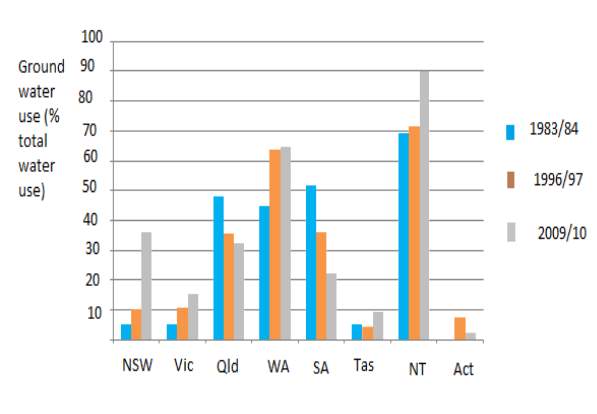
Figure 2.6 shows the use of groundwater for every state and territory of Australia as a proportion of total water usage from all sources for 1983–84, 1996–97 and 2009–10 and Figure 2.7 displays use of groundwater per state and territory from the total national groundwater use in 2009–10 (NWC, 2012). Figure 2.7 presents that Western Australia, New South Wales, and Queensland are the highest groundwater users of the Australian states and territories in that time. These figures show that the states and territories with the most dependence on groundwater are Western Australia, the Northern Territory, and New South Wales. Figure 2.6 presents that the Northern Territory sources 90% of its water from aquifers. The highest values of concentration of groundwater use is in the Murray–Darling Basin that covers parts of South Australia, Victoria, New South Wales and Queensland, where an average of 1,795 GL of groundwater is abstracted annually, primarily to support irrigated agriculture (CSIRO (2008). Here, groundwater use represents 16% of total water use in the basin (CSIRO, 2008).
Figure 2. 6 Groundwater use for each state and territory as a proportion of total water use from all sources for 1983–84, 1996–97 and 2009–10 ((Harrington and Cook, 2014).
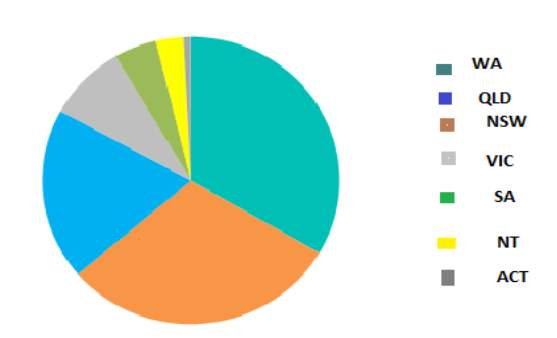
Figure 2.7 suggests that New South Wales and Victoria have also significantly increased their reliance on groundwater over the past two decades. It presents total ground water use by state and suggests that New South Wales and Victoria have also significantly increased their reliance on groundwater over the past two decades.
Figure 2. 7 Groundwater use for each state or territory as a proportion of total national groundwater use in 2009–10 ((Harrington and Cook, 2014).
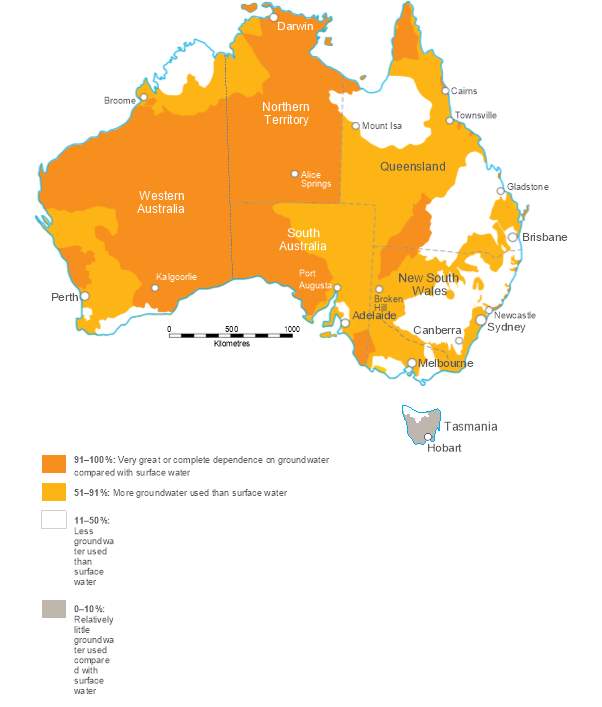
Figure 2.8 gives the groundwater use at a national scale as a percentage of total water use which shows that Western Australia, New South Wales and Queensland are very much dependant on groundwater. On the other hand, Tasmania is the less dependent state among all.
Figure 2. 8 Groundwater use as a percentage of total water use ((Harrington and Cook, 2014).
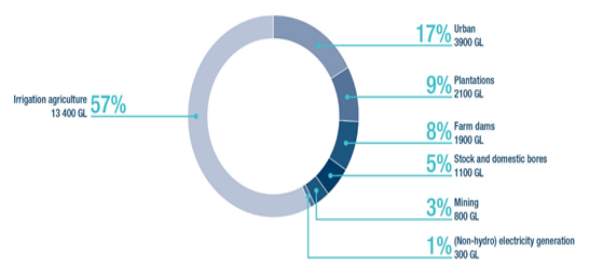
Figure 2.9 gives the information of water used nationally for the important use categories in 2013-14. In 2013-14, the estimated total water use across Australia was 23 500 GL where the top two water usages were irrigation (57 % of total use) and urban consumption (17 % of total use). Moreover, in this period, the main irrigation usages is in the Murray–Darling Basin which was just over 9500 GL and the estimated total surface water use for irrigation in the Murray–Darling Basin decreased from about 11 000 GL to about 8400 GL (CSIRO, 2008). In 2013–14, the drop of 24 % regarding this matter and it was stated that groundwater usage for irrigation increased by 18 % to just over 1100 GL (NWC, 2012). Because of drier conditions and limited surface water allocation announcements, particularly in the northern Murray–Darling Basin. In the Queensland and Victorian coastal regions, the coastal regions surrounding Perth and Adelaide, northeastern Tasmania, and the Ord irrigation scheme in northern Australia around 3900 GL of groundwater was used for irrigation.
Figure 2. 9 Estimated total water use in Australia, 2013–14 (NWC, 2012).
Moreover, total water use of groundwater in 2013–14 for the major cities in Australia, shows no significant changes in recent years for Sydney, Melbourne, and South East Queensland. All record states that slight increases in water use since 2011–12 whereas Sydney, Melbourne, and South East Queensland used mainly surface water and Perth and Adelaide used increasing amounts of desalinated water. Besides that, urban residential use in 2013–14 was 185 kL per property, up 3 percent from 2012–13. However, the usage per property has not increased significantly from the levels at the end of the Millennium Drought.
2.9. Conclusion
Australia is the driest inhabited continent in the world and comprises extensive arid and semi-arid areas with limited surface water. Australia has many different types of groundwater sources, and these vary regarding quality, productivity, and size. The future value of groundwater is that much of it is a renewable resource, so long as use remains below the sustainable yield. The exception to this is, of course, fossil water which takes many years to accumulate in aquifers and is therefore not quickly replenished. The renewable proportion of groundwater, however, can continue to add economic value on a perpetual basis, unlike many of the non-renewable natural resources that the economy also depends upon that.
Chapter 3 – Groundwater quality problems in Australia
There are different issues regarding the groundwater quality in Australia such as salinity, the effect of climate change, saltwater intrusion and contamination of coastal aquifers, mine and formation dewatering, etc.
3.1. Groundwater Contamination Source
In Australia, the contamination of groundwater can occur when three main components exist such as a potential source of contamination, then an aquifer as the receptor, and the pathway for transfer between the two. For groundwater contamination, one of the primary pathways is infiltration of contaminants from the land surface. It can happen through the unsaturated zone and to the unconfined aquifer below. On the other hand, shallow unconfined aquifers which include karstic, conduit and fractured rock aquifers which are particularly vulnerable to contamination. Especially it can happen in the places where the associated land-use includes hazardous activities and uncontrolled of contamination sources. The main contribution of porosity and permeability of the unsaturated zone happens significantly to the travel time of contaminants between the source and the groundwater. Moreover, a highly porous or permeable unsaturated zone, such as karst limestone which can result in the relatively quick transfer of contaminants from the surface to groundwater. However, the chemical reaction of contaminants with the soil and rock of the unsaturated zone can be the reason of slow or even stop contamination reaching groundwater. For groundwater quality management, the unsaturated zone can be an important consideration and other pathways for contamination can affect both the unconfined and confined aquifers. For this reason, it can be the problem such as leakage of poor quality groundwater into an aquifer, waste disposal via wells, or leakage from poorly constructed, maintained or decommissioned wells. On the other hand, leakage can occur through aquitards and have been damaged by several activities such as poorly managed mine subsidence or hydraulic fracturing.
Figure 3. 1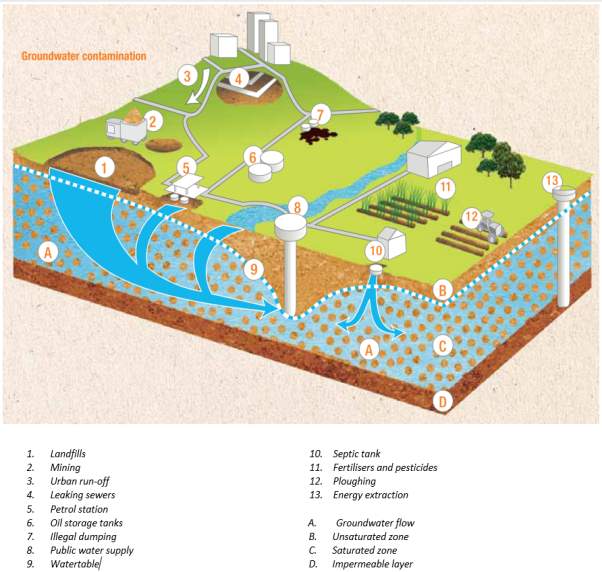
Groundwater Contamination – examples of potential sources and pathways (NWC 2012)
3.2. Salinisation of groundwater resources
One of the main problems of Australian groundwater resource management issues is salinity and together is one of the most important environmental problems. Across the Australian landscape, salts are naturally distributed, and they produce mainly from deposits of oceanic salt from rain and wind and soil. They are concentrated in soil water by evaporation and transpiration of the plants and in a healthy catchment. In that place, the water and solute systems are in the balance and salt is slowly leached downwards by rainfall which is stored in the soil below the root zone of the vegetation.
Although groundwater is available in Australia, the most of the amount of it is not suitable for drinking or agricultural purposes because of salinity. This is the particular case in internally draining arid and semi-arid regions where evaporation considerably exceeds rainfall. The low levels of salts which are present in rainfall become concentrated during recharge through the processes of evaporation and transpiration. This is leading to low recharge rates and the gradual accumulation of salt in the landscape, and ancient groundwater resources that have long flow paths are also often salty. Here, the groundwater picks up salts from the dissolution of minerals as it passes through the aquifers.
Detailed groundwater salinity maps are available for many local regions and aquifer systems of Australia. However, Figure 3.2 describes a simplified overview of groundwater salinity in Australia. It is also showing the proportion of each groundwater province with groundwater salinity (total dissolved salts) greater than 1,500 mg/L (Degens et al., 2012). This number is relevant because it is the salinity threshold for irrigation of most crops, although some crops can tolerate higher salinities.
There are two types of salinity in Australia such as:
- One type is primary or naturally occurring salinity, which is part of the Australian landscape, reflects the development of this landscape over time such as the marine plains found around the coastline of Australia, and the salt lakes in central and western Australia, and in the Murray-Darling Basin.
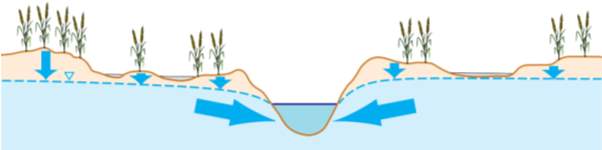
- The second type is secondary salinity which is the salinisation of land and water resources due to land-use impacts by humans, and it includes salinity that results from dryland management systems (dryland salinity) and irrigation systems (irrigation).
Figure 3.2 presents the processes leading to dryland salinity which increases the flow of saline groundwater into rivers and streams, increasing river salinity presents that increased recharge can increase hydraulic gradients towards surface-water bodies. The other reason is surface runoff from areas of land salinisation which can also contribute to stream salinity, and rising water tables also affect rural infrastructure including buildings, roads, pipes and underground cables, causing significant infrastructure costs. Another form of salinity which is irrigation salinity and the extent, causes and management options for irrigation salinity is now well understood, as this formed an important part of the Murray– Darling Basin Commission’s activities for more than twenty years. The National Dryland Salinity Program also operated between 1993 and 2004, with an investment of $40 million, most of which was spent on research and development into the causes, costs, consequences, solutions, and management of dryland salinity in Australia.
Table 3.1 shows the best available estimates of areas affected by or at risk from dryland salinity at the time (1998–2000) (National Land and Water Resources Audit, 2001).
Table 3. 1 Areas (hectares) with a high potential to develop dryland salinity in Australia (Harrington et al., 2014)
| State | 1998–2000 |
| New South Wales | 181,000 |
| Victoria | 670,000 |
| Queensland | not assessed |
| South Australia | 390,000 |
| Western Australia | 4,363,000 |
| Tasmania
Total |
54,000
5,658,000 |
A. Before clearing Perennial native vegetation

Rate of groundwater recharge is very low
Shortly after clearing
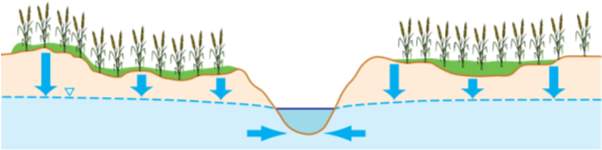
Drainage of water below root zone increases. This takes a while to reach (recharge) the watertable so the watertable does not rise immediately (time lag)
Later
Increased flow of saline groundwater into river
Groundwater recharge eventually increases and the watertable rises
Figure 3. 2 Processes leading to dryland salinity
3.3. Seawater intrusion
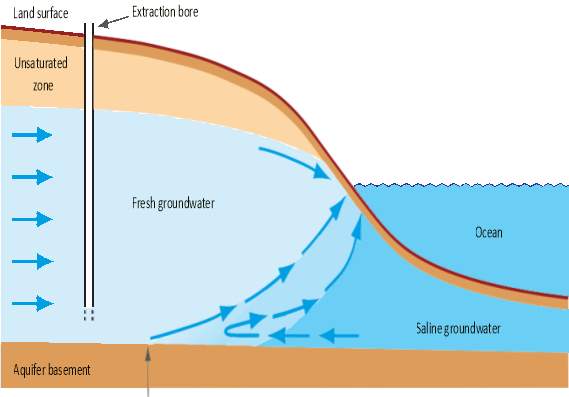
Figure 3.3 presents the conceptual diagram of seawater intrusion which is the landward encroachment of seawater into fresh coastal aquifers and typically, a wedge of saline groundwater underlies the coastal zone.) Seawater intrusion can move inland in response to hydrological changes, such as groundwater extraction, reductions in groundwater recharge, construction of canals and sea level rise. The problem of seawater intrusion has been enhanced in Australia by an increased use of coastal groundwater and caused by increasing populations of coastal areas, and below-average rainfall (Werner, 2010). In many coastal areas, most groundwater use is from un-monitored domestic bores, meaning that the total extraction of coastal groundwater is unknown (Werner, 2010). Figure 3.4 demonstrates the distribution of places of the threat of seawater intrusion. From Figure 3.4, the risk of seawater intrusion has been identified to be greatest in Queensland, although smaller but significant areas of Victoria, South Australia, and Western Australia have also been identified as being at risk (Nation et al., 2008).
Figure 3. 3 Conceptual diagram of seawater intrusion (Werner, 2010).
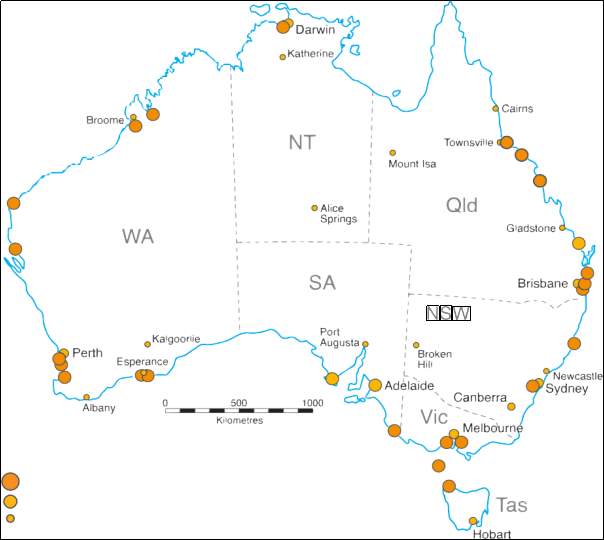
Figure 3. 4 The distribution of places of the threat of seawater intrusion (Werner, 2010).
3.4. Effect of climate change on availability and quality of groundwater resources
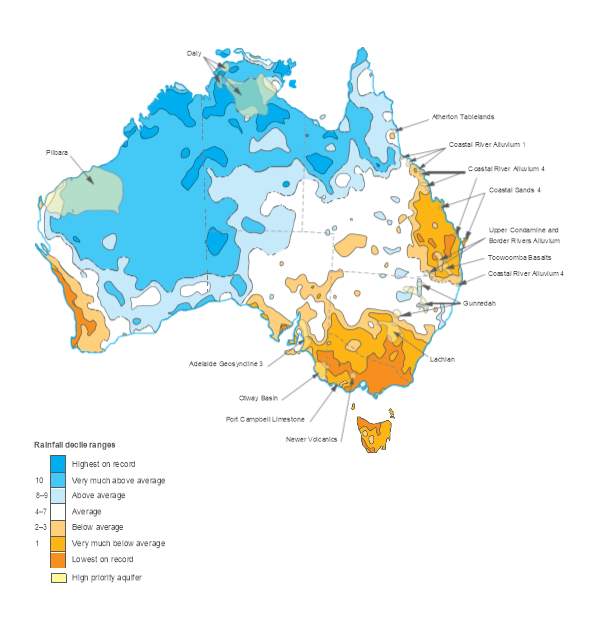
Figure 3.5 presents rainfall conditions across Australia for the period 1 Jan 1997 to 31 Dec 2009 compared with the 1900–2009. From 1997 to 2009, large areas of southern Australia, particularly the southern Murray–Darling Basin, experienced prolonged drought, often referred to as the millennium drought. For the past few decades, large areas of Australia have experienced a drier climate and reductions in surface-water resources, causing increasing pressure on groundwater resources.
Analysis of the climate over the past 80 years shows the reason of warming over most of Australia (except in the inland north-west)is decreasing rainfall over northern, central and north-western Australia; and decreasing rainfall in eastern, south-eastern and south-western Australia (Barron et al., 2011). 2016 was Australia’s fourth-warmest year on record (the national observational dataset commenced in 1910). Mean temperature of Australia’s area-averaged for 2016 was 0.87 °C above the 1961–1990 average. For this period, the maximum temperatures were 0.70 °C above average, and minimum temperatures were 1.03 °C above average. On the other hand, the minimum temperatures were the second-warmest on record behind +1.16 °C in 1998. It is stated that the average of 11-year of temperature for 2006 to 2016 stood the 2nd highest on the record at 0.56 °C above the average. On the other hand, only one year in the past ten was cooler than average (Barron et al., 2011), and seven of Australia’s ten warmest years have occurred since 2005.
For several of Australia’s major cities, the warmth around the north and east coasts of Australia brought a record-warm year. For both maximum and minimum temperature, Darwin and Sydney had their warmest years on record. Moreover, Hobart had its warmest nights on record and warmest annual mean temperature, and the annual mean temperature was warmest on record for Brisbane. For Canberra, It was the equal third-warmest year on record annual mean temperature, and Perth had its coolest year since 2005. Adelaide was a little warmer than average, and most sites across metropolitan Melbourne were warmer than average for the year.
The Australian climate in 2016 was effected by a combination of natural drivers and anthropogenic climate change. The pattern of above average temperatures over land and in the oceans reflects the background warming trend. In the Pacific, the El Niño which had commenced in 2015 transitioned to neutral conditions during autumn 2016, and weak La Niña-like patterns over winter. In the Indian Ocean, water to Australia’s northwest continued to be warmer than average, and a strong negative Indian Ocean Dipole developed during the year.
Figure 3. 5Rainfall conditions across Australia for the period 1 Jan 1997 to 31 Dec 2009 compared with the 1900–2009 ((Barron et al., 2011).
In 2016, annual mean temperatures were above to very much above average for the majority of Australia, and it was recorded warm for the tropics and parts of the east coast and southern Tasmania. For an area of southwestern Western Australia, Temperatures were cooler than average, and the mean rainfall for 2016 in Australia was 17% above the 1961–1990 average. The year of 2016 was Australia’s 15th-wettest year in a record spanning 1900 to present, with an area-average total of 544.99 mm—well above the average of 465.2 mm.
For most of Australia, Annual rainfall was above average although below average for areas of the coast between the Gascoyne in Western Australia and Townsville in Queensland. Moreover, it was also for pockets of southeast coastal Queensland and northeastern New South Wales. Adelaide had its second-wettest year on record and its wettest since 1992. Sydney, Canberra, and Hobart had above average rainfall, while Perth and Melbourne were close to average. Both Darwin and Brisbane were mostly drier than average for 2016.
3.5. Impact of mining in groundwater resources of Australia
Nowadays, the mining sector is a large industrial user of water that is growing rapidly in Australia including mineral, coal, petroleum and gas extraction and quarrying tend to have a high gross value added per gigalitre of water consumed compared with agricultural uses. The water use by the mining industry has historically been relatively steady, consuming 592 GL in 1993–94 and 508 GL in 2008–09 despite an exponential increase in production, reported (ABS, 2010). It is stated that the stable trend is not only due to improvements in water use efficiency in the mining industry since 1994, but also possibly to under-reporting of water use.
The primary regional-scale desktop assessment of the potential for hydraulic connectivity between the GAB and underlying basins was taken being a part of the Great Artesian Basin Water Resource Assessment (CSIRO, 2008). This connectivity can occur where aquifers, partial aquifers and leaky aquitards are juxtaposed below and above the base of the GAB where that faults may also act as conduits in places through otherwise low permeability formations. Figure 3.6 shows that hydraulic connectivity between the GAB and underlying formations is relatively poor across much of the subregion except in the south-east where aquifers at the base of the GAB are indicated to overlie partial aquifers of the Gunnedah Basin. In this location, the Surat Basin has a heightened potential connectivity with the underlying Gunnedah Basin strata.
The development of coal seam gas (CSG) in Queensland and New South Wales presents major challenges in understanding and managing impacts of mining on other water users and the environment. Moreover, new technology to extract methane from deep-lying coal beds has led to unprecedented CSG production in areas previously considered to be economically non-viable. The significant water managing encounters in the current coal seam gas boom are the effect of depressurisation on nearby aquifers, the probability and effects of inter-aquifer leakage triggered by aquifer depressurisation and hydraulic shattering, and the chemical progressions upsetting the quality and safe disposal of the released water.
Figure 3. 6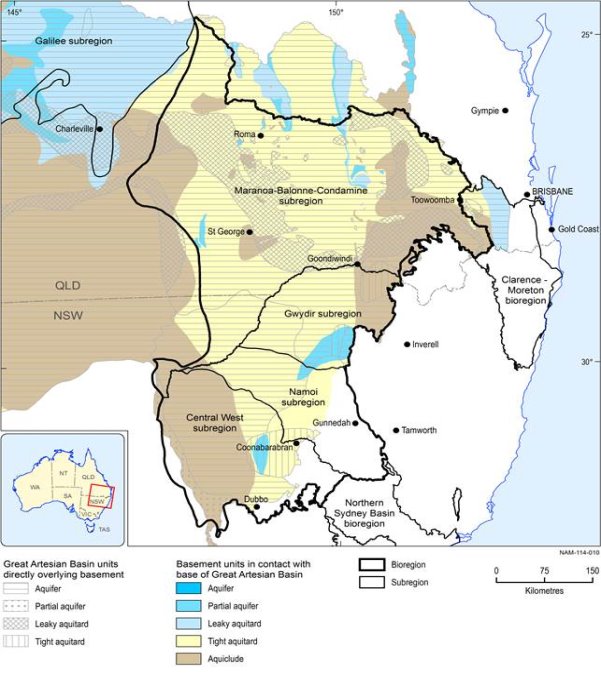
Potential hydraulic interconnection between the Great Artesian Basin and basement units in the Northern Inland Catchments bioregion (Harrington and cook, 2014)
Chapter 4 – Groundwater quality improvement solutions
4.1. Introduction
In Australia, groundwater management is primarily the responsibility of state and territory governments, with involvement from water authorities and water users. Groundwater Protection Guidelines were first published in 1995. After that publication of the guidelines, the role of Australia’s Commonwealth Government has expanded significantly concerning water management and water quality legislation, regulation and policy (Geoscience Australia 2015) since 1995.
4.2. Water Act 2007
Water Act 2007 strengthened the role of the Commonwealth role in groundwater protection which provides the guidelines for management of the Murray-Darling Basin and the establishment of an environmental water holder and expansion of water markets and water information systems. The National Water incorporated into the raising National Water Standards Program. Initiative (NWI) was agreed in 2006 and a later initiative with the National Groundwater Action Plan and invested in research to improve knowledge and management of groundwater resources. In 2013, there is an amendment to the Commonwealth Environmental Protection and Biodiversity Act 1999. It requires the potential risks to water resources of coal seam gas and also a large coal mining developments are assessed by the Australian Government.
4.3. Biodiversity Act 1999 & Environment Protection
The Environment Protection and Biodiversity Act 1999 which is the key piece of Commonwealth environmental legislation and sets out the Commonwealth requirements for environmental approvals. It focused on matters of national environmental significance, and the Act was implemented by the Australian Government Department of the Environment. In June 2013, the Act 1999 was modified and had to take the consideration of the potential impacts of coal seam gas and large coal mining developments of water resources. Under this act, the coal seam gas and large coal mining companies are now need to submit detailed water management and monitoring plans. It also includes a program for aquifer connectivity studies and water quality monitoring and management (surface water and groundwater).
4.4. Water quality guidelines
Water quality guidelines value that can be used as water quality objectives for specific Environmental Value categories is listed in other NWQMS documents. It includes different guidelines such as:
- The Australian and New Zealand Fresh and Marine Water Quality Guidelines (ANZECC and ARMCANZ 2000);
- The Guidelines for managing risks in recreational water (NHMRC 2008);
- The Australian drinking water guidelines (NHMRC and NRMMC 2011);
- The Australian guidelines for water recycling: Managing health and environmental risks.
- The Australian guidelines for water recycling: Managing health and ecological risks (NRMMC EPHC and NHMRC 2008);
- Australian guidelines for water recycling: Managing health and environmental risks – Stormwater harvesting and reuse (NRMMC, EPHC, and NHMRC 2009a).
- Australian guidelines for water recycling: Managing health and environmental risks – Managed aquifer recharge (NRMMC, EPHC, and NHMRC 2009b). The other water quality guidelines may be available for local areas, such as in the Queensland Water Quality Guidelines 2009 (DEHP 2009) and guideline documents do not provide these values for industrial or cultural categories and must be determined on a case by case basis.
4.5. Environmental values of groundwater system
The Victorian State Environment Protection Policy (SEPP) for groundwaters of Victoria (EPA Victoria 1997) and uses the groundwater salinity to define the beneficial uses for protection. The SEPP includes the Table 4.1 below which shows the beneficial uses to be protected for various salinities. This approach recognises that salinity which often determines the possible uses of groundwater. This policy also includes provision for precluding certain beneficial uses for another background quality indicator that would be detrimental to the beneficial use for the determination based on salinity. If aquifer yields cannot sustain a particular beneficial use and if an existing polluted groundwater zone has been identified by the EPA. This approach focuses on an Environmental Value determination for which numerical guidelines can be used and additional consideration of whether other categories such as cultural and spiritual Environmental Value would need to occur through community consultation.
4.6. Groundwater contamination control
For the significant reduction of groundwater contaminants and inactivation, the pathogenic microorganisms can occur within the aquifer. The distance between the contamination source and the monitoring of groundwater quality influences the contaminant concentrations detected. The Policy decisions must be made on the point of application of adopted groundwater quality objectives. Three options are usually available for this location:
- To monitor at the point of contaminant discharge to groundwater;
- To monitor at the boundary of a reduction zone, the sufficient to allow for dilution and possible subsurface degradation of contaminants;
- To monitor at the boundary of the property upon which the effluent is discharged.
The water quality parameters monitored should not exceed the water quality objectives defined by the relevant plan or guideline at the selected point of application.
Table 4. 1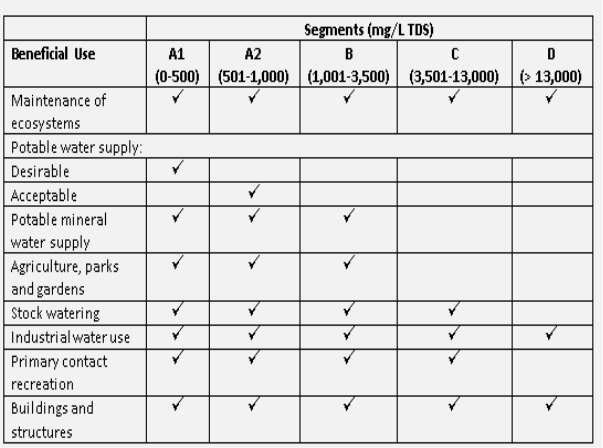
The beneficial uses to be protected for various salinities (ANZECC & ARMCANZ 2000).
4.8. Conclusion
Groundwater is an important resource for drinking water supplies, irrigation, industrial development, and ecosystem and streamflow maintenance. Increasing demand and a trend towards a drier climate is placing pressure on some groundwater resources. Protection of groundwater quality is imperative to ensure the protection of healthy ecosystems and maintenance of environmental values as well as for future economic and population growth.
References
- ABS (2010). Australian Bureau of Statistics, Measures of Australia’s progress 2010, cat. no. 1370.0, ABS, Canberra.
- ANZECC & ARMCANZ 2000, National Water Quality Management Strategy, Paper No.7, Australian Guidelines for Water Quality Monitoring and Reporting, Commonwealth of Australia, Canberra.
- Barron OV, Crosbie RS, Charles SP, Dawes WR, Ali R, Evans WR, Cresswell R, Pollock D, Hodgson G, Currie D, Mpelasoka F, Pickett T, Aryal S, Donn M and Wurcker B, 2011, Climate change impact on groundwater resources in Australia, Waterlines Report Series No 67, National Water Commission, Canberra.
- Cook, P. G. (2013), Estimating groundwater discharge to rivers from river chemistry surveys. Hydrological Processes, 27: 3694–3707. doi: 10.1002/hyp.9493
- CSIRO (2008). Water availability in the Murray-Darling Basin. Summary of a report to the Australian Government from the CSIRO Murray-Darling Basin Sustainable Yields Project. CSIRO, Australia. 12pp.
- Degens, B.P., Muirden, P.D., Kelly, B. & Allen, M. 2012, “Acidification of salinised waterways by saline groundwater discharge in south-western Australia”, Journal of Hydrology (Amsterdam), vol. 470-471, pp. 111-123.
- DEHP (2009). Department of Environment and Heritage Protection, Queensland Water Quality Guidelines 2009, version 3, ISBN 978-0-9806986-0-2.
- EPA Victoria 1997, State Environment Protection Policy – Groundwaters of Victoria, No. S160, 17 December 1997.
- Geoscience Australia, 2015, Governance – Groundwater, viewed 5 April 2016 http://www.ga.gov.au/scientific-topics/water/groundwater/governance
- Harrington N and Cook P, 2014, Groundwater in Australia, National Centre for Groundwater Research and Training, Australia.
- Nation E, Werner AD, Habermehl MA, 2008, Australia’s coastal aquifers and sea-level rise, Science for decision makers brief, Department of Agriculture, Fisheries and Forestry, Bureau of Rural Sciences, Canberra.
- NWA – National Water Association
- National Centre for Groundwater Research and Training, 2015, Resources, viewed 1 April 2016 http://www.groundwater.com.au/resources.
- NHMRC 2008, National Water Quality Management Strategy, Guidelines for managing risks in recreational water, Paper no.5, Commonwealth of Australia, 2008.
- NRMMC, EPHC & NHMRC 2008, National Water Quality Management Strategy, Australian guidelines for water recycling: Managing health and environmental risks (Phase 2) – Augmentation of drinking water supplies, Paper no.21, Commonwealth of Australia, 2008.
- NRMMC, EPHC & NHMRC 2009a, National Water Quality Management Strategy, Australian guidelines for water recycling: Managing health and environmental risks – Stormwater harvesting and reuse, Paper no.23, Commonwealth of Australia, 2009.
- NRMMC, EPHC & NHMRC 2009b, National Water Quality Management Strategy, Australian guidelines for water recycling: Managing health and environmental risks – Managed aquifer recharge, Paper no.24, Commonwealth of Australia, 2009.
- NHMRC and NRMMC 2011, National Water Quality Management Strategy, Australian drinking water guidelines, Paper no.6, Commonwealth of Australia, 2011.
- NWA (2012). National Water Association, 2012, Groundwater Essentials, viewed 15 May 2016 http://www.groundwater.com.au/media/W1siZiIsIjIwMTIvMTAvMTYvMjBfNThfNTZfNTdfR3JvdW5kd2F0ZXJfZXNzZW50aWFscy5wZGYiXV0/Groundwater_essentials.pdf
- NWC (2012). National Water Commission Amendment Act 2012.
- NWC (2015). National Water Commission, Australian Water Resources, http://www.water.gov.au/
- Werner, A.D. 2010, ‘A review of seawater intrusion and its management in Australia’, Hydrogeology Journal, vol. 18, no. 1, pp. 281-285.
- Thiruvenkatachari, R., Vigneswaran, S. and Naidu, R., 2008. Permeable reactive barrier for groundwater remediation. Journal of Industrial and Engineering Chemistry, 14(2), pp.145-156.
- Bhatnagar, A., Kumar, E. and Sillanpää, M., (2011a). Fluoride removal from water by adsorption—a review. Chemical Engineering Journal, 171(3), pp.811-840.
Cite This Work
To export a reference to this article please select a referencing stye below:
Related Services
View all


Related Content
All TagsContent relating to: "Geology"
Geology is an “Earth science” or “geoscience” concerned with the study of the physical structure of the Earth (or other planetary body) and the rocks of which it is made, the processes that shaped it and its physical, chemical and biological changes over time.
Related Articles

DMCA / Removal Request
If you are the original writer of this dissertation and no longer wish to have your work published on the UKDiss.com website then please: