Effect of Heat Loads and Furniture on the Thermal Comfort of an Isolated Family House under a Naturally Ventilated Environment
Info: 10256 words (41 pages) Dissertation
Published: 9th Dec 2019
Tagged: ArchitectureConstruction
Effect of heat loads and furniture on the thermal comfort of an isolated family house under a naturally ventilated environment
ABSTRACT
Natural ventilation is the most energy-efficient method by which to passively cool a building, reducing the energy consumption, and improving the thermal comfort and indoor air quality. However, designing buildings using cross-ventilation is far more complicated than mere mechanical design due to the indoor and outdoor parameters in addition to the building configurations. The authors have previously reported that the indoor thermal comfort in an isolated family house is affected significantly by the outdoor conditions; the current study, however, focusses on the impact of heat loads and furniture on the indoor thermal comfort. In this work, The Computational Fluid Dynamics (CFD) approach was employed with a coupled indoor-outdoor simulation. The CFD model is validated against the available data from wind tunnel experiments. The results showed that the heat dissipated from electrical appliances found in daily life (TV, lights, and refrigerator) only have a small effect on the thermal comfort indices at both the seated and the standing levels because they use only relatively small amounts of energy, whereas these indices are increased remarkably at these two levels when an additional heat source (oven) was operated in conjunction with these appliances. In addition, no significant differences between the empty building and the furniture-filled building were observed at the two levels when comparing the air velocity, temperature and thermal comfort indices.
Keywords: Natural ventilation, CFD, Heat load, Furniture, Thermal comfort
1 Introduction
Natural ventilation utilizes outside weather conditions to both passively cool and ventilate a building without the need for a mechanically-driven system or reducing its use and is considered a sustainable solution to maintain a healthy and thermally comfortable internal environment and offers lower energy consumption compared to mechanical ventilation system [1, 2]. Designing naturally ventilated buildings is very important to both engineers and architects. Therefore, any successful design for a naturally ventilated building needs to be balanced with three main factors: indoor air quality, energy consumption and thermal comfort [3]. According to previous studies, natural ventilation can reduce cooling energy consumption by up to 50% from studies of buildings in European cities [4, 5]. Thermal comfort is one of the most important indices that are widely used by researchers to evaluate and develop ventilation system. Defining the thermal comfort can be difficult as you need to take into account a range of factors such as environmental condition, work-related and personal factors when deciding what makes a comfortable workplace temperature and can be different from person to another one in the same place. For instance, a person sat in a shirt in a cool environment might feel cold whilst someone walking upstairs in the same environment might feel hot. According to the British Standards Institution (BSI), thermal comfort defined as “that condition of mind which expresses satisfaction with the thermal environment” [6]. Indoor thermal comfort is not measured by room temperature only, there are another three environmental factors that related directly to the thermal comfort; radiant temperature, air velocity, humidity and two personal factors; clothing insulation and metabolic heat [7].
The interest regarding energy saving in the building sector has increasingly grown in terms of gaining a better indoor thermal environment and achieving a reduced energy consumption [7]. Therefore, there have been numerous indoor thermal environmental studies to improve the level of the thermal comfort in various types of buildings, including public buildings [8] [9] [10], the whole building environment [11] [12], offices [7] [13] [14] [15] and transportation [16] [17]. One common feature of these studies is about the thermal comfort evaluation and assessment, where different methods were used to find suitable levels of the thermal comfort inside buildings such as using levels of total temperature [18] or standard effective temperature (SET) [19], or using Fanger’s factors: predicted mean vote (PMV) and predicted percentage of dissatisfied (PPD) [20]. Recently, to the best of our knowledge, there has been no discussion regarding the examination of the suitability of PMV and PPD indices to properly evaluate thermal comfort in the building sector using natural ventilation [21]. According to ASHRAE Standard 55 “the PMV index is used to set the requirements for indoor thermal conditions and predicts the mean value of the votes of a large group of subjects for particular combinations of temperature of air, insulation of clothing, metabolic rate, air velocity, mean radiant temperature, and relative humidity”. Standard thermal comfort uses the PMV index in a surveys asking subjects about their thermal sensation, as rated by a seven-point scale of cold (-3) to hot (+3), where zero is the ideal value and the recommended limits run from -0.5 to 0.5 [22]; PPD predicts the percentage of occupants that will be dissatisfied with the prevailing thermal conditions and is a function of PMV. According to ASHRAE 55, the recommended acceptable PPD range for thermal comfort is less than 10% of persons being dissatisfied with an interior space.
There are various studies that have used numerical methods to describe the impact of heat sources on thermal comfort in buildings. Hunt et al. [23] examined ventilation that was driven by a point source of buoyancy on the floor of an enclosure in the presence of the wind. Allocca et al. [24] analysed single-sided natural ventilation in order to study the impact of buoyancy on ventilation rate whilst varying the heat loads from 0 to 1000 W within a room. It was observed that there was an increase in air change rate per hour (ACH) with increasing heat loads. Cho and Awbi [25] studied the impact of heat source locations on the mean velocity of a room with one inlet and one outlet using multiple regression analysis via both experimental and numerical studies; the study showed that the mean velocity was lower when the heat source was located at the source of the inflow to the room. El-Agouz [26] performed two-dimensional simulations to examine the effect of open locations on room ventilation with an internal heat source, where it was found that the indoor air quality can be optimized by placing open locations on the ceiling. Stavrakakis et al. [27] examined natural cross-ventilation with openings at non-symmetrical locations and an internal wall as a heat source. The study concluded that the indoor thermal environment considered was unsatisfactory and was 80% below the recommended levels in terms of thermal perception.
Kaye and Hunt [28] predicted air stratification and ventilation rates in a large room with two openings (one at the bottom and the other at the upper surface) for heat sources with finite heating areas. It was found that the displacement of the ventilation flow was maintained when both floor area and room height were large compared to the size of the dominant heat sources, and even when the effective vent area was relatively large. Park and Battaglia [29] applied CFD in the more realistic case of a single-sided room ventilation, where their study examined the impacts of various environmental conditions, heat loads and furniture placement on indoor thermal conditions for buoyancy-driven flows. The natural ventilation design approach could reduce the energy consumption of the building with respect to an initial building design without natural ventilation [30]. Further study, showed that the roof, floor, and the airtightness are the important parameters and have the impact on the indoor thermal environment[31]. The impact of natural ventilation on thermal comfort in a dormitory building during winter was studied by Lei at al. [32], they found that the indoor thermal comfort levels gradually declined with increasing natural ventilation area. The combined operation of the wind-catcher and the dynamic façade can deliver operative temperature reductions of up to 7 °C below the base-case strategy, and acceptable ventilation rates for up to 65% of the cooling period[33]. Angelopoulos et al. [34] examined different window configurations in a classroom under a wide range of wind conditions using a CFD simulation tool. The PMV results indicated that thermal comfort could be achieved and was uniformly distributed within the classroom. Baglivo et al. [35] evaluated the impact of walls, slab-on-ground floor, roof, shading, windows and internal heat loads on the thermal behaviour of a building in a warm climate.
Most previous studies have assessed the thermal comfort of buildings using single-side ventilation, though certainly there are a limited number of studies employing cross-ventilation for the purpose of cooling in hot climates, though in both cases without any further consideration as to the impact of furniture and heat loads. In addition, very few studies have employed the human thermal comfort indices, PMV and PPD, in the analysis of the indoor environment, which are a more realistic representation than many other indices. Therefore, this study is focusing on the impact of heat sources (e.g., TV, oven, and refrigerator) and furniture on the human thermal comfort indices (PMV and PPD) in a family house with a natural cross-ventilation environment in the hot climate. First, the CFD models: steady Reynolds Averaged Navier-Stokes (RANS) was evaluated using flow measurements over and through a cross-ventilated building model in a wind tunnel. Second, the impact of the furniture and heat loads on the thermal comfort indices are analysed through a series of CFD simulations using the Renormalization Group RNG k- model. The findings from the study are expected to improve understanding and knowledge as to the impact of the two parameters on the human thermal comfort indices in residential buildings.
2. Building geometry and study cases
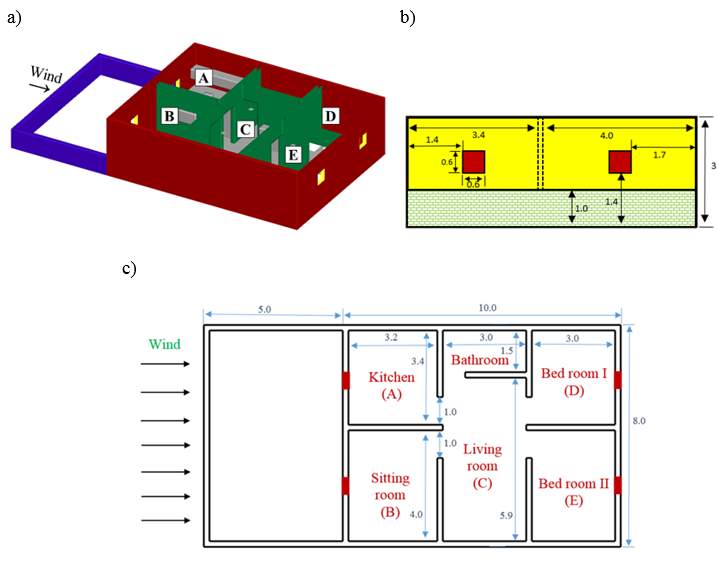
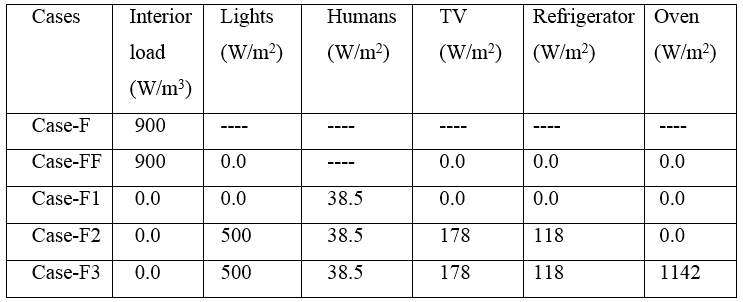
The motivation behind this study is to evaluate the potential of natural cross-ventilation to remove a heat load and determine a suitable level of thermal comfort for occupants in an isolated family house in Kirkuk-Iraq (Fig. 1a) which consists of five rooms: kitchen (A), sitting room (B), living room (C), and two bedrooms (D and E); the building has an external boundary wall, has a simple layout and is representative of an average house for an average family [36]. The height of the building was H, with base dimensions of (3.33×2.66) H and there were two square openings (0.2 H) in the front wall to allow the ingress of air (Fig. 1b) and two openings at the rear of the building to allow for its egress; the wall porosity (opening area divided by wall area) was 3%. The thickness of the walls was 0.067 H. The height of the boundary wall was 0.33 H and the length of the building was less than the maximum length suggested by Chu et al. [37] to obtain effective wind-driven cross-ventilation. The first case (Case-F) has two opening positions, the details of which are provided in Fig. 1c for the reduced-scale building model. This case did not include any furniture, whilst of course in a realistic family house, there would be many pieces of furniture and heat sources. Therefore, furniture and heat sources are modelled, the layout of the house is shown in Fig. 2 and the dimensions of the furniture are provided in Table 1. Five scenarios are simulated in this study, the details of which are provided in Table 2. The first scenario (Case-F) included the building geometry without furniture and four human bodies, whilst the second scenario (Case-FF) included furniture only (without human bodies). The three remaining scenarios (Case-F1, F2, and F3) included one style furnished house, as shown in Fig. 2, with different heat loads, as provided in Table 2 [38]. In Case-F and Case-FF the heat load is applied as an energy source to the fluid inside the building (Watt per unit volume of fluid). In the other cases the heat loads are applied uniformly to the surfaces of the human bodies and appliances as a boundary conditions (Watt per unit area). In all scenarios, the wind speed was based on the reference at the height of the building (Uref) with an angle of incidence of 0o.
Fig. 1. The geometry of the building models; (a) Perspective view, (b) Front view, (c) Top view (dimensions in metres).
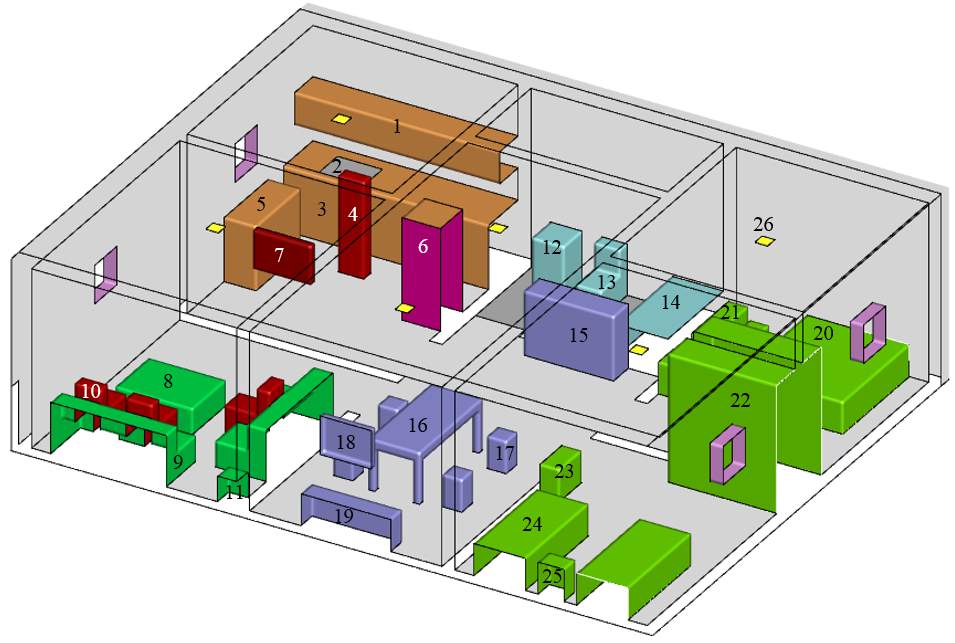
Fig. 2. The layout of the furniture in the building.
Table 1: Dimensions of the furniture and the human bodies in meters.

Table 2: Heat loads of the study cases in (W/m2).
3 Numerical method
The CFD calculations were performed using ANSYS Fluent 16.2, which is based on a finite-volume approach. The steady Reynolds-Averaged Navier–Stokes (RANS) equations were used to model the flow and the temperature fields combined with the low-Reynolds number modelling (LRNM). For turbulent flow, the Renormalization Group RNG k- model was chosen over other variants of the two equation turbulence models because of its popularity for modelling indoor air movement [39]. For flow involving heat transfer, an additional equation for energy conservation was solved to calculate the temperature variation within the computational domain. For incompressible flow, the pressure-based solver was used in this study. The SIMPLEC scheme was imposed on the pressure–velocity coupling method, and the convective term was discretized by the bounded central-differencing scheme. The pressure was interpolated via a second-order scheme, whilst the spatial discretization of the convection terms of the momentum and the energy equations used the second-order upwind scheme.
4 CFD model validation
4.1 Wind tunnel experiment
The accuracy of the CFD simulation was evaluated by comparing the numerical results of RANS with the results of boundary layer wind tunnel experiments conducted by Ohba et al. [40], with the flow measured over and through a cross-ventilation building model. The experiment was conducted in a wind tunnel of dimensions 120 cm wide, 100 cm high and 14 m long, where the model had a height of 15 cm, measuring 1:2:2, with a wall thickness of 7.5 mm, as shown in Fig. 3. The inlet and outlet openings of the building (6 cm width and 3 cm height) model were placed perpendicular to the approaching flow and had the same dimensions. The reference wind speed (Uref) was maintained at 7.0 m/s at the upwind edge of the model with a wind incidence angle of 0°; further details are available in previous studies by the authors [41] [42, 43].
4.2 CFD settings and parameters
The computational model represents the reduced-scale model used in the experiments and is constructed according to the guidelines for wind engineering [44] [45]. The dimensions of the domain are 1.8 × 3.3 × 0.75 m3 (W × L × H) and the computational grid is created inside the building and the domain by using hexahedral cells; a grid-sensitivity analysis was performed to ensure the results were independent of the mesh resolution and yielded a fully structured hexahedral grid of around 4.1×10⁶ cells. The vertical approach-flow profiles of log-law mean wind speed, U, and turbulent kinetic energy, k, are imposed on the inlet of the duct as based on the measured incident profiles from Ohba et al. [40], as shown in Fig. 4.
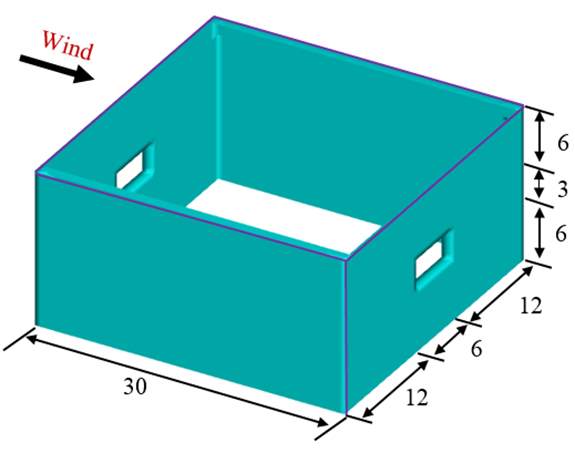
Fig. 3. The geometry of the building model as studied by Ohba et al. [40].
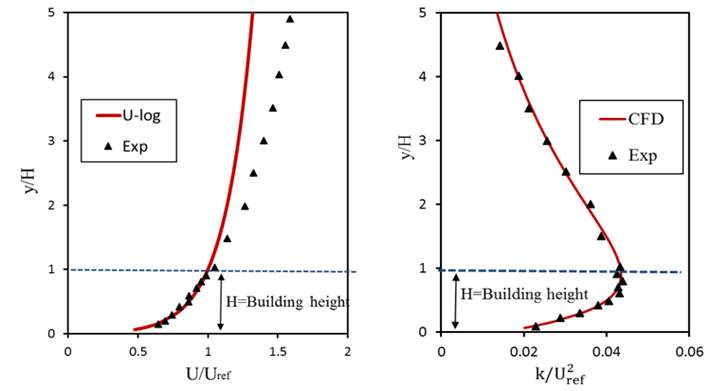
Fig. 4 Comparison of the dimensionless velocity magnitude and turbulent kinetic energy profiles of the approaching wind with the experimental results [40] at the inlet of the duct.
4.3 CFD model validation results
4.3.1 Mean velocity and vector
The comparison of the stream-wise wind speed ratio U(x)/Uref obtained from RANS with the measurement data along a horizontal line through the middle of the two window openings is presented in Fig. 5. The figure showed that there was acceptable agreement between numerical and experimental results despite the velocity of the incoming jet predicted by the CFD was higher than the experimental results, as found in other studies [46-50]. Overall, with the turbulence model selected, RNG k-, the average difference of the air velocity along, x, between the experimental, and the numerical results, is around 10% and this difference is acceptable in similar CFD simulation studies [46-50].
The velocity vector field in the central plane of the building shows a close qualitative agreement between experimental and numerical results (Fig. 6). The simulations reproduce the main vortexes of the flow, such as the one formed in front of the windward side of the building, the one formed at the leading edge of the roof and the windward wall, and the biggest one in the rear of the building. The wind velocities of the inflow stream accelerated and their directions changed downwards immediately inside the inflow opening. The internal air was then circulated by the incoming flows. At the exit of the outflow opening, the flows moved upwards and the velocities of the emitted air increased considerably. The averaged flow pattern calculated by RANS exhibited the same flow behaviours as the experimental observations. Generally, RANS models have been widely used in the ventilation sector for buildings in a cross flow, where the RNG k-ε model, in particular, provides high performance as the SST k-ω model in this kind of flow [51].
4.3.2 Validation case versus case study
The geometry of the building that was used to validate the CFD model (Ohba et al. [40]) and that used in the current study (Fig. 3) are not identical, but there are some similarities between the two geometries that allow the validation approach to be applicable for this type of building. For instance, both buildings are exposed to a wind direction normal to the façade. The atmospheric boundary layer is considered to be the approach-flow (Fig. 4). Both buildings are isolated from the surroundings, and have a rectangular base. The roofs of both buildings are flat, without any external features such as gutters, shingles and eaves. As a result, the notable features of the flow for the building studied by Ohba et al. [40] are also predicted for the building in the current study. The study of Ohba et al. [40] has been used in a number of other previous studies to validate the CFD models for different building geometries [52] [53]; for instance, those used by Cheung and Liu [53] to validate the standard k-ε model for a high-rise building with six inlet openings under a cross-ventilation.
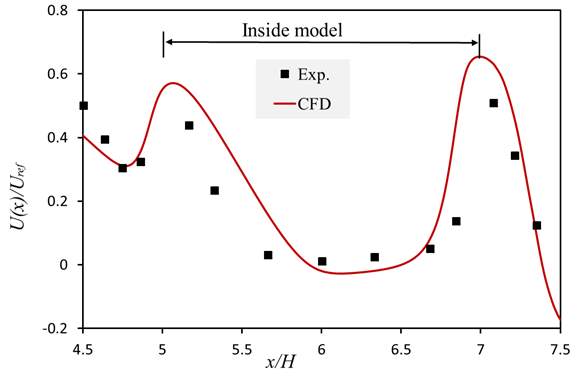
Fig. 5. Comparison of experimental [40] and CFD results for the stream-wise velocity ratio U(x)/Uref along the horizontal centreline of the openings..
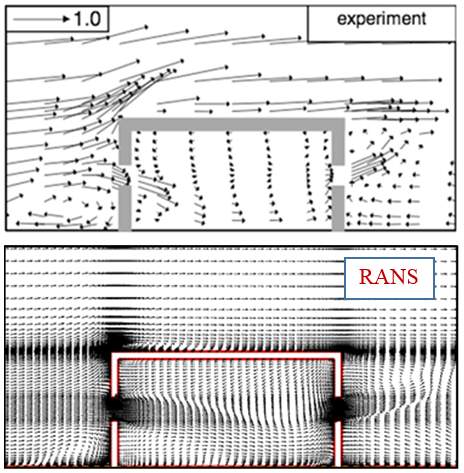
Fig. 6. Comparison of the velocity vector field of measurements [40] and the CFD simulations on the mid-plane of the building.
5 CFD simulations of cases study: computational setting and parameters
5.1 Computation geometry, and grid
The computational domain of all the cases (F, FF, F1, F2, and F3) had dimensions (25×5×12.6) H, as shown in Fig. 7, and was constructed based on the guidelines of Franke et al. [45] and Tominaga et al. [44]. The building was set inside the duct and the blockage ratio was 4.2%, which was within the range recommended by the two guidelines to avoid any impact of blocking and unphysical flow acceleration. The two guidelines recommended at least 15H as the distance between the end of the building and the outflow boundary, which was sufficient to allow the flow to redevelop in the wake region whereas and 5H was considered sufficient for the distance between the beginning of the building and the inflow boundary as mentioned in the two guidelines. The numerical grid used in all cases consists of around 8×10⁶ hexahedral computational cells except for Case-F, which was around 6.7×10⁶ cells. A fine mesh structure was used near the walls, whereas a coarse mesh was used away from the walls in all directions, as shown in Fig. 8. The minimum grid spacing used in each case was 0.005H in all directions to capture the laminar sub-layer. Fig. 9 illustrates the mesh inside the building.
5.2 Boundary conditions
The numerical setup for the boundary conditions in this study follows the CFD guidelines for simulating flows in urban applications [44, 45]. For the inlet, a logarithmic inlet velocity profile was used to calculate the wind boundary layer profile (Eq. 1), whilst for the turbulent kinetic energy and specific dissipation rate, equations (Eq. 2) and (Eq. 3) were used at the inlet of the duct. These equations are applied successfully as per those used in previous studies [50] [54] [55] [56].
U(y)=uτκlny+yoyo (1)
k=a ( U Iu )2 (2)
ε=uτ3Ky+yo (3)
where κ is the von Karman constant (0.42), uτ is the friction velocity, yo is the aerodynamic roughness height (0.025 mm), and a, in eq. 2, is limited to 1.5 [36]. The ground of the domain was modelled as having no-slip boundaries, whilst a slip boundary with zero shear (symmetry boundary conditions) was applied to the two sides and the top of the domain. The outflow boundary condition was specified at the end of the domain [36]. The surfaces of the house were modelled as no-slip boundaries and assumed to be under adiabatic conditions. The family house analysed was comprised of several electrical appliances and the number of occupants of an average family; their generated heat values are provided in Table 2 according to the reveal case. This generated heat was uniformly applied to the surface of the appliances and occupants as a boundary condition. A uniform temperature of 25°C was specified at the inlet of the duct as a boundary condition.
5.3 Indoor thermal comfort
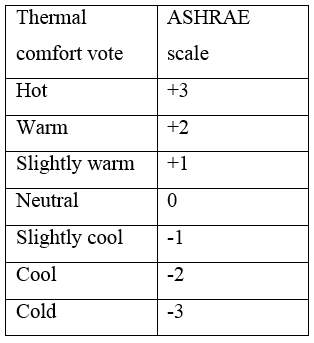
The thermal comfort indices were calculated by using Fanger’s comfort equations [20], i.e., predicted mean vote (PMV) and predicted percentage of dissatisfied (PPD). These equations represent the thermal balance of an entire human body, and can be considered as an index representing the mean value of the voters of a large group of people in the same environment on a seven-point thermal sensation scale (Table 3). According to the International Organization of Standardization (ISO 7730 (2005) an indoor environment is considered very comfortable when the values of PMV index varied between [-0.5, +0.5] and it is comfortable between [-1, +1] [6] . For the thermal comfort requirement, the appropriate range of PMV values was between -0.5 and 0.5, or -1, and 1, in which 90% and 80% of people claimed to be comfortable [21].
The mathematical expression of Fanger’s PMV-PPD model is as given by Eqs. (4) and (5):
PMV=0.303e-0.036M+0.028M-W-3.96E-8fclTcl+2734 -Tr+2734-fclhcTcl-T-3.055.73-0.007M-W-pa-0.42M-W-58.15-0.0173M5.87-pa-0.0014M34-T
(4)
PPD=100-95e-0.03353PMV4+0.2179PMV2
(5)
where M is the metabolic rate (W/m2 ), W stands for active work (W/m2), pa (kPa) is the partial water vapor pressure and fcl is the clothing area factor (1 clo = 0.155 m2 K/W) expressed as:
fcl=1.05+0.645 Icl, Icl>0.078 1+1.29 Icl, Icl< 0.078
(6)
The term Icl is the resistance to sensible heat transfer provided by a clothing (clo) and assumed of 0.6 clo. The Tcl (°C) is the surface temperature of clothing and is determined below as:
Tcl=35.7-0.028M-W-Icl3.96×10-8fcl (Tcl+273)4-(Tr+273)4+ fclhc(Tcl-T)
(7)
where Tr (°C) is the mean radiant temperature, T (°C) is the calculated air temperature, and hc (W/m2 K) is the convective heat transfer coefficient between the occupant and the environment and given by:
hc=2.38Tcl-T0.25, hc≥12.1 u0.5 12.1 u0.5
(8)
where u is the local velocity calculated by the CFD model and further details can be found in the reference [21]. The equations 4-8 were coded in the UDF file (User-Define-Function), linked with ANSYS FLUENT and used to calculate the values of PMV and PPD.
A validation process was performed for the PMV model before using the model in the current study. ASHRAE standard 55 thermal comfort tool [57] was used to verify the PMV model. The predicted PMV values of different points in the building were compared with the results of the ASHRAE tool and the deviation were not exceeding 5%. However, this model derived from the steady-state heat transfer theory and calibrated through climatic chamber experiments. As a result, it will overestimate the subjective warmth sensations of occupants of buildings without air-conditioning, although it is a good predictor of thermal sensation in buildings with HVAC systems [58]. Therefore, Fanger and Toftum [59] have developed an extension of the PMV model in warm climates for non-air conditioned buildings using an expectancy factor. They have estimated the expectancy factor for non-air-conditioned building located in region where air-conditioned building are common between 0.9-1. The expectancy factor used in current study is 1.0. Moreover, For such naturally ventilated buildings an adaptive model has been proposed [60] the variable in this model is the average outdoor temperature only without including human activity, feelings or clothing. Although the thermal sensation based on the PMV scale applied for the hot climate in the previous study [61], the equation underestimated thermal sensation by 12% in autumn season and 22% for spring season in in hot and dry climatic region [62]. Generally, the Köppen-Geiger map classified the weather in north part of Iraq as a cold semi-arid climate and located in the temperature climate zone [63]. During the spring season (March to May) and autumn season (September to November) the weather in Kirkuk is stable, clear skies windy, the mean relative humidity around 30%, the mean velocity of this six months period is around 3m/s and the mean temperature is around 25 °C [64].
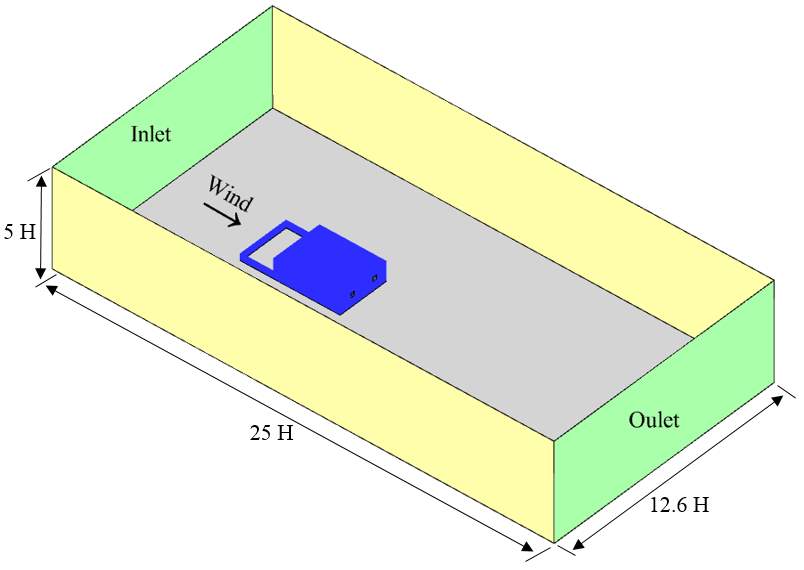
Fig. 7. The building inside the defined duct.
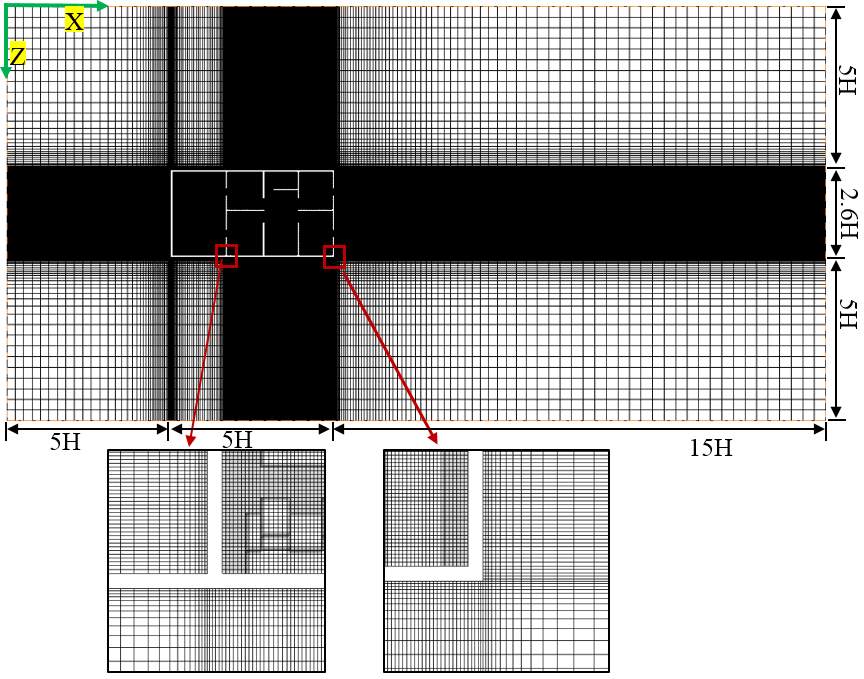
Fig. 8. Computational domain and the mesh layout of the grid (Top view).
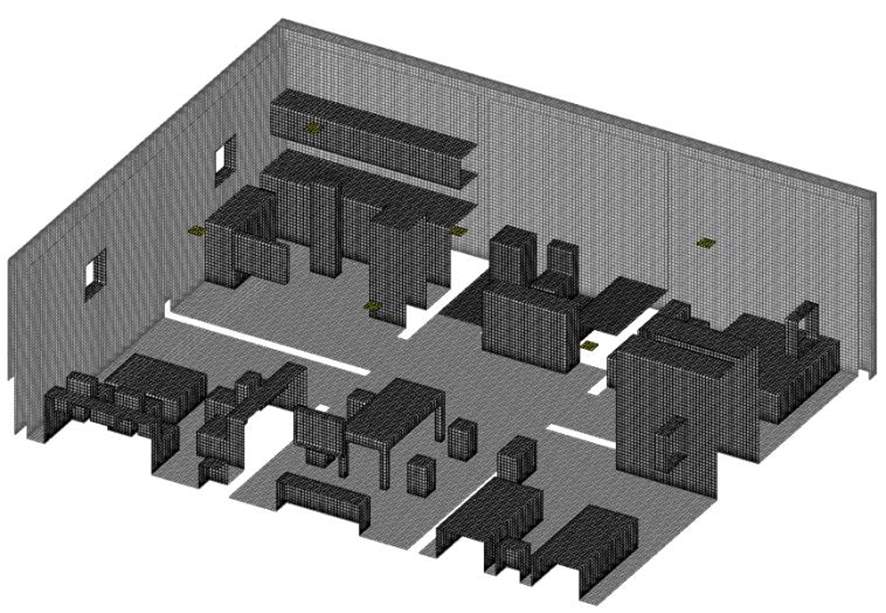
Fig. 9. The mesh layout of the building with furniture.
6 Results and discussion
The impact of heat loads and the presence of the furniture on the thermal comfort of an average family house in a hot climate are exemplified and subsequently discussed in this section via five scenarios (cases). The numerical results of all cases are presented and compared in terms of average velocity, temperature, PMV and PPD of two commonly used levels in assessing thermal comfort in residential buildings in order to provide helpful information for the effective design of buildings [65]. Furthermore, the contour plots of velocity, temperature and PMV are presented and discussed in detail. Investigating the impacts of heat loads and the presence of furniture on the human thermal comfort would give the designer valuable information in terms of obtaining more energy-efficient designs and naturally ventilated buildings, particularly in hot climates where natural ventilation is frequently used. The area of the openings in all cases was held constant, as was the wind incidence angle of 0o and the wind speed (3 m/s at 25oC). The thermal comfort indices predicted for metabolic rates, M, were 58 W/m2 (seated level), and 70 W/m2 (standing level). The relative humidity (RH) was fixed at 30% with zero external work (W). The two commonly used levels were used in the current study; the seated level at a height of 0.6 m from the ground of the building [22] and the standing level at a height of 1.1 m from the ground of the building [6].
6.2 The effect of furniture on the thermal comfort
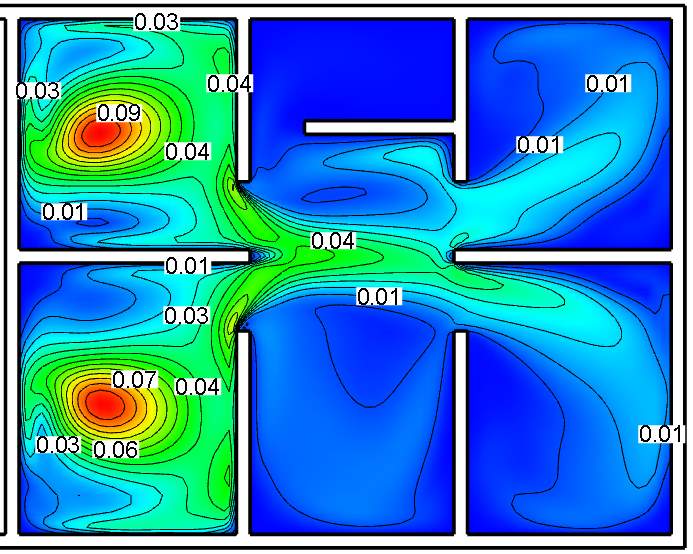
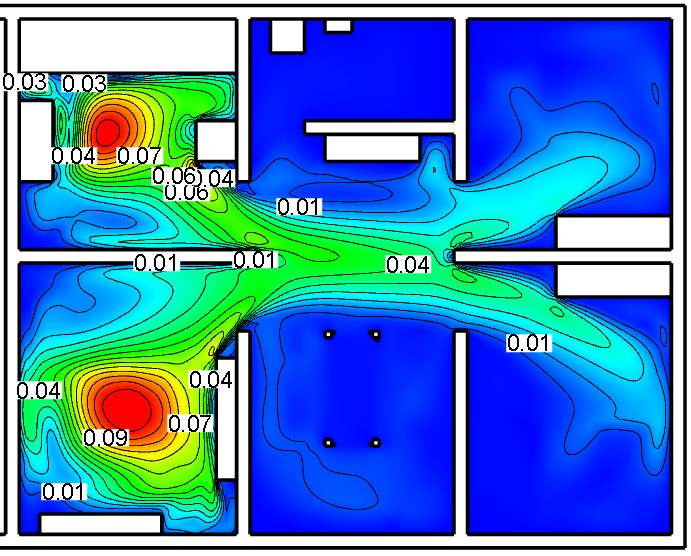
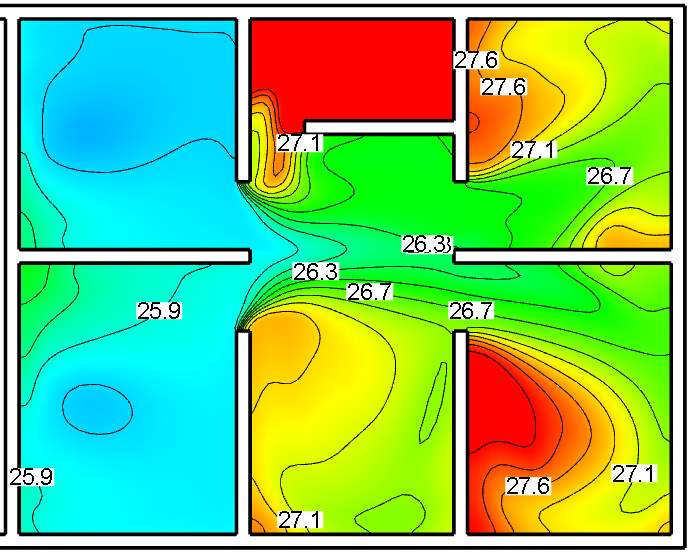
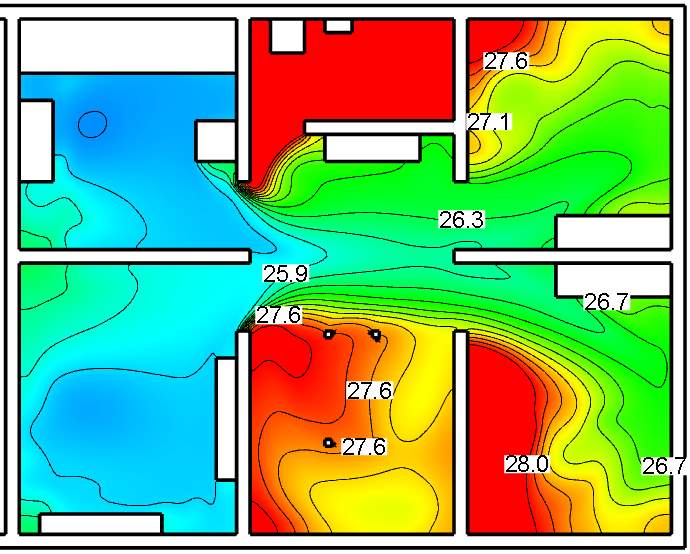
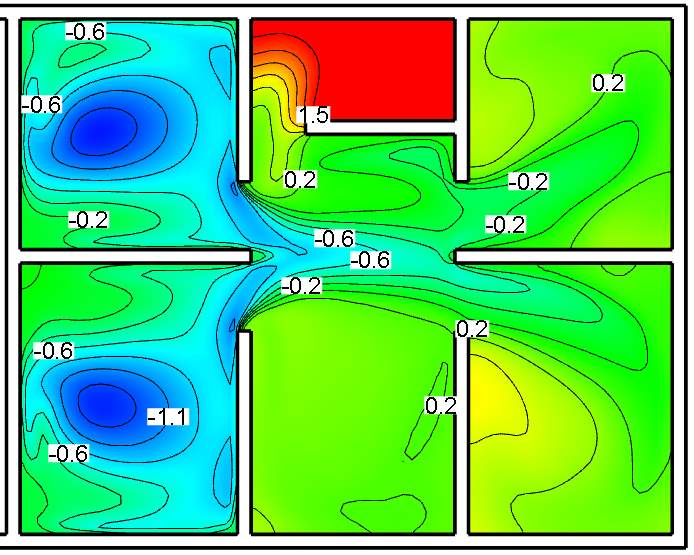
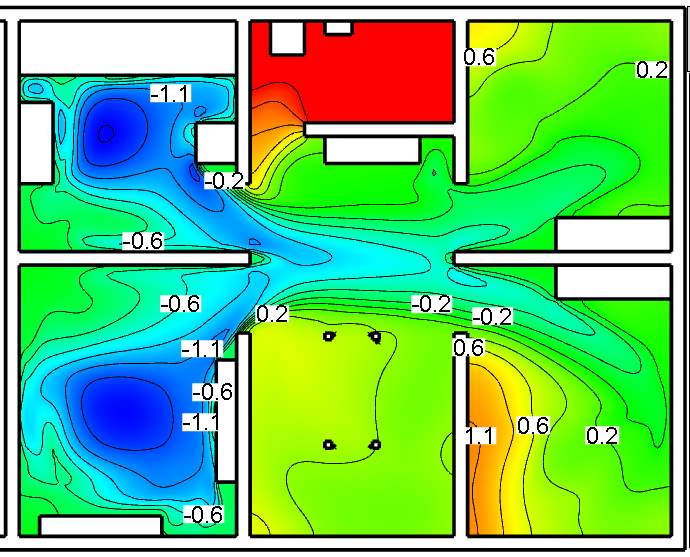
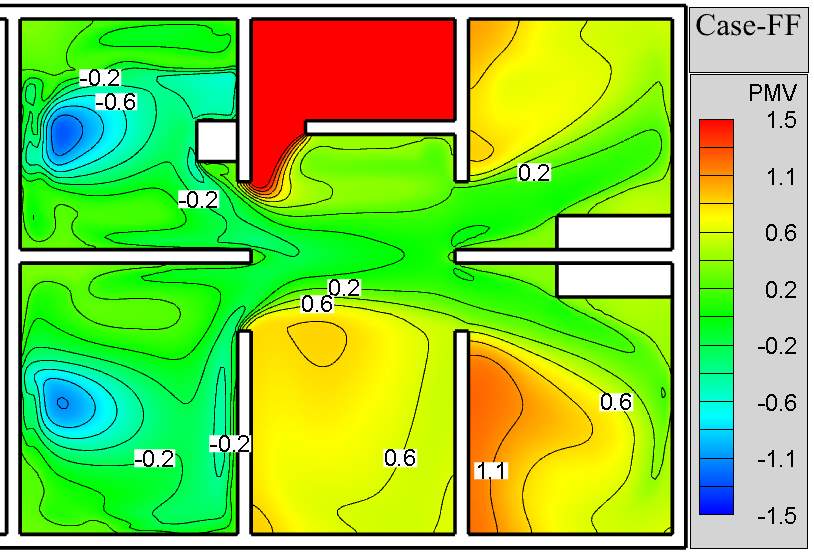
The effect of the furniture within the building is considered in this section. Two cases are compared; Case-F, without furniture and Case-FF, with furniture, at Uref 3 m/s and temperature of 25°C. The average velocity, temperature and thermal comfort indices are compared and discussed in detail at both common levels; seated and standing (Fig. 10-11). The contour plots of the velocity and temperature at the seated plane, and PMV distribution of the seated and standing planes are presented in Fig. 12-13.
The results showed that the impact of the current arrangement of the furniture (Fig. 2) on the thermal comfort indices was actually small at both the standing and the seated levels. At the seated level, the presence of the furniture slightly increased the average velocity along the plane and this impact does not result in any noticeable change in temperature or thermal comfort indices. Since the velocity increased in the front rooms (A and B) whilst decreased in the rest of the rooms.
Regarding the seated level, the greatest increases in PPD was in room A and B, where an increase of 3% was observed, whilst other rooms saw a constant of PPD. The figure illustrating the thermal comfort indices (Fig. 10) showed that there were small differences between the two cases as a result of adding furniture to the building. The same trend was observed for the standing level, where the average velocity of the front rooms increased slightly but less than the seated level and did not result in any noticeable change in PMV or PPD due to the standing level higher than the seated level, and thus less affected by the volume of the furniture. Overall, no significant differences between the empty building (Case-F) and the furniture building (Case-FF) were observed in the comparison of the thermal comfort indices (PMV and PPD).
The contour plots for the velocity, temperature and PMV did not show remarkable differences in distributing of these variables at the standing level because most of the volume of the furniture itself was located at levels lower than the specified level, so clearly one would not expect any particularly significant impact on the streamlines of the flow. However, the seated level contours showed some differences between the two cases especially, in rooms C, D and E where the low-velocity zones (coloured blue) increased behind the internal walls and increasing the area of high-temperature zone but generally did not result in any significant change in temperature and PMV contours. It can be concluded that the presence of the furniture in this arrangement needs not be included in any engineering calculations during the design of the natural cross-ventilation system for this type of the building. Whereas for the pattern of the flow, temperature and thermal comfort distribution should be considered and choosing a proper place to avoid changing the direction of the flow.
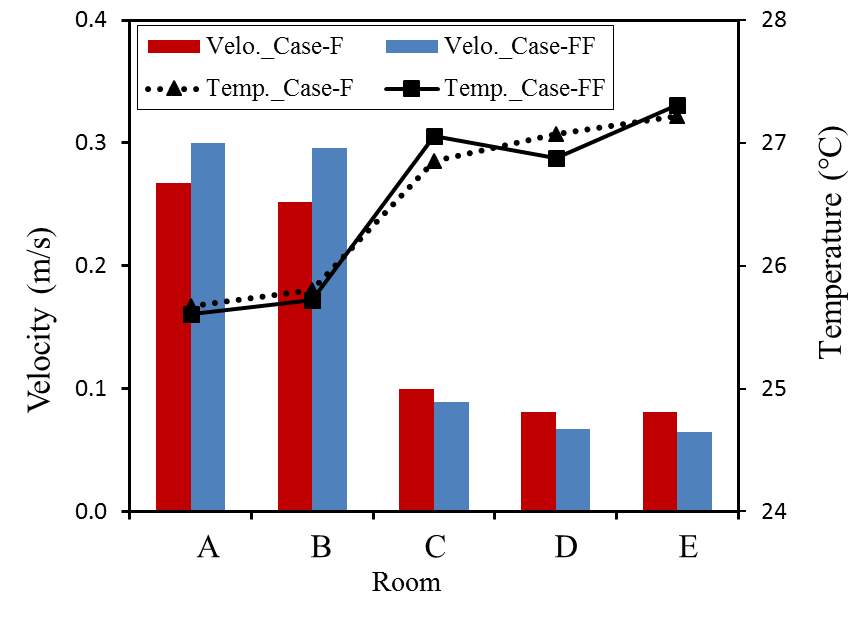
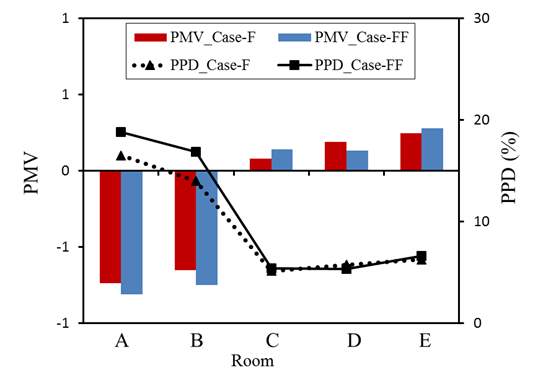
Fig. 10. The room average velocity, temperature, PMV and PPD in the seated plane.
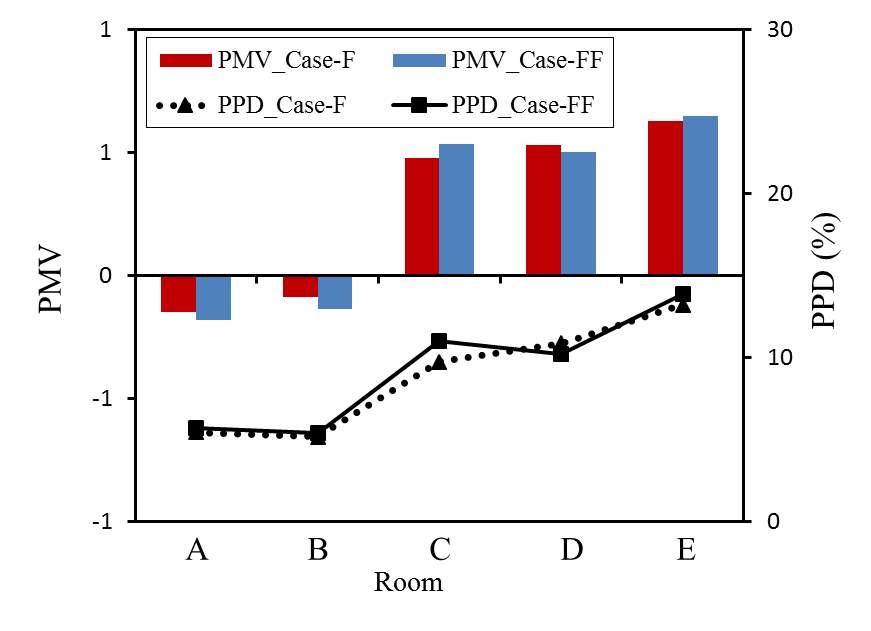
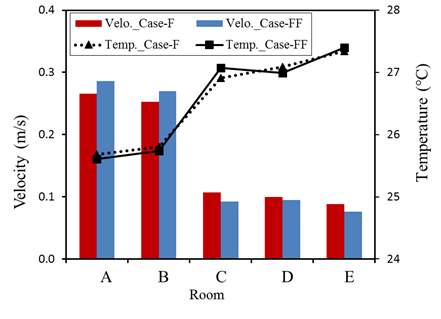
Fig. 11. The room average velocity, temperature, PMV and PPD in the standing plane.

Wind Case-F Case-FF



A
D
C
B
E
Fig. 12. Contours of dimensionless velocity magnitude (|V|/Uref), temperature and PMV in the seated plane.

Wind 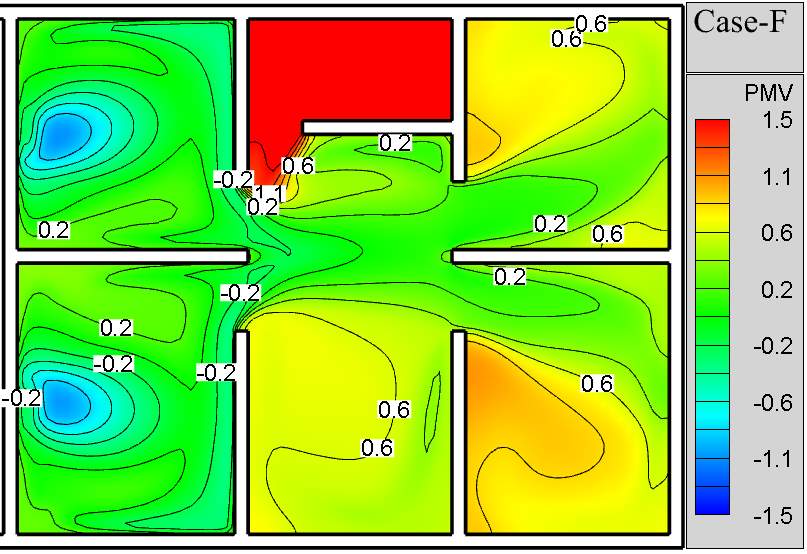
D
A
C
E
B
Fig. 13. PMV contours in the standing plane.
6.3 The Effect of heat loads on the thermal comfort
The impact of the heat loads on the thermal comfort of the building is studied in this section. Various heat loads are modelled to analyse their impacts on the temperature distribution and the thermal comfort indices in the building. Three cases are modelled with different heat loads, and the amount of the heat loads of these cases are provided in Table 2. The heat sources from the human bodies are kept constant for the three cases at 38 W/m2. The furnished house with heat loads from appliances of a daily life Case-F2 under a range of wind temperature 20-30°C has been examined to obtain the active temperature for the rest of the study. As shown in Fig. 14, the results showed that at wind temperature of 26°C the seated plane would be in a neutral thermal comfort and PPD was around 5% whilst for the standing plane, the neutral thermal condition was at temperature of 25°C, therefore the temperature 25.5 °C has been selected as an average of both levels of the rest of the study.
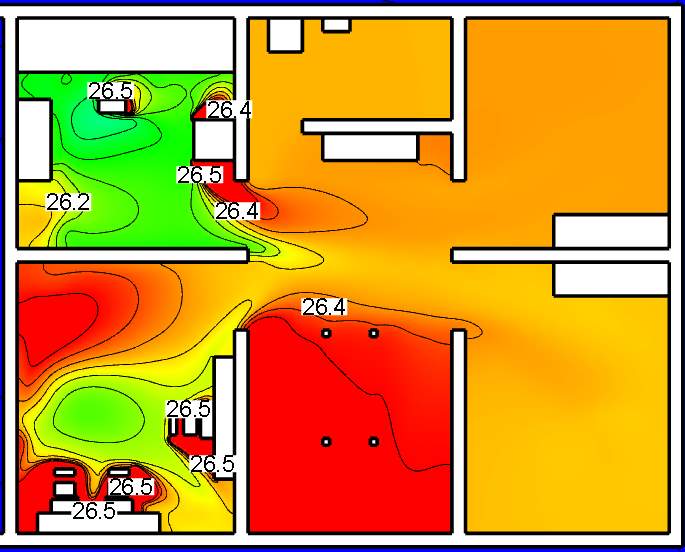
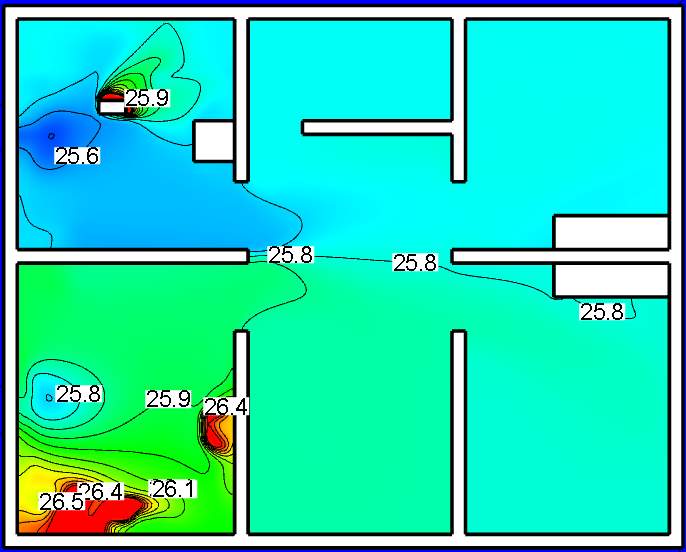
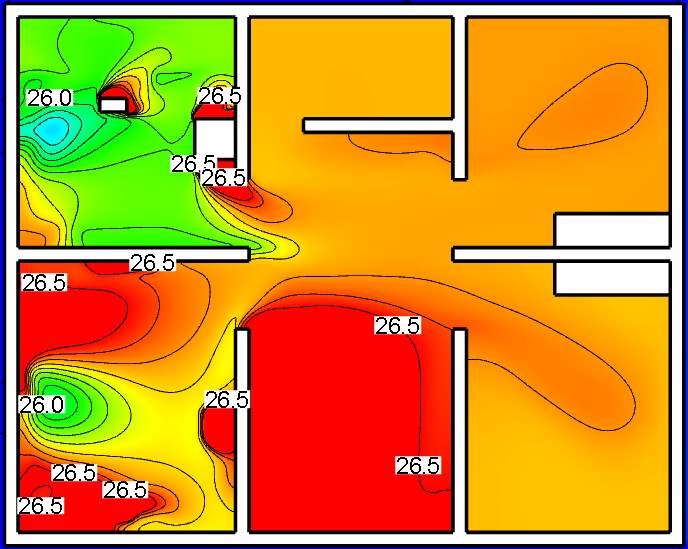
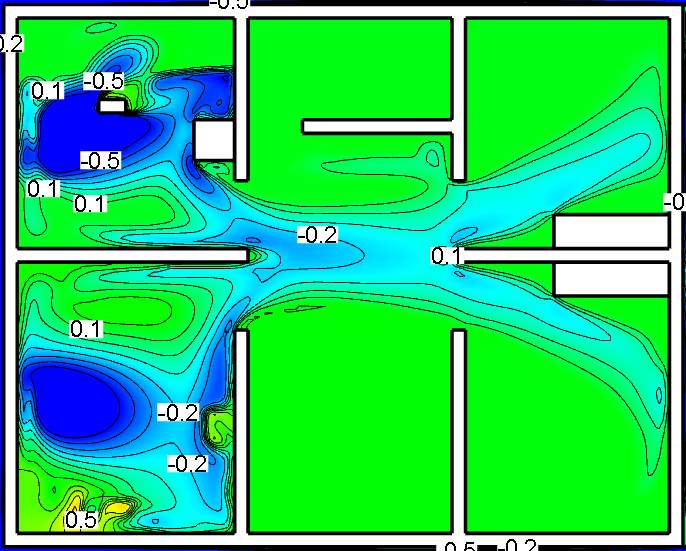
The average temperature, PMV and PPD of all rooms of the building are presented and compared in Fig. 15-16 in terms of the seated and the standing levels. In addition, temperature contours and distribution of PMV at the seated and the standing planes are provided in Fig. 17-18.
6.3.1 Case-F1 versus Case-F2
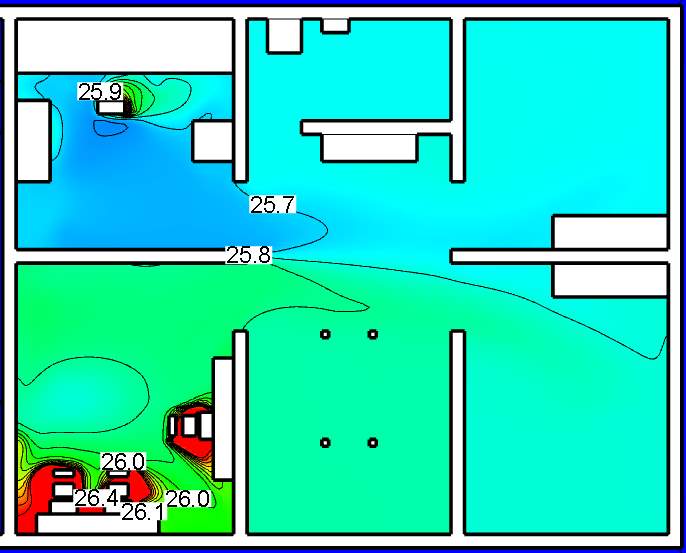
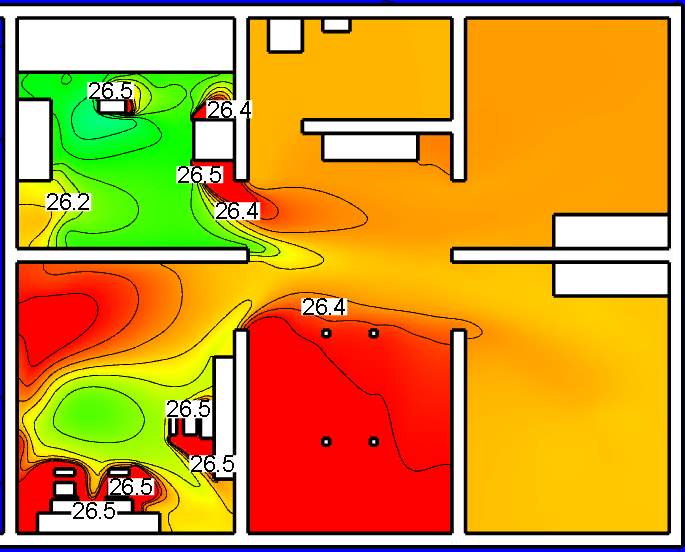
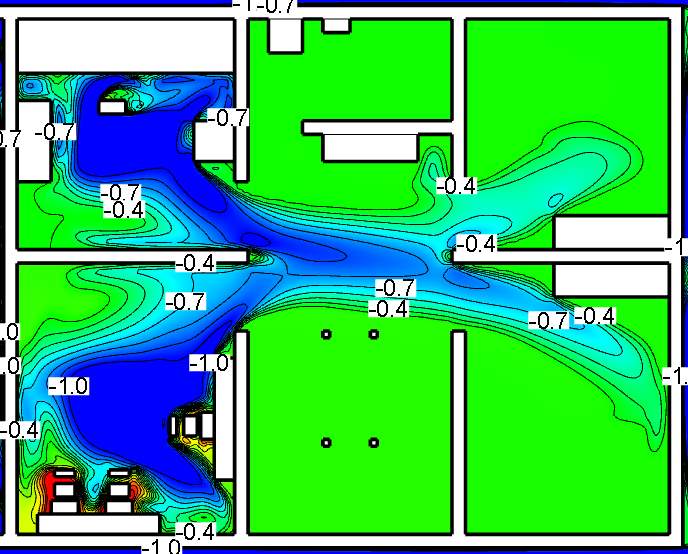
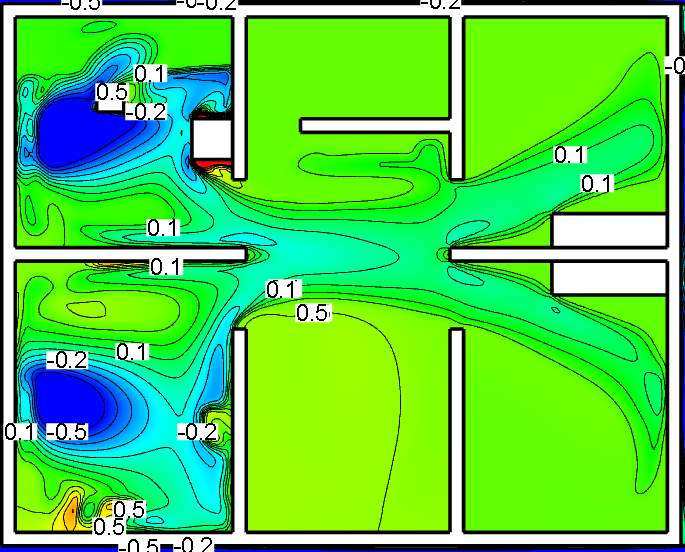
As shown in Fig. 15-16, the average temperatures in the seated and the standing planes were increased for all rooms (Case-F2) by around 0.5°C when adding heat loads to the building (Case-F1). Therefore, the PMV in both planes are slightly increased, and especially so in the seated plane where the thermal comfort approached to the neutral condition with PPD around 7%. The increase in PMV in both planes was around 0.2 only, therefore, it can be concluded that the electrical appliances typical to daily life (TV, lights, and refrigerator) have only a small effect on the thermal comfort indices due to their use of only small amounts of energy compared to other appliances such as ovens or cookers. Regarding the contour plots in Fig. 17-18 and, the temperature contour for Case-F1 and Case-F2 are different, where higher temperatures at the standing level were noticed in front of the TV and on both sides of the refrigerator due to heat dissipation. The seated level, however, showed lower influence for heat dissipation from the TV because the TV level was above the seated plane. The ambient air enters the building, is heated, moves directly to the leeward rooms through room C and dissipates its heat within these rooms. Thus, the PMV thermal comfort index increases in these rooms.
6.3.2 Case-F1 versus Case-F3
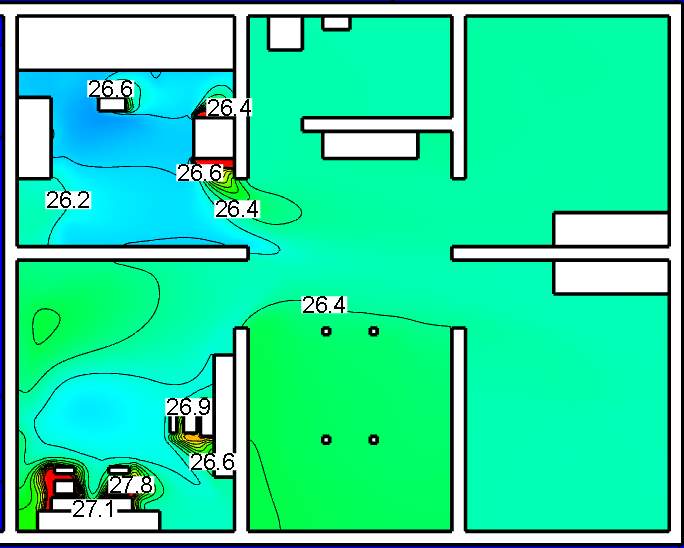
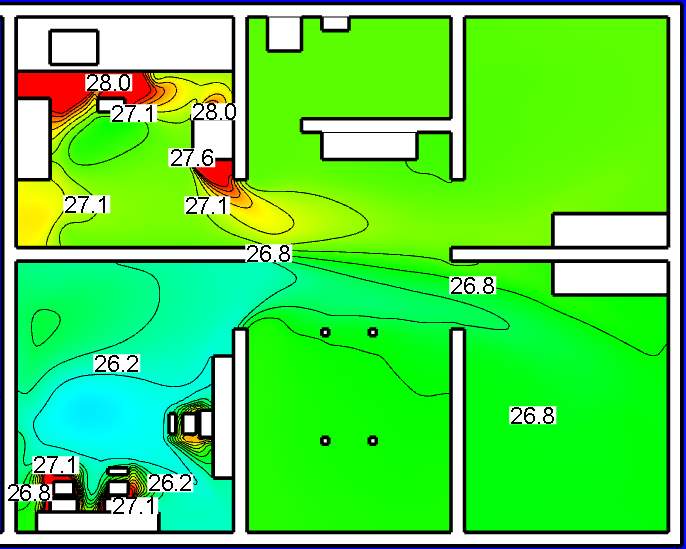
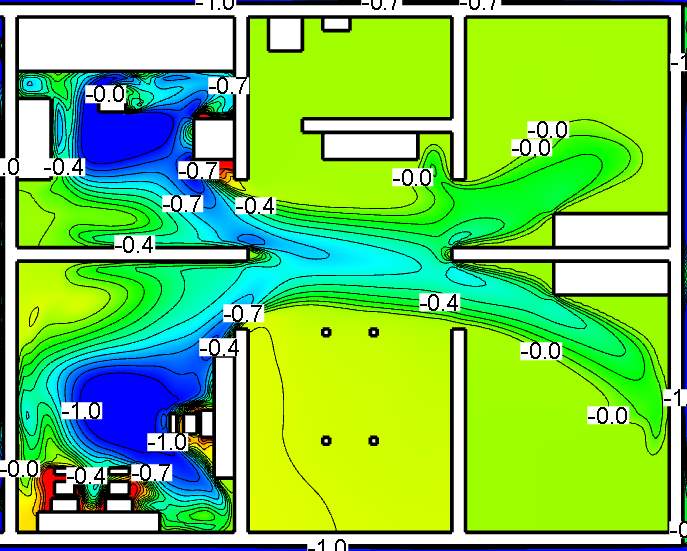
In Case-F3, an additional heat source (oven) was added to the other heat sources within the building for Case-2 to predict the change in the temperature and the thermal indices of the rooms when all these loads are present at the same time (Table 2). The average temperature of Case-F3 saw an increase of around 1.1°C in the seated plane and 1.4°C in the standing plane, as shown in Fig. 15-16. The greatest increase in temperature was at the standing level and was 3.5°C, as seen in room A, increasing the PMV and PPD to around 1.0 and 26%, respectively, whereas the smallest increase occurred in room B and was around 0.4°C because the room location is parallel to room A and it is not affected by the latter’s flow. The results of the simulation predicted that the PMV would change markedly along both levels when the additional heat source (oven) was operated at the same time as the other appliances, at 0.5 for the standing level and 0.4 for the seated plane.
6.3.3 Case-F2 versus Case-F3
To determine the impact of the heat dissipated from the oven on the thermal comfort indices and the temperature distribution of the building, additional heat loads (1142 W/m2) were added to Case-F2 (Table 2). By adding a new heat source to the building in room A (Case-F3), more heat was dissipated from the oven in this room and resulting in an increase in temperature, especially in the standing plane, of around 3oC (Fig. 15-16). The seated plane in this room, however, was less influenced by adding the heat source, due to this plane being located at lower the heat source level, such that the majority of the heat dissipated upwards towards the standing plane. As discussed in the previous section, the results of the Case-F3 model showed that the presence of the heat source in room A did not change the thermal comfort level of room B. Regarding room D, although the flow circulated inside room C, results showed that the heat dissipated from room A had more influence on room D than room E, and the heat exiting room B had more influence on room E than room D because the rooms A and D were located on one side of the building and the rooms B and E on the other.
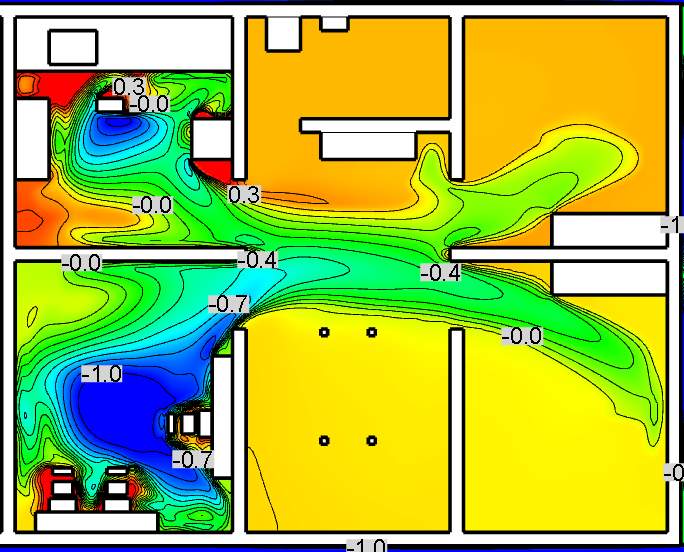
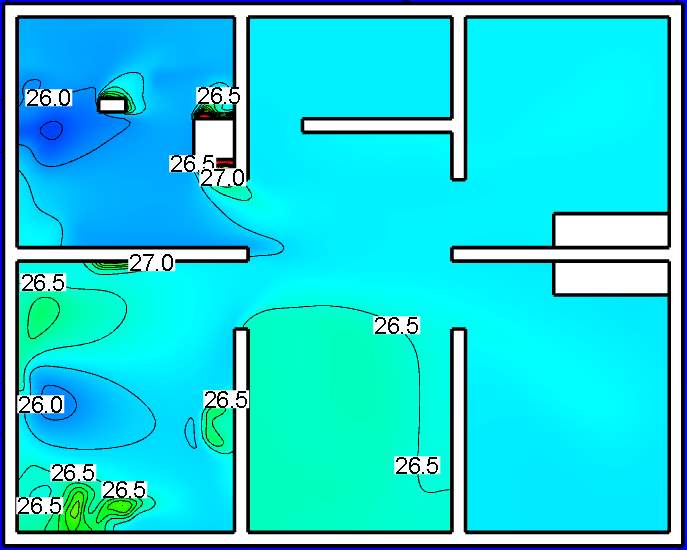
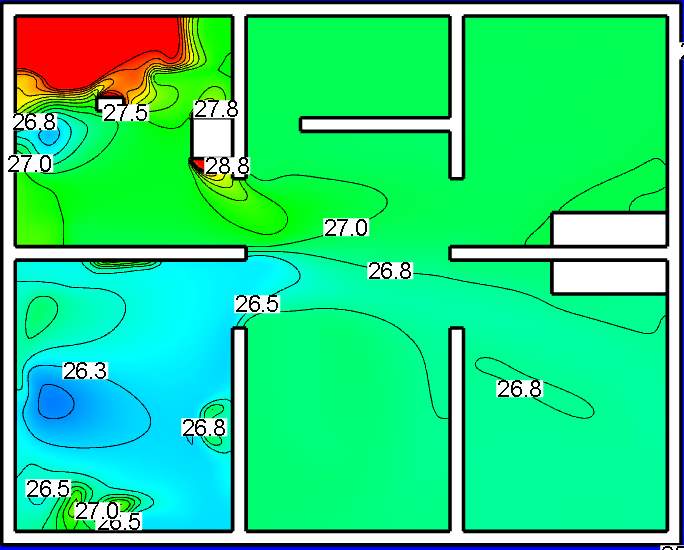
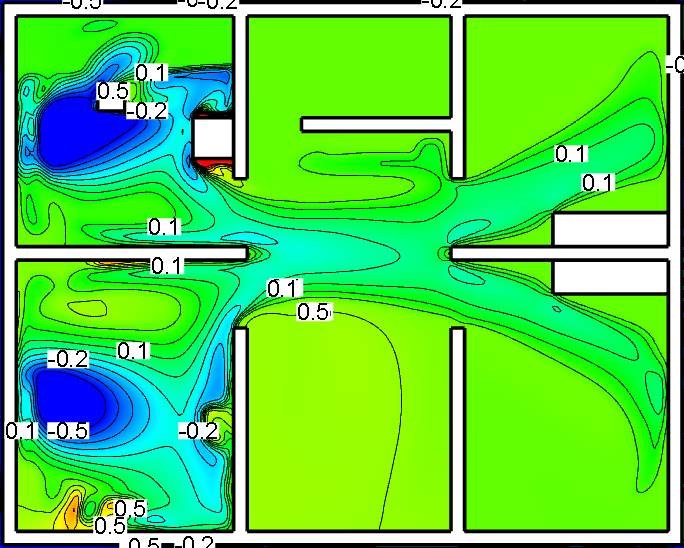
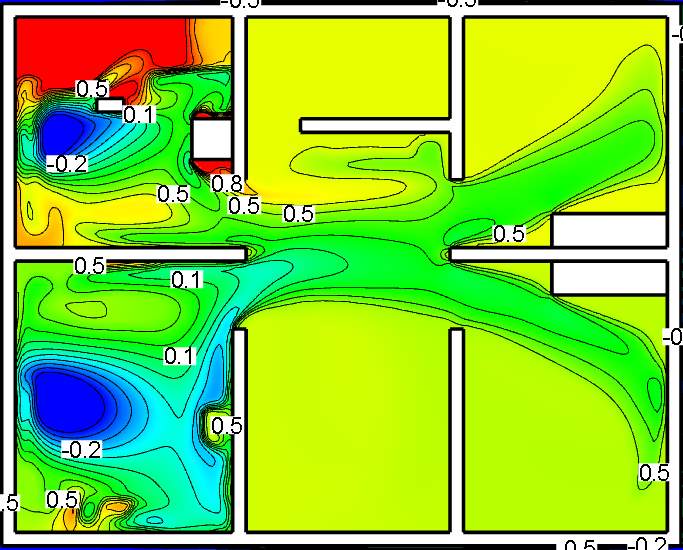
The temperature contours in Fig. 19-20 showed high temperature distribution in room A in both planes (Case-F2) because of the additional heat source (oven) in this room. Furthermore, the temperature distribution at the standing level is higher than for the seated level because the heat source (oven) was located near the standing plane, and thus most of the heat dissipated upwards into the standing level. Due to higher velocity magnitude in the incoming jet of the airflow inside rooms A, and B, low-temperature zones were formed inside these regions, resulting in a decrease in PMV as shown in Fig. 19-20.The horizontal locations of these zones were smaller and nearer to the openings in the standing plane than the seated plane. The PMV values at the centres of these rooms were lower than -1.0 in the standing and seated planes and were thus expected to be thermally uncomfortable zones when the outside temperature is lower than 25°C.
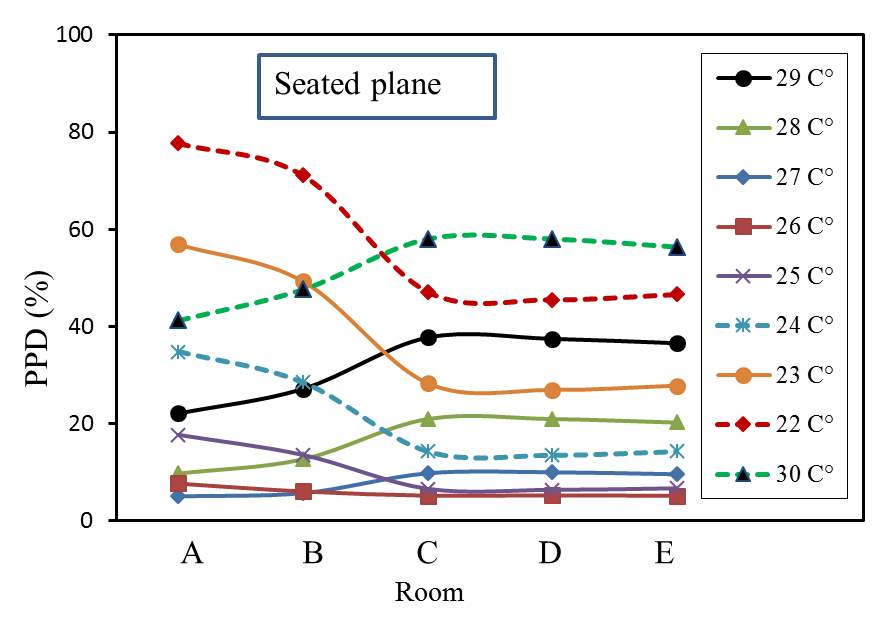
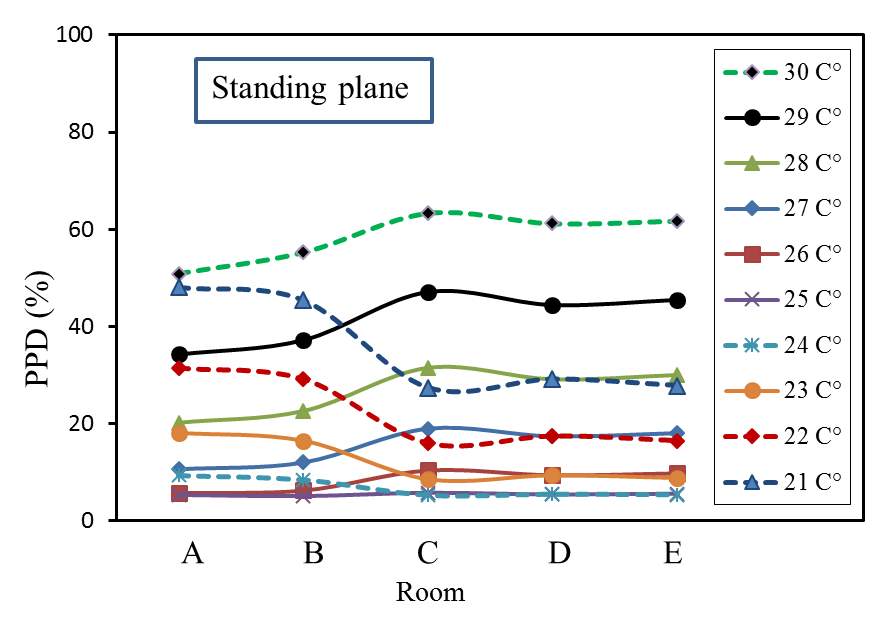
Fig. 14. The room average PPD in the seated and the standing planes for Case-F2.
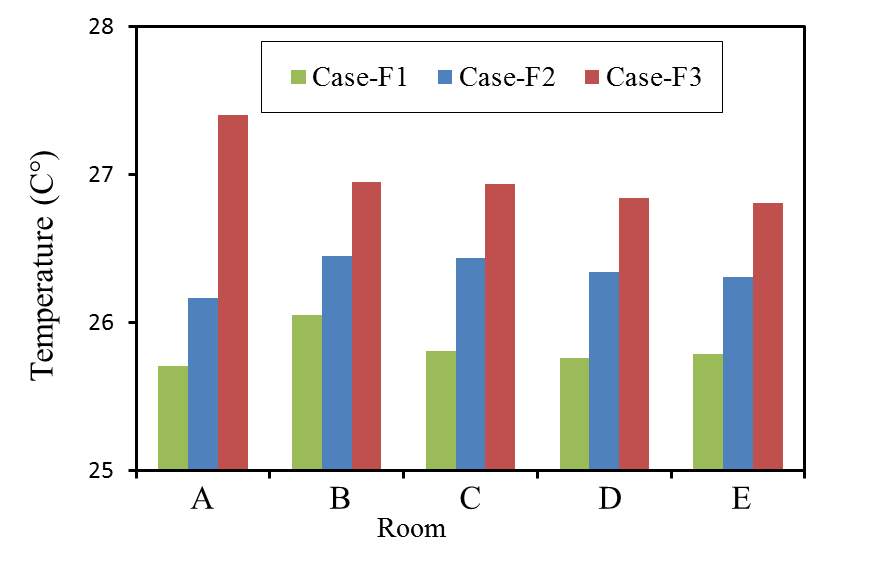
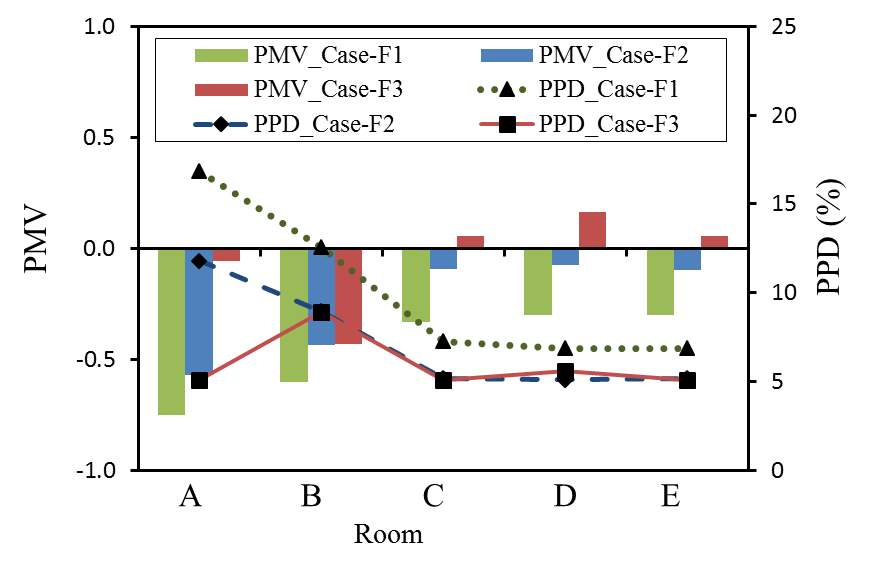
Fig. 15. The room average temperature, PMV and PPD in the seated plane.
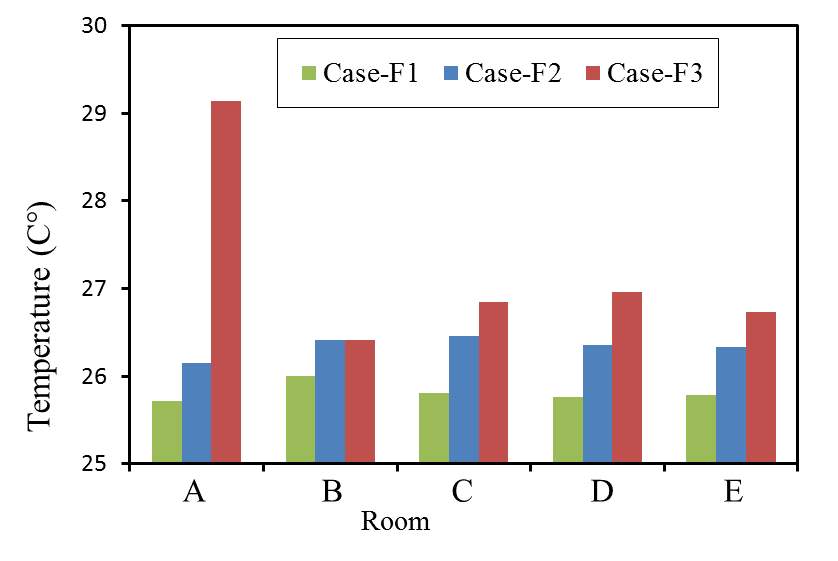
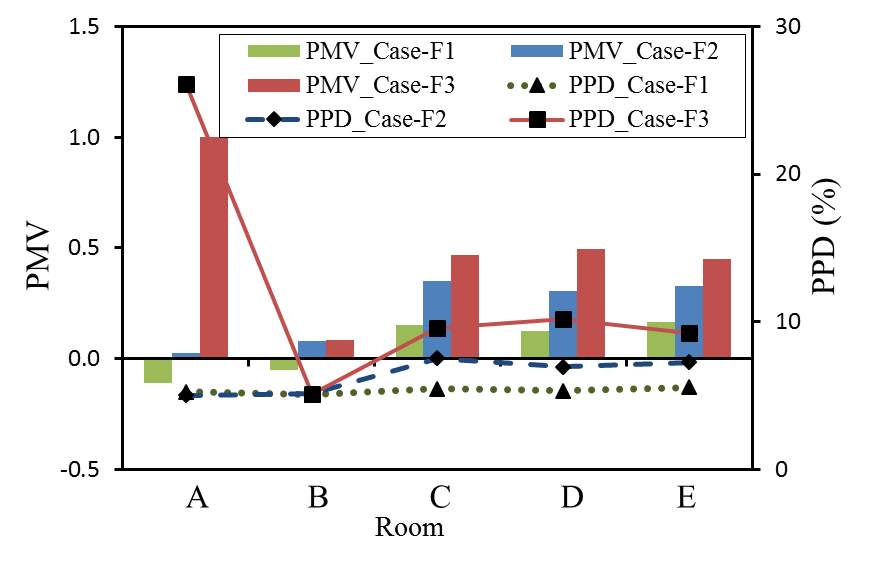
Fig. 16. The room average temperature, PMV and PPD in the standing plane.

Wind Case-F1 Case-F2


A
D
B
C
E
Fig. 17. Temperature and PMV contours in the seated plane.

Wind Case-F1 Case-F2


A
D
C
B
E
Fig. 18. Temperature and PMV contours in the standing plane.

Wind Case-F2 Case-F3


A
D
C
B
E
Fig. 19. Temperature and PMV contours in the seated plane.

Wind Case-F2 Case-F3


A
D
C
B
E
Fig. 20. Temperature and PMV contours in the stand plane.
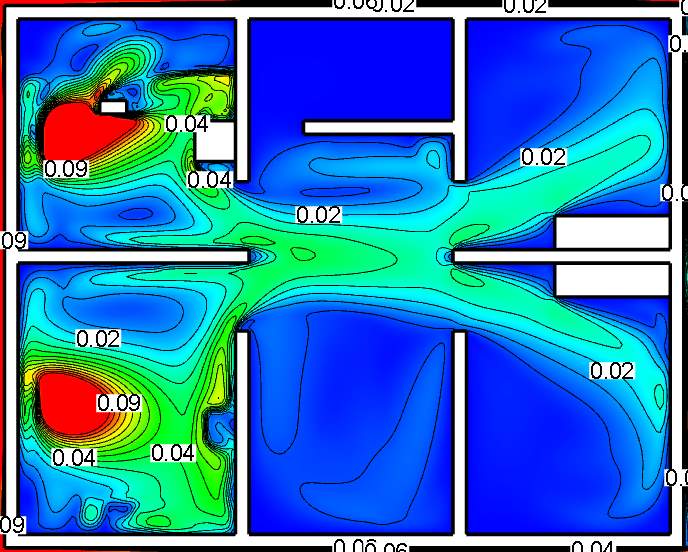
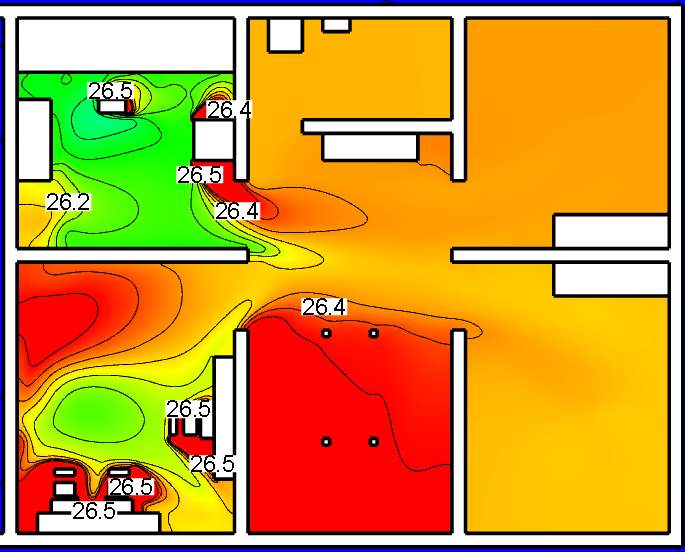
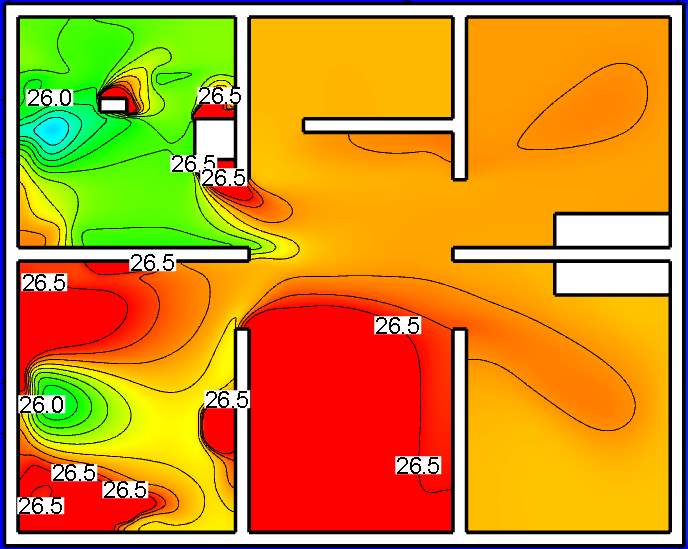
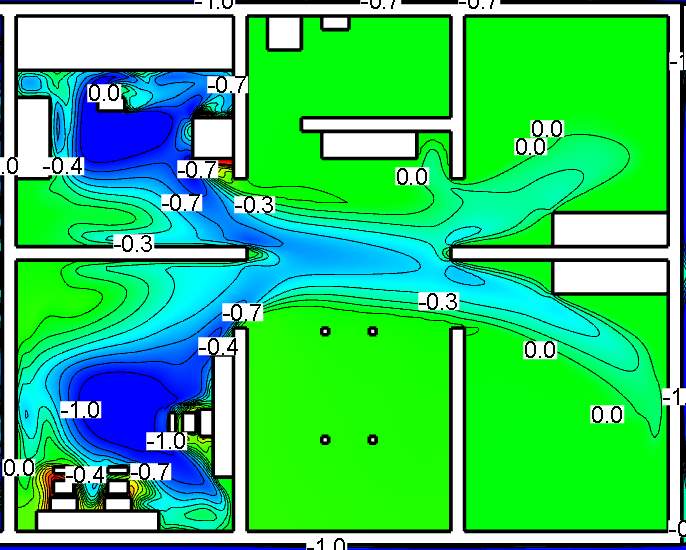
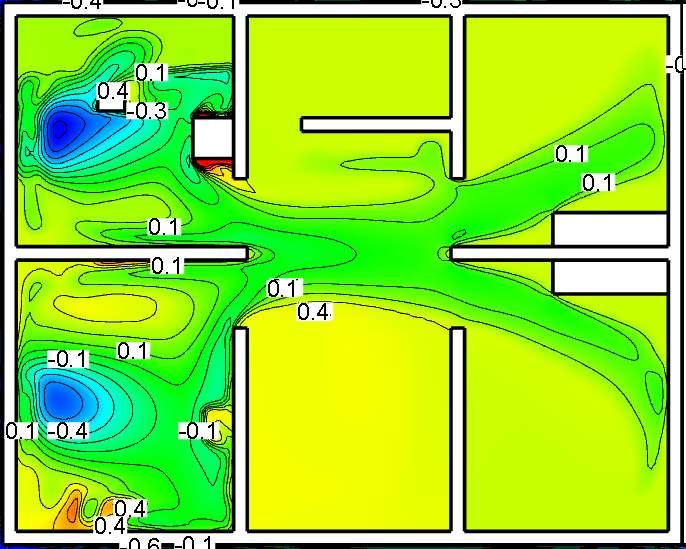
6.3.4 Seated level versus standing level
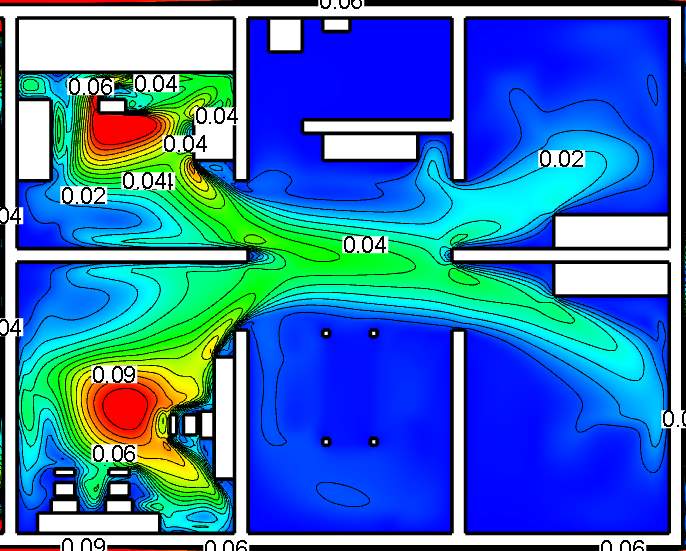
The comparison between the seated level and the standing level for Case-F2 are presented in terms of the average velocity, temperature, PMV and PPD (Fig. 21). Furthermore, contour plots for the velocity, temperature and PMV are presented in Fig. 22. The differences in the averages velocity between the seated and standing levels were small for all rooms and were not a result of the difference in temperature. The noticed difference was in room A around 5% and resulting in a very small change in temperature. Although the differences in temperature between the two planes for all rooms were effectively non-existent because of the small differences in the average velocities; the PMV and PPD at the standing level were higher than for the seated level by 0.4-0.5 because of the higher assumed the metabolic rate in the standing plane than the seated plane. Generally, the PMV averages in the seated and standing planes for all rooms were found to be near to neutral conditions and the PPD for the rooms was around 6%, implying that about 94% of the occupants would probably not find the thermal conditions uncomfortable.
Although no obvious difference between the standing level and the seating level in terms of the velocity and temperature, the PMV plots showed clear differences between the two levels because of the higher assumed the metabolic rate in the standing plane than the seated plane as mentioned previously.
Regarding rooms A and B, the differences between the levels were clear, and at the standing level the discomfort zones (coloured blue) were small whilst at the seated level were large and cover most of the plane space. Therefore, it can be concluded that the room thermally is more comfort for the standing activity than the seated and room A can suitable for the kitchen whilst room B needs improvement to achieve desirable conditions for occupants if it was chosen for sitting. The improvement in room A can be done by adding louvre to the window to change the direction of the flow towards the door of the room. Moreover, the contour plots showed that the heat dissipated from the sources of the front rooms towards the other rooms, increasing the temperature and PMV of these rooms noticeably and the standing plane showed more affected by the dissipation heat.
In general, it can be concluded that the PMV plot is an appropriate way to illustrate the heat dissipation from the heat sources, find its path distribution and find comfortable or uncomfortable areas inside the rooms of the building. The contour plot showed the places where it would be more comfortable for any occupants to perform their daily activities. To achieve the desired level of human thermal comfort, it will be necessary to control the influence of the wind, e.g. through an appropriate arrangement of ventilation openings.
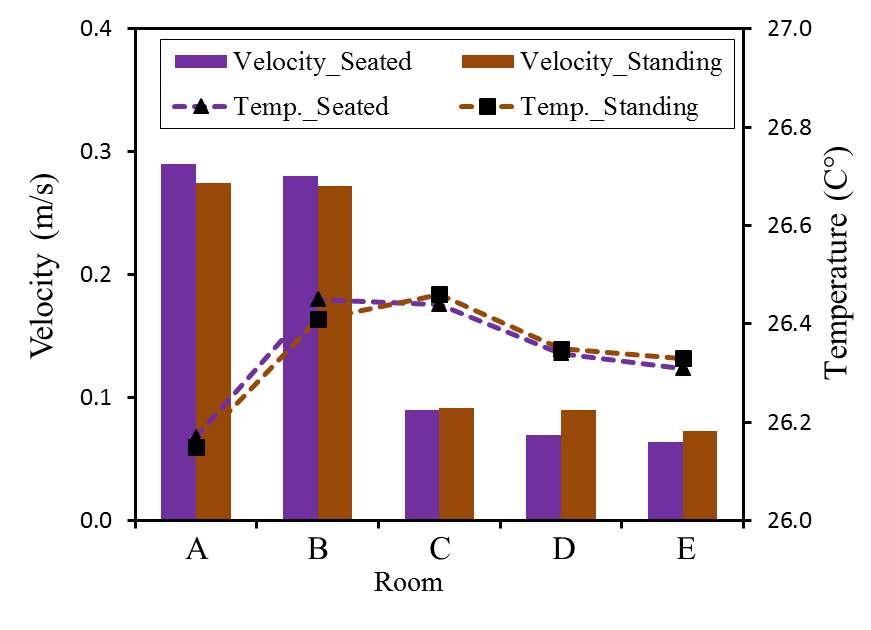
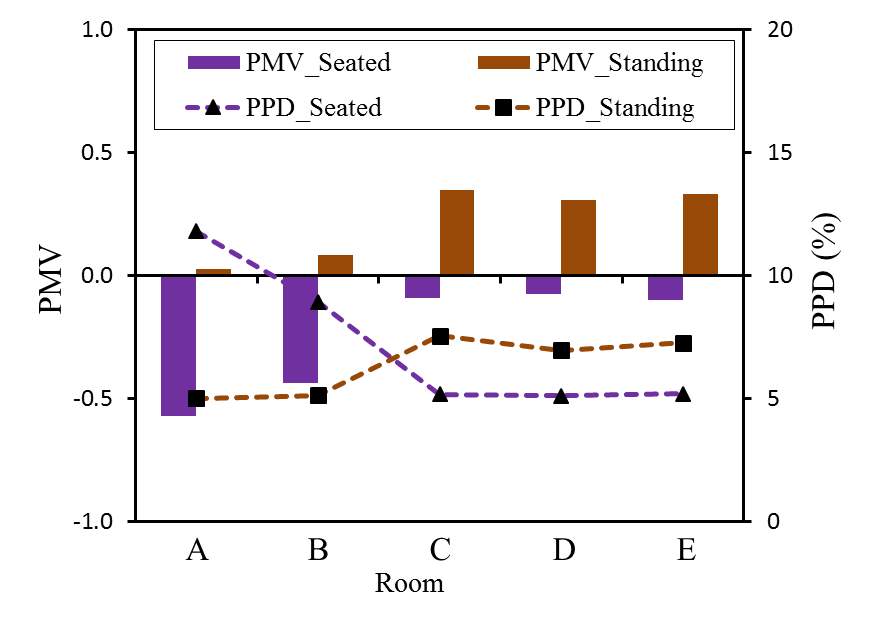
Fig. 21. The room average velocity, temperature, PMV and PPD in the seated and the standing planes.

Wind Seated plane Standing plane



D
A
B
C
E
Fig. 22. Contours of dimensionless velocity magnitude (|V|/Uref), temperature and PMV.
7 Conclusion
This study has examined the changes in the human thermal comfort in terms of the PMV and PPD values inside an average residential building in Iraq with heat loads being applied via the RANS model. Investigating the human thermal comfort in a multi-zone building could give designers valuable information regarding more energy-efficient designs in naturally ventilated buildings.
- No significant differences between the empty building (Case-F) and the furniture-filled building (Case-FF) have been noted when comparing the air velocity, temperature and indoor thermal comfort indices (PMV and PPD).
- The study has demonstrated that common electrical appliances used in daily life (TV, lights, and refrigerator) have very little effect on the human thermal comfort indices due to them using only small amounts of energy compared with other appliances such as ovens or cookers.
- In the current study, PMV is found increasing markedly at the seated and standing levels by around 0.4 and 0.5, respectively, when an additional heat source (e.g. oven) was used with the other appliances.
- The PMV averages in the seated and standing planes for all rooms were found to be near to neutral conditions at wind speed 3 m/s and temperature 25°C, and the PPD for the rooms was around 6%, implying that about 94% of the occupants would probably not find the thermal conditions uncomfortable.
- The study has also shown that the PMV contour plot is an appropriate way to show the heat being dissipated from the various heat sources, to find its path distribution and to find the comfortable or uncomfortable areas inside each room of the building.
Cite This Work
To export a reference to this article please select a referencing stye below:
Related Services
View allRelated Content
All TagsContent relating to: "Construction"
Construction regards processes involved in delivering buildings, infrastructure and industrial facilities and associated activities including planning, designing, building, and fit out. Construction also covers repairs, maintenance, and demolition.
Related Articles
DMCA / Removal Request
If you are the original writer of this dissertation and no longer wish to have your work published on the UKDiss.com website then please:

