Inspection Techniques for Offshore Pipelines Case Study
Info: 9300 words (37 pages) Dissertation
Published: 21st Jan 2022
Table of Contents
Click to expand Table of Contents
1 INTRODUCTION
1.1 Aim & Objectives
1.1.1 Aim
1.1.2 Objectives
2. OVEREVIEW OF PIPELINE SYSTEMS, DAMAGE MECHANISMS AND INSPECTION TECHNIQUES
2.1 Introduction
2.2 Pipeline Systems
2.2 Damage Mechanisms
2.2.1 Operational
2.2.1.1 Product Composition and Operating Conditions
2.2.1.2 Operational Controls
2.2.2 Structural
2.2.3 External Forces
2.2.3.1 Nature’s Forces
2.2.3.2 Human Errors
2.2.3.3 Activities in the Proximity of the Platform
2.2.3.4 Third Party Activities
2.3 Inspection Techniques for Deepwater Pipelines
2.3.1 Baseline Survey
2.3.2 Inspection Strategy
2.3.3 Inspection Methods
2.3.3.1 Internal Inspection
2.3.3.1.1 Inline Inspection: PIGGING
2.3.3.1.2 Pigging Techniques
2.3.3.1.2.1 Magnetic Flux
2.3.3.1.2.2 Ultrasonic
2.3.3.1.2.3 Visual
2.3.3.1.2.4 Calliper
2.3.3.1.2.5 Geometry Xyz
2.3.3.1.3 Permanent Monitoring Techniques
2.3.3.1.3.1 Corrosion Probe/Spool
2.3.3.1.3.2 Sand Probe
2.3.3.2 External Inspection
2.3.3.2.1 ROV
2.3.3.2.2 ROV Techniques
2.3.3.2.2.1 Visual
2.3.3.2.2.2 Geometry Xyz
2.3.3.2.2.3 Burial
2.3.3.2.2.4 Acoustic
2.3.3.2.2.5 CP Probe
2.3.3.2.2.6 Weld Scanner
2.3.3.2.2.7 Tomography Scanning
2.3.3.2.2.8 Side Scan
2.3.3.2.3 AUV
2.3.3.2.4 AUV Techniques
2.3.3.2.4.1 Visual
2.3.3.2.4.2 Geometry Xyz
2.3.3.2.4.3 Sidescan
2.3.3.2.4.4 Vibration
2.3.3.2.4.5 Strain
3. METHODOLOGY: CASE STUDIES
4. DISCUSSION/RESULTS
4.1 CASE STUDY 1: KEY TO PRODUCTIVITY
4.2 Data Processing
4.3 Data Presentation
4.4 Challenges and lessons learnt from the project
4.4.1 Challenges
4.4.2 Lessons
4.5 CASE STUDY 2: PROJECT APPROACH
4.6 CAD Simulation & Magnetic Modelling
4.7 Pipeline Inspection Data Analysis Software & Pipeline Sentencing
4.8 Pig Recovery Strategy
4.9 Location & Tracking
4.10 Pipeline Pressure 250bar
4.11 Pipeline Cleaning
4.12 Challenges and lessons learnt from the project
4.12.1 Challenges
4.12.2 Lessons
5. REFERENCES
LIST OF FIGURES
Figure 1 Types of offshore pipelines
Figure 2 magnetic pig with the Hall sensors
Figure 3 Principle of magnetic flux leakage detection
Figure 4 Simplified UT inspection system
Figure 5 Varanus Island Gas Hub
Figure 6 Gavia AUV
Figure 7 The Blue Stream Pipeline System
Figure 8 AUV near shore
LIST OF ABBREVIATIONS
AUV – Autonomous Underwater Vehicle
RHIB – Rigid-Hulled Inflatable Boat
1 INTRODUCTION
Subsea pipelines play a strategic role in the transportation of hydrocarbon resources. Right from when subsea pipeline installation started, engineers have been developing methods to inspect, maintain and repair pipelines in order to continue to safely transport these hydrocarbons.
Offshore pipelines operate in physically and technically challenging environments where they are faced with severe weather conditions, shifting sediments, and constant threat of corrosion. As the industry continues to expand towards deeper water depths due to new discoveries, operation and maintenance of installed pipelines will face greater challenges [1]. Pipeline failures and defects caused by through thickness crack, corrosion, dents, spanning/burial, gouges, leakages, coating damage, fatigue, buckle, hydrate, movement, CP failure, and vibration have devastating consequences including loss of production, threat to human safety and oil spills leading to the pollution of the environment and affecting marine life. It is therefore imperative that pipelines are inspected at regular intervals to monitor such critical defects so that appropriate and timely corrective measures can be taken. This is made possible as operators use a range of techniques to assess the health of pipelines.
The offshore pipeline industry over the years have seen massive improvement in its operating practices, more robust designs, and more efficient techniques for construction, operation, and maintenance. All over the world today operations have moved from shallow waters to much deeper waters as technology continue to advance [1].
Using the guided wave inspection technique Won Bae Na et al [2] developed a new coupler device which uses flexural cylindrical guided waves to inspect the mechanical defects of underwater pipelines. The study showed the new coupler device as an effective tool for monitoring the health of subsea pipelines. In 2014 Silvio Del Giudice [3] investigated the possibility of a vibro-acoustic system for remote real-time monitoring of pipelines. In the study pressure and vibration sensors were installed on a pipeline, acoustic and elastic waves produced and propagated along the pipeline were recorded at monitoring stations.
The result is the remote detection of third-party interference, leaks, spills, pig operations on the pipeline. Thus long term monitoring of transportation efficiency or detection of malfunctioning, failures and anomalies along the pipeline are made possible using the software dubbed e-vpms®. A method to reliably and accurately detect leaks in a subsea pipeline helps prevent or minimise failures. In this regard Marcia Golmohamadi [4] used two methods; hardware based and software based approaches respectively for the detection and localisation of a leak in a pipeline. In the study two techniques were employed; a finite difference model that uses guided waves and sensing, and a model-based approach which uses numerical model of pipe and flow and pressure measurements at both ends of a pipeline.
Using a pipeline of length 500km the estimated error for leak detection was 7% for the first approach. Although very reliable for leak detection, it is very expensive to implement and can only work within a very short range. Using the second approach single leak on a pipeline of over 100km can be accurately located with a 6.5% maximum error estimation. It is however observed that this model only works for single leaks, therefore more research should go into detecting multiple leaks as well.
A common problem encountered in the design phase and during operation of pipelines is free spanning. Direct wave and vortex induced vibrations can expose these spans to fatigue damage, hence the need for in-service inspection and monitoring [5]. Xue-Lin Peng investigated the feasibility of using vibration based methods in subsea pipeline bedding condition monitoring.
The following conclusions were reached at the end of the study for model-based damage identification. Scouring damage is always more reliably identified than pipe damage due to free-spanning causing a 100% foundation stiffness loss. Model updating method can be used in identifying both single and multiple free spans along a pipeline. It is however difficult to develop an accurate pipeline model for use in model-based method for monitoring pipeline conditions this is because the effectiveness of the model-based technique is dependent on the accuracy of the structural model, hence there may be challenges when applied to a subsea pipeline.
For the model independent technique, it could identify the presence of a free span as small as 5m for the relatively stiff seabed and 10m for the relatively soft seabed. Thus for the particular subsea pipeline monitoring, non-model-based method was found to be superior to model-based method as it needed only measured response data and was entirely model independent [5].
This thesis looks specifically at the available inspection techniques for use on offshore pipelines.
1.1 Aim & Objectives
1.1.1 Aim
The aim of this thesis is to review the various inspection techniques available for offshore pipelines using a case study based on three subsea fields at different water depths.
1.1.2 Objectives
The objectives of this study are to provide information on:
- Inspection techniques for offshore pipelines
- The inspection technique being deployed by the field under the case study
- The most applicable and beneficial inspection technique for offshore pipelines for the case study.
The techniques covered in this report are by no means exhaustive; but rather a fair representation of established and commonly used pipeline inspection techniques.
2. OVEREVIEW OF PIPELINE SYSTEMS, DAMAGE MECHANISMS AND INSPECTION TECHNIQUES
2.1 Introduction
Damage to any component of a pipeline system can be very detrimental to its operations. The level of severity depends on the component that is damaged, the type and extent of damage, the location and how quickly such damage can be repaired. Pipeline failures result in environmental damage, economic losses and injuries to human lives. Repair costs and lost revenue run into millions of dollars. Therefore safer and more reliable pipeline networks will result in more productivity while reducing costs.
2.2 Pipeline Systems
As shown in figure 1 below, offshore pipelines comprise [6] [7]:
- Flowlines to transport oil and/or gas from satellite subsea wells to subsea manifolds;
- Flowlines to transport oil and/or gas from subsea manifolds to production facility platforms;
- Infield flowlines to transport oil and/or gas between production facility platforms;
- Export pipelines that transport oil and/or gas from production facility platforms to shore;
- Flowlines transporting water or chemicals from production facility platforms, through subsea injection manifolds, to injection wellheads.
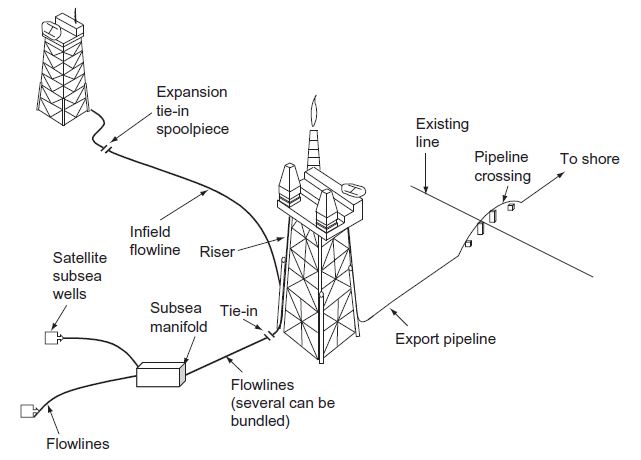
Figure 1 Types of offshore pipelines
Before looking at the various inspection techniques, it is important to identify the potential damage mechanisms that offshore pipelines are prone to.
2.2 Damage Mechanisms
Offshore pipeline operations can be affected by three major groups [8]. These mechanisms are:
- Operational
- Structural failures
- External forces
2.2.1 Operational
2.2.1.1 Product Composition and Operating Conditions
In the design of pipeline systems material selection, corrosion protection and development of operational procedures are taken into account and these determine the type of product such pipeline systems transport. Where a product becomes incompatible with the steel material due to changes in composition during production, pipeline integrity can be impaired. Product composition should be determined at design stages while production is monitored to ensure products passing through pipelines do not affect its performance. Pipelines are designed to operate at specific design pressures and temperatures, exceeding these can led to pipeline failures [9].
2.2.1.2 Operational Controls
Pressure and temperature of hydrocarbons at the wellhead are usually higher than the design values used for the pipeline/riser system. Hydrocarbons are processed before being introduced into the pipeline where the input pressures and temperatures can be controlled. Heating or cooling of product allows for control of the flowing temperature while control valves are used to control the pressure. Pressure monitoring and control systems are installed on the platform. Many installations also use automatic over-pressure protection systems. These systems are designed to automatically shut off the product flow into a pipeline if pressure variations exceed set thresholds. It is necessary that operational tolerances of components used and pressure fluctuations are carefully monitored to avoid unnecessary shutdowns [8].
2.2.2 Structural
Structural damage to pipeline/riser systems are caused by:
- Material fault
- Fabrication/construction deficiencies
- Corrosion
Correct material specification is necessary to minimise material faults. There is need for high quality assurance and quality control during pipe and component manufacture in order to eliminate fabrication and construction faults. Only a few pipeline failures can be attributed to excessive corrosion. Good corrosion protection design can overcome the problem.
2.2.3 External Forces
External forces pose the most danger to pipelines/risers. These forces are:
- Nature’s forces
- Human errors
- Activities in the proximity of the platform
- Third party activities
2.2.3.1 Nature’s Forces
Various natural phenomena can affect the safety and performance of pipelines. Waves, current and wind are some of the environmental forces that can affect pipelines. Other natural occurrences include:
- Earthquakes: for earthquake prone zones only limited protection can be provided against earthquakes.
- Landslides: pipeline routes should not be made to pass such areas but if they do stabilisation/ protection should be provided.
- Hurricanes: affects near shore areas. Deep burial should be considered for such locations.
- Floods: affects onshore pipelines or ones close to rivers.
2.2.3.2 Human Errors
Human errors are responsible for major failures and disasters year round in almost all industries, pipelines are not exempted. Individuals and teams must learn to be more responsible and take proper care. Human errors can result in leakages leading to fire and explosion. Pipelines should be designed such as to minimise the impact of human errors. The Gulf of Mexico disaster is a perfect example of the serious impact human errors can have.
2.2.3.3 Activities in the Proximity of the Platform
The presence of supply and maintenance vessels’ within the vicinity of a platform can sometimes result in accidental damage to pipeline systems. Pipelines or risers close to platforms can be damaged due to dropped objects from supply or maintenance vessels. Objects can equally be dropped from the platforms. Some precautionary measures to take therefore include:
- Pipelines and risers should be located away from boat landing areas
- Pipelines and risers should be outside the crane circle
- Risers are protected near the sea water level
- Extra effort should be taken to ensure that equipment transfer from supply vessels and during maintenance are properly monitored to avoid accidental dropping of articles
- For jack-up rigs being used for wellhead/platform maintenance, pipelines should be routed far away from the foot prints of the rig
In situations where it is difficult to route pipeline to avoid the dangers mentioned above, alternative solutions are:
- pipelines should be trenched very close to the platform
- pipelines should be properly covered with rock, mattresses
- cover pipeline with protective covers
- provide thicker concrete coatings
2.2.3.4 Third Party Activities
Third party activities remain one of the greatest threat to safety of a pipeline especially in the open sea. Due to the exclusion zone which is a 500 m radius around platforms, unauthorised entry by fishing and shipping vessels is not possible. But in the open sea pipelines are susceptible to damage by ship anchors and fishing gear. Pipelines get damaged as anchors hook and pull the pipelines. These anchors are very heavy and dig deep into the sea. Pipelines should therefore be trenched where fishing activities are likely to take place.
2.3 Inspection Techniques for Deepwater Pipelines
Inspection is the process of regularly monitoring any equipment to ensure its continued operation and identify any possible area of premature failure [10]. Inspection may be destructive or nondestructive. Destructive inspection causes physical damage to the system making it unsuitable for service. Nondestrucitve inspection uses techniques that do not hinder the continued functioning of the system under inspection [11].
2.3.1 Baseline Survey
For every inspection work, ongoing assessment of inspection findings will have to be compared with data recorded for past inspection campaigns.
This enables trends to be extrapolated and judgments made regarding the urgency of remedial action.
This process is carried out through the acquisition of the measurement of internally and externally taken values at the commencement of pipeline service, known as a Baseline Survey.
On completion of the installation of the deepwater pipelines, an as-built survey is done by the Installation Contractor to ensure that the construction is fit for service. Similarly the Subsea Commissioning Team on the other hand also does a survey to establish correct functionality and initial integrity of the system.
Together the As-Built and Commissioning surveys will form the Baseline Survey against which future inspection will be measured.
2.3.2 Inspection Strategy
Planned inspection form an integral part of the IMR strategy. Inspection are carried out to monitor pipeline system integrity over time and to monitor the impact of the subsea and production environments on the pipeline [12].
Routine inspections help point out if there is the need for more specific investigations involving detailed or specialist techniques. For deepwater pipelines, inspection tasks can be divided into locations internal and external to the pipeline.
Internal and External locations are typically periodically inspected by Pigging and ROV/AUV methods respectively.
Permanent monitoring methods also exist and are becoming more commonplace.
2.3.3 Inspection Methods
2.3.3.1 Internal Inspection
2.3.3.1.1 Inline Inspection: PIGGING
Inline inspection also known as smart or intelligent pigging is done to establish the actual condition of the pipeline. With ILI devices equipped with nondestructive testing (NDT) technology are go through the interior of pipelines to identify defects and anomalies. Fluids flowing through pipelines propel the devices as they swim freely. They are autonomous and have no external influence on their operation, control, processing and recording of data[13].
Pigging is not an operation to be undertaken lightly, it comes with its technical challenges hence the need for careful control and co-ordination. A foreign body introduced into the pipeline can be cease to move, block the flow and have to be cut out causing an upset and resulting in an operational expense. Every pipeline operator must always give serious consideration to whether his line really needs to be pigged, whether it is suitable to be pigged, and whether it is economic to do so [14].
2.3.3.1.2 Pigging Techniques
2.3.3.1.2.1 Magnetic Flux
Magnetic flux detection is a nondestructive testing technique. It employs the use of magnetic sensitive sensors which detect magnetic leakage field of pipeline defects. Nondestructive techniques have always been instrumental in the evaluation of the condition of pipelines [15].
In the early days inspection methods used high frequency ultrasonic signals to detect external cracks and defects. Corrosion, extreme temperatures and bending stress can cause small cracks and pits in pipeline walls. One challenge faced with the use of ultrasonic inspection is that it can only detect external defects while failing to detect inner pipeline walls. Electromagnetic inspection technique was considered as an alternative to ultrasonic inspection in the 1970s [16].
During magnetic inspection a magnetic field is applied to a ferromagnetic structure and changes in the magnetic flux density is measured and used to determine whether a defect is present in the structure. Magnetic flux leakage is measured by Hall Effect sensors. These are devices which produce voltage differences in a conductor due to varying electric current. The use of magnetic fields to detect ferromagnetic defect is what is known as magnetic flux leakage (MFL) inspection. Unlike other inspection methods MFL inspection does not require pre-processing [15]. An advantage MFL inspection gives is the ability to detect internal pipe wall defects without line of sight. Visual inspection, acoustic and lasers require surface scans of a material in order to detect cracks. MFL, radiographic and eddy current methods are able to detect internal cracks and corrosion inside a pipeline with the added advantage of being able to be applied internal or external to the pipe wall. MFL has become one of the key inspection techniques for the offshore pipelines due to low sensor costs and portability [17].
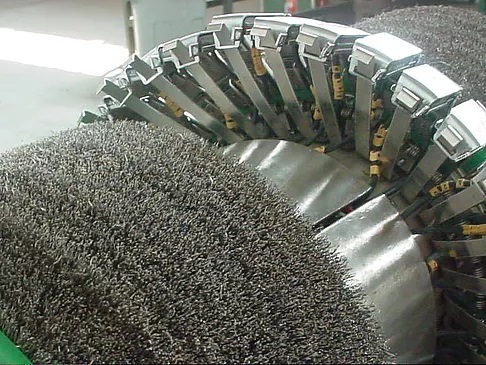
Figure 2 magnetic pig with the Hall sensors
Basically for a ferromagnetic material with no defect, most of magnetic flux lines will go through the material; where a defect is present, there will be an increase in magnetic resistance in the defect area due to the magnetic permeability of the defect area being smaller than that of the ferromagnetic material. Thus there is a distortion in the magnetic field within that area. Magnetic flux become bent, some leak out of the material surface causing a magnetic leakage field to form in the defect site. Figure 4 below shows the basic principles of MFL detection [18] [19].
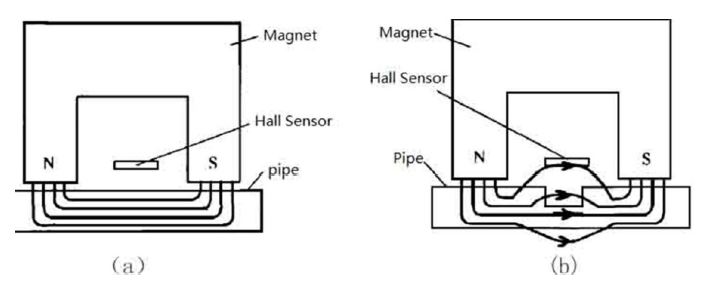
Figure 3 Principle of magnetic flux leakage detection
2.3.3.1.2.2 Ultrasonic
Ultrasonic waves can travel through solids. These waves can be can be predicted and modelled as they interact with solids. Ultrasonics is therefore used as a means to determine the nature of a solid material; its flaws, thickness, material characterisation [20]. In ultrasonic testing (UT) high frequency sound waves are used to carry out inspections. The technique involves the capture and quantification of either reflected waves or the transmitted wave [21].
Basically, a simple ultrasonic inspection system is made up of the receiver (pulser), a transducer and display screen as shown in figure 5 below. The pulser produces high voltage electrical pulses. It drives the transducer which creates high frequency ultrasonic energy. This sound energy is propagated as waves in the material. The waves get reflected, and the signal is changed into electrical signal again, it is picked up by the transducer and output to the screen. The recorded signal is used to give a detailed account of the material being tested [22].
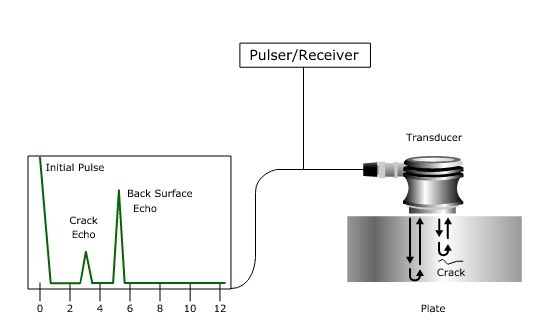
Figure 4 Simplified UT inspection system
The material thickness, position, shape, size, composition, flaws within it are all parameters that can be measured using ultrasonic testing. Generation of 2-D and 3-D images of materials by means of a transducer scan is also possible [20], [23].
Several applications of ultrasonic testing for the inspection of subsea pipelines exist today. There is an ultrasonic tomographic instrumentation system for inspecting flaws on pipelines. Ultrasonic tomography measures signals from sensors placed within an object and the data acquired is processed for image reconstruction [24]. The system is made up of a sensing system, a circuit of ultrasonic sensors, data acquisition, data interpretation and image reconstruction. Voltages are recorded and interpreted to give distance measurements. These distance measurements are used to detect the depths of flaws within the pipeline. Once an inspection has been carried out, an image of the entire pipe showing both internal and external flaws is reconstructed. The orientation, size and shape of the flaws present can be visualised from the reconstructed image using the ultrasonic tomography system [25].
Sonomatic has developed an automated ultrasonic subsea inspection tool, ROV-iT. It can be deployed by a remotely operated vehicle (ROV) to depths of up to 2000m. It is capable of performing ultrasonic inspection using techniques such as corrosion mapping, Time of Flight Diffraction (TOFD), automated shear wave pulse echo, and component profile measurement for different kinds of subsea structures such as pipelines, risers, flexible risers, caissons and structural assets by being deployed vertically and horizontally [26].
The ROV-iT is able to perform various inspection tasks such as the verification of ILI tool findings, inspection for fatigue cracking, subsea fabrication and repair welds, preferential weld corrosion and erosion, internal corrosion and erosion, etc. Key benefits include a cost effective inspection, no dive support vessel or diver required, deep water inspection among others [26].
2.3.3.1.2.3 Visual
Visual inspection is the oldest-fashioned but very useful underwater pipeline inspection technique. The technique involves assessing the current state of the subsea pipelines. Visual inspection is categorised into General Visual Inspection (GVI) and Close Visual Inspection (CVI). With GVI the general state of the pipeline is assessed looking at common areas susceptible to defects. Operator needs to be within the vicinity of the structure. Some GVI include scour, marine growth and coating surveys. CVI gives more detailed attention to parts of the structure that have suffered massive damage as well as areas with welds. It brings inspectors to touching distance of the component being inspected. Mostly require cleaning of components first [27].
2.3.3.1.2.4 Calliper
These smart pigs are used to identify changes in pipe internal bore, especially ovality and dents. They also identify obstructions caused by debris, partially closed valves. Calliper pigs are designed to report any bore reduction greater than 1% or 2% of the pipeline diameter. Calliper pigs are of two basic types: single channel and multi-channel. Single channel pigs report changes in bore and the location on the pipeline but give no details on orientation of the dent. Normally, a calliper report will give details about dent location, depth and sometimes orientation. Calliper pigs are unable to detect external metal loss but may be able to identify seam or girth welds [28].
Baker Hughes GEOPIG™ high-resolution calliper in-line inspection device enhances pipeline inspection by detecting deformation and movement. It measures pipeline dents, wrinkles, buckles, and ovality. It allows for positional accuracy ensuring that digging for anomalies in the pipeline is in the right direction. Data analysis from the GEOPIG is used to predict pipeline movement due to temperature/pressure variations, flooding, new construction impact, or slope instability [29].
2.3.3.1.2.5 Geometry Xyz
This service that has been developed to identify three dimensional geographical pipeline coordinates using an inertial measurement unit. It simultaneously monitors the pipeline inner geometry [30].
Some key advantages include high precision geometry mapping and dent sizing by means of contour following sensor technology. It uses high resolution inspection raw data to accurately grid discrete stress and strain. Also used to quantitatively determine scale, debris and wax using touchless pipeline surface sensing [31].
ROSEN RoGeo•Xt is a device that uses high-resolution technology in combination with a touchless electronic measuring system and conventional calliper arm tools. This is a dynamic compensation technology that produces highly accurate results both under dynamic and static conditions [32].
2.3.3.1.3 Permanent Monitoring Techniques
2.3.3.1.3.1 Corrosion Probe/Spool
2.3.3.1.3.2 Sand Probe
2.3.3.2 External Inspection
Divers and ROVS (remotely operated vehicles) have been used as the principal means of underwater pipeline inspection [2]. There is a first run visual inspection which leads to more detailed visual and specialised inspections.
2.3.3.2.1 ROV
2.3.3.2.2 ROV Techniques
2.3.3.2.2.1 Visual
2.3.3.2.2.2 Geometry Xyz
2.3.3.2.2.3 Burial
2.3.3.2.2.4 Acoustic
2.3.3.2.2.5 CP Probe
2.3.3.2.2.6 Weld Scanner
2.3.3.2.2.7 Tomography Scanning
2.3.3.2.2.8 Side Scan
2.3.3.2.3 AUV
2.3.3.2.4 AUV Techniques
2.3.3.2.4.1 Visual
2.3.3.2.4.2 Geometry Xyz
2.3.3.2.4.3 Sidescan
2.3.3.2.4.4 Vibration
2.3.3.2.4.5 Strain
3. METHODOLOGY: CASE STUDIES
Research was based on online journals, articles, conference presentations and relevant materials to discuss the various inspection methods that were applied in undertaking pipeline inspection for the specific oil fields and water depth.
CASE STUDY 1: PIPELINE INSPECTION USING LOW LOGISTIC AUV IN OFFSHORE AUSTRALIA (SHALLOW WATER DEPTH OF 110 m)
In 2014 UTEC Survey was contracted by Quadrant Energy to carry out a subsea inspection project at water depths of 0-110 m to cover:
- all Vanarus Island hub subsea facilities and platforms
- Stag and Reindeer fields
- 43 pipelines of total length 571 km
- 20 platforms and structures site surveys
- Sales gas pipelines to onshore
Varanus Island Gas Hub is located 95km west of Dampier in Western Australia’s northwest. It has been in operation since 1993. It is has a network of fixed production platforms which produce gas, oil and condensates for the island from which 6000 barrels of oil and condensate, up to 390TJ of gas per day are produced. The Island acts as a support base for other offshore operations in the Carnarvon Basin for Quadrant Energy [33].
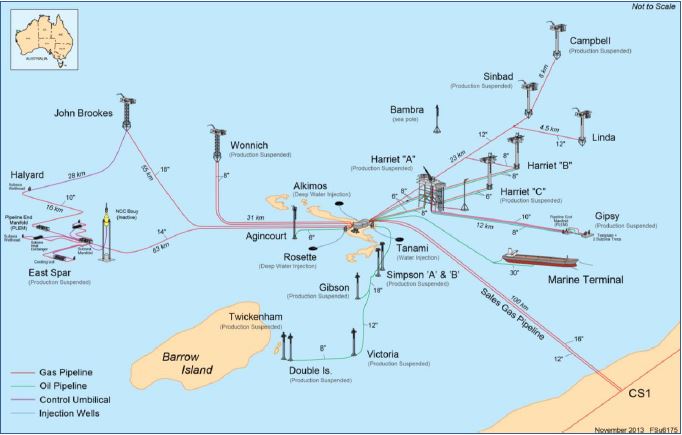
Figure 5 Varanus Island Gas Hub
The inspection was carried out using two Teledyne-Gavia AUVs. Deployment of the AUVs were done from support vessel MV Yardie Creek.
Teledyne-Gavia AUV
This comprises plug and play AUV modules which are configurable for use on the field. Can be assembled with a set survey-grade sonar modules which has a low logistics footprint survey solutions with wide application range including pipeline and platform inspections, bathymetric/sub-bottom/side scan surveys, post-hurricane inspection, UXO/MCM surveys, build and sub-bottom surveys, exploration and construction support [34].
It can be operated to a depth of less than 2m-1000m. It is compact and portable: less than 3m long, less than 120kg. Its modular construction means its sonar sensors, navigation modules and new battery modules can be added depending on mission requirements. Some of the additional sensors and options available are side scan sonar, swath bathymetry, camera, inertial navigation, obstacle avoidance. Several advantages of the Gavia AUV include its flexibility that allows it to perform all kinds of tasks, easy to transport and maintain, light weight for launch and recovery. It can also be upgraded. Normally, Gavia AUVs are operated using vessels of opportunity which is cost effective when compared to dedicated survey vessels, ROVs or large tow bodies [35].
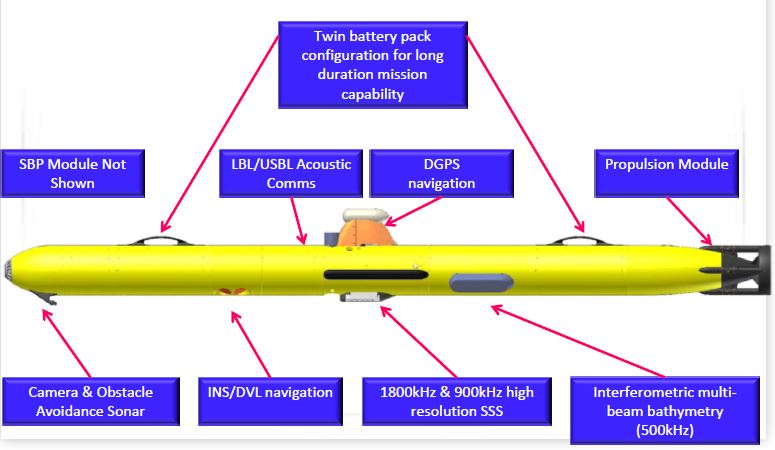
Figure 6 Gavia AUV
Using the support vessel MV Yardie Creek, well equipped for the inspection task, AUV was deployed from the stern in deeper water using winch and A-frame. For shallow water AUV was launched manually from RHIB. RHIB was sometimes used for recovery where AUV was lifted into custom chocks within RHB before being lifted by vessel crane to deck. Where the weather was adverse, AUV was towed to stern and placed in lifting crane for A-frame recovery.
A total operational man hours of 3408 using 27 days with an average of 45km AUV line survey daily. Average included non-productive time – weather, equipment downtime, calibrations and transits. In total 1142km of pipelines and 20 platforms were surveyed.
CASE STUDY 2: PIPELINE INSPECTION USING ROV IN SOUTHERN NORTH SEA (INTERMEDIATE WATER DEPTH OF 500 m)
Thousands of subsea pipelines across the globe are at depths divers cannot access. Inspecting such pipelines accurately from outside by means of ultrasonics have used to be challenge. Applying external automated ultrasonic inspection helps ensure that degradation is not occurring and if so the necessary measures are put in place. Accurately inspecting subsea pipelines presents a complex engineering challenge.
To tackle this challenge an automated ultrasonic inspection tool has been developed for deployment using a remotely operated vehicle (ROV) at depths beyond diver accessibility. This device, ROV-iT, is capable of reaching depths of 2000m.
The North Sea is known or its harsh weather and strong tidal currents in winter. The inspection was for a pipeline at 500m water depth using automated external ultrasonic inspection. BP required the service provider to perform a high resolution corrosion mapping of the full circumference of a 10 inch and a 12 inch pipeline of varying thicknesses of external fusion-bonded epoxy (FBE) coating. Time of Flight Diffraction (ToFD) inspection was also required on the pipelines in order to detect areas of degradation within welds and to identify the location of the internal polyethylene liner (it was feared damage may have occurred during installation).
CASE STUDY 3: INSPECTION OF OFFSHORE GAS PIPELINE IN THE BLACK SEA (DEEP WATER DEPTH OF 2150 m)
The Blue Stream gas pipeline transports natural gas from Russia to Turkey across the Black Sea with the capacity to transport 16 billion cubic metres a year. The system has gas pipelines of 1250 km consisting of a 56” pipe, 373 km long across Russia from Stavropol to Dzhubga belonging to Gazprom, two 24” pipelines, 380 km each, across the Black Sea from Dzhubga to Durusu station (Samsun); which is the joint venture between Gazprom & Eni (Blue Stream Pipeline Company-BSPC) and a 48” pipeline, 470 km pipeline linking up with pipeline networks at Ankara.
Blue Stream remains one of the most challenging projects ever done due to challenges in its design, construction, organisation and logistics.
The two offshore pipelines run from the Russian shore to the other side of the Black Sea at Turkey, connecting two continents and at a depth of 2150 m.
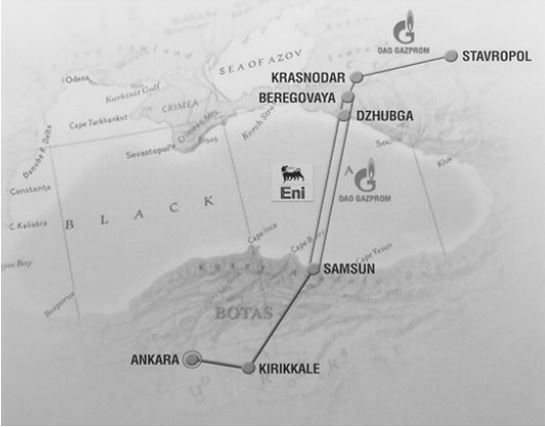
Figure 7 The Blue Stream Pipeline System
The project had the following requirements:
- Pipeline cleaning and proving – to keep pipeline clean prior to introduction of other inspection vehicles
- Caliper – to detect dents and ovalities in the pipeline over time
- Out-of-straightness survey – for detecting and measuring the strain events in the as-laid conditions and free spans
- Magnetic Flux Leakage (MFL) High Resolution Metal loss survey – to inspect for metal loss or corrosion
The inspection project was faced with the following challenges:
- Diameter: 24″ with reduced bore tees – diameter 505 mm (83% of outside diameter)
- Line lengths: 380 & 387 km
- Depth max.: 2,140 m (7,021’)
- Pressure: 250 bar (3,625 psi)
- Temperature: -10ºC to +55ºC
- 7D bends
- 32 mm wall thickness
- Ball valves
- Barred tees
- Buckle arrestors
- Internal epoxy coating
- Flow ~ 2.5m/s
Of particular challenge for the inspection was the fact that the pipeline was 2140m beneath the Black Sea, gas pressure at 250bar, wall pipe thickness of 35mm with local full bore forged tee of 505mm diameter.
Inspection program summary
- Pigs were launched in Russia from onshore and they travelled through the pipeline offshore for three days and were successfully received in Turkey.
- Entire 24” x 380km & 387km pipelines inspected
- Pigs were tracked from trap to trap using acoustic monitoring technique
- There was no need to use recovery pig since no tool was lodged in the pipeline
4. DISCUSSION/RESULTS
Different inspection techniques are applied for different inspection requirements.
4.1 CASE STUDY 1: KEY TO PRODUCTIVITY
For the first the service provider used two AUVs back-to-back. That is as one AUV was launched the other was being prepared for the next task with each mission lasting between 5 to 6 hours. Time spent for data download, battery change-out and INS re-alignment for single vehicle operations were reduced from more than two hours to less than an hour thereby increasing productivity. Increase in productivity covered for additional costs.
4.2 Data Processing
Upon successful completion of the project, the data gathered had to be processed and charts and reports produced for client. This was accomplished by the working together of data processors, geophysicists and charting experts.
The data processing work flow involved four iterative stages:
- Data Processing – Bathymetry
- Navigation processing to remove INS drift and surface swell artifacts
- Re-process Bathymetry Data. Process Side-scan Sonar data
- Perform Geophysical Interpretation
4.3 Data Presentation
- Areas that required further attention were identified from field reports identified areas of concern while still in the field.
- Based on reports produced so far critical freespans were identified and cross-checked against previous surveys.
- Fully processed data exported to Geographical Information System (GIS) for final QC checks.
- All data were placed in a single GIS as this allowed consistency checks prior to charting.
- Each event target is checked against the digital elevation model and the mosaics to ensure correct identification and position.
- Final report provided Pipeline Alignment Charts (plan view and pipeline events) and full Pipeline Events Listings (freespans, debris, sections of burial etc.)
4.4 Challenges and lessons learnt from the project
4.4.1 Challenges
Most pipelines ended at Varanus Island or the mainland. Therefore inspection had to be done very close to shore. But using the RHIB, inspection crew could come as near to shore as possible while vessel remained in deeper water. Inspection tasks were done during peaks of high tide with AUV running at half speed on surface. This allowed for high quality data to be collected in water depths of 2m and sometimes even in less than 1m.
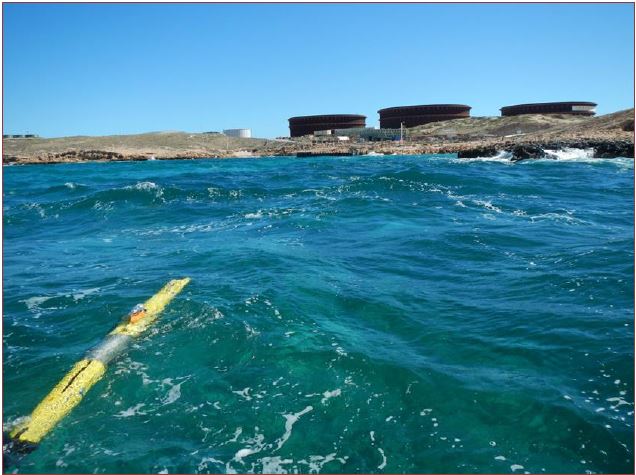
Figure 8 AUV near shore
4.4.2 Lessons
- AUV operations in very shallow water meant that 92% of all pipeline km were inspected.
- On a per kilometre basis AUV inspections are calculated to be less than 50% of the cost of an ROV inspection.
- AUV inspections greatly enhance subsea integrity management strategies.
4.5 CASE STUDY 2: PROJECT APPROACH
Inspection tasks are becoming more complex due to the complexity of the fields and offshore facilities being inspected. Service providers these days therefore develop custom tools specifically to meet the inspection requirements.
For this particular task, the tool had to be developed to handle the different diameters, the epoxy coating and the depth at which it was to be deployed. The tool was to undertake the inspection of both corrosion mapping and the ToFD on both diameters of pipe.
TOOL DEVELOPMENT PHASE
In developing the tool, the client (BP) provided some test samples representative of the field assets. Based on these the most appropriate probe technology was used. This helped to tackle the challenge of clamping the tool onto pipelines of varying diameters.
After the development phase the service provider ran some live tests to assure client of ability to perform the inspection.
INSPECTION PHASE
In December 2010 the inspection was successfully carried out. The FBE coating affected the ultrasonic responses but a range of approaches were developed to measure accurately the steel thickness despite the coatings. The methods were applied successfully giving confidence to the inspection results obtained.
4.4 Challenges and lessons learnt from the project
4.4.1 Challenges
- The difference in diameter and coating thickness of the pipes
- Water depth at which inspection was being done
- Space constraints on vessel meant only one system with spares could be mobilised
4.4.2 Lessons
ROV-deployed subsea inspection tools enable:
- pipeline inspections to be carried out at shallow depths in conditions that would be hazardous to divers
- pipeline inspections to be completed at greater depths than was possible previously
4.5 CASE STUDY 3: PROJECT APPROACH
Today inspections are not just down as soon as the operator contracts the services of an inspection company.
Once the contract has been given, the service provider will need to do a feasibility study to know the pipeline and operational specific features, and identify the technical risks involved in the project. For the Blue Stream pipeline inspection project these were the key challenges on the inspection system:
- Wall Thickness requirement of 32mm
- Reduced bore passing – to cater for thick wall transition at the tee near the receive trap
- Pressure 250bar
The operator however also had areas of concern that the inspection crew needed to take care of when running the tool within the pipeline.
- The key concern was that no tool was to remain lodged in the pipeline after the inspection process, any form of lodgement was unacceptable.
- No damage must come on the internal pipeline coating by the inspection tool throughout the inspection.
- The inspection tool must last the entire length (380km+ range) of the pipeline without any stoppages, failure or breakdown.
Based on the feasibility study, the service provider, PII, identified that its device 24-30” Multi Diameter Magnetic Flux Leakage Tool as the best tool for carrying out the inspection. Some developmental changes however needed to be performed on the tool to make it suitable for the project.
In designing the tool some challenges were encountered. Below are a summary of these challenges and how they were overcome.
4.6 CAD Simulation & Magnetic Modelling
In designing the MFL tool a big issue was how to saturate the pipe wall with enough magnetic flux in order to carry out the inspection. The bore passing and feature passing of the pipeline were simulated using 3D CAD to check for the magnetic saturation in the thick wall sections. Powerful earth magnets were used in the design of the tool using maximum volume space to achieve local full bore passing requirement of the thick wall tee.
* Pull Throughs required to verify top inspection speed for 32mm thickness inspection and static field measurements
| Pipe Diameter | PredictedMinWT/
mm (Inch) |
BSPCMinWT/
mm (Inch) |
PredictedMaxWT/
mm (Inch) |
BSPCMaxWT/
mm (Inch) |
| 24Inch | 13.70 (0.539) | 25.4 (1.000) | 38.10 ( 1.500) | 32.0 ( 1.260) |
4.7 Pipeline Inspection Data Analysis Software & Pipeline Sentencing
The water depth and the pressure of the gas inside the pipeline both exerted high pressures on the external surface of the pipeline, therefore pipeline sentencing was done so as to reflect the actual forces for any given depth. The data analysis software for the subsea network considered the external collapse pressures and internal process forces for the total length of the pipeline.
4.8 Pig Recovery Strategy
As per the client’s requirement, on no account was any tool to get stuck in the pipeline thereby blocking production flow.
Intelligent inspection systems are composed of several modules which house the magnetic module, front end processing data storage and power supply functions. To avoid the possibility of damaging the tool by disconnecting the rear modules close to the magnetic vehicle from the main inspection body, it is recommended that the tool be pushed from the back, preventing the tow couplings from jack knifing. The recovery pig was shown to be able to move in behind the stationary inspection tool and push the entire system along a test rig.
4.9 Location & Tracking
Electromagnetic transmitter was fixed on the pigging device while magnetic sensitive timer boxes were placed along specific sections of the onshore pipeline in order to detect the pig if it get stuck. A similar device was fixed on an ROV for the subsea pipeline. The position of the pig at any point in time could be tracked and monitored using acoustic monitors which were fitted at the Launch and Receiver sites.
4.10 Pipeline Pressure 250bar
The certified operational pressure for both liquid and gas is for MFL inspection systems is in the PII fleet is 220bar. For the BSPC pipeline, the tested and certified operational pressure for liquid pipelines only was 400bar. Tests were therefore carried out and successfully met the required 250bar operation pressure.
4.11 Pipeline Cleaning
Dust and debris removal were key to the success of the inspection, but all pig runs had to be done without affecting the internal pipeline coatings. The received cleaner had very small quantity of dust and debris considering the total length of pipeline. These were influenced by the quality of the gas and transportation process and the excellent construction of the pipeline.
4.12 Challenges and lessons learnt from the project
4.12.1 Challenges
Deploying the tool in one country and receiving it in another meant customs and local certifications had to be met. This required that local operating licenses and permits were obtained in order to import and operate the tools in both Russia and Turkey. Documentations had to be produced for both languages.
4.12.2 Lessons
- It takes the cooperation of all parties involved, operator and service provider, and other technical consultants for any inspection program to be carried out successfully.
- Today with the complexity of offshore pipelines and structures, and as oil and gas exploitation goes on in deeper waters, conventional inspection techniques cannot fully be depended upon to carry out successful inspections. Hence the combination of several inspection techniques at a time for offshore pipeline inspections.
- It can also be observed that each oil and gas field with its unique inspection requirements. Thus the new trend is that service providers can no longer just rely on inspection tools as built to carry out inspection tasks, but are beginning to see the need to redesign inspection tools which cater to the particular inspection requirements for each inspection project.
5. REFERENCES
1. Committee On The Safety Of Marine Pipelines. Improving the Safety of Marine Pipelines. Transportation Research. 1994. Available at: DOI:10.17226/2347
2. Na W-B., Kundu T. Underwater pipeline inspection using guided waves. Journal of Pressure Vessel Technology-Transactions of the Asme. 2002; 124(2): 196–200. Available at: DOI:10.1115/1.1466456
3. Giudice S Del. Acoustic Pipeline Monitoring: Theory and Technology. Politecnico Di Milano; 2014.
4. Golmohamadi M. Pipeline leak detection technology. Missouri University Of Science and Technology; 2015. Available at: http://scholarsmine.mst.edu/masters_theses/7397
5. PENG X-L. Condition Monitoring of Offshore Pipelines Using Vibration Based Methods by. The University of Western Australia; 2012.
6. Bai Y., Bai Q. Subsea Engineering Handbook. USA: Elsevier Inc.; 2012. 957 p.
7. Guo B., Song S., Ghalambor A., Lin TR. Offshore Pipelines Design, Installation, and Maintenance. Offshore Pipelines. 2014. 257-297 p. Available at: DOI:10.1016/B978-0-12-397949-0.00017-0
8. Jain RK. Pipeline Engineering: Protection Considerations, Course Note on Pipeline Engineering Module (Unpublished Course Note), Cranfield University. 2017.
9. Bai Y., Bai Q. Subsea Pipeline Integrity and Risk Management, 1st Edition. 2014.
10. Porter LK. A Handbook for Underwater Inspectors. Aberdeen: Orca Ltd; 1988. 518 p.
11. Palmer AC., King RA. Subsea Pipeline Engineering. 2008. 1-570 p. Available at: DOI:621.643
12. Peritus. Inspection Maintenance and Repair of Deepwater Pipelines. 2011; (September).
13. R. Winston Revie. Oil and Gas Pipeline: Integrity and Safety. R. WINSTON R (ed.) Hoboken, New Jersey: John Wiley & Sons, Inc.; 2015. Available at: DOI:10.1017/CBO9781107415324.004
14. Tiratsoo JNH. Pipeline Pigging Technology. 2nd Editio. Tiratsoo JNH (ed.) Houston, TX.: Gulf Professional Publishing; 1992.
15. Shi Y., Zhang C., Li R., Cai M., Jia G. Theory and Application of Magnetic Flux Leakage Pipeline Detection. Sensors. 2015; 15(12): 31036–31055. Available at: DOI:10.3390/s151229845
16. Lord W., Oswald D. Leakage field methods of defect detection. International Journal of Nondestructive Testing. 1972; 4(3): 249–274. Available at: https://scholar.google.co.uk/citations?view_op=view_citation&hl=en&user=O1zqMq4AAAAJ&cstart=20&pagesize=80&citation_for_view=O1zqMq4AAAAJ:kNdYIx-mwKoC (Accessed: 12 June 2017)
17. Akilla D. Analysis of Magnetic Flux Leakage Signals for Surface Defects in Coiled Tubing. University of Tulsa; 2004. Available at: https://books.google.co.uk/books/about/Analysis_of_Magnetic_Flux_Leakage_Signal.html?id=jsIrOAAACAAJ&redir_esc=y (Accessed: 12 June 2017)
18. Zhang Y., Ye Z., Wang C. A fast method for rectangular crack sizes reconstruction in magnetic flux leakage testing. NDT & E International. July 2009; 42(5): 369–375. Available at: DOI:10.1016/j.ndteint.2009.01.006 (Accessed: 13 June 2017)
19. Keshwani R. Analysis of Magnetic Flux Leakage Signals of Instrumented Pipeline Inspection Gauge Using Finite Element Method. IETE Journal of Research. 2009; 55(2): 73. Available at: DOI:10.4103/0377-2063.53238 (Accessed: 13 June 2017)
20. Shull PJ. Nondestructive Evaluation: Theory, Techniques, and Applications. Marcel Dekker, Inc; 2002. 869 p.
21. Ultrasonic Testing. Available at: https://eis.hu.edu.jo/ACUploads/10526/Ultrasonic Testing.pdf (Accessed: 14 June 2017)
22. W. Schmerr Jr L. FUNDAMENTALS OF ULTRASONIC NONDESTRUCTIVE EVALUATION. New York: Springer Science+Business Media New York; 1998. 563 p.
23. Manual Ultrasonic Testing – NDT inspection | TWI. Available at: http://www.twi-global.com/capabilities/integrity-management/non-destructive-testing/ndt-techniques/manual-ultrasonic-testing/ (Accessed: 14 June 2017)
24. Abdul Rahim R., Fazalul Rahiman MH., Nyap NW., San CK. On monitoring of liquid/gas flow using ultrasonic tomography. Jurnal Teknologi. 2004; 40(D): 77–88.
25. Nordin N., Idroas M., Zakaria Z., Ibrahim MN. Design and Fabrication of Ultrasonic Tomographic Instrumentation System for Inspecting Flaw on Pipeline. Procedia Manufacturing. Elsevier B.V.; 2015; 2(February): 313–318. Available at: DOI:10.1016/j.promfg.2015.07.055
26. Sonomatic. Sonomatic develops solution for subsea pipelines challenge. Available at: http://www.vsonomatic.com/index.php?page=news&objectid=364 (Accessed: 14 June 2017)
27. Gair G., Ferguson H., Jamieson J. Subsea Field Inspection of the Future. Offshore Technology Conference. 2014; (May): 5–8. Available at: DOI:10.4043/25239-MS
28. Hopkins P., Goodfellow UKG., Ellis UKR., Haswell UKJ., Jackson UKN., Grid N. UNDERSTANDING THE RESULTS OF AN INTELLIGENT PIG INSPECTION. Newcastle upon Tyne, UK;
29. Hughes B. GEOPIG Caliper Pipeline Inspection | Baker Hughes. Available at: https://www.bakerhughes.com/products-and-services/process-and-pipeline-services/pipeline-services/pipeline-inspection-services/geopig-caliper-pipeline-inspection (Accessed: 15 June 2017)
30. Srivastava M. Pigging In OIL INDUSTRY. 2012. Available at: https://www.slideshare.net/mansri123/pigging-in-oil-industry (Accessed: 17 June 2017)
31. ROSEN. ROSEN – RoGeo XT Service. Available at: http://www.rosen-group.com/global/solutions/services/service/rogeo-xt.html (Accessed: 17 June 2017)
32. ROSEN Group. ROSEN Group – Oil and Gas Pipeline Inspection Tools and Services – Offshore Technology. Available at: http://www.offshore-technology.com/contractors/pipeline_inspec/rosen/ (Accessed: 17 June 2017)
33. Production Facilities – Quadrant Energy. Available at: https://www.quadrantenergy.com.au/our-business/production-facilities/ (Accessed: 27 June 2017)
34. Teledyne Gavia – Low Logistics, Modular, Autonomous Underwater Vehicles for Subsea Survey – Offshore Technology. Available at: http://www.offshore-technology.com/contractors/hydrographic/teledyne-gavia/ (Accessed: 27 June 2017)
35. Teledyne Products | Autonomous Underwater Vehicles (AUVs). Available at: http://www.teledynemarine.com/autonomous-underwater-vehicles-auvs (Accessed: 27 June 2017)
Cite This Work
To export a reference to this article please select a referencing stye below:
Related Services
View all


Related Content
All TagsContent relating to: "Technology"
Technology can be described as the use of scientific and advanced knowledge to meet the requirements of humans. Technology is continuously developing, and is used in almost all aspects of life.
Related Articles

DMCA / Removal Request
If you are the original writer of this dissertation and no longer wish to have your work published on the UKDiss.com website then please: