The Interaction of Environmental Pollutants with Lungs Surfactant
Info: 27070 words (108 pages) Dissertation
Published: 16th Dec 2019
Tagged: Environmental Studies
Blank Page
TABLE OF CONTENTS
1.2. Discovery of Lung Surfactant
1.4. Overviews of the Effect of Particle Mater (PM)
2.1. Lung – Respiration Process
2.1.1. The Alveolar Stability and Laplace Equation
2.2. Composition of Pulmonary Surfactant
2.2.1. Function of Phospholipids
2.2.4. Hydrophobic Surfactant Proteins
2.2.4.1. Surfactant Protein B – SP-B
2.2.4.4. Surfactant Protein- SP- C
2.4. Diseases Associated with Ozone Exposure to Lung Surfactant
2.4.1. Neonatal Respiratory Distress Syndrome
2.4.2 Proposed treatment of NRDS
2.4.3. Acute Respiratory Distress Syndrome
2.4.4. Death and Hospital Admissions
2.4.5. Level of Ozone Pollution and Damage in the UK
2.5. Past studies on ozone pollution and the Lungs
2.6. Project aims and Objectives
2.7. Techniques for Study the Lung Surfactant
2.7.1. Langmuir-Wilhelmy surface Balance / Langmuir Though
2.7.2. Polyacrylamide Gel Electrophoresis (PAGE)
2.7.3. High-Performance Liquid Chromatography (HPLC)
3.1. Schematic Model of the Langmuir Trough
3.3. Experimental Analysis and Extraction Procedure
3.3.1. Monolayer Isotherm Determination – General Procedure
3.3.2. Cholesterol Sample Analysis
3.3.3. Lungs Surfactant Analysis
3.3.4. Lung Surfactant Extraction Procedure
3.3.5. Hydrophobic Component Extraction Process
3.3.6. Organic Solution Analysis using the SDS-PAGE Clean Kit
3.3.7. SDS-PAGE Protocol for Protein Analysis
3.3.7.1. Resolving Gel Preparation
3.4.1. Gel Electrophoresis Loading Procedure
3.4.2. Visualising the Gel, Under the White/UV Transilluminator Light
3.4.3. Washing Procedure of the Gel
3.5. Analysis of Extracted Surfactant Sample using the Langmuir Trough
3.5.1. Surfactant Exposed to Oxygen
3.5.2. Surfactant Exposure to Ozone
3.5.3. DPPC surface pressure measurement
3.6.1. UV-Vis Analysis of Extracted Lung Surfactant
4.1. First Part- Evaluating Lab Technique
4.1.1. Isotherm of Cholesterol
4.2. Second Part – General Concept of the Present Study
4.3. Gel Electrophoresis SDS-PAGE
4.4.1. Isotherm of Extracted Lung Surfactant
4.4.2. Isotherm of DPPC and the Extracted Lung Surfactant
4.5. Lung Surfactant Exposed to Oxygen and low level ozone 0.1ppm
DPPC exposed to Oxygen and Extracted lung surfactant exposed to Oxygen
4.7.1. UV-VIS of the HPLC sample
Blank Page
LISTE OF FIGURES
Figure1: Process of respiration
Figure3: Laplace equation. This image illustrates the law underlining the Young-Laplace equation.
Figure5: The two phases – hydrophilic and hydrophobic.
Figure6: The composition of lung surfactant.
Figure7: Phospholipids present in the lung surfactant. .
Figure9: Cholesterol Structure
Figure10: 3D models of surfactant protein SP-B, SP-C, SP-A, and SP-D.
Figure11: Mechanism of SP-C and SP-B during the process of respiration.
Figure12: Pulmonary surfactant SP-B,
Figure13: SP-B native protein structure
Figure14: Process step formation of mature SP-B.
Figure16: The chemical structured of surfactant protein SP-C.
Figure17: Amino acid of SP-C. UniProtKB – P15785 (PSPC_PIG), and UniProtKB – P11686 (PSPC_HUMAN).
Figure18: ozone formation and the mechanism reaction of ozone formation.
Figure19: Ozone concentration in the UK in ppb.
Figure21: Ozonation formation of plasmalogen reaction..
Figure22: Langmuir Wilhelm plate..
Figure 23: Schematic diagram of the Langmuir trough.
Figure 25: Langmuir trough – Determination of monolayer barriers calibration
Figure26: Bronchioles and the addition of saline.
Figure27: Separation of the supernatants and solid residues after centrifugation.
Figure 42: DPPC analysed on reverse phase HPLC
Blank Page
LISTE OF TABLES
Table 1: List of reagents used for the analysis of the lung surfactant
Table 2: Reverse phase HPLC analysis condition.
Table 3: Normal phase HPLC analysis run condition.
ABSTRACT
The pulmonary surfactant is constituted of a mixture of phospholipids and proteins, which is require to reduce the alveolar surface tension at the air-lung interface for preventing the collapse of the alveolar, to maintain a normal breathing mechanism. The exposure of lung surfactant to ozone pollution has been linked to several pulmonary pathologies; which may link to fatal respiratory diseases, and respiratory death. The present study aims to contribute to the study of the effect of ozone to the lung surfactant; more precisely, the effect of lung surfactant exposure to diluted level of ozone at the air-water interface. A fresh pig lung was treated by lung lavage method, the extracted product from the lung was analysed by means of the SDS-PACE gel electrophoresis experiment and compare with the protein ladder solution. The SDS-PAGE revealed three bands at SP-B at 20kDa, and 15 kDa and SP-C at 4.5kDa. An isotherm of the DPPC and extracted lung surfactant was successfully produced. The DPPC collapse at 60 mN m-1, and the extracted lung surfactant isotherm collapse at a surface pressure 45 mN m-1. The monolayer of DPPC and extracted liquid from the lung exposed at the air water interface on the Langmuir trough to oxygen for a reaction times of 5 hours resulted a drop in surface pressure from 30mN m-1 to 18mN m-1 over a period of 5 hours. The ozone exposure for 1 hours follows by ozone 0.1ppm in oxygen for a reaction times of 4 hours revealed an initial increase in surface pressure as the ozone was turned on, this can be an indicator of the oxidising damage of the lung surfactant. Additionally, UV-Vis analysis performed with the AvantiPolarLipid method revealed a change in the absorbance upon ozone exposure to the martial recovered from the trough. This is expected to be as a results of Lipid peroxidation (LPO).The sample was further analysed under reverse phase HPLC and normal phase HPLC, however the analysis was unsuccessful, this can be as results of the in-sensitivity of the UV-detection, and the lack of double bonds in the molecule.
Blank Page
NOMENCLATURE
– Acronyms
ACN Acetonitrile
AFM Atomic force microscopy
ALI Acute lung injury
ARDS Acute respiratory distress syndrome
CO Carbon monoxide
Chol Cholesterol
DPPC Dipalmitoylphosphatidylcholine
EPA Environmental protection agency
FEV1 Forced Expiratory Volume in the first second
HMD Hyaline membrane disease
HPLC High performance liquid chromatography
LC/MS Liquid chromatography-mass spectrometry
RDS Respiratory distress syndrome
RH Hydrocarbon
PAGE Polyacrylamide Gel Electrophoresis
TBS tris-buffered saline
TFE Trifluorethanol
POZ Primary ozonide
ppb Part per billion
ppm Part per million
PM Particle mater
POPC Palmitoyloleoyl-PC
PPPC Palmitoylpalmitoleoyl-PC
PC Phosphotidylcholine
PGs Phosphatidylglycerol
PS Phosphatidylserine
PA Phosphatidic Acid
PE Phosphatidylethanolamine
PI Phosphatidylinositol
PMC Palmitoylmirystoyl
SP-A Surfactant protein A
SP-B Surfactant protein B
SP-C Surfactant protein C
SP-D Surfactant protein D
SFG Sum frequency generation
SM Sphingomyelin
– Symbols
O2 Oxygen
O3 Ozone
P Pressure
RS Small radii
RL Large radii
T Temperature
t Time
Vol Volume
Π Surface pressure
γ Surface tension
∆ Pressure difference
0C Degree Celsius
Blank Page
I. INTRODUCTION
The study of respiratory diseases has gradually increased in recent years. Air pollution is becoming one of the major problems affecting human’s health. Scientists and researchers have focused their interest on the epidemiological studies related to lungs failure and pollution. These studies have proved a correlation between the level of particle concentrations with fatal respiratory diseases, the increase in the hospital admissions and the increase in patients’ respiratory death. (Jerrett et al., 2009), (Parra and Pérez-Gil, 2015) However the effect of long-term exposure to ozone air pollution remains uncertain.
1.2. Discovery of Lung Surfactant
The importance of the pulmonary surfactant was established from the discovery of the relationship between the volume and pressure of isolated lungs. In 1929, Neergard, a Swedish physiologist, determined that the discovery substance as pulmonary surfactant. (Aly, Mohamed and Wung, 2017). The pulmonary surfactant substance was determined to prevent the collapse of alveolar, which results in the decrease in surface tension at the pulmonary air-liquid interface. (Halliday, 2008), (Bernhard, 2016).
Later, Neergard discovery was furthermore acknowledged by Gruenwald in 1947. The study focused on the lung of stillborn infants as a result of lungs failure. Gruenwald assumptions were based on the measurement of the pressure required to inflate the lungs of deceased newborns. Moreover, Gruenwald stated that the resistance to ventilation is produced by the surface tension neutralizing the entrance of air. At a later stage, Gruenwald demonstrated that the surface active substances result in a decrease in the pressure needed for lung aeration. (Halliday, 2008)
In 1950s Pattle, Clements, and Macklin focused their research on the effect of nerve gas on the lung. This work played a great contribution to the understanding of the physiology of pulmonary surfactant. The study focus was on the nerve gases causes of pulmonary edema foam in the rabbits. Later, Pattle concludes that the air bubbles must be covered with a unique substance from the lining layers of the alveoli to promote the stability of the alveoli. (Veldhuizen et al., 1998)
Further discoveries on the lung failure affecting new-born babies were established in 1959 by Avery and Mead. Hyaline Membrane Disease (HMD) is a type of respiratory distress syndrome (RDS) which is a result of infants’ death due to deficiency of pulmonary surfactant. The RDS affect babies born with immature lung or aspiration of fibrin-rich materials. (Goldberg, Allen and Sahn, 1974), (Halliday, 2008)
The work of Neergard was additional developed by researchers such as Buckingham and Avery 1962; and Klaus et al.1962, were able to establish the clinical importance of the discovered substance in several patients. This substance was determined according to it biochemical state correlating to other phospholipids and originating from the type-II-pneumocyte. The type-II-pneumocyte are small cell which are located on thick elastic fibers which formed the main structural framework lining the alveoli in the lung, as shown in Figure 2.1. Moreover, Type-II-pneumocyte are capable of replication, they are responsibility for the production and secretion of surfactant.(Honda et al., 2000). The discovery of this unique substance known as lung surfactant incited the interest of researchers, in the objective to discover its functions, metabolism, and compositions. Under normal conditions, the surface-active material produces a surface tension of around 8 mN m–1. However, in babies suffering from hyaline membrane disease, the surface tension was over 30 mN m–1(Lopez-Rodriguez and Pérez-Gil, 2014).
1.3. Lung Development
The lungs are developed from the embryo at 20th week’s gestation and continue to further develop to an early childhood. The types II cell containing lamellar bodies start to appear at 20th to 24th week’s gestation. The pulmonary surfactant begins to develop at a late stage before birth between 29th and 32nd weeks gestation.(Smith et al., 2010) it is still unclear when the lungs end is development. The author further mentioned what it is known is that premature birth interrupts the surfactant system to be fully developed. Babies born prematurely require assistance with their birthing, to promote the lung maturing. In severe cases of premature lungs development, the most preterm infant may develop a condition known as Bronchopulmonary Dysplasia. (Smith et al., 2010)
daily average concentrations of O
3
between
10:00
A.M. and 6:00 P.M. were found to be significantly associ-
ated with daily sample means of FEV
1
and FEF
25–75
during the
period from May to September.
daily average concentrations of O
3
between
10:00
A.M. and 6:00 P.M. were found to be significantly associ-
ated with daily sample means of FEV
1
and FEF
25–75
during the
period from May to September.
daily average concentrations of O
3
between
10:00
A.M. and 6:00 P.M. were found to be significantly associ-
ated with daily sample means of FEV
1
and FEF
25–75
during the
period from May to September.
2.1. Lung – Respiration Process
The mammalian respiration system is a process known as ventilation. The mechanism of respiration consists of a series of respiratory passages. The inspiration process occurs as the oxygen from the atmosphere is taken through the nose and down to the pharynx, and the reaches the larynx where it gets to the trachea.(Barrow, 2017). The trachea is divided into two bronchi and decreases in diameter up to 200 μm approximately with a wall thickness of up to 0.1–0.4 μm and further into two more tubes resulting in 1-8 million terminal tubes consisting of terminal sacs known as alveoli. (Hidalgo, Cruz and Pérez-Gil, 2017). The alveolus is where the gas exchange mediates through an air and water interface. Hence the excretion of carbon dioxide and waste product of cell metabolism are taken out of the body into the atmosphere and oxygen is taken up. (Barrow, 2017), (Parra and Pérez-Gil, 2015). This process can be characterized as respiration as shown in Figure 1.
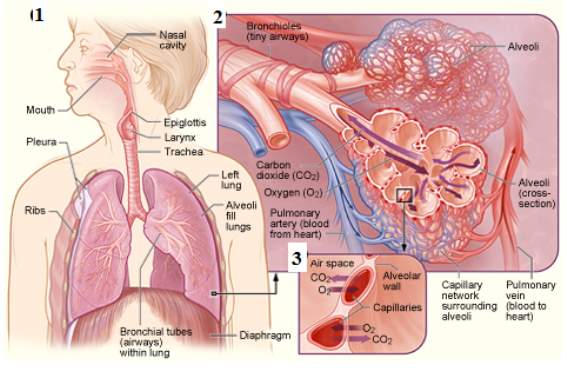
Figure1: Process of respiration, this image represents the process taking place during respiration 1, the alveolar airways, the air sacs of the alveoli, and tiny blood vessels – the oxygen is moving inside the alveoli sacs, while the carbon dioxide is moving out of the alveoli 2 and a close-up view where the gas exchange takes place between the capillaries and alveoli 3. (NIH)
During the process of inspiration, the lungs get stretched. There is a build-up of pressure causing the expansion of the chest wall. This increases the pressure gradient between the pleural cavity space and in the alveoli. As a results a negative pressure gradient is creates. (Barrow, 2017). The liquid present is lung alveolar known as surfactant fluid introduced in section 1.2 is to decrease the surface tension at the air-liquid interface in order to facilitate the expansion of the lungs. (Smith et al., 2010). Moreover, the roles of the pulmonary surfactants are to help maintain a healthy breathing, to acts as a defence mechanism against pathogens and to prevent the collapse of the alveolar. The physiological studies proves that the surfactant film forms rapidly; and secondly when compressed by the decreasing alveolar area during exhalation, the surfactant film reduces the alveolar surface tension to an extremely low value ~ 0 mN m–1. Consequently, the adsorbed film resists the tendency to collapse. (Rugonyia, Biswasb and Hallc, 2009), (Lee, 2008).
The lung surfactant is located in the lung terminal air spaces known as alveoli, as shown in Figure 2.1. The alveolar collapse may occur when the alveolar surface tension fails to decrease during exhalation while the surface area of the alveolar is reduced. Therefore, the increase in pressure from the surface tension will demand more energy to inflate the lung leaving the alveolar at a great risk of collapsing. Additionally, the alveolar is at risk to collapse in the obscene of surfactant, when the water molecules alone lined in each alveolus hence the surface tension increases within the lung. Therefore, a high pressure is required to inflate the lungs. Refer to Figure 2.2.
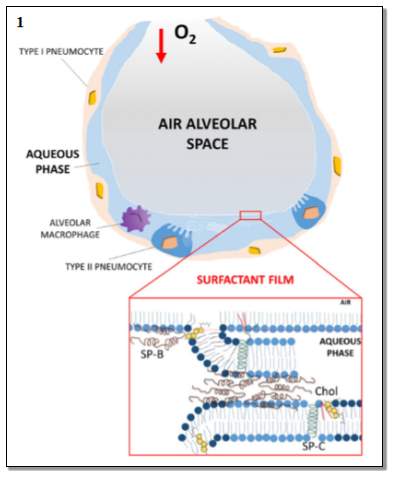
Figure2.1: The normal alveolus. This image represents the healthy alveolar at the normal level of lung surfactant. The oxygen is taken into the alveolar airspace. Also, the Figure represents the details of the surfactant film- representing the arrangement of the surfactant SP-B and SP-C and cholesterol on the phospholipids layers. Image taken from (Echaide et al., 2017)
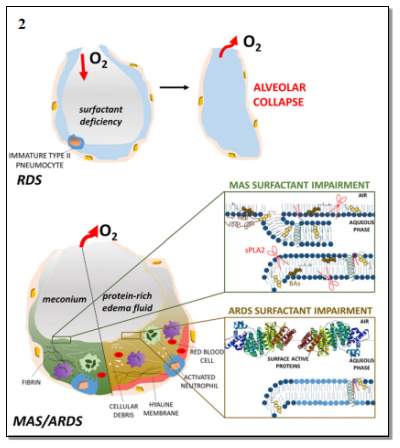
Figure 2.2: The pathological of the lung. This image illustrates the consequences of the surfactant deficiency, leading to the collapse of the alveolar and the impairment of the surfactant causes of RDS and ARDS (acute respiratory distress syndrome). The Figure represents how the surfactant deficiency into the alveolar result to the alveolar collapse. Image taken from (Echaide et al., 2017)
2.1.1. The Alveolar Stability and Laplace Equation
The cycle of respiration can be explained from Laplace equation. Pierre –Simon (Marquis de) Laplace was a French mathematician, physicist, and astronomer. In 1805, Pierre Simon and the physicist Thomas Young recognized the correlation between the surface tension – γ , Rs is the radius of a small sphere, RL the radius of a large sphere and the collapse pressure – P. as shown in Figure 3.This relation was described using Equation 1.
PS-PO=2γSRS and PL-PO=2γLRL1
PS =PL, γS/RS = γL/RL
(2)
γ ~ R ~ A1/2 (3)
Π≡ γairwater- γ~ const. -A12(4)
Equation 1: (1), (2) represent the relationship that the surface tension is proportional to the square root of the alveoli area. If considering the two radii to be equal,(3), the surface tension through the use of the new variable surface pressure (Π) that can be plotted as a characteristic isotherm by taking the difference between the surface tension of a pure air/ water interface and the square root of alveolar area (4). Equation taken from (Arick et al., 2015)
The relationship between the volume and the pressure strongly depends on the surface tension. It is important to maintain a lower surface tension at the end of a respiration cycle. Hence upon lateral compression of the alveolus, the surface tension drops to approximately 0mN m-1. Though during the inspiration process, the surface tension must reach a maximum volume of 30 mN m–1.(Echaide et al., 2017) .The drop in the surface tension results in the increase in the surface pressure – Π of the surfactant, as the surface pressure can be defined as the amount by which the surface tension is lowered by the surfactant film. The higher surface pressure means that the surfactants are covering the air-liquid interface throughout the lung.
The surface pressure can be defined mathematically as
π=0 -γ
0
Represent the surface tension of the pure liquid sub-phase in the absence of surfactant, and γ represent the surface tension in the presence of the surfactant film. Both surface pressure and the surface tension are measure with the same units; however, they vary in opposite directions, which means, the higher surface pressure is proportional to the lower surface tension. And this applies vice versa. In case of water or the physiological saline, the
γ0
is approximately 70 Mn m-1 at 37 °C, meaning the surfactant films on a sub-phase of water or saline produce a result between
π
0 mNm-1 and 70 mNm-1. Therefore, when π = 0 mNm-1, meaning that no reduction in surface tension was obtained. This is a condition that occurs in the case of lower level of surfactant concentration. Moreover, π =
γ0
means that there is a drop in the surface tension to 0 mNm-1 resulted by the surfactant film. The high surface pressure/ lower surface tension generally occur, when the surfactant film is rapidly compressed to high surface concentration.
.
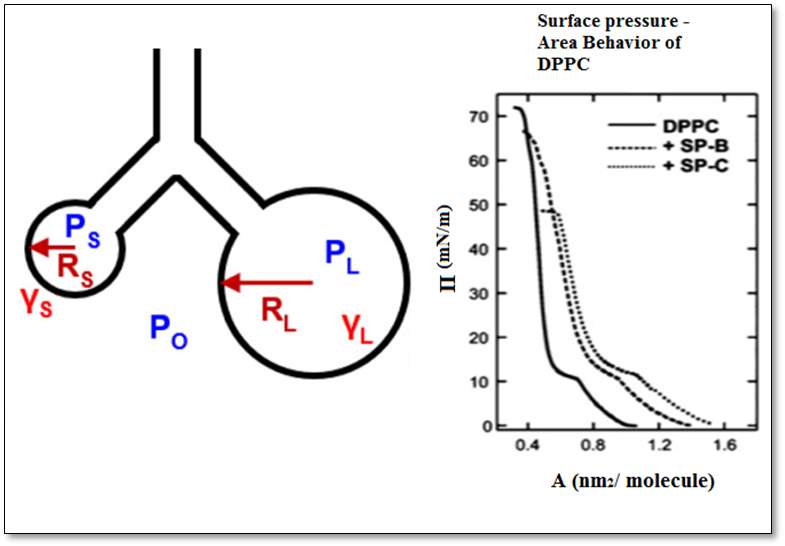
Figure3: Laplace equation. This image illustrates the law underlining the Young-Laplace equation. The two circles represent the different size of the alveolus, the symbols – the surface tension – γ and the radii of a sphere – Rs and RL, and the collapse pressure Ps and PL. The graphs of the DPPC, SP-B, and SP-B represent the correlation between the areas per molecule with the surface pressure.(Arick et al., 2015)
2.1.2. Lung Surfactant
The pulmonary surfactant is constituted of a mixture of phospholipids and proteins. The pulmonary surfactant is a proteo-lipidic material synthesized by cell types forming by alveolar epithelium, known as type II pneumocytes. And it is assembled as tightly packed lipid bilayers stored in lamellar bodies, prior to be secreted by exocytosis into the alveolus. As shown in Figure 4.(Cruz, Casals and Perez-gil, 1995) The pulmonary surfactant molecules consist of two parts which are polar hydrophilic head and non-polar hydrophobic tail, known as amphiphilic molecules. Therefore, the surfactant contains both a water-insoluble component or oil-soluble and a water-soluble component. This polar and non-polar structure allows the surfactant to reduce the interfacial energy between the two phases, as shown in Figure 4 and 5.
Moreover, surfactant plays an important role in preventing the respiration dysfunctions and the lack or deficiency of surfactant which results to critical lungs pathologies.(Serrano and Pérez-Gil, 2006). Furthermore, the pulmonary tissue has a passive elastic and mechanical property of the surfactant membrane. This is of great importance as it maintains the stability of the alveolar.
.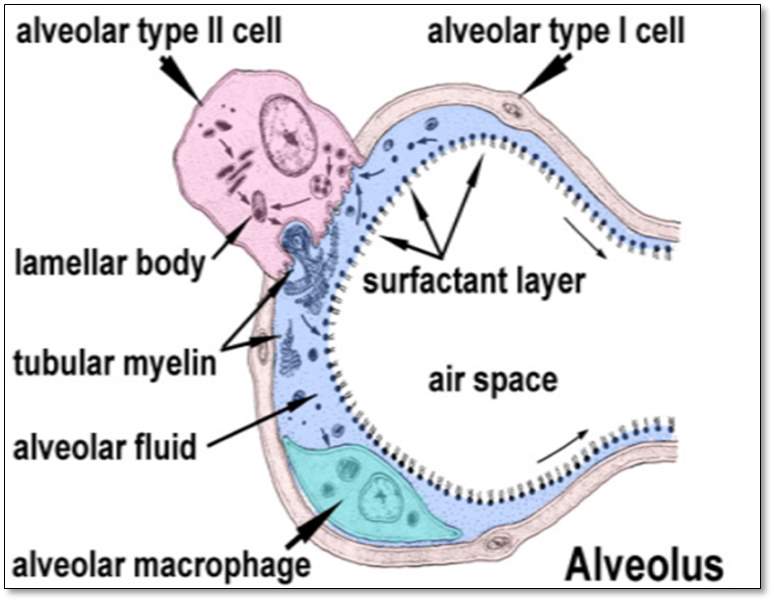
Figure4: The Alveolus. This represents the structure of the alveolus: the alveolar type II cell, the alveolar type I cell, the lamellar body, the tubular myelin, the alveolar fluid, the alveolar macrophage, the surfactant layer, and the airspace. (Arick et al., 2015)
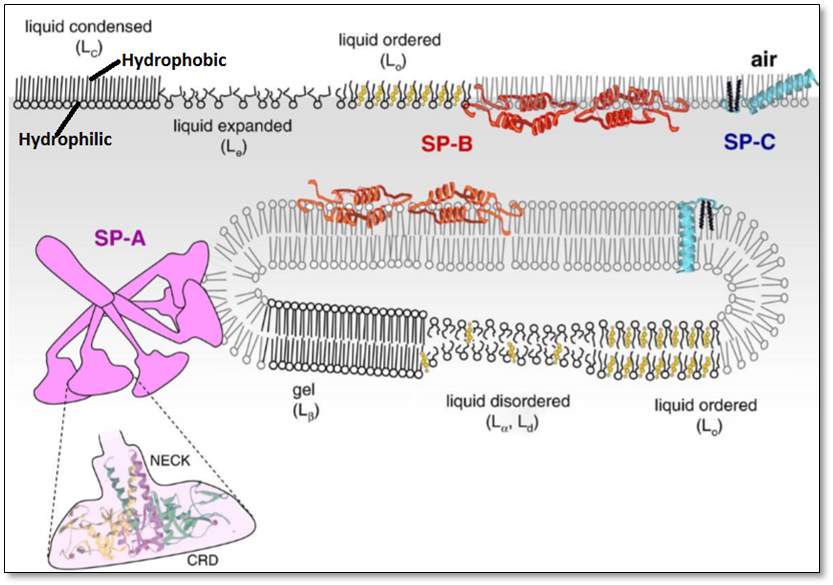
Figure5: The two parts hydrophilic and hydrophobic – of a lipid, indicated top left. This figure represents the hydrophobic tail and the hydrophilic head, of a lipid, the orientation of the surfactant proteins SP-A, SP-B, and SP-C attached to the lipids, the orientation of lipid disordered. Moreover, the figure represents the lipids arranged in an orderly many as well as in a disorderly manner. Image taken from insert space and remove brackets (Pérez-Gil, 2008)
2.2. Composition of Pulmonary Surfactant
The composition of pulmonary surfactant depends on the type of species and can vary within individual of the same species.(Serrano and Pérez-Gil, 2006). However, in all organisms with lung surfactant, the surfactants are generally composed of approximately 90% lipids and 8 to 10% of proteins. In mammalian surfactant, the 90% lipids are mainly phospholipids.(Serrano and Pérez-Gil, 2006),(Parra et al., 2013).The neutral lipid; cholesterol account for 5-10% of the total lipid; a mono-acylglycerol, diacylglycerol, and tri-acylglycerol. 8-10% proteins where two are the hydrophilic proteins SP-A and SP-D and two are hydrophilic proteins SP-B and SP-C, as shown in Figure 6. (Serrano and Pérez-Gil, 2006)
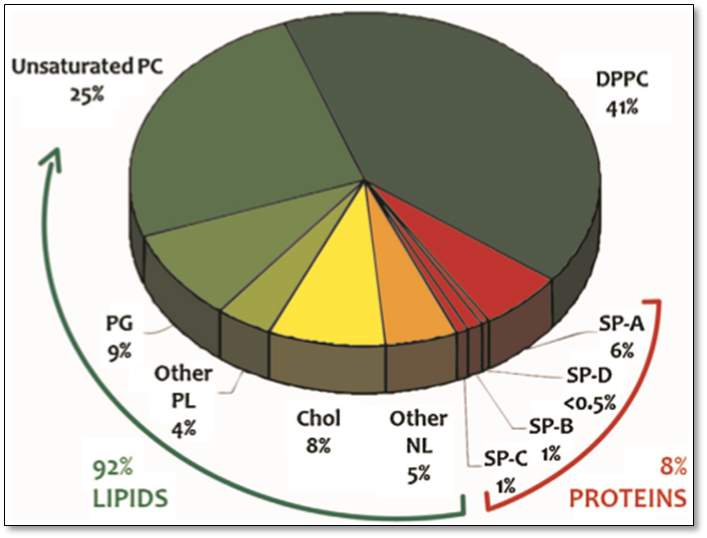
Figure6: The composition of lung surfactant. This pie chart represents the percentage composition of the lung surfactant, with 92% lipids where 41% is for the DPPC, 25% for the unsaturated PC and the rest account for the 9% PG, 4% for other PL, 8% for the Cholesterol, and 5% for other NL. The remaining 8 % describe the total percentage of the pulmonary surfactant proteins – SP-A 6%, SP-D <0.5%, SP-B 1% and SP-C 1%. Taken from(Parra and Pérez-Gil, 2015)
2.2.1. Function of Phospholipids
Phospholipids are the main component of the lung surfactants; they are amphipathic molecules. Below is the list of lipids present in the lung surfactant.(Lopez-Rodriguez and Pérez-Gil, 2014) Refer to Figure 7.
- Saturated Phospholipids – for example Dipalmitoylphosphatidylcholine (DPPC)
- Unsaturated Phospholipids – for examplePalmitoyloleoyl-PC (POPC) and Palmitoylpalmitoleoyl-PC (PPPC)
- Anionic phospholipids – Phosphatidylglycerol (PGs), Phosphatidylserine (PS) and Phosphatidylinositol (PI)
- Anionic lipid palmitoylmirystoyl (PMC), such as Phosphatidic Acid (PA)
- Manor component of surfactant of the human phosphatidylethanolamine (PE) and sphingomyelin (SM)
- Other neutral lipids – cholesterol esters, triglycerides, diglycerides, and free fatty acids.
This figure represents the different types of phospholipids present in the lung surfactant.
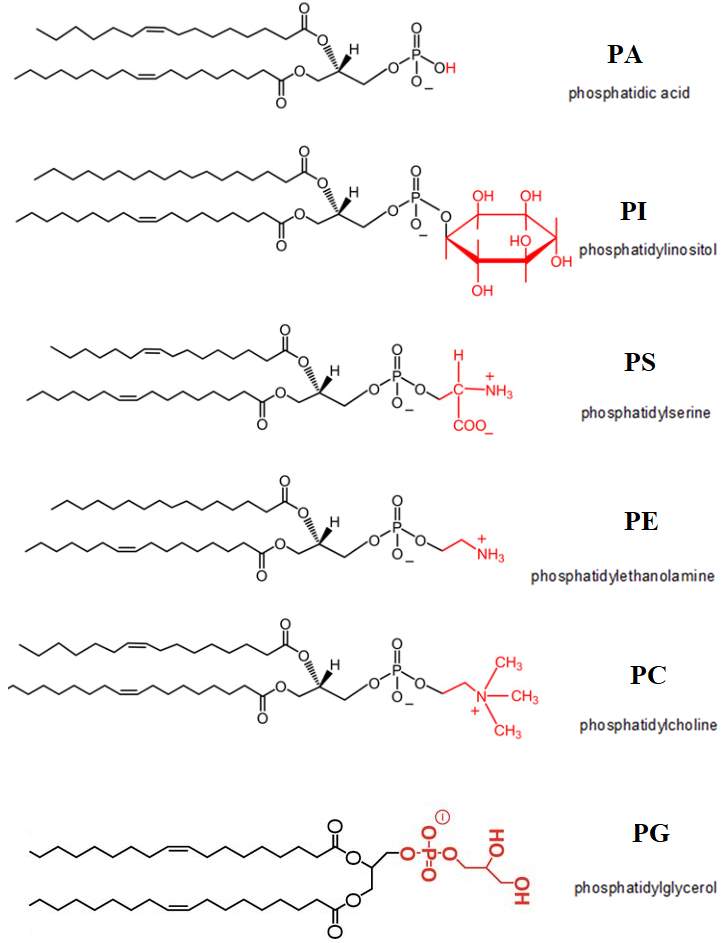
Figure7: Phospholipids present in the lung surfactant. Modified structure taken from(Henry, Kohlwein and Carman, 2012)
One of the examples of the saturated phospholipids present in the lung surfactant is the (DPPC). 1,2-dipalmitoyl-sn-lycero-3-phosphocholine.Refer to Figure 8 for the structure of DPPC. DPPC was initially discovered in 1946, in the lung tissue.(Veldhuizen et al., 1998).DPPC is the most abundant phospholipids present in the lung surfactant, it is synthesised in the endoplasmic reticulum or by remodelling in lamellar bodies. DPPC plays a part of role for the objective to achieve minimal surface tension values at the interface. (Olmeda, Martínez-Calle and Pérez-Gil, 2017). DPPC can reach a surface tension near 0 mN m−1 during compression, (Lee, 2008), the surface pressure–area isotherm of a pure DPPC monolayer on an aqueous sub-phase have a low probability of collapsing until the surface pressure extend approximately 70 mN m–1.(Sheridan et al., 2017)
The PG accounts for the second main surfactant phospholipids species; POPG is the most abundant species of PG. PG has the role to regulate the innate immunity in the lung. Additionally, the deficiency of the PG correlates with the characteristic of diseases which display an underlying inflammation as well as lung injury. (Olmeda, Martínez-Calle and Pérez-Gil, 2017)
The presence of unsaturated lipids in lung surfactant plays a significant role for proper respiratory function; one of the examples of the unsaturated lipid which has been intensively studied by several numbers of researchers is the POPC. It was reported by (Waring et al., 2016) that the exposure of mixed monolayer composed of POPC and DPPC to ozone results a significant oxidative damage of the unsaturated POPC caused from the secondary oxidation reaction. However, the ozone exposure did not react directly with DPPC, no loss of DPPC from the air-water interface was recorded. Refer to Figure 8 for the structure of unsaturated POPC.
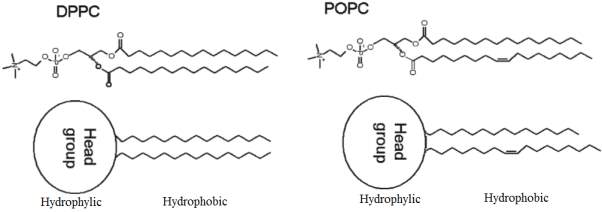
Figure8: The chemical structure of DPPC and POPC phospholipids. Modified Figure from(Thompson et al., 2010)the hydrophilic head and the hydrophobic tail of the DPPC- 1,2-dipalmitoyl-snglycero-3-phosphocholine saturated lipid and POPC 1-palmitoyl-2-oleoyl-sn-glycero-3-phosphocholine unsaturated lipid can be distinguished.
2.2.2. Cholesterol
Cholesterol is one of the most abundant substances of the neutral lipid present in pulmonary surfactant at the air-liquid interface.(Echaide et al., 2017)Cholesterol is a slightly amphipathic molecule. Cholesterol is physiologically present in mammalian natural surfactant. The content range of cholesterol is usually from 5% to 10%of the total percentage of the pulmonary surfactant. Cholesterol is normally synthesized inside the type II pneumocytes by the circulating low – density lipoproteins and high-density lipoproteins through the lung,(Gunasekara et al., 2005) as shown in Figure 4. Refer to Figure 9 for the structure of cholesterol.
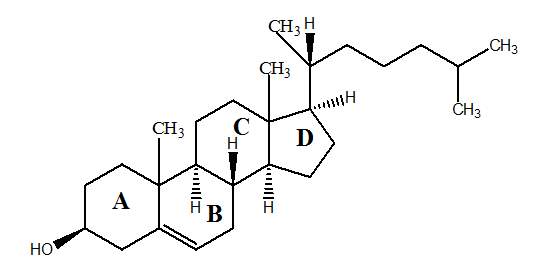
Figure9: Cholesterol Structure. Adapted from (Dabkowska et al., 2012)
The cholesterol plays an important role to maintain proper structure and dynamics of surfactant membranes. Moreover, the molecular structure of cholesterol makes cholesterol to have a high contribution in regard to stabilising and fluidizinglipid monolayer and bilayers.(Malcharek et al., 2005). Therefore, the molecules of cholesterol has attracted the attention of several researchers, in order to understand the importance and role of the cholesterol in relation to the surfactant proteins,more precisely in regards to the effects of cholesterol on surfactant membrane structure and interfacial function,as reported by (Echaide et al., 2017).Despite numerous studies done in the past on cholesterol, the precise physiological role of the cholesterol remains controversial, as reported by(Gunasekara et al., 2005), (Echaide et al., 2017).
Considerable numbers of studies have demonstrated how an excess of cholesterol has negative effects on surfactant membrane capabilities to reach low surface tension values. (Echaide et al., 2017) focused their study on the interaction that takes place between the cholesterol and surfactant protein in the lung surfactants membrane. The authors reported 5% of the cholesterol sample in the lipid-protein significantly impaired the ability of lipid-protein complexes containing only SP-B to rapidly reach low surface tensions.
Moreover, the excess proportion of cholesterol in surfactant may worsen different respiratory pathologies conditions, such as the acute respiratory distress syndrome (ARDS). However, there is still a gap of knowledge on the cause of excess cholesterol leading to surfactant function impairment which occurs in severe cases of lung injury.
Researchers have focus their interest in the study regarding the oxidation of lipids within the surfactant, this was reported by (Wynalda and Murphy, 2010). The authors based their work on the in vitro and in vivo study of ozone inducing oxidation of cholesterol. This study results to the products such as 5β, 6β epoxy cholesterol. 5β, 6β epoxy is known to be the cause of necrosis in bronchial epithelial cell lines. Additionally, the second reported product of surfactant oxidation is identified as1-hexadecanoyl-2-nonanal-PC, which is recognised to initiate apoptosis of peripheral monocytes at low nM concentrations. Reported by (Wynalda and Murphy, 2010).
2.2.3. Surfactant Proteins
There are four types of surfactant proteins SP-A, SP-D and SP-B, SP-C. Each surfactant proteins have a unique shape and differ in their functions. The surfactant protein SP-A, SP-D are hydrophilic, important components of the antibody, they have the function to act as part of a defence mechanism, to prevent the lungs injuries from inhaled unwanted particles. Refer to Figure 10 (Mason, Greene and Voelker, 1998). The surfactant proteins SP-B, SP-C hydrophobic are responsible to prevent the collapse of the alveolar. However, no further details on the SP-A and SP-D are discussed in the present study, as these surfactants are outside the scope of the present study.
The Figure below illustrates the difference in shapes between the hydrophobic surfactant proteins SP-B and SP-C with the hydrophilic surfactant proteins surfactant SP-A and SP-D.
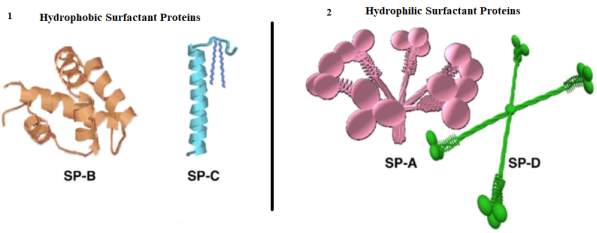
Figure10: 3D models of surfactant protein SP-B, SP-C, SP-A, and SP-D. (Baoukina)
2.2.4. Hydrophobic Surfactant Proteins
The hydrophobic protein surfactant was acknowledged after the late seventies. The discovery was based on the capacity of the protein solubility in ether and ethanol. The separation of the hydrophobic protein was achieved by the gel filtration on Sephadex LH-60 in an acidified aqueous organic solvent to determine the presence of protein-surfactant B and C (SP-C and SP-B). The acetonitrile (ACN) and trifluorethanol (TFE) are the two solvent mostly use to study the structure of hydrophobic pulmonary surfactant SP-B and SP-C. The acetonitrile (ACN)/water and trifluorethanol (TFE)/water mixtures solvents results a stable conformation of SP-B. A solution with 70% TFE shows approximately 40% SP-B α-helix, whereas a solvent mixture containing over 70% TFE results the percent of α-helix in SP-B up to 60%. (Cruz, Casals and Perez-gil, 1995).
Surfactant protein SP-B and SP-C plays a key role to facilitate the dynamic behaviour of the surfactant for the breathing mechanism. During the process of exhalation, the surfactant film SP-B and SP-C form a structure that maintains the maximal pressures. The SP-C facilitates the folding of the film through three-dimensional transitions, and the interface film is stabilized by the SP-B, as shown in Figure 11.(Perez-Gil and Weaver, 2010)Despite numerous significant studies addressed on the biophysical interactions of lung surfactant phospholipids and hydrophobic proteins, a high level of understanding on the effects of surfactant proteins SP-B and SP-C on film structure, phase behaviour, and refinement during cycling is still require. (Krüger et al., 2002)
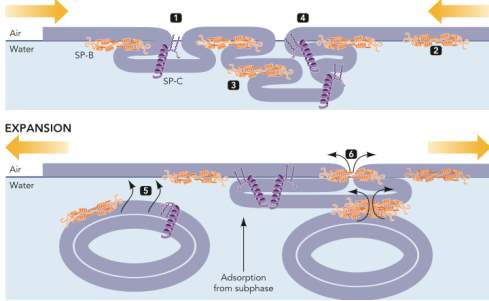
Figure11: Mechanism of SP-C and SP-B during the process of respiration. Image taken from (Perez-Gil and Weaver, 2010). This image demonstrates the process of breathing. The folding of the surfactant film during compression, due to the build-up in pressure, the SP-B on the top of the films provides the maximum stability to compress the films. The second part of the expansion of the film shows the phospholipids from subsurface compartments arrangement into micelle configuration.
2.2.4.1. Surfactant Protein B – SP-B
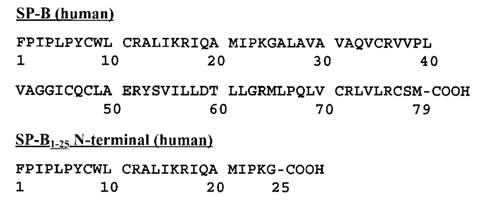
Surfactant protein SP-B is a small hydrophobic protein with a molecular weight of 8.7 kDa reduced protein, part of a member of the saposin superfamily(Guttentag et al., 1998).Refer to Figure 12.1 and Figure 12.2. A mature SP-B has 79 amino acid residues; it is a cationic protein at physiological pH. Each SP-B monomer consists of 4 to 5 α-helices. There are three intramolecular disulfide bridges such as Cys-8 to Cys-77, Cys-11 to Cys-71 and Cys-35 to Cys-46, where the N- and C-terminal regions of the SP-B cross-linked by two disulfides.(Walther et al., 2000), (Waring et al., 2016).Refer to Figure 13.1. SP-B has a positive net change of +7, that makes it preferable for interacting with anionic phospholidids (Banfi and Agostoni, 2016).
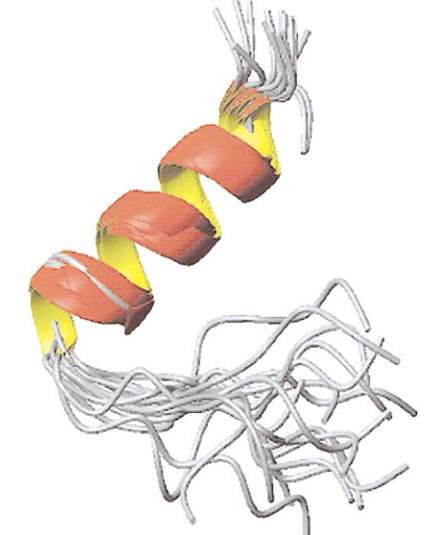
Figure12: Pulmonary surfactant SP-B, image taken from (Walther et al., 2000). This image represents the Structure of the hydrophobic pulmonary surfactant protein SP-B. The longer N-termini are in the back and the C-termini are in the foreground.
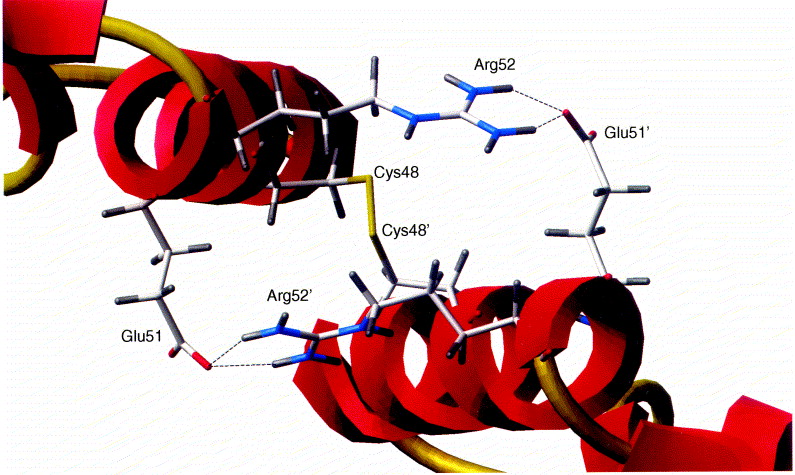
Figure13: SP-B native protein structure taken from (Zaltash et al., 2000). The two S-B monomeric backbone configurations are represented in red, the intermolecular disulphide and intramolecular disulphide connectivity are in gold colour. The disulphide bridge connecting the SP-B monomers by Cys48 to Cys 48’ is located in the centre of the illustration with the ion pairs Arg52 and Arg52’ which are in blue, and the Glus51 and Glus51’ in red.
2.2.4.2. Processing of SP-B
The human SP-B is encoded on a single gene which is located in the human chromosome 2. (Nogee, 1998). The gene is comprised of 11 exons, as shown in Figure 13.1. The 11th exan is untranslated, it is encoding 823 base pair of 3′. The 5’ known as the flanking region of the SP-B gene contain important sequences such as TATA position 33 and CAAT at position 67. SP-B gene is transcribed into a 2000 base pair mRNA follows is the synthesis of a 381amino acid preprotein. The SP-B biosynthesis consists of two process event known as post-translational and proteolytic events. Refer to Figure below. (Banfi and Agostoni, 2016)
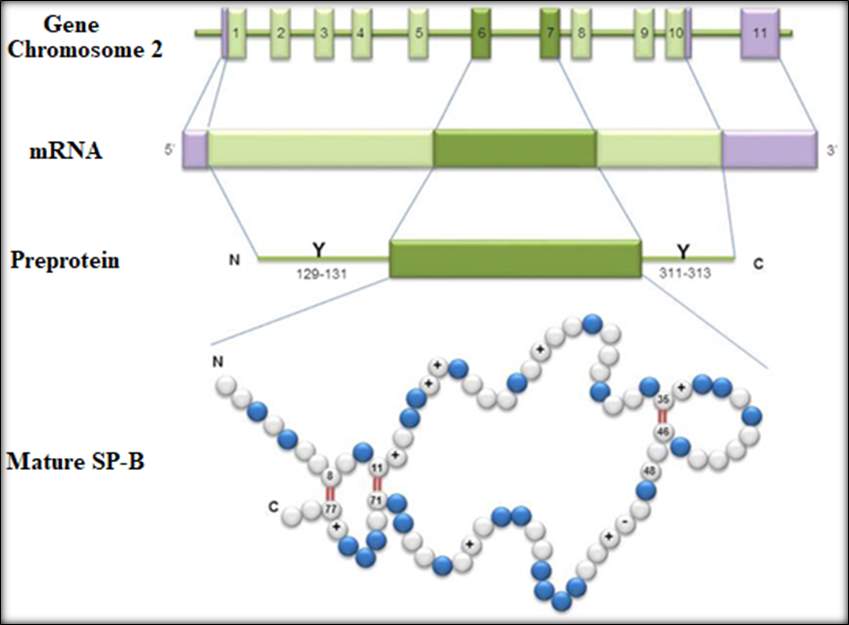
Figure14: Process step formation of mature SP-B. Taken from(Banfi and Agostoni, 2016). This image represent the human SP-B. The top from 1 to 11 represent the 11 exons on chromosome 2. ThemRNA indicating the 5’ and the 3’ position. The approximately 2 kb encodes a pre-protein of 381 amino acids.
The Mature SP-B sequence contains 52% hydrophobic amino acids, 8 conserved positively-charged residues and 1 conserved negatively-charged residue. And the primary structure includes 7 cysteines, six of which are involved in the formation of the three intra-molecular disulfide bridges, while the seventh cysteine is involved in an intermolecular disulfide responsible for the dimerization of the protein.
2.2.4.3. Role of SP-B
SP-B plays a key role in the process of ventilation to lower the surface tension. SP-B is involved in the lamellar body formation, The lipids of the lamellar bodies is rearranged in the alveolus into an expanded membrane called tubular myelin, where the monolayer is formed and spreads at the air-fluid interface just above the alveolar epithelium, as shown in Figure 4. Lamellar body is crucial for the processing of SP-C and the packaging of surfactant phospholipids.(Parra et al., 2013). Therefore the deficiency of SP-B is clinically proven to be associated with the abnormality of type 2 cell ultrastructure, including the absent lamellar bodies and abnormal SP-C processing particularly due to the absence of lamellar bodies and the abnormality of SP-C development .(Guttentag et al., 1998)
The diseased associated with pulmonary deficiency was first recognised in 1993. This is the case where three full term infant died of lung disease. The immunology studies indicated the cause of dead to relate with the lack of SP-B surfactant.(Nogee, 1998)Mover, the author reported a study, where the RDS in premature infants was found to be associated with the SP-B gene mutation. In the same studies, no mutations of the SPC gene were detected in relation to the cause of lung disease. The author further stated that despite the vital importance of SP-B, little is known about the interactions of this surfactant protein with phospholipid.
Why take the image from Walther – you could create one yourself with the sequence from Uniprot.
Figure15: Represent the single letter code composition of the SP-B amino acid. UniProtKB – P07988 (PSPB_HUMAN). Image taken from (Walther et al., 2000).
2.2.4.4. Surfactant Protein- SP- C
SP-C is a small peptide synthesized in the typeII pneumocyte cells of the alveolar cell wall. The second part of the SP-C synthesis is the translation process. This is where After translation (?) the pro-protein is cleaved and acylated during it transport toward the air-water interface. SP-C is composed of two covalently linked fatty acyl chains covalently link to the peptide chain.
The SP-C plays a crucial role in the respiration process during the lungs compression and expansion respiratory cycle. This process is to form and stabilize the pulmonary surfactant. (Carvalheda, Campos and Baptista, 2015). SP-C is a very hydrophobic protein; as it contains a high content of non-polar residues over 70%. There are 35 amino acid residues of SP-C polypeptide chains present in human surfactant protein that constitutes approximately 1% of the surfactant mass. The SP-C polypeptide chain is composed of a short N- terminal region, palmitoylated at residues Cys-5 and Cys-6, which is follows by a α-helical hydrophobic transmembrane C- terminal stretch made of aliphatic residues as shown in Figure 14.(Lukovic et al., 2006).
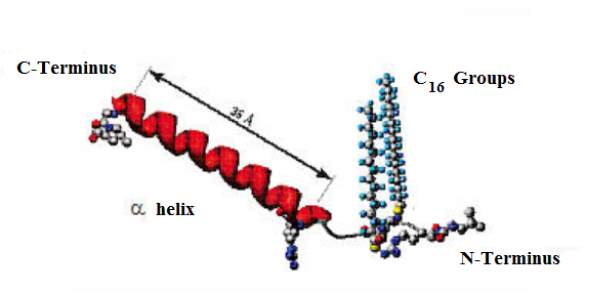
Figure16: The chemical structured of surfactant protein SP-C. This Figure represents the proposed chemical structure of the surfactant protein SP-C. The 35 amino acid is represented in red, the 16 carbon atoms in each palmitoyl chain, the carbon terminus and the nitrogen terminus groups are also represented.
The hydrophobicity of SP-C makes it difficult to handle this surfactant experimentally as it is unstable under certain conditions (McCormack, 1998). The SP-C is a protein monomer of 4.5 kDa and the hydrophobic amino acid form a long contiguous stretch of about 13 to 28 residues. The primary structure is highly conservative, and the secondary structure is mainly α-helical.
Different analytical techniques have been applied for determining the structure of SP-C, for the objective to understand the functional importance. (McCormack, 1998) reported a study where the structure of SP-C was determined via the Circular dichroism (CD) or Fourier transform infrared (FTIR) spectroscopy. The SP-C was 70 to 80 % helical in detergent micelles, in a mixture of chloroform/methanol or short chain alcohols.
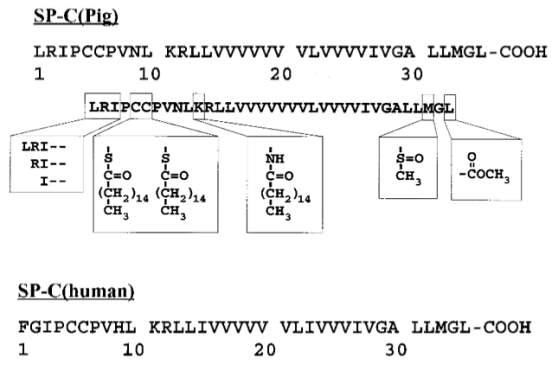
Figure17: Amino acid of SP-C. UniProtKB – P15785 (PSPC_PIG), and UniProtKB – P11686 (PSPC_HUMAN). Modified image taken from (McCormack, 1998),(Walther et al., 2000)
Modified structure of amino acid of porcine SP-C, where the box from left to right represent the N-terminal truncation, the second box is the modified thioester-linked palmitoyl groups of Cys-5 and Cys-6, the third box is the palmitoyl chain amide-bound to Lys-11, and fourth box represent the modified sulfoxide of Met-33, and the last box is the C-terminal methyl-ester. The amino acid below is that of a human SP-C.
One of the frequently used techniques for the isolation and analysis of the SP-C is the HPLC- reverse-phase high-performance liquid chromatography. This method allows identifying the difference between the native helical SP-C and the non-helical SP-C form (aggregated). (Dluhy et al., 2003)
2.3. Source of Air Pollution
Air pollution is one of the main environmental threats affecting the population worldwide. Air pollution is considered to be one of the major causes of global mortality and morbidity, increasing the level of hospital admission due to respiratory problems.(Zhong, Lee and Haghighat, 2017).The air pollution can be defined as the contamination of the indoor or outdoor atmosphere by several types of substances – chemical, physical or biological agents’ modifications, which may result in toxic products detrimental to the health.
The concern over the air quality affecting the cities of England’s was raised back in the 1600s. This was where they were a huge demand for cutting of trees; burning of wood or coal for industries and heating. Consequently, the air pollution impacts the population of England, resulting thousand of excess death.

Figure18: ozone formation and the mechanism reaction of ozone formation. (Zhong, Lee and Haghighat, 2017). This image presents (a) the cycle formation of Ozone, (b) the stratosphere and troposphere, the sources of sectors playing a role in the formation of ozone pollution.
The use coal as a source of heating and lighting during winter time has further affected the population of Europe continental and Unites state. This is from the emission of primaries pollutants such as sulphur dioxide (SO2), carbon monoxide (CO), and particulates. This type of pollution is known as ‘smog’. In addition, the pollution caused by smog has affected the population of London and other major cities in the UK, where the number of death was tremendously elevated. In the early 1950s, 400 numbers of deaths was recorded weekly as a result of direct consequences of air pollution.(Mudway and Kelly, 2000) At a later stage, the use of natural gas was introduced to replace the use of coal. This major change has resulted in concerns over the formation of photochemical smog pollution which consists of Ozone O3 and secondary pollutants that are produced photochemically in the presence of sunlight.
2.3.1. Ozone
Ozone is a component of ambient gas, composed of three oxygen atoms. The formation of ozone generates from the photochemical process. This is a chemical reaction of oxygen and nitrogen oxides or volatiles hydrocarbons in the presence of the sunlight. (Al-Heglan et al., 2011). The concentration of ozone can reach 100ppb or higher in mostly suburban areas. (Wynalda and Murphy, 2010)
Ozone plays an important role in the stratosphere, to prevent harmful ultraviolet radiation from reaching the surface of the earth. However, the ground level ozone, present within the lower troposphere to 10 km is detrimental to the health(Mudway and Kelly, 2000). This type of ozone is of interest to the present study, the ozone which is directly inhaled by humankind and animals; the ozone that is continually increasing its concentration as a result of human activities; the ozone that has a great potential to cause harmful injuries to the respiratory system. Moreover, the ozone that has a negative effect on the ecosystems and contributes to the decrease in agriculture while interfering with the photosynthesis of some plants. Refer to Figure 18.(Zhong, Lee and Haghighat, 2017)
2.3.2. Stratospheric Ozone
The majority of atmospheric ozone is found in the stratosphere where the radiation 300nm and longerwave is absorbed by the stratospheric ozone and molecular oxygen at approximately. The photochemical reaction in the troposphere is driven by solar UV radiation. This region requires a radiation of proximately 300 nm to 600 nm.
2.3.3. Ozone Formation
The ozone formation reaction normally starts with the presence of a primary hydrocarbon (RH) or carbon monoxide (CO) with an OH radical, OH remove the hydrogen atom from the RH chain, the O2 is gained from the atmosphere which results in the formation of RO2(radical).
Reaction mechanism of primary hydrocarbon with OH radical
RH+OH → R. + H2O
Step 1
R.+O2→RO2
Step 2
RO2+NO → RO + NO2
Step 3
RO+O2→R’O(Aldehyde) + HO2
Step 4
NO2 +hv → NO + O
Step 5
O+ O2+ M → O3
Step 6
Equation Reaction scheme 1: Reaction mechanism of primary hydrocarbon with OH radical
Refer to Equation reaction scheme 1: RO2 and HO2 react with NO, resulting in the conversion of NO to NO2. In step 3, RO2 formed can react with NO to give RO and NO2. Following, is a photolysis formation of NO2 derives from the atomic oxygen – no the atomic oxygen is formed from the photolysis of NO2 , and the RO react with the atmospheric O2, the O2 abstracts an H to give R’O (an aldehyde) and HO2 and this result in the formation of Ozone, as shown in step 4. The ozone formation rate strongly depends on the rate of conversion of NO to NO2. This is a continuous cycle, as OH, or NO doesn’t get eliminated from the atmosphere, to allow a continuous ozone formation.
Reaction mechanism of carbon monoxide with OH radical
CO+OH → H+ CO2
Step 1.1
H+O2→HO2
Step 1.2
HO2+NO →OH + NO2
Step 1.3
not relevant to CO oxidation! OH+O2→R’O(Aldehyde) + HO2
Step 1.4
NO2 +hv → NO + O
Step 1.5
O+ O2 → O3
Step 1.6
Resulting net overall reaction
CO+2O2 + hv →CO2 + O3
Equation 2: Reaction of Ozone with CO hydrocarbon compound CO is not a hydrocarbon. Equation taken from(CRUTZEN, 1974)
2.4.3. Acute Respiratory Distress Syndrome
ARDS is a major cause of mortality in the critical care units. It generally derived from a severe case of pulmonary dysfunction. ARDS commonly relate to complications such as inflammation, sepsis or different process of injury.(Serrano and Pérez-Gil, 2006)
The chronic obstructive pulmonary disease (COPD) is an example of the ARDS. The COPD is the fourth leading cause of death in the U.S. The exposure to ambient air pollutants can lead to exacerbations of COPD associated with both enhanced pulmonary inflammation and loss of lung function. However, COPD is characterized by increased numbers of macrophages, neutrophils, and cytotoxic CD8 lymphocytes, suggesting a role of innate immune function in the pathogenesis of this disease.(Hollingsworth et al., 2007)
It was reported by (Finlayson-pitts et al., 1994) that the change in breathing pattern may be as a result of ozone exposure. This work was performed in vivo, where large numbers of rats were exposed to 0.8 ppm ozone for 4 hours. The authors established that the exposure to ozone caused the rat developing a rapid shallow breathing pattern, which is known as a characteristic of oxidant pulmonary irritation. Further to the exposure, the rats were sacrificed, where the bronchioles were visible. The pulmonary surfactant was further analysed where the fatty acid methyl ester composition was measure via GC-MS, the authors observed a significant decrease in unsaturated species such as linoleic, oleic, palmitoleic.0020
In addition, exposure to ozone is associated with impaired clearance of multiple live organisms, including the following: Streptococcus zooepidemicus, Streptococcus pyogenes, Staphylococcus aureus, Klebsiella pneumonia, Mycobacteria tuberculosis and Listeria monocytogenes. (Hollingsworth et al., 2007)
Although a major improvement in mortality rate in clinical trials in adult patients of a case of ARDS have been recalled. Up to date, the application of the surfactant therapy in ARDS still faces some major complications which are associated with different factors. The variations in the activity and inhibition resistance of lung surfactant drugs, the challenge of delivering satisfactory exogenous surfactant concentrations to the alveoli following tracheal instillation in patients with inflamed lungs injured, and the protocols apply for differs administration and ventilation process.(Notter et al., 2016)
2.4.4. Death and Hospital Admissions
Since the Clean Air Act of 1970, the environment protection agency- EPA identified ambient ozone as a standard pollutant with adverse health effects. Inhalation of the ozone significantly contributes to both human morbidity and mortality. Moreover, the inhalation of the ozone is estimated to account for approximately 800 premature deaths, 4,500 hospital admission and 900,000 school absences annually.(Al-Heglan et al., 2011).Inhalation of ozone causes more than a million days of restricted activity with an annual economic burden estimated at $5 billion1. Particularly vulnerable populations include; individuals with an underlying respiratory disease such as asthma, COPD, children, and adults over the age of 65. Each 10ppb increase in daily ozone is associated with an approximately 0.87% increase in total mortality.
Also, the malfunction of the surfactant film can promote serious lung diseases such as alveolar proteinosis, cystic fibrosis, and silicosis.(Krol et al., 2000)
2.4.5. Level of Ozone Pollution and Damage in the UK
The ground level ozone was published on June 21st217 by the department of environmental, food and rural affair, to be very elevated at (90.19ppb) 180µg/m3. This was caused by the high-pressure system persisting over the UK, which has brought warm and still conditions. Refer to Figure 19.
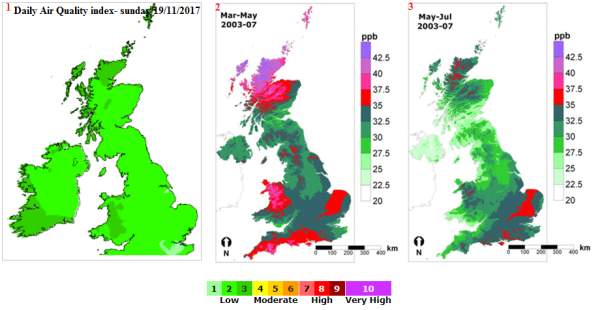
Figure19: Ozone concentration in the UK in ppb. Modified picture from (APIS)
The above map indicates the level of concentration in the UK of ppb over the altitude. The concentrations of the ozone are differentiated by the colour indications, green: low level of ozone pollution 1-3, orange: moderate level of pollution 4-6, red: high level of pollution 7-9, purple: very high level of air pollution 10. The level of air pollution is low in the winter time in comparison to the summer time.
During periods reaching level 4 to 9 air pollution, it is advisable to patients suffering from lung conditions to minimise their outdoors activities. The condition becomes crucial at level 10 air pollution. At that stage, patients (adults and children) with lung and with heart conditions and older people are often advised to strictly avoid physical activity.
2.5. Past studies on ozone pollution and the Lungs
During the process of respiration, approximately 80% of the inhaled ozone pollution is deposited onto the airway. As the ozone reaches the airway, there is a fast reaction between the ozone with the carbon double band of the hydrophobic substances, alveolar surfactant-associated phospholipids, and cholesterol.(Bromberg, 2016). The in-vivo studies of the ozone exposure to proteins and lipids confirmed that the inhaled ozone has a fast reaction with the unsaturated lipid. Refer to Figure 20.
The 1-palmitoyl-2-(9′-oxo-nonanoyl)-glycerophosphocholine is an expected product of the ozonolysis, which contains unsaturated fatty acyl groups with a double band at carbon-9. This ozonolysis product was reported in (Uhlson et al., 2002) work, where the authors investigated the reaction of ozone with calf lung surfactant extract. The calf lung surfactant was exposed to low levels of ozone 62.5, 125, and 250 ppb for a period of time.
(Thompson et al., 2010) reported a study where the monolayer of unsaturated lipid 1-palmitoyl-2-oleoyl-sn-glycero-3-phosphocholine, POPC was exposed to the gas-phase ozone. The POPC was studied using the neutron reflection and surface pressure measurements. As results, the authors concluded that the ozonolysis reaction of POPC and lung surfactant results the decrease in pulmonary function. From the authors’ observation, a rapid increase in surface pressure was observed as the ozone start reacting with POPC. Followed, the surface pressure was gradually decreased till a small value was achieved. Additionally, the neutron reflection was used to follow the amount of lipid at the air-water interface; the results suggested that the monolayer of POPC exposed to gas-phase oxygen reveal the loss of palmitoyl strand of POPC from the air-water interface.
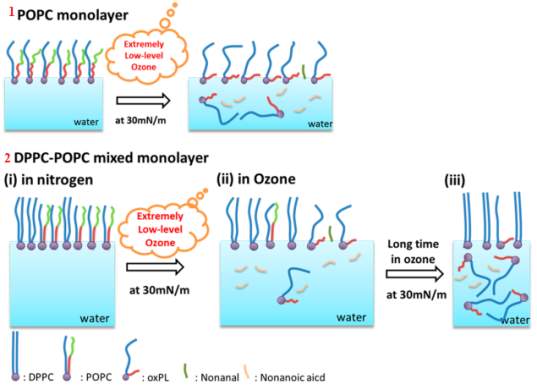
The oxidation result of the POPC, when exposed to low level of ozone, was further confirmed in the report written by (Qiao et al., 2015). The mixture of a monolayer of POPC and PC with DPPC and PC was studied at ozone concentration range of 20 ± 10 ppb. The surfactant mixture was analyzed using techniques such as the π–A isotherm, sum frequency generation (SFG) vibrational spectroscopy, and atomic force microscopy (AFM). Refer to Figure 20.
Figure20: Illustrates the sequences taking place during the exposure of phospholipids surfactant to a low level of ozone. 1 the POPC before and after exposure to low concentration of ozone, 2 the steps of the ozonation process when unsaturated POPC get oxidized, there is a loss of nonanal and nonanoic acid. After a long-term exposure, all the POPC gets completely oxidized, leaving the DPPC at the air-water interface.
The field-induced droplet ionization mass spectrometry (FIDI-MS) was used to understand the chemistry of the surfactant protein at the air interface under ozone exposure. Reported by (H. I. Kim et al., 2010)T. he FIDI-MS method was required to study the ozonolysis of POPG at the air-liquid interface, and the mixture of saturated phospholipid 1,2-dipalmitoyl-sn-phosphatidylglycerol (DPPG) and unsaturated POPG. Only the unsaturated lipid reacted with ozone. The POPG experienced a fast affect from primary ozonide (POZ) or through energetic Criegee intermediates (CI). The POPG cis-double bond yielded an aldehyde and carboxylic acid products. No changed was observed for the ozone exposure with the saturated phospholipids such as DPPG and DPPC. Reported by (H. I. Kim et al., 2010), (H. I. H. Kim et al., 2010)
In (Putman et al., 1997) a rate lung was exposed to 2 and 12 hours of 0.8 ppm ozone and analyzed via a surface balance to determine the adsorption rate and the surface pressure of the rate pulmonary surfactant. A decrease in the adsorption rate of the hydrophobic component was observed. The author indicated that one of the surfactant SP-B or SP-C was affected by the ozone exposure. The calf lung surfactant exposed to low levels of ozone 62.5, 125, and 250 ppb results in the production of 1-palmitoyl-2-(9′-oxo-nonanoyl)-glycerophosphocholine. This is an expected product of the ozonolysis of unsaturated phospholipids. The calf was analyzed using an LC/MS/MS assay. Reported by (Uhlson et al., 2002)
Moreover, the plasmalogen glycero phospholipid is a unique type of lipid that is a potential surfactant target to ozone oxidation. Plasmalogen is an example of phosphatidylethanolamine (PE), which has been proved to be present within lung surfactant. Refer to Figure 7. This lipid takes approximately 12 percent of all phospholipids. The plasmalogen molecule has a vinyl ether linkage at the sn-1 position and an ester linkage at the sn-2 position. The vinyl ether bond increases the reactivity of the plasminogen to most reactive oxygen species. Refer to Figure 21. Moreover, plasmalogens were reported to be significantly lower in patients with respiratory distress syndrome.
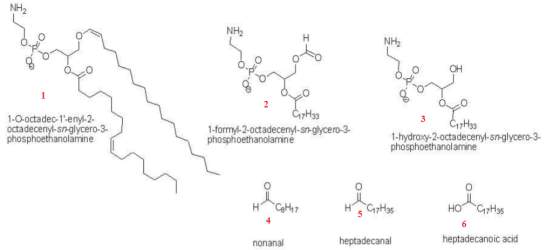
Figure21: Ozonation formation of plasmalogen reaction.. This represents the products generated from the exposure of plasmalogen phosphatidylethanolamine (PE) phospholipids at 100ppb ozonation. The phospholipid products generated were identified as 1-formyl-2-octadecenoyl-PE and 1-hydroxy-2-octadecenoyl-PE. A further quantification analysis by gas chromatography-mass spectrometer analysis revealed the formation of nonanal, heptadecanal and heptadecanoic. Image taken from (Wynalda and Murphy, 2010)
The polluted gas-phase ozone exposure to the unsaturated POPC was further address by (Thompson et al., 2013). The authors focused their work looking at the degradation and the rearrangement of the lung surfactant lipid at the air-water interface. The researchers have focused their work on the exposure of lung surfactants to the pollutant gas ozone. The authors used techniques such as, the neutron reflection and surface pressure measurements for this study.The authors observed an increase to the surface pressure with the loss of the C9 portion from the interface. This results correlate with previous report (Thompson et al., 2010), the exposure of POPC to gas phase ozone leaded to a loss of material from the palmitoyl strand, the loss of palmitoyl material was observed after the loss of the terminal C9 portion from the oleoyl strand of the POPC molecule. Therefore, the authors suggested that the palmitoyl material is lost in a secondary reaction step. The cartoon representing the loss of POPC can be observed in Figure 20. In contrast, the saturated lipid DPPC was not affected when exposed to ozone at the air−water interface. Moreover, the neutron reflection studies showed that the terminal portion of the oleoyl strand (C9 onwards) was lost from the interface when POPC, at the air-water interface was exposed to ozone.(Thompson et al., 2013)
(Hemming et al., 2015) this studies was focused on the effect of the ozone exposure to the protein SP-B. Two peptides were studied, the first peptide was the SP-B with the N-terminus [SP-B 1-25] and the second peptide was the SP-B with the N- and C- termini [SP-B 1-25, 63-78] known as SMB. The peptides were exposed to approximately 2 ppm of ozone at the air-water interface. As a result, a rapid reaction was observed from the reduction in surface pressure. Therefore, the effect of the ozone on the SP-B peptides has suggested that there is a big probability of SP-B to react rapidly when exposed to ozone. This work has further confirmed that the unsaturated anionic lipid such as POPG has a rapid reaction when exposed to ozone.
2.6. Project aims and Objectives
The aim of the present study was to offer a significant contribution of new knowledge to past studies intensively focusing on the effect of the pulmonary pathology in relation to ozone air pollution exposure in lung surfactants. The present study focused on the effect of ozone pollution in-vivo in-vitro – the pigs were not alive and the lung surfactant was recovered, not studied in situ. due to the direct ozone exposure on extracted pig lung surfactants.
The first objective was to extract lung surfactant from mammalian pigs’ lungs in order to analyze the surfactant substances, and hence the second objective was to determine the direct impact of the exposure of the lung surfactant to Oozone. To analyze the extracted surfactant, different methods were used such as, the Langmuir-Wilhelmy surface Balance / Langmuir Though trough , the Polyacrylamide Gel Electrophoresis (PAGE), the high-performance liquid chromatography (HPLC) and the UV-Vis chromatography.
2.7. Techniques for Study the Lung Surfactant
2.7.1. Langmuir-Wilhelmy surface Balance / Langmuir Though
The Langmuir monolayer was first discovered in 1917.(Parra et al., 2013)The main purpose of the Langmuir-monolayer was for the characterization of insoluble materials spread on the surface of the gas-liquid interface of aqueous sub-phase films on the through. This technique initiated the discovery of a more sophisticated instrument known as the Langmuir-Wilhelmy surface balance. The Langmuir-Wilhelmy surface balance is a technique first originated by Clements in 1957(Veldhuizen et al., 1998). The Langmuir monolayer was mainly discovered for the characterization of the surface activity of lung pulmonary surfactant complexes such as the hydrophobic proteins SP-B and SP-C and for the saturated lipids DPPC components. Moreover, the Langmuir monolayer model was also implemented for the characterization of unsaturated lipids POPG and proteins, an amino acid with aggregates, and amino acid without aggregates. The biophysical properties of these model membranes can be influence with factors such as: the spreading conditions of the system, the composition of the subphase – buffer solution tris-buffered saline (TBS), the pH, salt composition, and the concentration of the lipid monolayer. (Selladurai et al., 2016).
The instrument consists of two major parts: a trough which is used to vary the surface area, and a Wilhelmy dipping plate which is used for monitoring the surface tension. Refer to Figure 22.
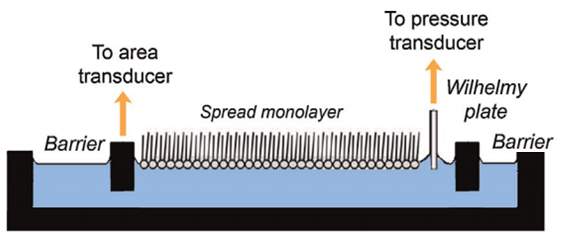
Figure22: Langmuir Wilhelm plate. Image adapted from ref. Need to add reference This image shows the part of the Langmuir Wilhelm plate – the barriers, the Wilhelmy plate, and the position of the spread monolayer at the air-water interface.
The Wilhelmy method is a technique required to study the film behaviour, and the molecular biophysics of the lung surfactant. A measured amount of extracted lung surfactant is spread onto an aqueous sub-phase, which is present in the Langmuir trough. Refer to Figure 22. The Wilhelmy plate can be a small piece of filter paper or a small piece of platinum, which is in contact with the air-water interface. (Parra et al., 2013)
The surface tension of the extracted lung surfactant is measured from the force tension pulling down the small attached rectangular Wilhelmy plate touching the water surface. The Wilhelmy plate undergoes a vertical force when dipped into the water surface. This force is known as the sum of the contributions from buoyancy pushing the plate upright, the gravity and the surface tension drowning the plate downward. The surface tension, known as the downward force, strongly depends on the contact angle (θ), where the maximum applied force occurs when the downward force nearly equates zero – defining the slide to be completely soaked within the water. Moreover, the downward force of the surface tension strongly depends on the depth of the plate immersion. Hence, the increase in surface pressure π is directly proportional to the decrease in surface tension γ.
γ=fl ×cosθ
Equation 3: Correlation between the force and the surface tension
The force and the surface tension are directly proportional to each other. Refer to Equation 1. The symbol
l
represent the total plate perimeter wetted by the aqueous subphase,
θ
is the contact angle between the water and the Wilhelmy plate, and
f
is the downward force acting with the Wilhelmy plate. (Parra and Pérez-Gil, 2015)
The Langmuir-Wilhelmy balance consists of two barriers, moving horizontally, which carries several advantages. The barriers control the interfacial area, in order to limit the total surface area of the spread molecules. This is an advantage to obtain a fast result of
π-A
Isotherms of the analyzed surface-active material. A fast result of
π-A
Isotherms is beneficial for the characterization of rheological properties during the respiration mimicking compression and expansion cycles.
To avoid the collapse of the alveolar, the lung surfactant reduces the surface tension at the air-water interface near zero inside the alveolar during the compression of the lungs and, re-spread during expansion without damaging the alveolar. This process can be explained using the Laplace law. Refer to section 2.1.2. The Figure bellow illustrates the part of the graph results during the experiment to measure isotherm of surfactant at the air-water interface.
2.7.2. Polyacrylamide Gel Electrophoresis (PAGE)
Bronchoalveolar lavage (BAL), the Bligh and Dyer method and the one-dimensional Sodium Dodecyl Sulfate (SDS) – PAGE process is one of the methods that has been reported in different articles for the study of protein surfactants.(Taneva et al., 1998), (Roldan et al., 2016), (Fullagar et al., 2003), (Lukovic et al., 2006)
The BAL method is used to collect the sample of lung surfactant. The Bligh and Dyer method is used for lipid extraction and for the extraction of hydrophobic proteins. The SDS – PAGE process is to look at the different proteins present from the extracted sample.
The SDS is a negatively charge anionic detergent required to unfold the analyzed proteins (denature protein). It disrupts the secondary and tertiary protein structures by breaking hydrogen bonds. And hence gives the proteins extra negative charges, for the protein to act equality and to prevent aggregation during the gel run. The proteins are separated according to their molecular mass.
The protein becomes negatively charged due to the SDS. Therefore, the protein moves to the positive charge electrode. The proteins are separated according to the charge to mass ratio. The smaller protein moves faster. During the analysis process, the sample is heated to denature protein and allow the separation of the proteins by sizes.
2.7.3. High-Performance Liquid Chromatography (HPLC)
Different detection modes have been proposed for the surfactant analysis. The detection modes strongly depend on the type of surfactant. The majorities of surfactant don’t have a chromophore, as a result as they cannot be identified by the ultraviolet/visible -UV detector. In the present study, the surfactants of interest are the SP-C and the SP-B – I thought you were interested in the lipids and lipid oxidation products too The HPLC with the UV detection mode is used for the separation of the molecules mixture.
Other types of detections used for the study of surfactant are – the refractive index -RI, mass spectrometry-MS for trace analysis. It is also used in cases wherea peak identification is required.
The evaporative light scattering detection (ELSD) is a universal detection method. The ELSD is compatible and suitable for gradient methodswhen analyzing the surfactant in order to perform a routine analysis of high-concentration samples. Despite its advantages, the ELSD contains several limitations in terms of reproducibility, sensitivity. The ELSD also tends to produce a poor linear response.
In the present study, the HPLC is mainly used attempted rather than used to determine the pulmonary surfactant composition of the lung surfactants under certain conditions using the UV-Vis detector. The first analysis involves the HPLC analysis of pulmonary surfactant mixture after being exposed under oxygen for several hours. The second analysis involves the pulmonary surfactant after been exposed for several hours to ozone. Moreover, the analyzed sample mixture separation depends on the solvents and the stationary phase – column composition.
2.7.4. UV-Vis Spectrometer
The UV-Vis is required to compare the absorbance of the pulmonary surfactant mixture after being exposed for several hours under oxygen, to the absorbance of the pulmonary surfactant after been exposed for several hours to ozone. This is to determine the impact of the ozone exposure to the surfactant sample.
The percentage oxidation of the analyzed sample can be determined by using Beer’s Law, to determine the concentration peroxidised lipid from its absorbance.
Blank Page
III. METHODOLOGY
3.1. Schematic Model of the Langmuir Trough
The sketch below was used to record the changes in surface pressure of the extracted lung surfactant samples as a function of molecular area, or reaction time, when exposed to dilute ozone, via the Langmuir trough. Moreover, the below experimental set-up, where humid oxygen, or ozone in humid oxygen was designed to eliminate the vaporisation of water during the experiment of the isotherm measurement of the extracted lung surfactant under oxygen and ozone.
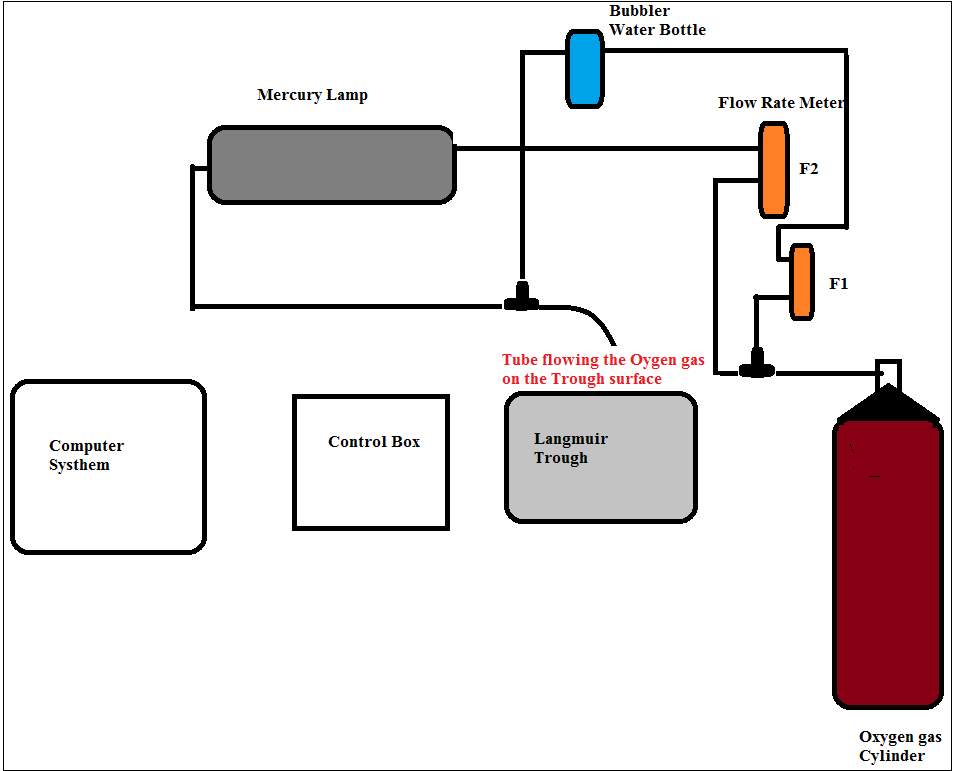
Figure 23: Schematic diagram of the experimental set-up.
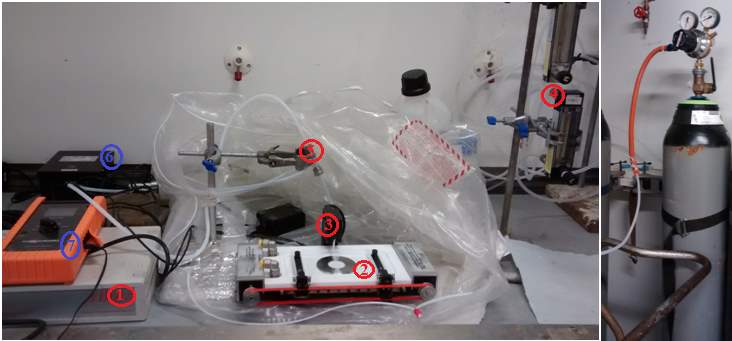
Figure 24: Steps procedures for the determination of surface pressure of the lung surfactant using the Langmuir trough.
The steps in Figure 24 represent 1 is the Langmuir control box micro-processor interface IU4 NIMA technology connected to the computer system, 2 The trough instrument, 3 Wilhelmy plate attached to the trough balance, the source of oxygen gas was turned on during the 5 hours run via the gas cylinder– the oxygen was controlled by connecting the tube from the source of oxygen gas cylinder through a tube which is connected to the flow meter (F2) as shown in Figure 1.1. 4 The flow meter device to control the flow of oxygen at a fix flow rate at (F1) 1 L min–1 and (F2) 2 L min–1. The trough was completely covered with the plastic bag to contain the ozone in the vicinity of the trough and prevent dust from landing on the surface during a measurement. 6 The A-22 ozone sensor was to measure the ozone concentration. The level of ozone was controlled by the settings on the ozone generator; the ozone was generated by exposing molecular oxygen to UV light, and by partially covering the lamp less ozone was produced.
To start the experiment, the bottle behind the trough known as bubbler was filed with pure water. The oxygen gas was turned on; the oxygen flow was control by the flow meter and the bubbler before reaching the trough surface. And for the run under ozone, the oxygen gas was turned on; the oxygen flow was control by the flow meter, pass through the bubbler, and directed toward the mercury lamp where trace amounts of the oxygen got converted to ozone before reaching the trough surface. The experiment was carried out in the fume hood. The ozone was generated by flowing dry oxygen via a Pen-Ray Power supply mercury lamp trough an ozone generator UVP 230V-50/60Hz, 0.47 Amps. The ozone was formed from the photolysis of the molecular oxygen. Refer to Equation 4.
O2 +hv →O+O λ<240 nm
(1)
O+O2 →O3
(2)
Equation 4: Ozone formation
Details of all reagents used for the experiments involving the analysis of lung surfactant are given below in Table 1.
| Reagent Name | Percentage Purities | Manufacturer |
| Sodium Chloride | 99.5% purity | Sigma Aldrich |
| Chloroform stabilised with ethanol | > 99% purity | Sigma Aldrich |
| Methanol | > 99% purity | Fisher Scientific |
| Tris-Base (hydroxymethyl) aminomethane | > 99% purity | Fisher Scientific |
| Tricine | > 99% purity | Fisher Scientific |
| Sodium Dodecyl Sulfate(SDS) | > 99% purity | Fisher Scientific |
| Acrylamide | 40% | Sigma Aldrich |
| N,N,N′,N′-Tetramethylethylenediamine(TEMED) | 99.5% purity | Sigma Aldrich |
| Ammonium Persulfate(APS) | ≥99.8% purity | Fluka |
| Glutaraldehyde | ≥99.5% purity | Sigma Aldrich |
| Sodium Thiosulfate-5 hydrate | 99% purity | BDH Chemical |
| Silver Nitrate | 99% purity | Prolab-chemical |
| Disodium EDTA- Ethylenediaminetetraacetic acid | 99.5% purity | BDH Chemical Ltd |
| Formaldehyde | ≥99% purity | Fisons Analytical |
| Sodium Carbonate | 99% purity | Fisons Analytical |
| Ethanol | 96% | Fisher Scientific |
| Acetic Acid | 99% purity | Fisher Scientific |
| Propan-2-al | 99.9% purity | Fisher Scientific |
| Hexane | 99.9% purity | Fisher Scientist |
| Triethylamine | ≥99.5% purity | Sigma Aldrich |
| Trifluoroacetic Acid TFA | 99% purity | Sigma Aldrich |
| Pure Water | 18 mΩ cm | Birkbeck lab 619/625 |
Table 1: List of reagents used for the analysis of the lung surfactant
3.2. Operational Procedures
Prior to commencing the analysis of the lung surfactant with the Langmuir trough, the trough surface pressure sensor and barriers positions were calibrated daily according to the manufacturer’s instructions. Before using the trough, the trough was cleaned thoroughly. A dilute Decon 90 detergent solution was used followed by seven rinses in pure water, and wiping down with chloroform. The procedure was to ensure the elimination of any contamination, especially deriving from previous surfactants, as the presence of contamination lowered the surface tension.
The maximum barrier position area was set between 73 cm2and 87 cm2. This was to allow the spread out of the monolayer across the trough surface, and the vaporisation of the solvent used to dissolve the surfactant. The minimum barrier position area was set between 14 cm2 and 21 cm2 to compress the film deposit on the water surface, as shown in Figure 25.
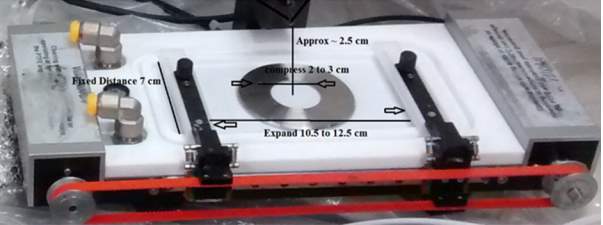
Figure 25: Langmuir trough – Determination of monolayer barriers calibration
The Langmuir trough bars and the inside of the trough were further cleaned using fresh Kim care wipes moisten with chloroform. One of the reason the chloroform was used, is because the chloroform is a water insoluble highly volatile organic solvent. It is mostly used for dissolving amphiphilic molecules to transfer the surfactant to the water surface in order to create the monolayer film. The procedure was carried out three to four times for each surface for a complete cleanness of the trough.
A 2 cm Wilhelmy plate prepared from the chromatography Whatman filter paper was placed on the trough holder which was attached on a sensitive electro-balance to measure the surface pressure. A volume of 46 ml water was added to fill up the trough surface; the Wilhelmy filter paper was lowered and positioned on the water surface for approximately 2 minutes until the water emerged on the top of the filter paper.
The cleanliness of the trough surface was checked by making sure the surface pressure did not increase above 0.5mN m-1 when the barriers were closed before the surfactant was deposited on the surface.
3.3. Experimental Analysis and Extraction Procedure
3.3.1. Monolayer Isotherm Determination – General Procedure
The barriers speed control of the Langmuir trough was set at 10 cm2/minutes to control the formation of isotherm, drops of the solution to be analysed. Following, the cholesterol or the extracted surfactant solution was added on the surface of the water, by allowing small drops to fall from the Hamilton micro-litter syringes while touching the surface of the water. The added drops were distributed equally over the entire surface area of the trough. At this stage, the solvent evaporated and the monolayer was formed. The isotherm was generated via the computer system as shown in Figure 24.
3.3.2. Cholesterol Sample Analysis
The cholesterol was diluted with chloroform; 9.98 mg of cholesterol was transferred diluted into 10 ml of chloroform. Cholesterol has a poor solubility in water. However, cholesterol can be dissolve in chloroform, and a solution of cholesterol in chloroform can be easily spread on a water surface to form an insoluble monolayer at the air-water interface. The solution was kept in the freezer at – 20 °C for further analysis.
A total of 6 μl drop of cholesterol (1.55 ×10⁻⁸ mol) was added on the surface of the air-water interface. After waiting for the chloroform to evaporate an isotherm was recorded.
3.3.3. Lungs Surfactant Analysis
The analysis of the lung surfactant involved a series of steps as listed below. Refer to Table 1 for the reagents used.
3.3.4. Lung Surfactant Extraction Procedure
A fresh pig lung was provided from the butcher. The lung was cut with a scalpel knife in several places to allow the bronchioles to be clearly visible as shown in Figure 26.
To make the saline solution, 9.0 g of NaCl per litre was freshly prepared with pure water. The saline solution was inserted into the visible bronchioles via a glass pipette and then recovered along with the fluid from the lungs. The recovered mixture was transferred half full into a 2 ml Eppendorf tubes, to avoid any sample spillage during future centrifugation of the sample, as shown in Figure 26. The same procedure was repeated several times to make up 30 tubes of collected samples from the pig bronchioles. This was to make up sufficient sample volume for the next procedure steps.
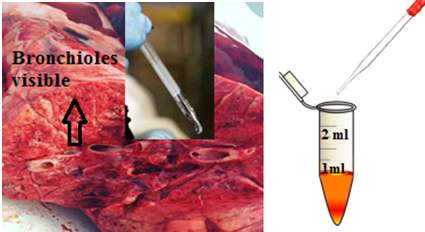
Figure26: Bronchioles and the addition of saline. This figure represents the processes of bronchiolar lavage, from the 500 ml of the prepared saline solution, the saline inserted inside the lung and then recovered, along with the liquid presents in the bronchioles. Image of the lung provided for the experiment.
3.3.5. Hydrophobic Component Extraction Process
The extraction process of the hydrophobic component was performed using the Bligh and Dryer method as described below. (Bligh and Dyer, 1959)
The 30 tubes of surfactant samples were prepared as described in section 3.3.4, were centrifuged at 112 × g (1000rpm) for 15 minutes to allow the separation of the solute with the unwanted substances such as the solid residues which was discarded. The supernatants were removed via a glass pipette and transferred into a clean glass vial for further extraction. During the centrifugation process, a fast spinning takes placed, the dispersed droplet comes together to form one layer suspension, while the denser components of the mixture end at the bottom of the vial, identified as solid residues.
The supernatants were divided into small volumes by transferring 267µl into 2 ml Eppendorf tubes via a micropipette. A 1000 µl of 1:2 v/v ratio of CHCl3:CH3OH was added into each tube and vortexed for 2 minutes to ensure a complete mixture of the sample. Subsequently 334 µl of CHCl3 and 334 µl of H2O were added onto the sample vial via micropipette, resulting in a total volume of 1.94 ml. The mixtures of the surfactant and the added solvents were centrifuged at 112g (1000rmp) for 5 minutes, resulting in the separation of the organic components with water.
The organic layer was collected by inserting a glass pipette on the bottom of the solution while pressing and gently absorbing the organic bottom phase layer to avoid mixing the solution. The collected organic layer was recovered and stored in the freezer at – 20 °C for further analysis such as the SDS-PAGE gel electrophoresis and Isotherm measurement.
3.3.6. Organic Solution Analysis using the SDS-PAGE Clean Kit
The SDS-PAGE clean kit provided from GE Healthcare is use to quantitatively precipitates the proteins sample while leaving interfering substances in solution such as salt, lipids, phenolics, and nucleic acids during centrifugation. The protein is collected as pellet. The SDS-PAGE facilitates the analysis of samples that are difficult to be analysing due to the lower protein concentration.
Approximately 2 ml of organic solution containing the extracted lung surfactant was transferred into a clean vial. The solvent was evaporated by passing a flow of nitrogen gas over the surface. The chloroform solvent was completely evaporated. The solid lipid and protein residue in the flask was dissolved in 100 µl of Tris buffer (0.5M Tris, pH 6.8), to re-suspend the surfactant mixture and maintain the pH of the lipid sample.
RCF =
(RPM1000)2×r×1.118 -will check the radius of the rotor in centimetre
The re-suspended solution was mixed for 10 seconds; the 300 µl of the precipitant solution supplied in the Clean-up kit was added via a micropipette. The mixture was vortexed for 5 minutes at a speed of 112 × g (1000rpm) and the sample was placed into an ice container for 3 minutes to form the precipitation. A 30 µl of co-precipitant was added, mixed manually for 10 seconds, and vortexed for 5 minutes at 12000xg. The addition of the precipitant and co-precipitant was to quantitatively precipitate the sample proteins while leaving interfering substances in solution. The pellets proteins (see Figure 24) were recovered at the bottom of the tubes by centrifugation. The supernatant was discarded by means of a micropipette. As shown in Figure 24.
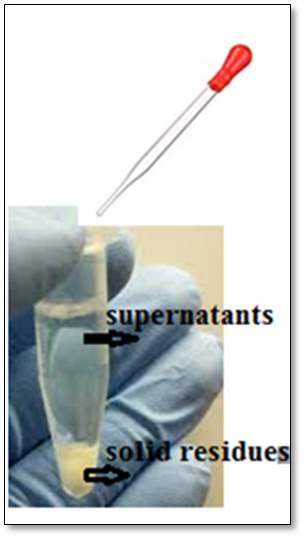
Figure27: Separation of the supernatants and solid residues after centrifugation. The bottom layer is the collected pellet proteins after centrifugation, and the top layer supernatant was discarded.
A volume of 25 µl of H2O was added into the vial containing the pellets proteins. This was vortexed for 2 minutes at 112 × g (1000rpm). 1.0 ml of the cold wash solution and 5µl of the washed additive solution were added consecutively to remove any remaining nonprotein contaminants. The solutions were vortexed for 5 minutes at 12000xg using a MSE Micro centaur mixer.
The supernatants were discarded, and the pellets were allowed to dry at room temperature for approximately 5 minutes. Then 20 µl of the buffer (I) was added to the tubes containing the pellet, to re-suspend the resultant pellet. The mixtures were vortexed for 5 minutes and incubated on ice for a further 2 minutes. 5.0 µl of the buffer (II) was added to the sample plus 24 µl of SDS Page with the reductant (90%SDS Page + 10% DTT reductant). The mixtures were vortexed for 5 minutes at 112 x g (1000rpm), and incubated at room temperature for a further 5 minutes. The solutions were heated between 95 ºC and 100ºC for 3 minutes via a mini dry bath purchased from Fisher Scientific. The sample was centrifuged for 30 seconds and kept for analysis by gel electrophoresis.
3.3.7. SDS-PAGE Protocol for Protein Analysis
The SDS-PAGE is a method commonly used for the separation of proteins in the mass range 1–100 kDa. However, the Tricine-SDS-PAGE is a preferred electrophoresis method use for the separation of protein with a molecular weight range 1 -20 kDa. The small acrylamide concentration level is use to facilitate protein staining, and to decrease the probability of small proteins to escape during the short operation time. (Dovichi et al., 2016)
The SDS-PAGE made use of a series of buffered and solution preparations refer to Table1.
Highlighted below, are the steps used when conducting the gel electrophoresis analysis.
Two separation gels were prepared with different monomers concentration (acrylamide and cross linker bisacrylamide). The acrylamide gels was characterized by %T known as the total percentage concentration of the two monomers and % C known as the percentage concentration of the cross linker relative to the total concentration. (Schagger, 2006).
APS Solution
A 0.25g of 40% by weight APS solution was prepared by dissolving 0.10 g of ammonium persulfate make up a total of 0.25 g.
3.3.7.1. Resolving Gel Preparation
To make the resolving gel (T=18%, C into water to
=5% mixture), into a 100 ml conical flask, 2.4 ml of H2O, 2.0 ml of 3M tris buffer pH8.5, 3.6 ml of 40% 19:1 acrylamide/bisacrylamide solution, and 0.25 ml APS solution were added consecutively and blended together. Additionally, 12 µl TEMED was added with a micropipette into the sample mixture prior to transferring the sample into the gel tray, as the addition of the TEMED resulted to a rapid gel formation.
3.3.7.1.1. Tris buffer for resolving gel
A total of 29.07 g of Tris-Base (hydroxymethyl) aminomethane was dissolved in 80 ml of H2O. Concentrated HCl(aq) was added to adjust the pH up to 8.45. Drops of HCl were added into the tris buffer solution. The solution was mixed manually. The pH was checked after each addition via a pH paper. The tris buffer was prepared at a specific pH to keep the protein at a constant pH.
3.3.7.2. Stacking Gel Preparation
To make the stacking gel (T=5%, C=3.3% mixture), into a 100 ml conical flask, 2.50 ml of H2O, 1.00 ml of 3M tris buffer pH 8.45, 0.50 ml of 40% 29:1 acrylamide/bisacrylamide solution, 4.0 µl of 40% by weight APS solution were added. The mixtures were blended together. Additionally, 16 µl TEMED was added followed by a gentle agitation, prior to transferring the sample into the gel tray.
The comb was removed when the gel was completely formed. The gel was conserved in a plastic bag in the fridge for a week to carry out the next steps bellow.
3.3.7.3. Running Buffer Preparation
A sum of 6.06 g Tris-base, and 0.1 M in tricine (8.96 g tricine) was added into a 500 mL flask, follows by the addition of 0.1% SDS by weight (0.52 g of SDS) and filled up with water to make a total of 500 mL running buffer solution.
The running buffer was prepared to fill the chamber tank of the electrophoresis. The deionised water is not a good electricity conductor; therefore, the tris buffer was mixed with deionised water in order to conduct the electricity.
3.3.7.4. Loading Buffer Preparation
A total of 100 µl of 0.5M tris prepared from (4.85 g of tris buffer was dissolved in 80 ml of water 20% HCl(aq) was added to adjust the pH up to 6.8), plus the addition of 100 µl of 10% SDS, and 800 µl of H2O was mixed to make up the tris loading buffer. A fresh solution of loading buffer was prepared each time when required.
3.4. Gel Electrophoresis
At the start, the tray cassette was assembled. After the addition of the 12µl TEMED the resolving gel solution was transferred. A thin film of the 2-propanol solution was applied on top of the resolving gel via a micropipette, to form a flat surface of the gel. The gel was allowed to polymerise for approximately one hour. Then the 2-propanol was discarded. The stacking gel was added via a plastic pipette within 5 seconds after the addition of the 16 µl TEMED to form the second gel layer.
The gel comb was immediately inserted inside the gel, in a side manner to eliminate the formation of bubles?. The gel was allowed to polymerise for approximately one hour, and then the comb was gently removed. The gel tray was placed into the electrophoresis, the chamber was completely filled with the freshly prepared running buffer solution (described in section 3.3.7.3), to allow the electricity to conduct evenly through the gel and hence to allow a fast migration of the protein through the gel.
3.4.1. Gel Electrophoresis Loading Procedure
A total of 20 µl of the extracted protein sample was dissolved in 20µl (mixture of 1:10 diluted loading buffer prepared in section 3.3.7.4: Bromothymol blue dye, will check my book). A 10µl protein sample was loaded into the gel a well using a micropipette, 5 µl of protein ladder sample was loaded into a different well. The ladder solution was a mixture of 100 µl of ( 90 μl SDS Page, 10μl reducing agent DTT) and 10µl precision plus protein dual xtra standards staining sample from Bio-Rad to reveal the position of the surfactant protein in the gel.
The electrophoresis chamber was connected to a power and the voltage was set at 200 voltages, at 10 Watts for one hour running time in order to send the electricity current through the gel.
3.4.2. Visualising the Gel, Under the White/UV Transilluminator Light
A silver staining procedure was used for visualising small peptides and proteins, the details are listed below.
3.4.3. Washing Procedure of the Gel
After the one hour electrophoresis run, the gel was placed in a plastic transparent tank. The gel was rinsed with 100 ml deionised water, then incubated in 50 ml of 5% glutaraldehyde for 30 minutes to fix the surfactant protein in the gel. The solution was drained out. The gel was further incubated for 5 minutes into 100 ml of pure water while gently being agitated. The used water was discarded, and fresh pure water was added for an additional 5 minutes incubation time to further clean the gel.
The added water was drained, and the gel was incubated into a 0.005% sodium thiosulfate for 30 minutes while gently being agitated. The solution was drained, incubated furthermore into a 0.1% silver nitrate solution while gently being agitated. The solution was drained once more.
The gel was rapidly rinsed with pure water for less than 5 seconds, Afterwards; the gel was incubated in the developer gel solution for approximately 15 minutes. The developer gel was a pre-prepared mixture of 0.036% formaldehyde, and 2.0% sodium carbonate solution. As the individual small proteins were clearly visible, the developer solution was drained out. At this stage the gel was incubated into a 50 mM disodium EDTA solution (1.861g into 100 ml H2O) for 30 minutes. The disodium EDTA solution was used to stop further development of the gel. The gel was rinsed twice with deionised water, and visualised under the UV transilluminator light.
3.5. Analysis of Extracted Surfactant Sample using the Langmuir Trough
The extracted lung surfactant sample in chloroform (Refer to section 3.3.5.) was analysed to determine the changes in surface pressure as a function of molecular area, or reaction time of the lung surfactant under oxygen and when exposed to ozone. Before use the sample was concentrated by removing roughly two-thirds of the chloroform by evaporation under dry nitrogen.
3.5.1. Surfactant Exposed to Oxygen
A total of 46 ml of H2O was transferred into the trough with the addition of 100 µl of the lung surfactant in chloroform. Drops of the extracted surfactant in chloroform were added by touching the surface of the water with a micro syringe, considering 20 µl at a time.
Prior to carrying out the measurement of the surface pressure under the oxygen and ozone conditions, the isotherm of the surfactant monolayer was measured. The barriers speed control was set at 10 cm2/minutes, the isotherm measurement started the surface pressure increased up to 35 mN m-1, and was stopped. The barriers speed control was set to 0 cm2/minutes, after a 5 minutes waiting time, the pressure dropped to 30 mN m-1, the oxygen flow was turned on at a fixed flow rate 1L min-1 through the water bubbler and 2 L min-1 through the ozone generator and the surface pressure measurement was recorded as the film was exposed to molecule oxygen. The surface pressure was monitored continuously.
At the end of the run, the flow was stopped. The sample inside the trough was transferred into a clean glass vial with a glass pipette. The glass pipette was previously cleaned with 20% HCl(aq) as well as three times with deionised water.
The collected fluid mixture was transferred into a glass separating funnel; an equal volume of chloroform was added to the recovered sample. The recovered sample and chloroform was mixed vigorously, and allowed to settle at room temperature for approximately 5 minutes. The organic layer settled at the bottom of the flask, and was transferred into a clean glass vial, run under nitrogen gas for approximately 2 hours in order to evaporate three-quarters of the solvent. After, the sample was kept in the freezer at – 20°C for further analysis such as HPLC and U-Vis. The same procedures were repeated four times.
3.5.2. Surfactant Exposure to Ozone
The extracted surfactant in chloroform was run under oxygen for one hour at two fixed flow rates, (F1) 1 L min-1 and (F2) L min-1 flow rates as described in Figure 1.
At the end of a one hour run exposure to oxygen, the ozone was turned on for a further 4 hours run time. The monolayer was exposed to ozone by continuously flowing a diluted volume of ozone of approximately 0.1 ppm mixed with oxygen at constants flow rate. After the 4 hours of surfactant exposure to ozone, the samples was collected and extracted with chloroform as described in section 3.5.1. The same procedure was repeated 4 times.
The samples were later combined and evaporated under nitrogen gas, where approximately 200 µl of sample mixed with the chloroform solvent was left in the vial, and kept in the freezer at – 20 °C for further analysis.
3.5.3. DPPC surface pressure measurement
1mg/1ml of DPPC was dissolved in chloroform, three-quarter of the solvent was vaporised under nitrogen. The surface pressure of the DPPC was recorded as a monolayer of DPPC was exposed to oxygen, and then exposed to low level of ozone approximately 0.1 ppm in oxygen as described in section 3.5.2.
3.6. Instrumentals Procedures
The extracted surfactant monolayer sample was analysed with the UV-Vis spectrophotometer and the high performance liquid chromatography, HPLC.
3.6.1. UV-Vis Analysis of Extracted Lung Surfactant
The UV-Vis spectroscopy analysis was performed using the Avanti Polar lipids method. (AvantiPolarLipid). The UV-VIS Spectrophotometer was the ThermoSpetronic UV-Vis equipment, and the UV sample cell used was the Quartz QS 1.000.
A 3.0 mg of DPPC was dissolved in 3.0 ml of ethanol/ deionised water (9:1).
1.5 mg of extracted monolayer surfactant exposed for 5 hours of oxygen was dissolved into 2.0 ml of ethanol/ deionised water (9:1) solution. And 1.5 mg of surfactant exposed for 4 hours in ozone was dissolved into 2.0 ml of ethanol/ deionised water (9:1) solution.
The Quartz cuvettes were rinsed three times with the ethanol/ water solvent to eliminate the risk of contamination.
Two Quartz cuvettes were filled with the ethanol solvent/ deionised water (9:1). The cuvettes were placed in the sample cell holder and the reference cell holder to set the base line and run the background. The blank solvent of ethanol/ deionised water (9:1) was removed from the sample cell and filled up to three-quarters full of the DPPC solution using a plastic micro-syringe. The fingerprints on the exterior of the sample cell were wiped out. The cuvette filled with the DPPC sample was placed in the sample cell holder. The DPPC sample was run against the blank solvent. The extracted monolayer surfactants samples were dissolved in ethanol/ deionised water (9:1), and run against the solvent ethanol/ deionised water (9:1).
3.6.2. HPLC Analysis
The HPLC Varian 9050 variable wavelengths UV-VIS Detector and the Varian 9012 solvent delivery system was used at 254 nm wavelength.
3.6.2.1 Reverse Phase HPLC Analysis
The program was setup and the column phenomenex, Jupiter, 5μ C5 300A, size 250×10.00mm 5 micron was cleaned as per manufacturer protocol. The extracted monolayer samples were dissolved into solvent A which is a mixture of 75% Ethanol: 25% water: 0.1% (Trifluoroacetic Acid) TFA. The HPLC analysis was performed by diluting the monolayer sample in three dilution factors, as shown in Table 2.
The sample was filtered with a 200 µm disposal micro filter before analysis.
The method was loaded as described in Table 3. The column was flushed three times; by redrawing approximately 10 ml solvent A via a syringe, the single run options was selected.
The sample was placed on the auto sampler tray, 10 μl of monolayer sample was automatically collected via an auto sampler needle from the bottom of the vial and automatically injected into the HPLC column where the sample was run for 45 minutes. The chromatogram was generated from the computer.
| Stationary Phase | Colum: phenomenex, Jupiter, Carbon 5 |
| Mobile phase | A: 75% Ethanol: 25%water: 0.1%(TrifluoroaceticAcid) TFA
B: Propan-2-ol: 0.1% TFA |
| Sample dilutions | 80% Sample:20% Solvent A,
50% Sample :50% Solvent A, 20% Sample:80% Solvent A |
| Sample | Monolayer surfactant exposed to 5 hours oxygen
Monolayer surfactant exposed to 1 hour oxygen + 4 hours ozone DPPC |
| Injection volume | 10µl |
| Flow rate | 0.5 ml/min |
| Detector | UV at 254 nm |
| Gradients
Total running time 45 minutes |
Time (min) % A |
| 0.0 100%
40 50% 43 0.0% |
Table 2: Reverse phase HPLC analysis condition. Initially the solvent is 100% A, the solvent decreased gradually till it reaches 40 minutes where it is 50% solvent A, and 50% solvent B, and by 43 minutes it is 0% A, 100% B. (an odd programme though).? What do you mean please? I mean why did you slowly increase the %age of B from 0% to 50% overall 40 minutes, and increase it very suddenly from 50% to 100% over 3 minutes.
3.6.2.2 Normal Phase HPLC Analysis
The program was setup as per manufacturer protocol. The mobile phase condition was as described in KNAUER guideline for the determination of phospholipids in lecithin. The mobile phase solvents were degassed with helium for approximately 2 minutes prior analysis. The column was cleaned by manually injecting a volume of 250 μl solvent (I) into 100μl HPLC column loop. The same procedure was performed to clear up the residue impurities attached to the stationary phase. 0.04g of the DDPC sample was diluted into solvent (I) 4ml mixture of (814.2 ml hexane, 170 ml isopropanol, 15 ml acetic acid, and 0.8 ml trimethylamine).
| Stationary phase | Colum: SUPELCOTM LC-SI, 25cm x 4.6mm, 5µm |
| Mobile phase | (I): 814.2 ml hexane, 170 ml isopropanol, 15 ml acetic acid, and 0.8 ml triethylamine
(II): 855.2ml isopropanol, 140 ml deionised water, 15 ml acetic acid, and 0.8 ml triethylamine |
| Injection volume | 250µl |
| Injection loop | 100 µl |
| Flow rate | 1 ml/min |
| Detector | 9050UV-Vis detector at wavelength 254 nm |
| Gradients
Total running time 45 minutes |
Time (min) %A |
| 0.0 100%
25.0 0.0% 35.0 100 % |
Table 3: Normal phase HPLC analysis run condition. Initially the solvent is 100% A, the solvent decreased gradually till it reaches 25 minutes where it is 0% solvent A, and 100% solvent B, and by 35 minutes it is 1000% 100% A, 0% B. (an odd programme though).
Blank Page
VI. RESULTS AND DISCUSSION
4.1. First Part- Evaluating Lab Technique
4.1.1. Isotherm of Cholesterol
The surface pressure of the cholesterol was measured as part of validation for illustrating and understanding the surface pressure required for the present study. The feature of the isotherm of cholesterol exposed on the water sub-phase obtained in the present study is in agreement with the one reported in (Guzmán et al., 2013), (Roy et al., 2018) works. As the monolayer of the cholesterol at the air –water interface is compress, the surface pressure increase, and collapse at π ∼ 45 mN m−1. (Roy et al., 2018), the authors reported an appearance of a kink in the isotherm was noticed at about surface pressure 23 mN m-1, which was mentioned to be a probability of the phase change of cholesterol molecules occurring at 23 mN m-1 surface pressure. However, this was not noticed in the present study.
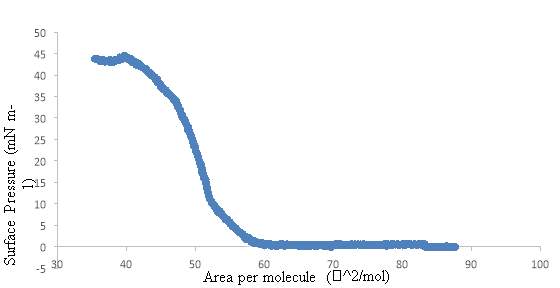
Figure 29: Surface pressure–area isotherms (π) for Cholesterol study by the Langmuir though. The monolayers spread on water sub-phase.
4.2. Second Part – General Concept of the Present Study
To start the experiment, the DPPC at the air-water interface was analysed alone prior to carry out any analysis of the lung surfactant. The isotherm of the DPPC is important for the present study, as DPPC is the major component of lung surfactant. Subsequent, the monolayer of the DPPC and lung surfactant was exposed at the air-water interface to dilute levels of ozone. All changes in the surface pressure was monitored. In addition, the monolayer material was recovered and analysed by UV-visible absorption spectroscopy and HPLC.
Several steps was required for this present study. The first approach was to investigate if the lungs lavage was successful. This step was carried out several times, as it is the most crucial part of the present study. The first trial was unsuccessful, as no protein band was obtained after the SDS-PAGE experiment, the second trial was successful, Refer to section 4.3 for details.
The second important step was to estimate the concentration of the extracted lung surfactant, by running on isotherm. The surface pressure π should reach approximately 45 mN m−1 to have on estimation of the concentration of the extracted sample, this is to allow further analysis required for the present study. As described in section 4.4.2.
4.3. Gel Electrophoresis SDS-PAGE
The objective of the SDS-PAGE experiment was to investigate if the lung lavage was successful; additionally to determine if the extracted material contains the expected surfactant proteins. The result of the obtained protein extracted from the lung surfactant using the clean-up kit is represented in the plot below. Figure 2. The formation of bands was obtained from the analysed samples of the extracted lung surfactant and the protein ladder – precision plus protein dual xtra standards. The ladder sample is the Bio-Rad protein standard prepared with the addition of DTT and SDS Page. The protein staining sample revealed the position of the individual small proteins.
The sizes of the proteins were calculated from the distance, starting from the well where the solutions were loaded, to where the migration stopped. Three bands were observed from the extracted surfactant sample, at 2.7 cm, 3 cm and 3.8 cm from the base line measured. The corresponding bands were 20.7 kDa, 15 kDa and approximately 4 kDa respectively as shown in the plot below Figure 3.
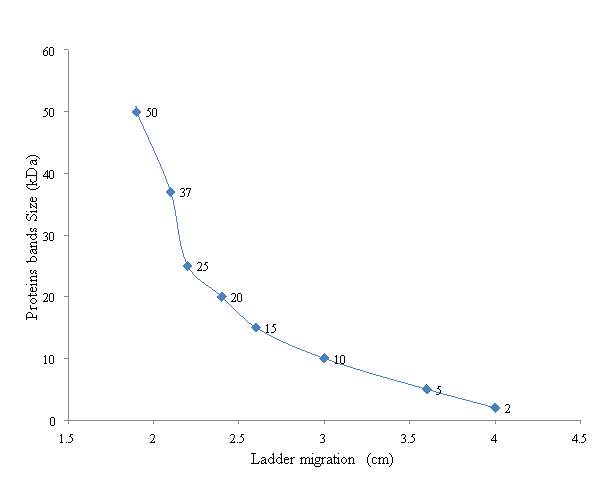
Figure 30: Result of the SDS-PAGE extracted protein surfactant. The plot of the protein bands molecular weight (kDa) over the migration of the protein Ladder (cm)
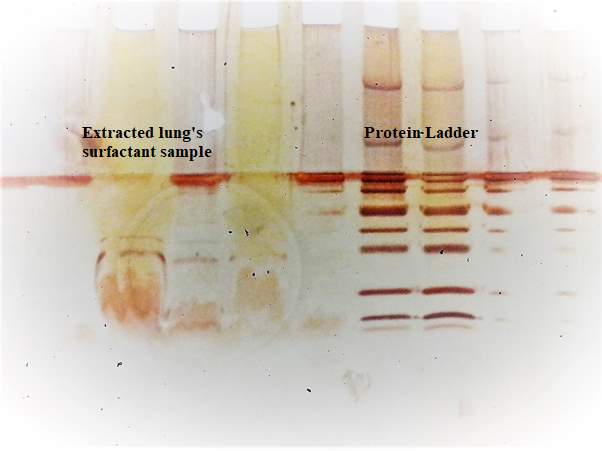
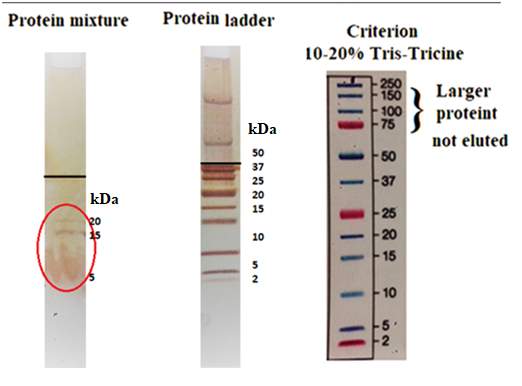
Figure 31: The image shows on the right represent the three bands results from the analysis by the SDS-PAGE, identified as SP-B 20 kDa, 15kDa and SP-C 5kDa. The one in the middle is the bands obtained from the ladder, and the left image if the criterion use for 10-20% Tris-Tricine that was used to identify the protein molecular weight.
The eluted individual small proteins were clearly visible, and compared to the protein ladders sample to identify the two hydrophobic surfactant proteins SP-C and SP-B as shown in Figure 3. There are three bands which eluted down the gel. The band at approximately 20kDa is expected to be of the SP-B, as the surfactant of a mammalian was used in the present study. SP-B present in mammalian surfactant membranes has a molecular weight of 19 kDa. (Ding et al., 2001) There is a band not clearly visible at approximately 5kDa which may be as a result of SP-C, the SP-C is described to be a monomer of molecular weight 4.5 kDa. The SDS was added in the extracted surfactant protein to denature the protein, and the DTT to breaks disulphide bonds. The protein SP-B has some disulfide bond links at the mid sequence of the N-terminal and the C-terminal sections and cannot be disturbed by the addition of the SDS. However, the strong nature of the DTT reducing agent can remove the tertiary and quaternary structure by reducing the disulfide bonds. Additionally, the oligomerisation could have occurred from disulfide bond formation between the cysteine residues of SP-B causing the formation of the 15kDa. (Hawgood, Derrick and Poulain, 1998). As a result of time constraint, no further analysis was performed to investigate whether possible fragmentation or changes in oligomer state of the protein occurred after reaction with ozone.
4.4. Isotherm of DPPC
The pressure area isotherm was used to measure the isotherm of the DPPC at ambient temperature. It’s well known that the shape of the isotherm can slightly vary depending on different experimental factors. In (Duncan and Larson, 2008), the authors established the changes in isotherm of the DPPC that take place when exposed to different temperature at the air-water interface. The authors compare the simulated pressure-area isotherms for DPPC at temperatures ranging between 293.15 K and 323.15 K. it was found that the shape and the position of the isotherms of DPPC where slightly different. The isotherm of the DPPC obtained in the present study yield results that are slightly in agreement with the one reported by (Duncan and Larson, 2008) at 295.15K, as shown in figure 4 on the left.
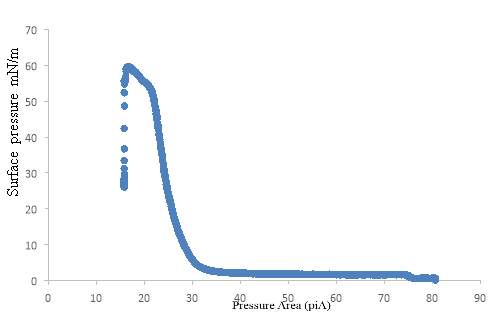
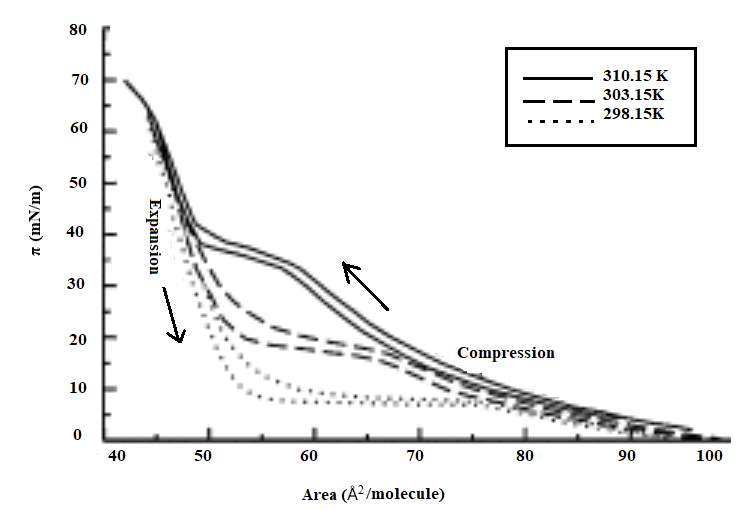
Figure 32: Isotherm of DPPC for the present study in bleu, and bellow is the DDPC isotherm of the experimental results to illustrate the effect of temperature on the shape of compression and expansion pressure-area isotherms of DPPC reported by (Duncan and Larson, 2008).
4.4.1. Isotherm of Extracted Lung Surfactant
As the proteins surfactant of interest was successfully extracted by mean of the SDS-PAGE as show in Figure 3, the remaining extracted protein kept in the freezer was experiment using the trough, to determine the surface pressure as a function of trough area of the extracted lung surfactant. As shown in Figure 5.
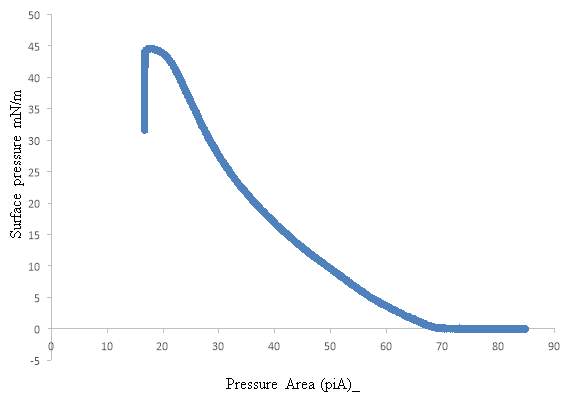
Figure 33: Isotherm of the extracted lung surfactant, representing the plot of the surface pressure over the pressure area, this isotherm was obtained using the Langmuir trough.
The extracted lung surfactant was remains a monolayer up to collapse at 45 mN m-1. At a very low pressure of 2 mN m-1, the extracted lung surfactant monolayer was in a fluid-like liquid-expanded (LE) phase. In the LE phase the phospholipid molecules have a low packing density and the fatty acid chains remain largely disordered at the air water interface, as reported by (Zhang et al., 2011).
4.4.2. Isotherm of DPPC and the Extracted Lung Surfactant
The isotherm of the DPPC is compare to the isotherm of the extracted lung surfactant. In term of the shape comparison, the extracted lung surfactant isotherm differ to the DPPC isotherm. Based on the isotherm study, the DPPC remains a monolayer till it collapse at 60 mN m-1, in contrast the surfactant protein monolayer occurred at an early stage, collapse at a surface pressure 45 mN m-1.
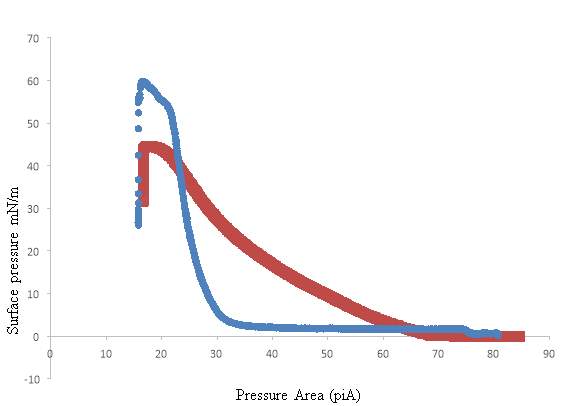
Figure 34: This image represent the compression of isotherms and characteristic film structures of DPPC in bleu and the Isotherm of the extracted lung surfactant in red studied by the Langmuir trough.
4.5. Lung Surfactant Exposed to Oxygen and low level ozone 0.1ppm
After successfully obtaining the isotherm of the extracted lung surfactant. Firstly, the lung surfactant was exposed to oxygen gas at the air-water interface for 5 hours on the Langmuir trough. Secondly, a film of the extracted surfactant sample was deposited at the air-water interface, the monolayer of extracted lung surfactant was exposed to ozone by continuously flowing a diluted volume of ozone of approximately 0.1 ppm mixed with oxygen at constants flow rate flowing at 3 L min–1. The surface pressure of the exposed films at the air-water interface was measured under the Langmuir trough, to determine if the exposure to ozone has an effect on the surface pressure. The extracted lung surfactant mixture was plotted as a function of the trough area rather than the molecular area as the average molecular weight of the lipid-protein natural extracts is not known. As a results, no significant changes were observed in the surface pressure of the extracted surfactant exposure to 5 hours oxygen as shown in Figure 7.

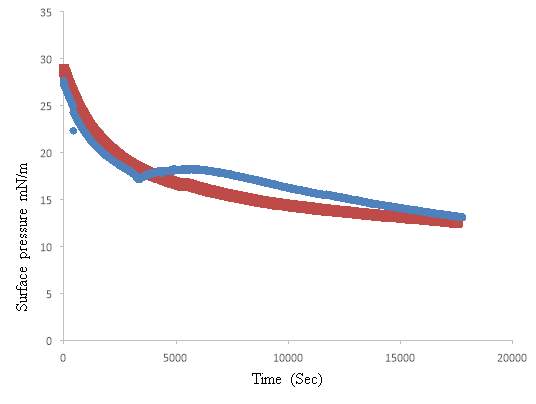
Figure 35: Isotherm of the extracted lung surfactant under oxygen in red, and the isotherm of the extracted lung surfactant under ozone in bleu representing the plot of the surface pressure over the time (sec), this isotherm was obtained using the Langmuir trough.
The surface pressure measurements of the exposure of monolayers pig lung surfactant to oxygen and ozone measurement were recorded when the trough was kept constant at (0 cm2/minutes), the run started at a surface pressure of approximately 35 mN m-1.
For the extracted surfactant expose to oxygen, the surface pressure started dropping gradually from 30mN m-1 to 18mN m-1 over a period of 5 hours, as shown in Figure 7 in red. Moreover, the extracted lung surfactant was firstly exposed to one hour oxygen, follows by 4 hours exposure to diluted ozone 0.1 ppm in oxygen flow. The result of the extracted surfactant to the one hour’s oxygen four hours diluted ozone 0.1ppm exposure shown an initial increase in surface pressure as the ozone was turned on, as shown in Figure 7. The surface pressure was stabilised and continued dropping gradually over the 4 hours exposure period to ozone 0.1ppm; till it reaches a surface pressure of 13 mNm-1. This present study is in agreement with the work reported by (Thompson et al., 2013) when comparing with the obtained results of the POPC exposure to Ozone. The unsaturated lipid 1-palmitoyl-2-oleoyl-sn-glycero-3-phosphocholine, POPC reaction with ozone resulted a rapid loss of the terminal C9 portion of the oleoyl strand of POPC which was accompanied by an increase in the surface pressure of the film at the air−water interface. Moreover, the loss of material from the palmitoyl strand happen in the secondary reaction step. The present study disagree with the work reported by(Hemming et al., 2015) the exposure of peptides to ozone at the air-water interfaces results a rapid decrease in the surface pressure, the author assumption of the SP-B been affected by the ozone exposure, was based on the fact that peptides are made up of residue present in full length SP-B.
There is a high probability that a higher percentage of the surfactant protein SP-B got effected by the exposure to ozone, as the lung surfactant SP-B is more likely to be oxidised compare to the SP-C, due to the primary structure of the SP-B, as reported by (Putman et al., 1997).
DPPC exposed to Oxygen and Extracted lung surfactant exposed to Oxygen
As DPPC is a major component of the lung surfactant, the DPPC was exposed to oxygen, on isotherm of the DPPC was acquired to be compare to the result obtained for the exposure of the lung surfactant to oxygen. The Isotherm of the DPPC is very much similar to the isotherm of the extracted surfactant exposed to 5 hours oxygen as shown in Figure 8. This can be a justification for the present study that the extracted lung surfactant exposed to oxygen was not affect. Moreover, DPPC forms a semi-crystalline monolayer capable of surface tensions near zero during compression, and experience a slow adsorption at the air-water interface and respreads slowly after compression. Reported by (Ding et al., 2001).
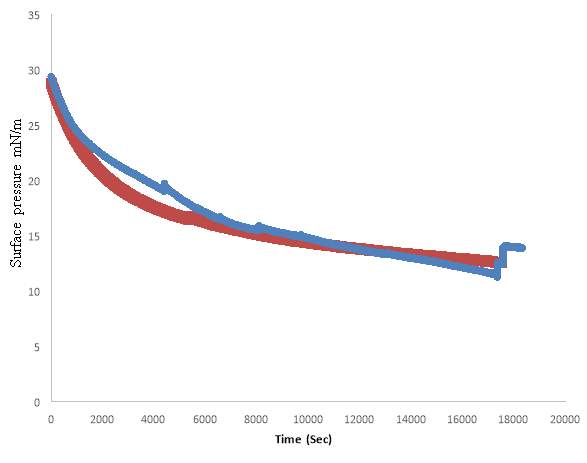
Figure 36: Isotherm of DPPC exposed to oxygen in blue, and the isotherm of the extracted lung surfactant exposed to oxygen in red representing the plot of the surface pressure over time (sec). This isotherm was obtained using the Langmuir trough.
DPPC Exposed to Low Level Ozone 0.1ppm and Extracted Lung Surfactant Exposed to Low Level Ozone 0.1ppm
The DPPC was exposed to low level ozone 0.1ppm, on isotherm was produce and compare to the exposure of extracted lung surfactant to 0.1ppm diluted ozone to confirm the results, that the exposure of the DPPC monolayer to ozone, did not affect the DPPC. As shown in Figure 9. The obtained result of this present study is in agreement with (H. I. Kim et al., 2010). The DPPC is a saturated lipid, and only the unsaturated lipid such as POPG and POPC can experience rapid effect when exposure to low level of ozone. The extensive ozone exposure to unsaturated POPG gradually disappear from the surface of the air-water interface, leaving only DPPG at the interface. (H. I. Kim et al., 2010) (H. I. H. Kim et al., 2010) . Additionally, the lung surfactant gets affected by the ozone exposure despite the presence of the DPPC (Thompson et al., 2013). Isotherms for Phosphocholines after Reaction with 03. Saturated Phosphocholines. DPPC and DSPC were exposed to 30 ppm O3 (7 x 10¹⁴ molecules ~m-~) for 30 min at a surface pressure of 6 dyn cm-‘, respectively. Subsequent compression and expansion of the monolayer showed no significant changes compared to the unexposed films, either on a water subphase or on a low3 N NaOH subphase, respectively.(Lai, Yang and Finlayson-Pitts, 1994)

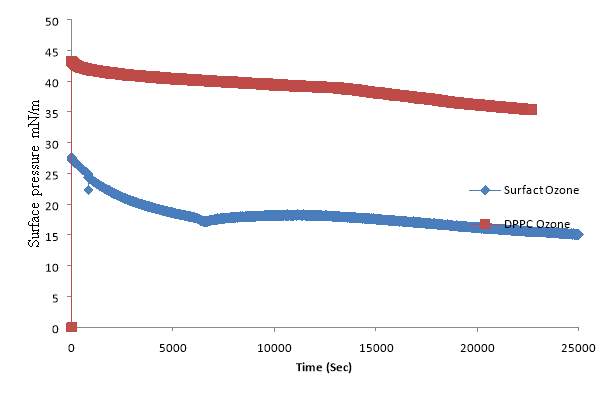
Figure 37: The one in red represent the extracted lung surfactant exposed to ozone 0.1ppm, and the one in bleu is the DPPC exposed to ozone 0.1ppm. The plot of the surface pressure over time (sec), this isotherm was obtained using the Langmuir trough. The blue line is to illustrate the increase of the surface pressure as the ozone was turn on, which is not observe in the Red- DPPC isotherm.
4.6. UV-Vis Results
UV-Vis analysis was performed to observe the change in the absorbance of the extracted surfactant exposed to oxygen, to the extracted surfactant exposed to ozone. The DPPC was used as a control to estimate the extent at which DPPC absorbs at a specific wavelength.
The DPPC was first run alone. The Avanti polar-lipid UV method analysis is generally required for the application of all unsaturated phospholipid, with a percentage oxidation of a phospholipid of approximately 234 nm. The absorbance of the DPPC was required to estimate the absorbance of the recovered lung surfactant material from the trough after the exposure to Oxygen. Additionally, the ethanol was run alone, as all sample were dissolved in the ethanol/ deionised water (9:1), to identify the wavelength of ethanol and to it compare with the absorbance of the DPPC and the recovery material of lung surfactant from the trough. In the present work, the DPPC absorbance was at 215 nm, which is slightly in agreement with the estimated proposed absorbance published in the Avanti polar-lipid data base 234 nm. As shown in Figure 10.
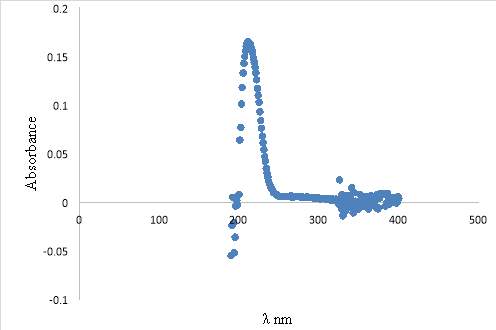
Figure 38: Plot of the absorbance/ λ nm of DPPC. The DPPC was dissolved in ethanol/ deionised water (9:1), analysed by thermoSpetronic UV-Vis equipment using the Avanti Polar lipids method. (AvantiPolarLipid).
The absorbance of the extracted lung surfactant material recovered from the trough after 5 hours oxygen exposure was at 210 nm. Moreover, the extracted lung surfactant material recovered from the trough after 1hour oxygen + 4 hours 0.1ppm ozone exposure presented two absorbance. The first absorbance was at a wide range 205nm to 250 nm resulted from the peak broadening, and the second absorbance at 290 nm, which is suspected to be as a result of ethanol. As shown in Figure 11 in green. The ethanol absorbance was at 2015 nm, 240 nm, and 280 nm. .
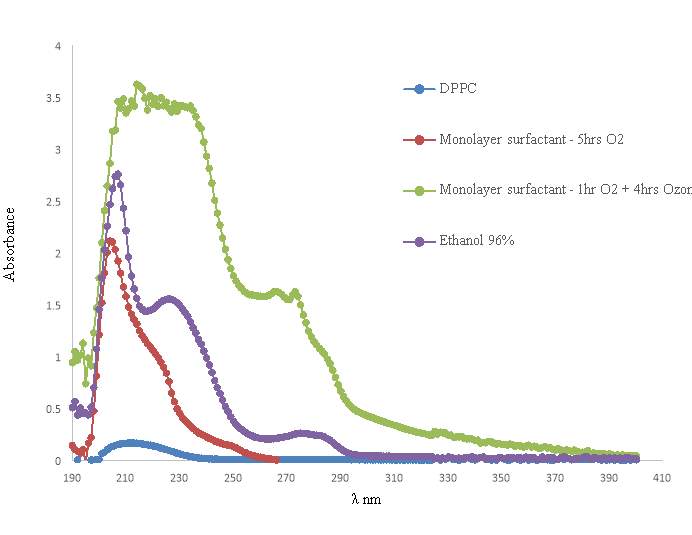
Figure 39: Purple represent the ethanol absorption , green extracted lung surfactant material recovered from the trough after 1hour oxygen + 4 hours 0.1ppm ozone exposure, red the extracted lung surfactant material recovered from the trough after 5 hours oxygen exposure, blue is the monolayer of DPPC. All sample were dissolve in ethanol. The samples were obtained from the ThermoSpetronic UV-Vis equipment using the Avanti Polar lipids method. (AvantiPolarLipid).
The extracted lung surfactant material recovered from the trough should be mainly a composition of lipid substances with a small percentage of protein. Therefore, the AvantiPolarLipid method was used for analysing the extracted surfactant, as ozone can react directly with unsaturated fatty lipids in the epithelial lining fluid and cell membranes, where the product of this reaction is the lipid ozonation. .(Ciencewicki, Trivedi and Kleeberger, 2008)
In the present work, a change in the UV spectrum upon ozone oxidation was observed, this is expected to be as a results of Lipid peroxidation (LPO). As shown in Figure 11 in green. The LPO is when unsaturated fatty acids and lipids are oxidized via free-radical altering the initial products.(Kim and LaBella, 1987). The oxidative modifications to phospholipids strongly depends on the nature of the oxidant. Additionally, the non-radical such as ozone (O3) is known as a highly oxidative agent, which generally originates from endogenous sources by the process of inhaling air pollutants and exposure to radiation. Moreover, ozone also leads to lipid peroxidation through an addition reaction to yield an unstable species that subsequently breaks down via homolytic cleavage reactions.(Reis and Spickett, 2012)
The actual volume of the analysed extracted lung surfactant was not recorded, as the volume was not little and the balance was unstable.
4.7. HPLC Results
For the HPLC analysis, the extracted lung surfactant material recovered from the trough, extracted with chloroform further analysed by HPLC. Three-quarter of the extracted sample was vaporised with nitrogen, and dissolved into the HPLC mobile phase solvent. The sample was analysed under reverse phase HPLC. However, no significant result was obtained from the HPLC analysis for the separation of the monolayer surfactant mixture. Refer to Figure 12, 13.
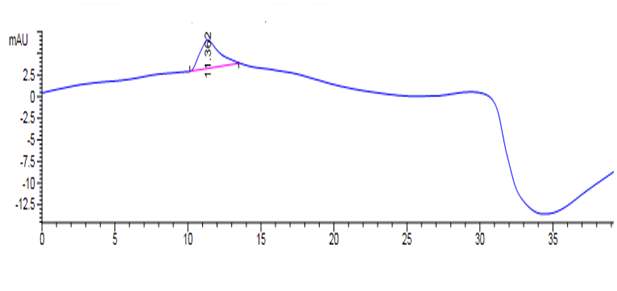
Figure 40: HPLC of DPPC in Chloroform – 200µl of the DPPC was evaporated under nitrogen, only 20 µl was left in the vial, following the 50µl of the mobile phase A: 75% Ethanol: 25%water: 0.1(Trifluoroacetic Acid) TFA was mixed with the sample. Analysed by reverse phase HPLC – HPLC Varian 9050 variable wavelengths UV-VIS Detector and the Varian 9012 solvent delivery system was used at 254 nm wavelength. Column phenomenex, Jupiter, 5μ C5 300A, size 250×10.00mm 5 micron. Elution was performed at a flow rate of 0.5 ml/min.
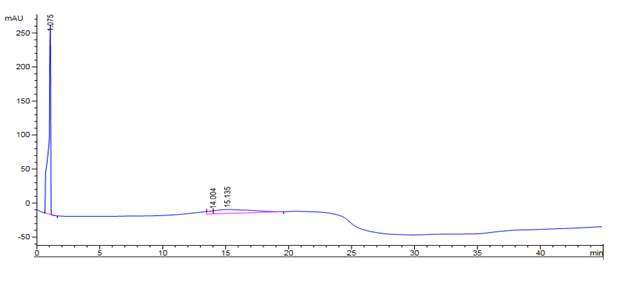
Figure 41: HPLC result of (80:20) dilution of the extracted lung surfactant in chloroform diluter with with mobile phase A- 75% Ethanol: 25%water: 0.1(Trifluoroacetic Acid) TFA. Analysed by reverse phase HPLC – HPLC Varian 9050 variable wavelengths UV-VIS Detector and the Varian 9012 solvent delivery system was used at 254 nm wavelength. Column phenomenex, Jupiter, 5μ C5 300A, size 250×10.00mm 5 micron. Elution was performed at a flow rate of 0.5 ml/min.
The analysed sample has a high affinity to the stationary phase, and did not eluted with the solvent. This result can be justify as the explanation provided in (Brouwers et al., 1998). The Porcine pulmonary surfactant are compose of mainly saturated or mono-unsaturated PC species, which constitute the air–liquid interface in the lung. This makes the phospholipid to be subjected to high concentrations of molecular oxygen. Therefore, the high level of unsaturation makes these phospholipids vulnerable for oxidative damage. Which as results makes is difficult to be characterized by UV-detection, since there is a lack of double bonds in the molecule.
Additionally, DPPC was analysed using the normal phase HPLC, where DPPC .02 g, dissolved in solvent A (Hexane 814ml, Isopropanal170ml, acetic acid 15ml, Triethylamine 0.8 ml) was injected and run under solvent A and B. The results was not reproducible, a minor variation in the chromatogram was observed, as seen in figure 14, 15. In the HPLC analysis of porcine long surfactant reported by (Brouwers et al., 1998), the authors reported that the increase of triethylamine result to an decreases in retention of species on the stationary phase. Moreover, the quantification of the analysed saturated species has remained problematic due to insensitivity of UV-detection, therefore, the light scattering detection is a more preferable despite the problem of it insufficient sensitivity.
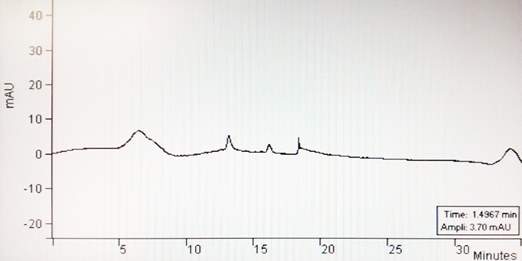
Figure 42: DPPC analysed on reverse phase HPLC, Colum: SUPELCOTM LC-SI, 25cm x 4.6mm, 5µm, (I): 814.2 ml hexane, 170 ml isopropanol, 15 ml acetic acid, and 0.8 ml trimethylamine (II): 855.2ml isopropanol, 140 ml deionised water, 15 ml acetic acid, and 0.8 ml trimethylamine. Elution was performed at a flow rate of 1 ml/min.
4.7.1. UV-VIS of the HPLC sample
The UV-Vis was run on the DPPC sample analysed under the HPLC to determine the extent to which DPPC absorbs at a wavelength available on the HPLC detection system. From the obtained result, there were some DPPC present in the sample, this can confirm the presence of the peak value at a wavelength range 200 – 300 nm.
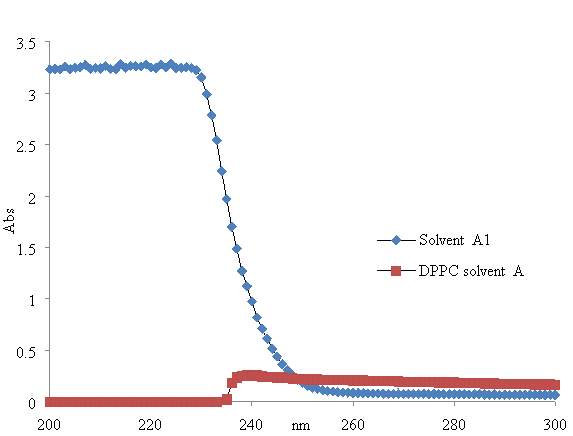
Figure 43: UV-Vis of DPPC. The line in blue represent the UV-Vis absorbance of the solvent A, the absorbance decreased as it reached 240 nm, and the line in red represent the DPPC absorbance which increased from approximately 235 nm.
Blank Page
CONCLUSION
The lung surfactant is major component of lung function, which is crucial to prevent the collapse of the alveoli which may be cause from different pathologies pulmonary, or from the deficiency of surfactant material resulting to high surface tensions. Up-to-date, researches and scientific are still looking on to understand the mechanism of action of the pulmonary surfactant and different functions of surfactant proteins SP-B, and SP-C.
The lung lavage SDS-PAGE is a simple and ideal method for lung extraction. The isotherm of the collected material of the extracted lung surfactant from the Langmuir trough was analysed by UV-Vis, a change in the absorbance of the material exposed to ozone gas 0.1 ppm was observed which is concluded to be as result of oxidative damage of the lipid which resulted the lack of double band. The HPLC was not successful, as the insensitivity of the UV-Vis detector did not favour the analysis.
Despite the fact of knowledge that the extracted lung surfactant exposed to diluted ozone at the air-water interface has on effect on the surfactant, however more impute is still require for the understanding of the mechanisms and kinetics of the lung surfactant molecules when exposed to ozone. Moreover, the structure of the extracted surfactant sample can be further analysed by NMR or MS in order to obtain more information. And the information about the morphology of the monolayer domains can be obtained from visualization techniques such as fluorescence and atomic force microscopy. However, the latter techniques were not provided and was outside the scope of the present study.
Blank Page
REFERENCES
Al-Heglan, M. et al. (2011) ‘NIH Public Access’, Immunology Research, 49(2), pp. 173–191. doi: 10.1016/j.pestbp.2011.02.012.Investigations.
Aly, H., Mohamed, M. A. and Wung, J. (2017) ‘Seminars in Fetal & Neonatal Medicine Surfactant and continuous positive airway pressure for the prevention of chronic lung disease : History , reality , and new challenges’, Seminars in Fetal and Neonatal Medicine. Elsevier Ltd, 22(5), pp. 348–353. doi: 10.1016/j.siny.2017.08.001.
Arick, D. Q. et al. (2015) ‘Effects of nanoparticles on the mechanical functioning of the lung’, Advances in Colloid and Interface Science. Elsevier B.V., 225, pp. 218–228. doi: 10.1016/j.cis.2015.10.002.
Banfi, C. and Agostoni, P. (2016) ‘Surfactant protein B: From biochemistry to its potential role as diagnostic and prognostic marker in heart failure’, International Journal of Cardiology, 221, pp. 456–462. doi: 10.1016/j.ijcard.2016.07.003.
Barrow, A. (2017) ‘Lung ventilation and the physiology of breathing’, Surgery. Elsevier Ltd, 35(5), pp. 227–233. doi: 10.1016/j.mpsur.2017.02.004.
Bernhard, W. (2016) ‘Lung surfactant: Function and composition in the context of development and respiratory physiology’, Annals of Anatomy. Elsevier GmbH., 208, pp. 146–150. doi: 10.1016/j.aanat.2016.08.003.
Bligh, E. G. and Dyer, W. J. (1959) ‘A RAPID METHOD OF TOTAL LIPID EXTRACTION AND PURIFICATION’, Canadian Journal of Biochemistry and Physiology, 37(8), pp. 911–917. doi: 10.1139/o59-099.
Bromberg, P. A. (2016) ‘Mechanisms of the acute effects of inhaled ozone in humans’, Biochimica et Biophysica Acta (BBA) – General Subjects. Elsevier B.V., 1860(12), pp. 2771–2781. doi: 10.1016/j.bbagen.2016.07.015.
Brouwers, J. F. et al. (1998) ‘Quantitative analysis of phosphatidylcholine molecular species using HPLC and light scattering detection.’, Journal of lipid research, 39(2), pp. 344–353.
Carvalheda, C. A., Campos, S. R. R. and Baptista, A. M. (2015) ‘The Effect of Membrane Environment on Surfactant Protein C Stability Studied by Constant-pH Molecular Dynamics’, Journal of Chemical Information and Modeling, 55(10), pp. 2206–2217. doi: 10.1021/acs.jcim.5b00076.
Ciencewicki, J., Trivedi, S. and Kleeberger, S. R. (2008) ‘Oxidants and the pathogenesis of lung diseases’, Journal of Allergy and Clinical Immunology, pp. 456–468. doi: 10.1016/j.jaci.2008.08.004.
CRUTZEN, P. J. (1974) ‘Photochemical reactions initiated by and influencing ozone in unpolluted tropospheric air’, Tellus, 26(1–2), pp. 47–57. doi: 10.1111/j.2153-3490.1974.tb01951.x.
Cruz, A., Casals, C. and Perez-gil, J. (1995) ‘Biochi ~ mic ~ a et Biophysica A ~ ta Conformational flexibility of pulmonary surfactant proteins SP-B and SP-C , studied in aqueous organic solvents’, Science, 1255, pp. 68–76.
Dabkowska, A. P. et al. (2012) ‘The effect of neutral helper lipids on the structure of cationic lipid monolayers’, Journal of The Royal Society Interface, 9(68), pp. 548–561. doi: 10.1098/rsif.2011.0356.
Ding, J. et al. (2001) ‘Effects of Lung Surfactant Proteins , SP-B and SP-C , and Palmitic Acid on Monolayer Stability’, 80(May), pp. 2262–2272.
Dluhy, R. a et al. (2003) ‘Deacylated pulmonary surfactant protein SP-C transforms from alpha-helical to amyloid fibril structure via a pH-dependent mechanism: an infrared structural investigation.’, Biophysical Journal, 85(4), pp. 2417–2429. doi: 10.1016/S0006-3495(03)74665-7.
Dovichi, N. J. et al. (2016) ‘Developing Protocols of Tricine-SDS-PAGE for Separation of Polypeptides in the Mass Range 1-30 kDa with Minigel Electrophoresis System’, International Journal of Electrochemical Science, 11, pp. 640–649. doi: 10.1016/S0165-022X(99)00041-X.
Duncan, S. L. and Larson, R. G. (2008) ‘Comparing experimental and simulated pressure-area isotherms for DPPC’, Biophysical Journal, 94(8), pp. 2965–2986. doi: 10.1529/biophysj.107.114215.
Echaide, M. et al. (2017) ‘Restoring pulmonary surfactant membranes and films at the respiratory surface’, Biochimica et Biophysica Acta – Biomembranes. Elsevier B.V., 1859(9), pp. 1725–1739. doi: 10.1016/j.bbamem.2017.03.015.
Finlayson-pitts, B. J. et al. (1994) ‘Are Changes in Breathing Pattern on Exposure to Ozone Related to Changes in Pulmonary Surfactant?’, Inhalation Toxicology. Taylor & Francis, 6(3), pp. 267–287. doi: 10.3109/08958379408995236.
Fullagar, W. K. et al. (2003) ‘Conformational changes in SP-B as a function of surface pressure’, Biophysical Journal. Elsevier, 85(4), pp. 2624–2632. doi: 10.1016/S0006-3495(03)74685-2.
Goldberg, B. S. J., Allen, H. D. and Sahn, D. J. (1974) ‘Respiratory distress syndrome in the newborn.’, Bmj, 4(5942), pp. 428–429. doi: 10.1136/bmj.4.5942.428.
Gunasekara, L. et al. (2005) ‘Pulmonary surfactant function is abolished by an elevated proportion of cholesterol’, Biochimica et Biophysica Acta – Molecular and Cell Biology of Lipids, 1737(1), pp. 27–35. doi: 10.1016/j.bbalip.2005.09.002.
Guttentag, S. H. et al. (1998) ‘Surfactant protein B processing in human fetal lung’, The American journal of physiology, 275(3 Pt 1), pp. L559-66. Available at: http://ovidsp.ovid.com/ovidweb.cgi?T=JS&PAGE=reference&D=emed4&NEWS=N&AN=1998322707%5Cnhttp://ovidsp.ovid.com/ovidweb.cgi?T=JS&PAGE=reference&D=med4&NEWS=N&AN=9728051.
Guzmán, E. et al. (2013) ‘Mixed DPPC-cholesterol Langmuir monolayers in presence of hydrophilic silica nanoparticles’, Colloids and Surfaces B: Biointerfaces, 105, pp. 284–293. doi: 10.1016/j.colsurfb.2013.01.020.
Halliday, H. L. (2008) ‘Surfactants: Past, present and future’, Journal of Perinatology, 28(SUPPL. 1), pp. 47–56. doi: 10.1038/jp.2008.50.
Hawgood, S., Derrick, M. and Poulain, F. (1998) ‘Structure and properties of surfactant protein B.’, Biochimica et biophysica acta, 1408(2–3), pp. 150–160. doi: 10.1016/S0925-4439(98)00064-7.
Hemming, J. M. et al. (2015) ‘Environmental Pollutant Ozone Causes Damage to Lung Surfactant Protein B (SP-B)’, Biochemistry, 54(33), pp. 5185–5197. doi: 10.1021/acs.biochem.5b00308.
Henry, S. A., Kohlwein, S. D. and Carman, G. M. (2012) ‘Metabolism and regulation of glycerolipids in the yeast Saccharomyces cerevisiae’, Genetics, 190(2), pp. 317–349. doi: 10.1534/genetics.111.130286.
Hidalgo, A., Cruz, A. and Pérez-Gil, J. (2017) ‘Pulmonary surfactant and nanocarriers: Toxicity versus combined nanomedical applications’, Biochimica et Biophysica Acta – Biomembranes. Elsevier B.V., 1859(9), pp. 1740–1748. doi: 10.1016/j.bbamem.2017.04.019.
Hollingsworth, J. W. et al. (2007) ‘Ambient Ozone Primes Pulmonary Innate Immunity in Mice’, The Journal of Immunology, 179(7), pp. 4367–4375. doi: 10.4049/jimmunol.179.7.4367.
Honda, T. et al. (2000) ‘Type II pneumocytes are preferentially located along thick elastic fibers forming the framework of human alveoli’, Anatomical Record, 258(1), pp. 34–38. doi: 10.1002/(SICI)1097-0185(20000101)258:1<34::AID-AR4>3.0.CO;2-7.
Jerrett, M. et al. (2009) ‘Long-Term Ozone Exposure and Mortality’, New England Journal of Medicine, 360(11), pp. 1085–1095. doi: 10.1056/NEJMoa0803894.
Kim, H. I. et al. (2010) ‘Time resolved studies of interfacial reactions of ozone with pulmonary phospholipid surfactants using field induced droplet ionization mass spectrometry’, Journal of Physical Chemistry B, 114(29), pp. 9496–9503. doi: 10.1021/jp102332g.
Kim, H. I. H. et al. (2010) ‘Interfacial reactions of ozone with surfactant protein B in a model lung surfactant system’, J Am Chem Soc, 132(7), pp. 2254–63. doi: 10.1021/ja908477w.
Kim, R. S. and LaBella, F. S. (1987) ‘Comparison of analytical methods for monitoring autoxidation profiles of authentic lipids.’, Journal of lipid research, 28(9), pp. 1110–1117.
Krol, S. et al. (2000) ‘Formation of three-dimensional protein-lipid aggregates in monolayer films induced by surfactant protein B’, Biophysical Journal, 79(2), pp. 904–918. doi: 10.1016/S0006-3495(00)76346-6.
Krüger, P. et al. (2002) ‘Effect of hydrophobic surfactant protein SP-C on binary phospholipid monolayers. Molecular machinery at the air/water interface’, Biophysical Chemistry, 99(3), pp. 209–228. doi: 10.1016/S0301-4622(02)00184-9.
Lai, C. C., Yang, S. H. and Finlayson-Pitts, B. J. (1994) ‘Interactions of Monolayers of Unsaturated Phosphocholines with Ozone at the Air‒Water Interface’, Langmuir, 10(12), pp. 4637–4644. doi: 10.1021/la00024a041.
Lee, K. Y. C. (2008) ‘Collapse Mechanisms of Langmuir Monolayers’. doi: 10.1146/annurev.physchem.58.032806.104619.
Lopez-Rodriguez, E. and Pérez-Gil, J. (2014) ‘Structure-function relationships in pulmonary surfactant membranes: From biophysics to therapy’, Biochimica et Biophysica Acta – Biomembranes. Elsevier B.V., 1838(6), pp. 1568–1585. doi: 10.1016/j.bbamem.2014.01.028.
Lukovic, D. et al. (2006) ‘Production and characterisation of recombinant forms of human pulmonary surfactant protein C (SP-C): Structure and surface activity.’, Biochimica et biophysica acta, 1758(4), pp. 509–18. doi: 10.1016/j.bbamem.2006.03.005.
Malcharek, S. et al. (2005) ‘Multilayer structures in lipid monolayer films containing surfactant protein C: effects of cholesterol and POPE’, Biophysical journal, 88(4), pp. 2638–2649. doi: 10.1529/biophysj.104.050823.
Mason, R. J., Greene, K. and Voelker, D. R. (1998) ‘Surfactant protein A and surfactant protein D in health and disease.’, The American journal of physiology, 275, pp. L1–L13.
McCormack, F. X. (1998) ‘Structure and properties of surfactant protein C’, Biochimica et biophysica acta, 1408(2–3), pp. 161–172. doi: 10.1016/S0925-4439(98)00065-9.
Mudway, I. S. and Kelly, F. J. (2000) ‘Ozone and the lung: A sensitive issue’, Molecular Aspects of Medicine, 21(1–2), pp. 1–48. doi: 10.1016/S0098-2997(00)00003-0.
Nogee, L. M. (1998) ‘Genetics of the hydrophobic surfactant proteins’, Biochimica et Biophysica Acta – Molecular Basis of Disease, 1408(2–3), pp. 323–333. doi: 10.1016/S0925-4439(98)00078-7.
Notter, R. H. et al. (2016) ‘Synthetic lung surfactants containing SP-B and SP-C peptides plus novel phospholipase-resistant lipids or glycerophospholipids’, PeerJ, 4, p. e2635. doi: 10.7717/peerj.2635.
Olmeda, B., Martínez-Calle, M. and Pérez-Gil, J. (2017) ‘Pulmonary surfactant metabolism in the alveolar airspace: Biogenesis, extracellular conversions, recycling’, Annals of Anatomy. Elsevier GmbH., 209, pp. 78–92. doi: 10.1016/j.aanat.2016.09.008.
Parra, E. et al. (2013) ‘Hydrophobic pulmonary surfactant proteins SP-B and SP-C induce pore formation in planar lipid membranes: Evidence for proteolipid pores’, Biophysical Journal, 104(1), pp. 146–155. doi: 10.1016/j.bpj.2012.11.014.
Parra, E. and Pérez-Gil, J. (2015) ‘Composition, structure and mechanical properties define performance of pulmonary surfactant membranes and films’, Chemistry and Physics of Lipids. Elsevier Ireland Ltd, 185(March), pp. 153–175. doi: 10.1016/j.chemphyslip.2014.09.002.
Pérez-Gil, J. (2008) ‘Structure of pulmonary surfactant membranes and films: The role of proteins and lipid-protein interactions’, Biochimica et Biophysica Acta – Biomembranes, 1778(7–8), pp. 1676–1695. doi: 10.1016/j.bbamem.2008.05.003.
Perez-Gil, J. and Weaver, T. E. (2010) ‘Pulmonary Surfactant Pathophysiology: Current Models and Open Questions’, Physiology, 25(3), pp. 132–141. doi: 10.1152/physiol.00006.2010.
Putman, E. et al. (1997) ‘Short-term ozone exposure affects the surface activity of pulmonary surfactant’, Toxicology and Applied Pharmacology, 142(2), pp. 288–296.
Qiao, L. et al. (2015) ‘Oxidative Degradation of the Monolayer of 1-Palmitoyl-2-Oleoyl- sn -Glycero-3-Phosphocholine (POPC) in Low-Level Ozone’, The Journal of Physical Chemistry B, 119(44), pp. 14188–14199. doi: 10.1021/acs.jpcb.5b08985.
Reis, A. and Spickett, C. M. (2012) ‘Chemistry of phospholipid oxidation’, Biochimica et Biophysica Acta – Biomembranes, pp. 2374–2387. doi: 10.1016/j.bbamem.2012.02.002.
Roldan, N. et al. (2016) ‘Effect of Lung Surfactant Protein SP-C and SP-C-Promoted Membrane Fragmentation on Cholesterol Dynamics’, Biophysical Journal, 111(8), pp. 1703–1713. doi: 10.1016/j.bpj.2016.09.016.
Roy, A. D. et al. (2018) ‘Study of cholesterol derivative and phospholipid (DPPC) mixed film using LB technique and FRET: Design of cholesterol sensor’, Sensors and Actuators, B: Chemical, 255, pp. 519–528. doi: 10.1016/j.snb.2017.08.080.
Rugonyia, S., Biswasb, S. and Hallc, S. (2009) ‘The Biophysical Function of Pulmonary Surfactant’, Respiratory physiology & neurobiology, 163, pp. 244–255. doi: 10.1016/j.resp.2008.05.018.The.
Schagger, H. (2006) ‘Tricine-SDS-PAGE’, Nat. Protoc, 1(1), pp. 16–22. doi: nprot.2006.4 [pii];10.1038/nprot.2006.4 [doi].
Selladurai, S. L. et al. (2016) ‘Model Lung Surfactant Films: Why Composition Matters’, Langmuir, 32(41), pp. 10767–10775. doi: 10.1021/acs.langmuir.6b02945.
Serrano, A. G. and Pérez-Gil, J. (2006) ‘Protein-lipid interactions and surface activity in the pulmonary surfactant system’, Chemistry and Physics of Lipids, 141(1–2), pp. 105–118. doi: 10.1016/j.chemphyslip.2006.02.017.
Sheridan, A. J. et al. (2017) ‘Changes to DPPC Domain Structure in the Presence of Carbon Nanoparticles’, Langmuir, 33(39), pp. 10374–10384. doi: 10.1021/acs.langmuir.7b01077.
Smith, L. J. et al. (2010) ‘Normal Development of the Lung and Premature Birth’, Paediatric Respiratory Reviews. Elsevier Ltd, 11(3), pp. 135–142. doi: 10.1016/j.prrv.2009.12.006.
Taneva, S. G. et al. (1998) ‘Method of purification affects some interfacial properties of pulmonary surfactant proteins B and C and their mixtures with dipalmitoylphosphatidylcholine’, Biochimica et Biophysica Acta – Biomembranes, 1370(1), pp. 138–150. doi: 10.1016/S0005-2736(97)00257-5.
Thompson, K. C. et al. (2010) ‘Reaction of a phospholipid monolayer with gas-phase ozone at the air-water interface: Measurement of surface excess and surface pressure in real time’, Langmuir, 26(22), pp. 17295–17303. doi: 10.1021/la1022714.
Thompson, K. C. et al. (2013) ‘Degradation and rearrangement of a lung surfactant lipid at the air-water interface during exposure to the pollutant gas ozone’, Langmuir, 29(14), pp. 4594–4602. doi: 10.1021/la304312y.
Uhlson, C. et al. (2002) ‘Oxidized phospholipids derived from ozone-treated lung surfactant extract reduce macrophage and epithelial cell viability’, Chemical Research in Toxicology, 15(7), pp. 896–906. doi: 10.1021/tx010183i.
Veldhuizen, R. et al. (1998) ‘The role of lipids in pulmonary surfactant.’, Biochimica et biophysica acta, 1408(2–3), pp. 90–108. doi: 10.1016/S0925-4439(98)00061-1.
Walther, F. J. et al. (2000) ‘Surfactant protein B and C analogues.’, Molecular genetics and metabolism, 71(1–2), pp. 342–51. doi: 10.1006/mgme.2000.3053.
Waring, A. J. et al. (2016) ‘Stability of an amphipathic helix-hairpin surfactant peptide in liposomes’, Biochimica et Biophysica Acta – Biomembranes. Elsevier B.V., 1858(12), pp. 3113–3119. doi: 10.1016/j.bbamem.2016.09.014.
Wynalda, K. M. and Murphy, R. C. (2010) ‘Low-concentration ozone reacts with plasmalogen glycerophosphoethanolamine lipids in lung surfactant’, Chemical Research in Toxicology, 23(1), pp. 108–117. doi: 10.1021/tx900306p.
Zaltash, S. et al. (2000) ‘Pulmonary surfactant protein B: a structural model and a functional analogue.’, Biochimica et biophysica acta, 1466(1–2), pp. 179–86. doi: 10.1016/S0005-2736(00)00199-1.
Zhang, H. et al. (2011) ‘Comparative study of clinical pulmonary surfactants using atomic force microscopy.’, Biochimica et biophysica acta, 1808(7), pp. 1832–42. doi: 10.1016/j.bbamem.2011.03.006.
Zhong, L., Lee, C. and Haghighat, F. (2017) ‘Indoor ozone and climate change’, Sustainable Cities and Society. Elsevier B.V., 28, pp. 466–472. doi: 10.1016/j.scs.2016.08.020.
Cite This Work
To export a reference to this article please select a referencing stye below:
Related Services
View all


Related Content
All TagsContent relating to: "Environmental Studies"
Environmental studies is a broad field of study that combines scientific principles, economics, humanities and social science in the study of human interactions with the environment with the aim of addressing complex environmental issues.
Related Articles

DMCA / Removal Request
If you are the original writer of this dissertation and no longer wish to have your work published on the UKDiss.com website then please: