Selecting Business Intelligence Solutions
Info: 10027 words (40 pages) Dissertation
Published: 2nd Nov 2021
Tagged: BusinessInformation Technology
Abstract
Business intelligence (BI) is an architecture intended to gather, explore, analyze, mine and provide access to heterogeneous sources of business data. The article aims to define Business Intelligence, describe the difference between on-premises and cloud BI solutions. Most importantly, the thesis focuses on the identification of selection criteria for those different BI solutions, as a way to help business managers and IT leaders to select tools which fit best with their specific requirements. Although Business Intelligence is widely used in industry, frameworks for choosing a business intelligence tool are rather limited. To do so, the thesis relies on a review of potential selection criteria for BI solutions, and on the empirical evaluation of those criteria based on data gathered from different profiles of BI specialists.
Key words: Business Intelligence, BI, on-premises, cloud, criteria selection, quantitative analysis
1 Introduction
Nowadays, it is important for every company to not only keep its level of competitiveness, but also to increase it. Information technologies are developing at a high pace. The need for flexible access to different types of data and a complex analysis of data is becoming a necessity for every business.
The information systems market offers a variety of choices of solutions that helps organizations to store and analyze information, facilitates decision making in the long-run and stables results. An important part of this market is occupied by Business Intelligence solutions.
Business intelligence (BI) are tools that help users to select the information about the organizations and its surroundings. BI technologies help to treat large amounts of data, focusing only on the key factors and monitoring the results to help in decision-making.
Business Intelligence helps in converting data into knowledge and knowledge in its turn can be transformed into action, which can mean profit for the business.
The aim of this article is to answer the research question which is focusing on the criteria that matter when an organization wishes to implement a new on-premises or cloud BI tool.
In order to meet the goal set above, the following needs to done:
- Study the concept of Business Intelligence
- Define the different types of Business Intelligence used in the industry
- Make an overview of tools and where they are used
- Conduct a study on the criteria that matter for choosing a Business Intelligence tool
The practical implication of the study is the ability for organizations to use a framework that can help them to choose the correct BI tool for their organization.
2 Literature
Across every industry, organizations are on a road to putting data at the centre of business transformation, whether the goal is to better understand customers, build new or better products and services, or to manage costs and risks. (Cloudera, Inc, 2014). Nowadays, information and knowledge represent the fundamental wealth of an organization. Enterprises try to utilize this wealth to gain competitive advantage when making important decisions. (Ghazanfari, Jafari, & Rouhani, 2011) The key is to extract data that the business requires out of a well-documented data landscape, determine the data requirements that will affect the success of the chosen strategy, then profile and correct the data so it is useful for business needs that the later finds critical for its success. (Ladley, 2016)
Data warehouse
According to The Data Warehouse Institute, a data warehouse is the foundation for a successful BI program. It a repository for every company’s data. The data warehouse (Figure 1) gets data from different kind of sources, including the external sources, extraction, transformation and loading (ETL) or from online transaction processing databases (OLTP). When the data is gathered, the BI tools can be used in order to analyze the information.
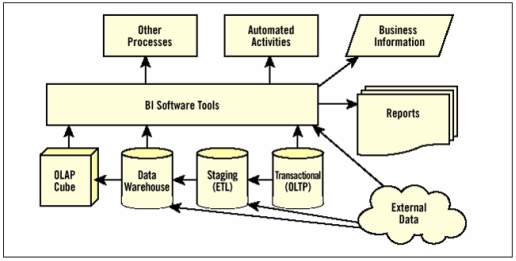
Figure1. Relationship between BI and Data warehousing. Source: Poolet (2007)
When it is needed to design a data warehouse, there are 2 approached that are commonly cited that can be used, the ones of Bill Inmon and Ralph Kimball.
- Bill Inmon’s approach (the top-down design): a normalized data model is created first and the specific data marts are added. This approach minimize data redundancy, as the information from the data model is linked to the data marts in order to created different tables and connections. (Inmon, 2002)
- Ralph Kimball’s approach (the bottom-up design): every data mart is created first which are later combined in order to create a data warehouse. In Kimball’s approach the data is organized following a dimensional model, which consist of a fact table that is then linked to different dimensions. The dimensions data is de-normalized. (Kimball, Ross, Mundy, Thornthwaite, & Becker, 2011)
After a data warehouse is designed the BI software should be chosen. Analysts from BARC, a leading enterprise software industry firm, list the 4 essential steps in the BI selection process. They point out that those 4 steps are essential for a successful fit of a BI tool within an organization:

Figure 2: 4 essential steps in BI selection process. Source: BI Survey (2016)
- Strategy/Goal definition: Before the implementation of any kind of BI systems within an organization, it is firstly needed to have an overall vision of the system and kind of value can it bring to the organization. It is important to understand that a company that wishes to implement a BI tool should not only focus on data collection, but the goal should be to bring value from interpreting the collected data. It should be aligned with corporate objectives of the organization. (Olzak & Ziemba, 2007)
- Requirements Analysis: at this stage it is important to analyze and describe the logical structure of data to be found in the system. The organization should determine what does it expect from the system and those expectations should be quantifiable and detailed. (Dresner, et al., 2002)
- Software Evaluation: the offer of BI tools in the market is rather important and the selection of a tool may be a rather difficult task. In order to select the correct tool, a wide range of criteria should be considered and a framework that can help in choosing a tool might be helpful for an organization.
- Implementation and deployment: this stage of the process focuses on making sure that the BI application is logical and running smoothly. It also involves testing and the making of changes, if necessary.
What is Business Intelligence?
According to Cebotarean (Cebotarean , 2011), business intelligence (BI) refers to computer-based techniques used in spotting, digging-out, and analyzing business data. BI technologies provide historical, current, and predictive views of business operations. BI systems are now used extensively in many areas of business that involve making decisions to create value. BI systems contribute to improvement and transparency of information flows and knowledge management (Kalakota, & Robinson, 1999; Liautaud, & Hammond, 2002; Moss, & Alert, 2003) However, to help BI achieve its full potential, we need to fully understand the processes through which organizations can get value from BI. (Trieu, 2016)
Gartner defines cloud computing as a style of computing where massively scalable IT-enabled capabilities are delivered as a service to external customers using the Internet. “The cloud has been a hot topic for a number of years, with companies moving applications to the cloud for speed to execution, lower costs, and higher level of service and/or preservation of capital”, writes Marc Malizia, CTO of RKON Technologies, a managed cloud solutions provider.Cloud BI, which hosts the software on the Internet, reduce storage costs and make access to organizational data and insights faster and more convenient (Heinze, 2014).
“Cloud computing and business intelligence are an ideal match”, mentions Klipfolio (2017). Business intelligence is about helping the user to understand the data in a shorter amount of time, and cloud computing a quick and easy way of accessing the tool.
Nowadays BI is (almost) analyst driven, as we have arrived to the so-called Big Data movement. The big data revolution and explosion of the Internet left organizations with more data than before. Visualization tools began to evolve to include the end-user even more. More platforms empowered users to complete self-service access, meaning that they could explore and utilize their data on their own, without training (Heinze, 2014). According to a Gartner analyst Doug Laney (2001), Big Data is high-volume, high-velocity and/or high-variety information assets that demand cost-effective, innovative forms of information processing that enable enhanced insight, decision making, and process automation. A recent article by Brown (2015) describes the difference between the BI and big data:” Business Intelligence helps find answers to questions you know. Big Data helps you find the questions you don’t know you want to ask”. The Big Data concept will not be discussed in this article.
The figure 1 below shows the year over year evolution of different BI technologies (mobile and social BI are not part of the research and will not be discussed in the article). The year 2013 serves as a base year and is not represented on the graph. It can be seen that year over year, different technologies emerge and take their place on the market.
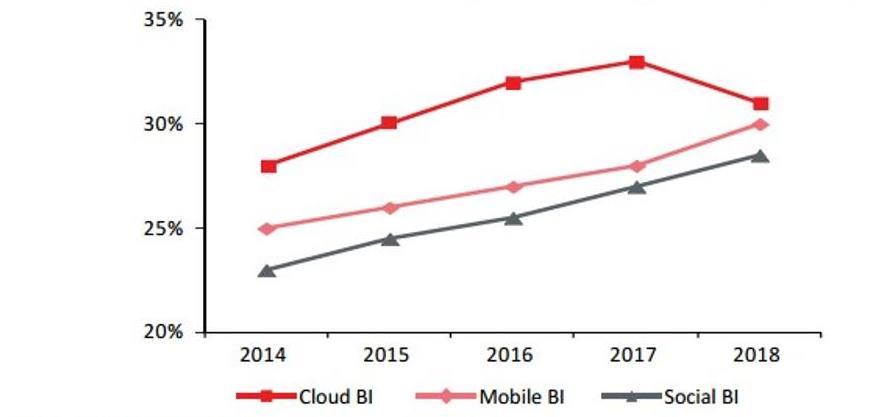
Figure 1. Global business intelligence market by technologies, 2013-2018. Source: (Gartner, Redwood Capital).
Difference between on-premises and cloud BI
Many BI projects require traditional BI implementation. These projects typically require real-time data and connectivity to many different data sources. But there are many other BI projects that require neither real-time data nor the data which comes from different systems that should be connected. Cloud BI can handle these projects quickly and cost effectively, by empowering business users to manage the whole process without IT or external support
A recent survey (Gooddata, 2016) indicates that on-premises (traditional) BI systems are neither flexible nor agile enough to keep pace with online sources that churn out data by the second. The value of real-time data has become clear, forcing BI systems to evolve from complex infrastructure investments toward more agile, cloud-based platforms. Cloud BI is more flexible, easier to scale and, most important, much faster to deploy than ever before. As a result, larger and more obscure data sets can be collected and turned into a jaw- dropping array of raw digital inputs from nearly every internal and external aspect of business.
Overview of tools and where they are used
There is a large number of different BI tools on the market. BARC (2017) made a user review matrix to present the customer experience versus the business value ratio for large international vendors. As we can see form the bellow graph (figure 3), there is an important number of tools in the top right corner, which represent the maximum business value and user experience. Some of the below tools are present in the traditional version of a BI toll as well as in the cloud version. Companies, that develop BI tools tend to develop traditional and cloud solutions more and more, in order to fit the demand of large companies as well as SMB’ (Small and medium businesses).
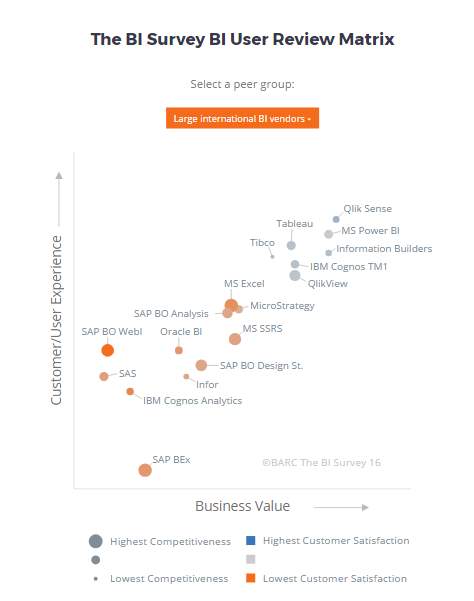
Figure 3: BI vendors. Source: BARC(2017)
Gartner, an information technology research organization, developed the concept of magical quadrant (Figure 4), which differs from the BARC BI user review matrix. We can see 4 types of players in the magic quadrant: the nice players (focusing on small segment or do not perform well), the visionaries (have a good understanding of the market, but do not execute well), the challengers (execute well, but do not have a complete understanding of the market of tomorrow) and the leaders (execute well today & potentially tomorrow).
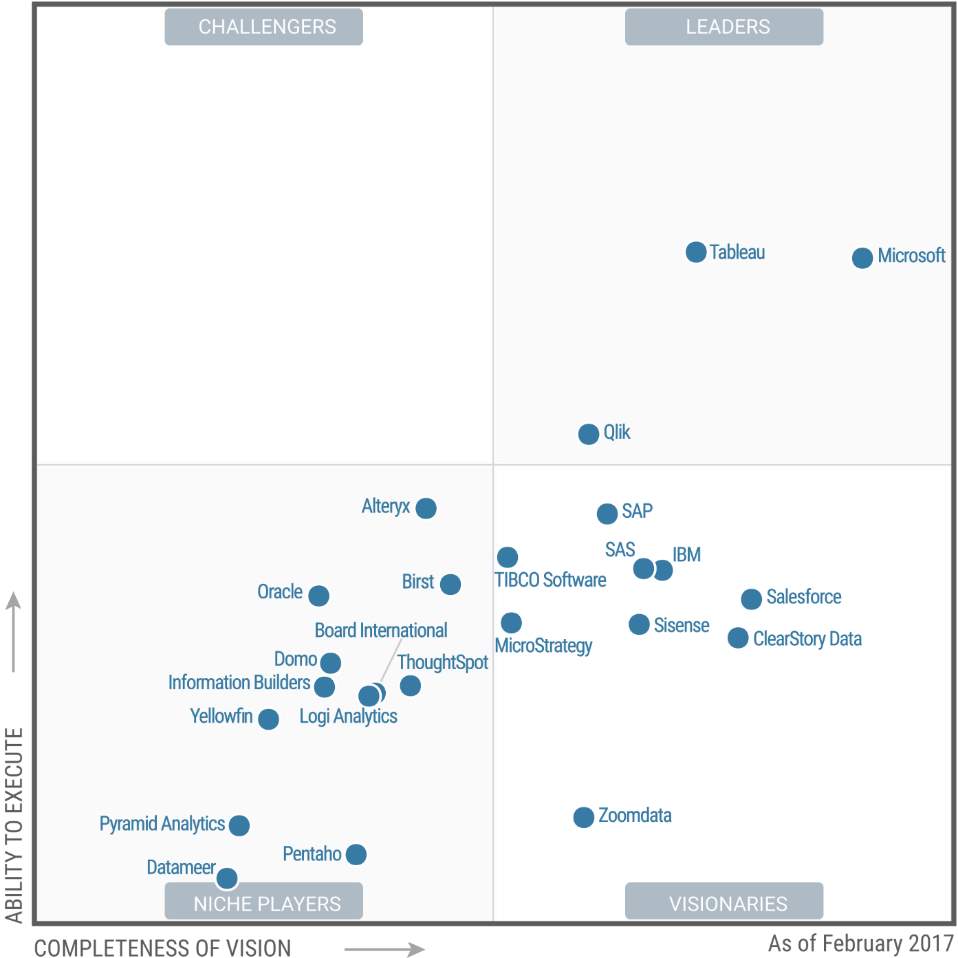
Figure 4. BI Magic Quadrant. Source: Gartner (2017)
According to Willen (2002), BI assists in strategic decision making. The strategic use of BI is characterized by the following:
- Corporate performance management
- Optimizing customer relations, monitoring business activity and traditional decision support
- Packaged standalone BI applications for specific operations or strategies
- Management reporting of business intelligence
Business intelligence tools are used in a variety of ways. BI survey (2016) made an analysis of the widest tasks where BI used in the below graph.
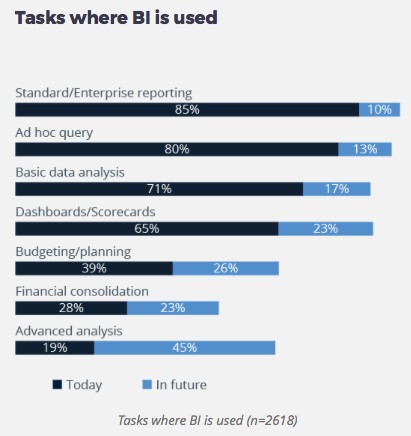
Figure 4: Tasks where BI is used. (Business Application Research Center, 2017)
We can see that companies tend to mostly use BI for the following 4 tasks:
- Standard reporting: collecting data from various data sources and presenting it to end-users in a way that is understandable and ready to be analyzed (Logi Analytics, 2017)
- Ad–hoc query: according to Merriam-Webster Dictionary, ad hoc means “for the particular case at hand without consideration of wider application.” The ad-hoc queries are used when a user needs a deeper understanding of a particular standard report.
- Basic data analytics: according to Gartner, it is “a statistical and mathematical data analysis that clusters, segments, scores and predicts what scenarios are most likely to happen”.
- Dashboards: a combination of data that is analyzed by the BI tool and that shows as an output a consolidated view of metrics and performance of the organization on a single screen. (Hart, 2017)
Criteria for choosing a BI tool
When making a choice on the tool an enterprise would like to use for its business, criterions on which the decision will be made should be chosen. Many different sources list a large number of criteria that are important when an enterprise wants to implement a BI tool into the company.
BARC (2010) lists the criteria based on which the software should be chosen and how to companies actually choose it:
|
Criterion |
How buyers should chose | Difference | How Buyers Chose |
| Fast Performance | 1 | -3 | 4 |
| Proof of concept faster or better | 2 | -4 | 6 |
| Ease of use for developers | 3 | -4 | 7 |
| Ease of Use for end-users | 4 | 2 | 2 |
| Range of server platforms supported | 5 | -13 | 18 |
| Functionality | 6 | 5 | 1 |
| Large data handling capacity | 7 | -4 | 11 |
| Web architecture | 8 | -7 | 15 |
| Availability of local support | 9 | -4 | 13 |
| Scalability | 10 | 1 | 9 |
| Low price | 11 | 6 | 5 |
| Integration with other products in use | 12 | 9 | 3 |
| Vendor reputation | 13 | -3 | 16 |
| Chosen vendor did a better sales job | 14 | -3 | 17 |
| Product reputation | 15 | 3 | 12 |
| Bundled with another product | 16 | 6 | 10 |
| Corporate standard | 17 | 9 | 8 |
| Other | 18 | 4 | 14 |
Figure 5: criteria of choosing a BI tool. Source: BARC (2010)
We can see that companies do not follow the correct order of selection of the criteria selected by BARC. The performance criteria should be the first criteria the company should be looking into, but if fact it is on the fourth. The most undervalued criterion is the range of server platforms supported, by 13 points. This has a potential high influence in the final outcome of the selected tool and hence the benefits that a company would like to achieve using a certain tool that was selected.
3 Data and Method
Data
Most organizations still experience a lack of Business Intelligence (BI) in their decision-making processes when implementing enterprise systems, such as Enterprise Resource Planning (ERP), Customer Relationship Management (CRM), and Supply Chain Management (SCM). (Ghazanfari, Jafari, & Rouhani, 2011) Consequently, a model that helps an organization to decide on a BI solution according to the criteria that matters the most will be a valuable asset.
The basis of the research are the criteria that were chosen by BARC analysts, an annual report based on the world’s largest independent survey of Business Intelligence (BI) and Performance Management users. The survey undertaken for this edition attracted over 3000 responses.
According to a Gartner analyst, Rita Sallam, in 2012, 30% of business users already interacted with business intelligence, in 2014- this figure should have raised up to 50%, and in 2020 – up to 75%. Following the prediction of the very rapid evolution of the BI in the market, the systems evolve over time, hence the requirements for selection may differ. From the below graph (figure 6), it can be clearly seen that cloud services grew very fast as from 2012.
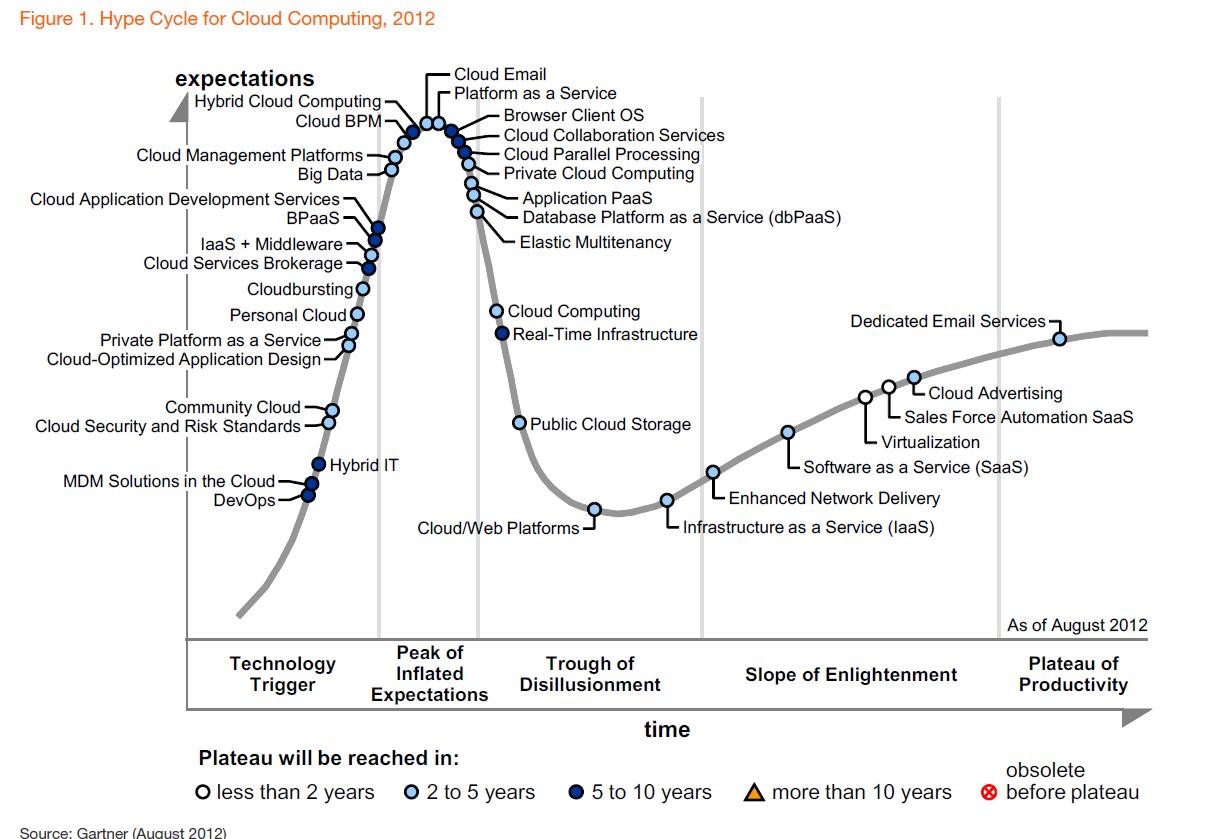
Figure 6: Hype cycle for Cloud Computing (Gartner, 2013)
Following from that, the criteria listed by BARC in 2010 are a good overview of an important amount of criteria that are actually used by companies (even if not in the right order sometimes). On the other side, the BI market has evolved since the time the analysis was made and the cloud BI took a more important share in the market. The BARC analysis does not take into account some key cloud characteristics, as for example, the following:
Upfront costs/maintenance costs: compared to traditional BI, that requires an important upfront investment, cloud BI does not require any upfront costs in order to start using the software. Moreover, no hardware needs to be installed, which leads to even less costs.
Reliability/Security: cloud BI uses different data locators in order to secure the information. Classical BI tools, on the other hand store everything on their own servers.
Flexibility/sharing of information: cloud BI can be accessed quickly and the addition of new features is easier than the traditional versions.
Maintenance: Cloud BI users to not spend any time on making any software updates. The enterprise that is buying the service, also buys the maintenance, hence no additional IT resources are needed in order to maintain the system.
Time-to-value: the time that takes to see results from using a BI tool are seen faster when using a cloud BI rather than an on premises BI tool.
The above-mentioned criteria make the benefits of the cloud outweigh the classical version. But a lot of companies still prefer to turn to the classical version. What is the reason behind this choice and what are the criteria that companies are focusing on now?
Following from the above, the research question of the article is: “Which criteria matter when selecting a tool for a cloud and/or classical BI solution?”
These questions will be answered by means of the analysis of BI experts opinion and knowledge gather by means of a survey.
Method
The research approach of this paper is deduction, i.e. testing a theory.
The research purpose is exploratory, to gain insight about the topic of interest, which is the criteria that matter when choosing a business intelligence tool. This research purpose is used if you want to clarify the understanding of an existing problem.
The research design of the study is the mixed-model research, i.e. the use of quantitative and qualitative data collection techniques and analysis procedures, as well as combining these quantitative and qualitative approaches.
The research strategy used is the survey analysis (by means of questionnaire that is being distributed to a sample of a population). By means of this research strategy it is possible to generate findings that are representative of the whole population at a lower cost and less time than collecting data of the whole population. A survey made in Qualtrics was used to gather results. It consists of 16 questions that gather different type of data. The questionnaire can be found in the Appendix A of this article.
The sampling technique that is used in this research is the stratified random sampling technique. This sample technique is generally used when there are specific subgroup in the population, which is heterogeneous. In order to select samples from every subgroup which is targeted, a simple random sampling technique needs to be used. The population for the research is defined as BI experts. In this population I distinguish 3 different strata’s that I would like to study: end-users, IT/implementation team and the controller/audit team.
According to the central limit theorem, if a sufficiently large sample size is selected, the distribution of sample means will be normally distributed. Usually, in statistics, a large sample size is considered when the number of observations is equal to or greater than 30 observations. (LaMorte, 2017)
The sampling collection is done by distributing the samples to the specifically targeted strata’s by means of different specialized forums about business intelligence, data analytics, cloud data solutions as well as Mastercard internal communication channels.
4 Results
The results of the study are structured in 3 different sections. Firstly, the statistics of the sample are described. Then, the criteria of selection of BI tools are analyzed. Finally, the other characteristics and observations of the sample are listed.
Sample description
The survey that was posted collected 125 completed responses. Firstly, in order to get the most reliable statistics, the results were analyzed and the outliers were deleted. The outlier responses are the ones that do not contribute at all to the research subject. For example if a respondent answered “not applicable”, “I do not know” in most of the questions, I consider that this survey answers should not be part of the analysis, as it can be wrongly interpreted.
The total sample size then consisted of 90 respondents, distributed as in the following figure 7a/b:
| Answer | % | Count |
| IT/Implementation team | 37.78% | 34 |
| Business analyst/ end-user | 45.56% | 41 |
| Controller/ audit team | 4.44% | 4 |
| Other ( please specify) | 12.22% | 11 |
| Total | 100% | 90 |
Figure 7a. Usage profile, in %.
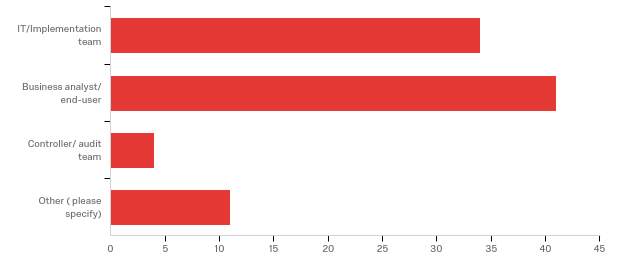
Figure 7a. Usage profile of respondents, graph.
As from figure 7, the audit strata did not collect a sufficient quantity of responses in order to be reliable enough (minimum 30, as outlined in data section). Therefore it will not be analyzed.
The “other” strata consists of respondents that could not identify themselves as the IT team, end-users of BI or as the audit team. Most of the respondents are part of product teams that use BI on an irregular basis, therefore their responses will not be analyzes as well, as they cannot be considered as experts in the BI subject.
The research will focus on the 34 responses from the IT/Implementation team and 41 responses of business analysts/end-users.
The figure 8 represents the usage of BI in the daily activity of respondents. It can be seen that all of the Business analyst (BA) strata respondents answered positively in this case, as opposed to the IT strata.
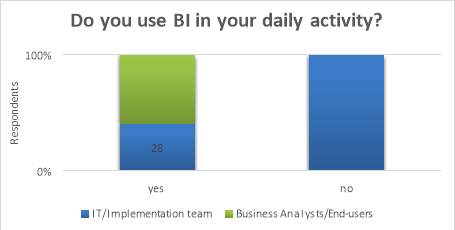
Figure 8. Usage of BI in daily activity
The distribution of skills and the involvement in BI of the sample is very heterogeneous and can be seen from the figures 9 and 10 below.
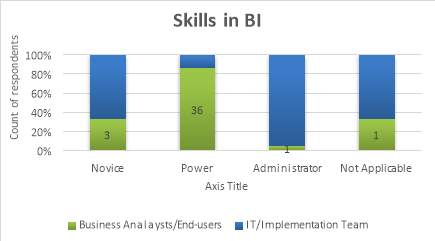
Figure 9. Skills in BI
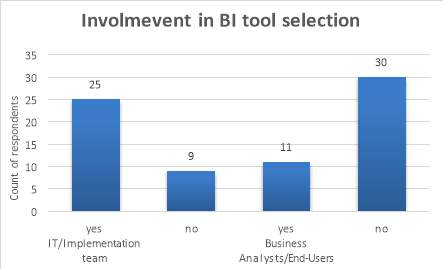
Figure 10.Involvement in BI tool selection
Criteria Selection
Firstly, by looking at the importance of requirement of BI tools, the BA and IT strata’s results are very opposite to each other. The cost, for example, has the upper importance for the IT teams, but BA’s class them as the last important requirement. The full report on the requirement classification can be found in the Appendix B of the article.
| IT | BA | |
| 1 | Cost | Functionality |
| 2 | Performance | Flexibility |
| 3 | Ease of use | Ease of use |
| 4 | Flexibility | Performance |
| 5 | Functionality | Ease of development |
| 6 | Ease of development | Security |
| 7 | Security | Cost |
Figure 11. Importance of Requirements in BI
When we then turn to the distribution of criteria that matter for the respondents, there is no clear trend towards one or another criteria. As predicted, all of the listed criteria are important at some point.
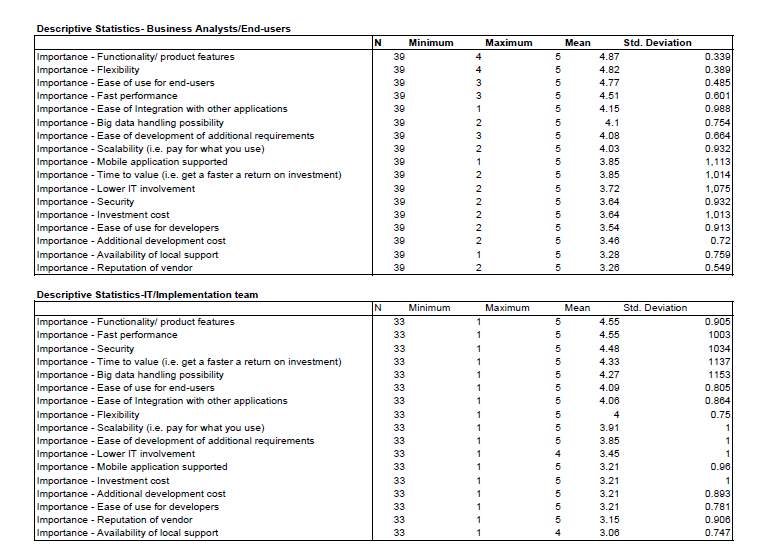
A descriptive statistics analysis is performed on the criteria that matter for business analysts/end users and IT/Implementation team to see the ranking of criteria that matter for both of the analyzed strata’s. The detailed report can be found in appendix B of the article.
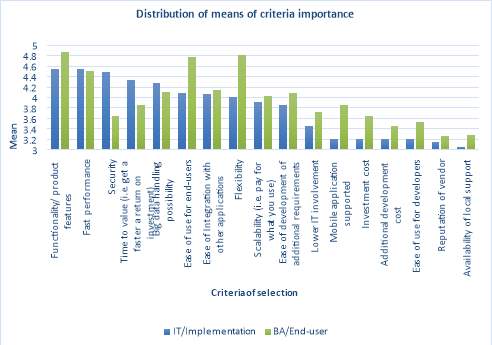
Figure 12. Distribution of means of criteria importance
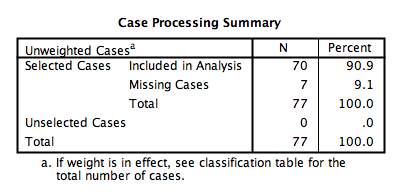
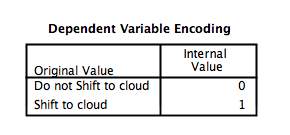
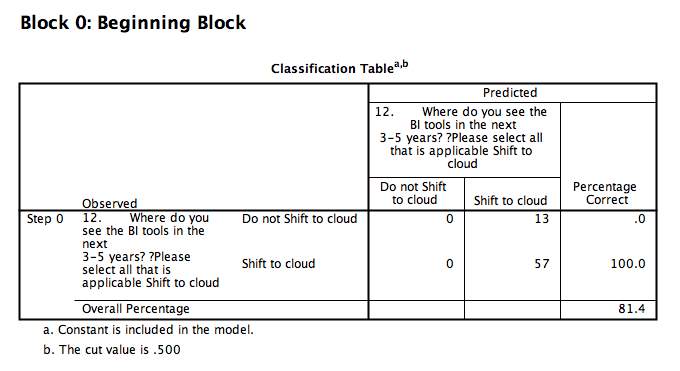
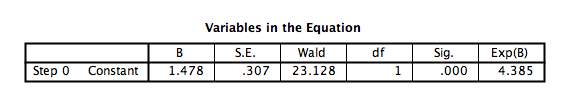
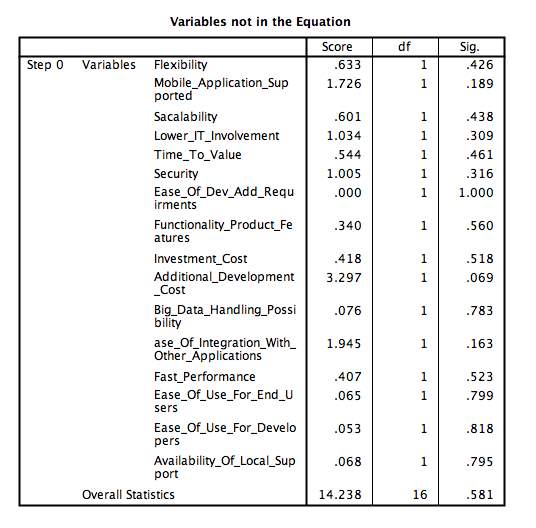
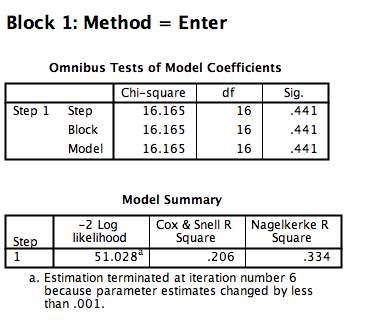
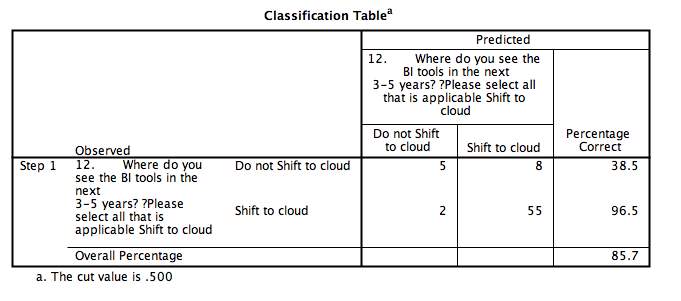
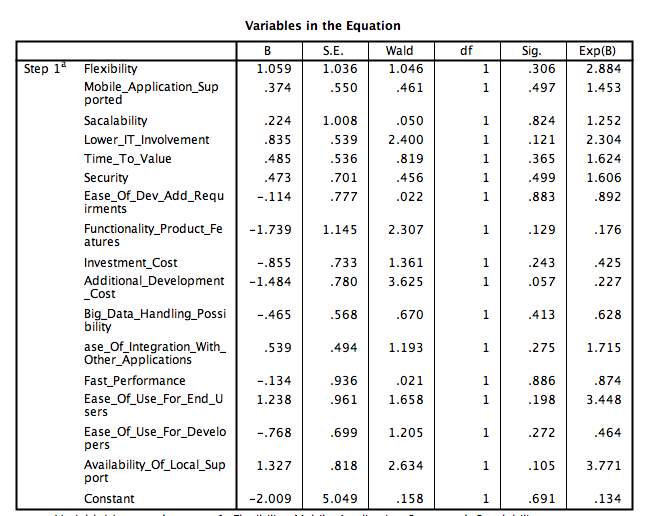
As can be seen from the above figure 12, the choice and importance of criteria for the 2 analyzed strata’s is very different, a binary logistic regression is performed to test the hypothesis that the expertise status can be modeled using the importance criteria. The output of the model can be seen in the Appendix C of this article. The results of the model are not statistically significant and hence will not be discussed in the article.
Other observations
When looking at the distribution of the tools that all of the repondents are using (figure 13), we can see that both cloud and classical BI is used, but the classical versions still outweight.
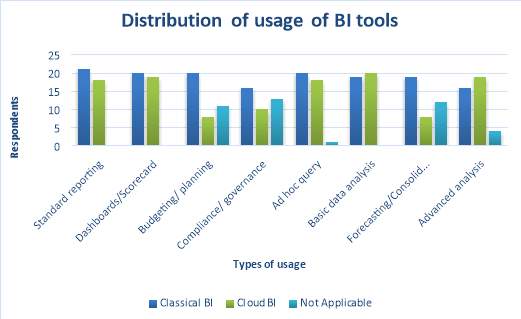
Figure 13. Distribution of usage of BI tools.
More than 80% of respondents think that the organisation is more effective and efficient with the implementation of BI tools as per figure 14 below.
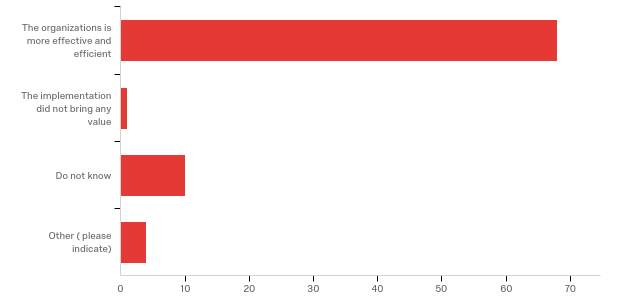
Figure 14. Results from implementing a BI tool in the organization.
When the respondents are asked about the evolution of the IT department, the results are more distributed: the IT team thinks that the IT is (much) more agile and responsive, but the business analysts strata doesn’t know in most of the cases how did the IT evolved. (Figure 15)
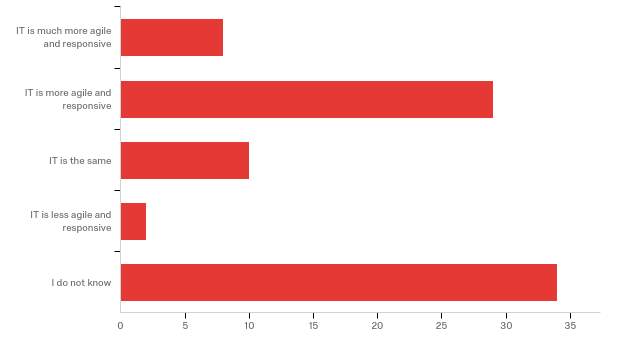
Figure 15. Impact of BI tools on the functioning of the IT department.
Most of the respondents share extracts from BI tools both internally and externally. As per figure 16 we can see that in almost 100% of cases it is easy to share information internally and in almost 94% of cases it is difficult to share the information externally.
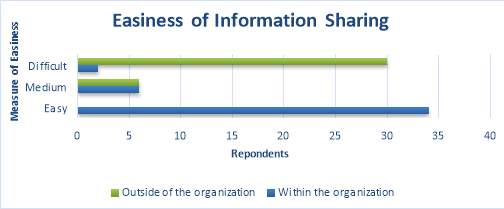
Figure 16. How easy is it to share information from BI tools?
5 Discussion
Business Intelligence is used by different kind of users, which in their turn have variant level of skills. BI systems should be simple and understandable for everyone. As per the above analysis, one of the main disadvantages of the currently used BI systems are the lack of user-friendliness. Organization should achieve a “convenience in analytics”, the analysis and interpretation of data should be easy for the users. It is crucial for the user to interpret the data that is analyzed in a correct way and as fast as possible. Developers of BI tools need to put more attention on this criteria. There are a lot of complex rules and standards in designing BI system. The Law of Least Astonishment is one of the methods one may think about when implementing a new tool, the solution should work in a way that least astonished the user. (Keene, 2008)
The flexibility criteria was listed as one of the main disadvantage of current BI. Most of the respondents are using on-premises BI systems that rank lower in the flexibility criteria compared to the cloud-based solutions. If an organization wishes to increase the flexibility of their tool with the least amount of cost involved, they should turn to cloud based solutions.
The requirements analysis shows how the opinion of the 2 strata’s that are working with the same tool and with each other can differ. Most of the requirements listed are almost opposing each other in the chart presented in the results section. Organizations should turn their attention on the requirements that are most important for the users and the developers of the tool, which the organization is wishing to implement.
When the classification table of BI criteria made me BARC analysts (in 2010) is compared to the one made in this article, some large differences can be seen (table x below).
Firstly, the biggest gaps in the classification are ease of use for developers, ease of integration with other applications and availability of local support. A further analysis of those criteria can be an option for a future research.
Then, some of the criteria that were analyzed (in blue in the table) are not classified. Those relate to the additional criteria that were added and that characterize the criteria that are proper to cloud BI.
| How buyers choose | Criteria of BI | Difference |
| 1 | Functionality/ product features | -3 |
| 2 | Fast performance | 1 |
| 3 | Ease of use for end-users | 0 |
| Flexibility | ||
| 4 | Big data handling possibility | -1 |
| 5 | Ease of Integration with other applications | -4 |
| Time to value (i.e. get a faster return on investment | ||
| Security | ||
| 6 | Scalability (i.e. pay for what you use) | -1 |
| Ease of development of additional requirements | ||
| Lower IT involvement | ||
| Mobile application supported | ||
| 7 | Investment cost | -1 |
| 8 | Ease of use for developers | 6 |
| Additional development cost | ||
| 9 | Reputation of vendor | -1 |
| 10 | Availability of local support | 4 |
Figure 17. Criteria of choosing a BI tool
Lastly, the results have shown that most of the respondents would like to switch to cloud-based techniques in the following years. The criteria table above should be a reference point for the analysis a business would like to perform when deciding to implement a new BI tool.
6 Conclusion
The article aim was to define and explain what does the concept of Business Intelligence mean, where BI tools are based on which criteria the tools should be chosen.
2 strata’s of users were identified by the research, namely Business Analyst/end-users and the IT/Implementation tool. Future research may focus on inclusion of the audit/controlling strata in the research sample population, which was excluded from the analysis in this article.
Overall, a model that presents the criteria that matter when choosing a BI tool was proposed with criteria that are relevant for the 2 different types of BI (on-premises and cloud). However, a qualitative analysis would be needed to further understand the rationale of the choice of the respondents.
The size of the organization was not a part of the research question in this article. The criteria that matter for a small-medium enterprise might differ from the ones for a large enterprise. An analysis of the influence of the size of an enterprise on the criteria that matter when choosing a BI tool is a concept that can be studied in future research.
7 References
- Brown, E. (2015). What’s the difference between Business Intelligence and Big Data? Dataops.
- Business Application Research Center. (2010). The BI Survey 9. Wurzburg.
- Business Application Research Center. (2017, March 1). Bi-Survey.com. Retrieved from http://bi-survey.com/business-intelligence-software-comparison
- Cebotarean , E. (2011). Business Intelligence. Journal of knowledge management, economics and information technology, 1-4.
- Cloudera, Inc. (2014). Enterprise Data Hub: A New Way to Work with Data. Palo Alto, CA 94304, USA.
- Dresner, H., Buytendijk, F., Linden, A., Friedman, T., Strange, K., Knox, M., & Camn, M. (2002). The business intelligence center: An essential business strategy. Gartner Research.
- Gartner. (2013, August). The Gartner Hype Cycle for Cloud Computing 2012. Retrieved from https://origin-wwwfpablog.lexmark.com/uk/2013/01/22/the-gartner-hype-cycle-for-cloud-computing-2012/
- Gartner. (2016, November 29). A roundup of analytics, big data and business intelligence forecasts and estimates 2014. Retrieved from http://www.cloudcomputing-news.net/news/2014/jul/10/roundup-of-analytics-big-data-business-intelligence-forecasts-and-market-estimates-2014/
- Gartner. (2017, February 19). Gartner Gloaasy. Retrieved from Gartner website: http://www.gartner.com/it-glossary/analytics
- Gartner. (2017, April 29). Gartner Magic Quadrant. Retrieved from Gartner: http://www.gartner.com/technology/research/methodologies/research_mq.jsp#
- Gartner. (2017, April 29). IT Glossary. Retrieved from Gartner: http://www.gartner.com/it-glossary/big-data
- Gartner, Redwood Capital. (2014). Sector Report on Business Intelligence. Redwood Capital.
- Ghazanfari, M., Jafari, M., & Rouhani, S. (2011). A tool to evaluate the business intelligence of enterprise systems. Scientia Iranica, 12.
- GoodData. (2016). Understanding Cloud BI. San Francisco.
- Hart, M. (2017, January 21). Microsoft Corporation. Retrieved from Dashboards in Power BI: https://powerbi.microsoft.com/en-us/documentation/powerbi-service-dashboards/
- Heinze, J. (2014, September 26). History of Business Intelligence. Retrieved from History of Business Intelligence: https://www.betterbuys.com/bi/history-of-business-intelligence/
- Inmon, B. (2002). Building the Data Warehouse. John Wiley & Sons.
- Kalakota, R., & Robinson, M. (1999). E-business: Roadmap for success. Addison-Wesley.
- Keene, S. (2008). Reliability, LAw of Least Astonishment and the Interoperability imperative.
- Kimball, R., Ross, M., Mundy, J., Thornthwaite, W., & Becker, B. (2011). The Data Warehouse Toolkit: The Definitive Guide to Dimensional Modeling. John Wiley & Sons.
- Klipfolio. (2017, March 21). What is Cloud Business Intelligence? Retrieved from Klipfolio: https://www.klipfolio.com/resources/articles/what-is-cloud-business-intelligence
- Ladley, J. (2016). Ensuring the quality of ‘fit for purpose’ data. CIO, 4.
- LaMorte, W. (2017, April 11). Central Limit Theorem. Retrieved from The role of Probability: http://sphweb.bumc.bu.edu/otlt/mph-modules/bs/bs704_probability/BS704_Probability12.html
- Laney, D. (2001). Application Delivery Strategies. Stamford: META Group Inc.
- Liautaud, B., & Hammond, M. (2002). E-business intelligence. Turning information into knowledge into profit. New York: McGraw-Hill.
- Logi Analytics. (2017, February 19). Reporting in BI. Retrieved from Logi Analytics: (https://www.logianalytics.com/resources/bi- encyclopedia/reporting-bi/)
- Merriam-Webster Dictionary. (2017, February 19). Merriam-Webster Dictionary. Retrieved from https://www.merriam-webster.com/dictionary/ad-hoc
- Moss, L., & Alert, S. (2003). Business intelligence roadmap – The complete project lifecycle for decision support applications. Addison-Wesley.
- Negash, S. (February 2004). Business Intelligence. Communications of the Association for Information Systems.
- Olzak, C., & Ziemba, E. (2007). Approach to Building and Implementing Business. Interdisciplinary Journal of Information, Knowledge, and Management , 137-139.
- Poolet, M. (2007). Data Warehousing: The Foundation of BI. SQL Server Pro.
- Rangarajan, S. (2017, April 30). Data Warehouse Design – Inmon versus Kimball. Retrieved from The Data Administration Newsletter: http://tdan.com/data-warehouse-design-inmon-versus-kimball/20300
- Trieu, V.-H. (2016, September 24). Getting value from Business Intelligence systems: A review and research agenda. Decision support systems, p. 14.
- Vierkorn, S., Mack, M., Finucane, B., & Witte, T. S. (2010). Organization of Business Intelligence. Wuerzburg: BARC Institute.
- Willen, C. (January 2002). Intelligent Enterprise. Airborne Opportunities, 10-13.
Appendices
Appendix A - Questionnaire
Dear Respondent,
For the purpose of my Master Thesis research at KUL Brussels, which focuses on Business Intelligence (BI), I am kindly inviting you to participate in my online survey.
This questionnaire has been developed to gather feedback regarding the criteria that matter when choosing a Business intelligence tool.
For the purpose of this study, the following definitions are used:
Business Intelligence: the applications, infrastructure and tools, and best practices that enable access to and analysis of information to improve and optimize decisions and performance.
Cloud Business Intelligence: is a delivery model for business intelligence in which applications are typically deployed outside of a company’s firewall at a hosted location and accessed by an end user with a secure Internet connection
The questionnaire should take approximately 5 minutes to complete. Your responses are completely anonymous. I value your honest and detailed responses.
In case you would like to contact me for a more detailed description of my research or any other question, please do not hesitate to reach out to me at:
Thank you in advance.
Best regards,
SURVEY CLOUD AND TRADITIONAL BICRITERIA’S
- Please indicate your place of work
- Mastercard
- Other : ( indicate)
- Please indicate your position and department
- (indicate)
- Do you use Business intelligence in you daily activity? (+insert definition of BI)
- Yes
- No
- How do you characterize your usage profile?
- IT Team
- Business analyst
- Controller/ audit team
- Other : (indicate)
- Not applicable
- On which level of skills of BI do you consider to be?
- Novice
- Power
- Administrator
- Not applicable
- Are you involved in the selection of BI tools?
- Yes
- No
- When choosing a BI software, please class the following requirements from the least important to the most important for you (1 being the least important, 7 being the most important)?
- Functionality ( capabilities of the tool)
- Flexibility (capability of making changes to the capabilities)
- Performance (processing speed and multiple processing).
- Security (including the use of user IDs/password, sharing of information…).
- Cost
- Ease of use (for business users).
- Ease of development (e.g. short learning curve).
- Please class the following requirements of a BI tool according to their importance for you, on a scale from 1 to 6 ( where 1 is the least important, and 5 the most important)
| 1
Strongly not important |
2
Moderately not important |
3
Neutral |
4
Moderately important |
5
Strongly important |
|
| Flexibility | |||||
| Mobile application supported | |||||
| Scalability (i.e. pay for what you use) | |||||
| Low Cost | |||||
| High Cost | |||||
| Lower IT involvement | |||||
| Time to value (i.e. get a faster a return on investment) | |||||
| Security | |||||
| Ease of development of additional requirements | |||||
| Functionality/ product features | |||||
| Investment cost | |||||
| Maintenance cost | |||||
| Big data handling possibility | |||||
| Ease of Integration with other applications | |||||
| Fast performance | |||||
| Ease of use for end-users | |||||
| Ease of use for developers | |||||
| Availability of local support | |||||
| Reputation of vendor | |||||
| Other (indicate): |
- What kind of analytics do you perform with the BI tool?( +definition on premises, cloud)
| Type of analytics | On –premises tool | Cloud | Not applicable |
| Standard reporting | |||
| Dashboards/Scorecard | |||
| Budgeting/ planning | |||
| Compliance/ governance | |||
| Ad hoc query | |||
| Basic data analysis | |||
| Financial consolidation/Forecasting | |||
| Advanced analysis |
- What are the 3 biggest barriers for implementation a BI tool according to you in your organization? ( i.e why wouldn’t you implement a BI tool in your organization?)
- Cost
- Security
- No need
- Integration within company ( feed with other systems)
- Data privacy
- Lack of skilled personnel
- Lack of executive support
- Flexibility
- Scalability
- Corporate policy
- Other: ( indicate )
- What are the 3 biggest disadvantages of the tool you are currently using?
- Cost
- Security
- No need
- Integration within company ( feed with other systems)
- Data privacy
- Lack of skilled personnel
- Lack of executive support
- Flexibility
- Scalability
- Corporate policy
- Other: ( indicate )
- Where do you see the BI tools in the next 3-5 years? –Please select all that is applicable
- Use the same amount of BI
- Implement new BI tools
- Shift to on-premises
- Shift to cloud
- NA
- What results have you seen from implementing a BI tool in your organization?
- The organizations is more effective and efficient
- The implementation did not bring any value
- I do not know
- Has the adoption of BI made your IT department more agile and responsive?
- IT is much more agile and responsive
- IT is more agile and responsive
- IT is the same
- IT is less agile and responsive
- I do not know
- Do you share extracts from BI tools to external parties (not within your organization)?
- Yes
- No
- How easy it is to share information internally and/or externally that is extracted from the BI tool you are using?
| Easy
(no manipulations needed) ex: share a link and share |
Medium
( requires minimum manipulations) ex: download ready report and share |
Difficult
( requires manipulations) ex: download+ transform before sharing |
Not applicable | |
| Internally | ||||
| Externally |
Appendix C - Requirements of BI tools
- Business analysts/end users
| # | Question | 1 | 2 | 3 | 4 | 5 | 6 | 7 | Total | |||||||
| 1 | Functionality ( capabilities of the tool) | 79.49% | 31 | 7.69% | 3 | 2.56% | 1 | 0.00% | 0 | 0.00% | 0 | 2.56% | 1 | 7.69% | 3 | 39 |
| 2 | Flexibility (capability of making changes to the capabilities) | 2.56% | 1 | 66.67% | 26 | 10.26% | 4 | 5.13% | 2 | 7.69% | 3 | 7.69% | 3 | 0.00% | 0 | 39 |
| 3 | Performance (processing speed and multiple processing). | 5.13% | 2 | 2.56% | 1 | 12.82% | 5 | 71.79% | 28 | 2.56% | 1 | 5.13% | 2 | 0.00% | 0 | 39 |
| 4 | Security (including the use of user IDs/password, sharing of information…). | 0.00% | 0 | 7.69% | 3 | 10.26% | 4 | 5.13% | 2 | 5.13% | 2 | 66.67% | 26 | 5.13% | 2 | 39 |
| 5 | Cost | 10.26% | 4 | 2.56% | 1 | 0.00% | 0 | 10.26% | 4 | 10.26% | 4 | 2.56% | 1 | 64.10% | 25 | 39 |
| 6 | Ease of use (for business users). | 0.00% | 0 | 12.82% | 5 | 64.10% | 25 | 5.13% | 2 | 5.13% | 2 | 12.82% | 5 | 0.00% | 0 | 39 |
| 7 | Ease of development (e.g. short learning curve). | 2.56% | 1 | 0.00% | 0 | 0.00% | 0 | 2.56% | 1 | 69.23% | 27 | 2.56% | 1 | 23.08% | 9 | 39 |
- IT/Implementation team
| # | Question | 1 | 2 | 3 | 4 | 5 | 6 | 7 | Total | |||||||
| 1 | Functionality ( capabilities of the tool) | 12.90% | 4 | 6.45% | 2 | 3.23% | 1 | 0.00% | 0 | 61.29% | 19 | 9.68% | 3 | 6.45% | 2 | 31 |
| 2 | Flexibility (capability of making changes to the capabilities) | 3.23% | 1 | 6.45% | 2 | 9.68% | 3 | 61.29% | 19 | 9.68% | 3 | 6.45% | 2 | 3.23% | 1 | 31 |
| 3 | Performance (processing speed and multiple processing). | 3.23% | 1 | 58.06% | 18 | 3.23% | 1 | 9.68% | 3 | 16.13% | 5 | 6.45% | 2 | 3.23% | 1 | 31 |
| 4 | Security (including the use of user IDs/password, sharing of information…). | 6.45% | 2 | 3.23% | 1 | 9.68% | 3 | 12.90% | 4 | 3.23% | 1 | 6.45% | 2 | 58.06% | 18 | 31 |
| 5 | Cost | 58.06% | 18 | 6.45% | 2 | 9.68% | 3 | 6.45% | 2 | 0.00% | 0 | 3.23% | 1 | 16.13% | 5 | 31 |
| 6 | Ease of use (for business users). | 9.68% | 3 | 9.68% | 3 | 54.84% | 17 | 6.45% | 2 | 9.68% | 3 | 6.45% | 2 | 3.23% | 1 | 31 |
| 7 | Ease of development (e.g. short learning curve). | 6.45% | 2 | 9.68% | 3 | 9.68% | 3 | 3.23% | 1 | 0.00% | 0 | 61.29% | 19 | 9.68% | 3 | 31 |
Appendix B – Descriptive statistics of Importance Criteria
Appendix C – Binomial Logistic Regression
Cite This Work
To export a reference to this article please select a referencing stye below:
Related Services
View all


Related Content
All TagsContent relating to: "Information Technology"
Information Technology refers to the use or study of computers to receive, store, and send data. Information Technology is a term that is usually used in a business context, with members of the IT team providing effective solutions that contribute to the success of the business.
Related Articles

DMCA / Removal Request
If you are the original writer of this dissertation and no longer wish to have your work published on the UKDiss.com website then please: