Fungal Biodiversity: Zygomycetes Associated with Plant Roots
Info: 10411 words (42 pages) Dissertation
Published: 12th Dec 2019
Tagged: Environmental Science
Fungal Biodiversity: Zygomycetes Associated with Plant Roots in the New Jersey Pine Barrens
Abstract
Due to the significant lack of our knowledge regarding the fungal kingdom, it is pivotal to environmental scientists and plant growers alike to study the population and evolutionary biology of fungal species, particularly those associated with native plants such as switchgrass and mountain laurel, in order to close the gaps that exist in our understanding of the fungi kingdom. One of our current projects involves zygomycetes, which are a group of fungi commonly known as the fast growing molds on strawberries and other sugary fruits. While morphology and physical traits are well-known about zygomycetes, not much is known about the molecular phylogeny of these fungi. Here, we distinguish where the zygomycete group falls within the fungal phylogenetic tree. Our end goal is to determine whether our collected zygomycete samples belong to an existing fungal genus or are part of a new clade, which would indicate that they are new species within zygomycete clade.
After collecting various grassroot, mountain laurels, and pine samples from different locations, we isolated and subcultured fungI, extracted DNA, and performed PCR using various common and specific fungal primers. Using FinchTV and fungal reference sequences from NCBI’s GenBank, we compared our sample sequences and made a fungal phylogenetic tree using MEGA6. We also conducted enzyme interaction and plant interaction tests to determine their possible function in their natural environment.
After studying and analyzing the collected fungal isolates, it can be suggested that some of the isolates form a completely different genus within Zygomycota based on DNA analysis. Furthermore, the remaining isolates can be characterized as a different clade within the family Umbelopsis within Zygomycota.
Introduction
Of the few kingdoms of life forms, the kingdom of Fungi is studied the least of any other, yet it is the second largest kingdom. An estimated 5.1 million species of fungi exist and are involved in vital processes in the environment, such as decomposition and plant pathogenesis. And yet, after almost two centuries of active research, only about 10% of fungal species have been described by scientist and researchers. Therefore, it is important to study the population and evolutionary biology of fungal species in order to close the gaps that exist in our understanding of fungal species and their functions. One of the current research objectives that I am working on in the lab is the identification of zygomycetes associated with healthy plant roots from the New Jersey Pine Barrens.
Oommycota and True Fungi
In recent years, there has been a divide in the Fungal phylogenetic tree with Oomycota being considered as ancestral clade of what are now known as True Fungi. Oomycota consists of more than 800 saprobic or parasitic species to land or aquatic animals and plants (Rossman and Palm 2016). Some species within the Oocmycota have been known to cause plant diseases such as Phytophthora infestans, which caused the potato blight in Ireland, while others, such as Saprolegniales, or water molds, cause diseases of fish and other aquatic animals. The Oomycota are considered fungi because their morphological traits are similar to true Fungi, such as nutrient intake via absorption and the presence of mycelium, or filamentous threads characteristics of many fungi (Rossman and Palm 2016). After further studying them, it was found by researchers that Oomycota was a distinct group based on various unique characteristics.
One of the unique characteristics is how members of Oomycota undergo sexual reproduction. All members undergo oogamous reproduction in which diploid oospores are produced as zygotes after fertilization of haploid oospheres by haploid gametes, whereas true fungi do not produce oospores (Rossman and Palm 2016). For true Fungi, sexual reproduction leads to the production of zygospores, ascospores, or basidiospores, depending on which clade of true fungi the species is from. Another differentiating characteristics is the presence and type of flagella on zoospores. Members of the Oomycota produce motile zoospores with two different types of flagella, one known as whiplash flagellum located posteriorly and the other known as tinsel flagellum, which has a fibrous, ciliated structure and is located anteriorly (Figure 1) (Rossman and Palm 2016). True Fungi, on the other hand, don’t typically have stages with motile zoospores and therefore do not have flagella. For those true Fungi that do, such species within the Chytridiomycota, their flagella are only the posterior whiplash type. Yet another major difference is the nuclear state of vegetative mycelium. In members of the Oomycota, the vegetative cells generally consist of coenocytic hyphae, or hyphae without without cross-walls known as septa, containing diploid nuclei (Rossman and Palm 2016). In true Fungi, by contrast, most of the mycelium is divided into cells by cross-walls, with each cell containing one or more
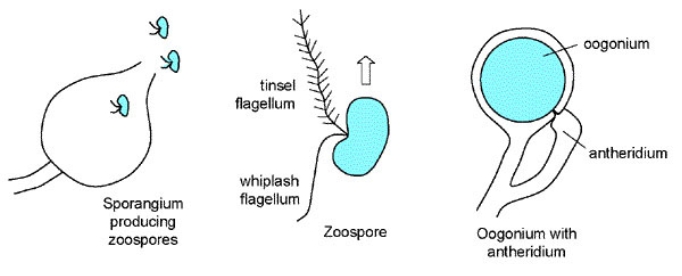
Figure 1: Diagram of the two flagella present in Oomycota (Rossman and Palm 2016).
haploid nuclei. One exception are species within the Zygomycota, which are true Fungi with haploid nuclei and also produce coenocytic hyphae like oomycetes. Cell wall composition is also different between Oomycota and true Fungi, with Oomycota cell walls composing of beta glucans and cellulose while true Fungi consisting of chitin (Rossman and Palm 2016).
Fungal Phylogeny
Historically, four fungal phyla, the Ascomycota, Basidiomycota, Glomeromycota, Chytridiomycota, and Zygomycota have been recognized, which comprise the so-called true “Fungi.” As mentioned previously, Chytridiomycota are characterized by the formation of motile spores with a posterior flagellum and are considered to be basal to the other fungal phyla, as flagellated cells appear to be a primitive characteristic in eukaryotes (Tanabe et al. 2004). The relatively simple morphological characters of Zygomycota, such as a coenocytic, or aseptate, mycelium and simple conjugation as a sexual process suggest that the Zygomycota is basal to two derived phyla, the Ascomycota and Basidiomycota. Consistent with this hypothesis, molecular phylogenetic studies based on the nuclear small subunit ribosomal DNA (nSSU rDNA) have indicated that the basal fungi (Chytridiomycota and Zygomycota) diverged earlier than the Ascomycota and Basidiomycota. However, analyses based on nSSU rDNA and entire mitochondrial genome sequence consistently recovered a polyphyletic Chytridiomycota nested within the Zygomycota, in which the Blastocladiales are distantly related to the other four orders of Chytridiomycota. These results suggest that the Chytridiomycota and Zygomycota are not natural taxa, indicating that higher-level phylogenetic relationships within the Fungi still need to be resolved (Tanabe et al. 2004).
Zygomycota
Members of the Zygomycota have been considered a primitive and early diverging lineage of the Fungi because they lack complex fruiting structures, which are structures that contain spores for reproduction, and most representatives have coenocytic aseptate hyphae, tiny, thread-like structures that make up most of the fungi, during all or part of their life cycle. Zygomycota often might be overlooked by mycologists due to their subtle nature, but they can be encountered in environments as near as the kitchen, disguised as moldy bread or fruit. Some are beneficial, such as Rhizopus, used in several traditional fermented foods, including tempeh and cassava. Most species of the Zygomycota are saprobic, or natural decomposers, but some species are facultative pathogens of plants, animals (including humans) or even other fungi. Indeed members of the Zygomycota are ubiquitous in nature, in a seemingly endless variety of interactions (White et al. 2006).
Zygomycota Phylogeny
Currently, the phylum Zygomycota is comprised of nine orders: Asellariales, Dimargaritales, Endogonales, Entomophthorales, Harpellales, Kickxellales, Mortierellales, Mucorales and Zoopagales. Recent nSSU rDNA analyses have demonstrated that the Amoebidiales that was formerly assigned to the Zygomycota were excluded from the Zygomycota, rather should be included in the Mesomycetozoa (White et al. 2006). Traditionally, the four endocommensal orders (including the Amoebidiales) have been classified within the class Trichomycetes, whereas the remaining six orders were placed within a second class, the Zygomycetes. However, both ultrastructural study and molecular phylogeny do not validate this taxonomic scheme (Tanabe et al. 2004). The clades defined by this ordinal classification
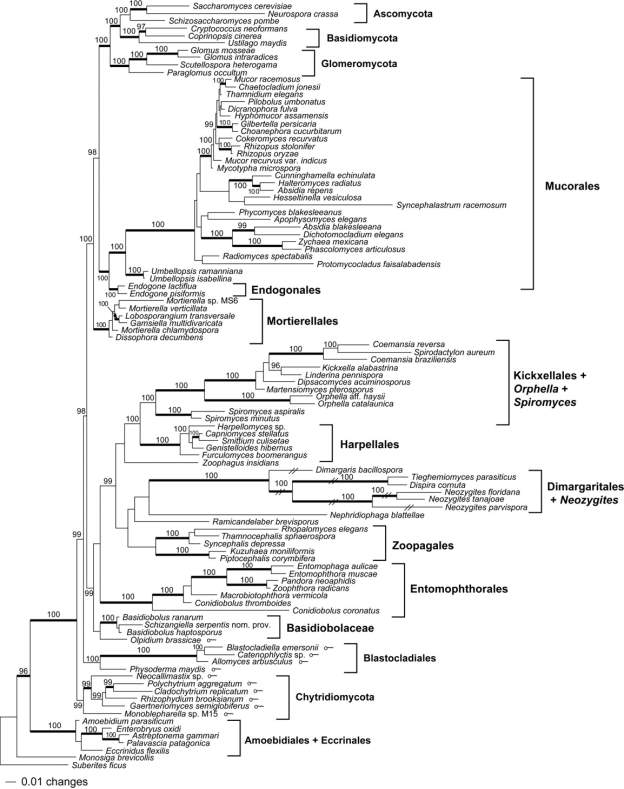
Figure 2: Phylogeny of Zygomycota based on rRNA operon (18S + 28S + 5.8S genes) (White et al., 2006).
correspond in large part with niche and habitat, as well as mode of asexual and sexual reproduction. Many species are saprophytic in soil and dung (Mucorales, Mortierellales and Kickxellales). Some (Mucorales) are extremely fast growing in agar culture while others (Zoopagales and Entomophthorales) may be slower growing reflecting their parasitic strategy on various small animals, including insects, rotifers or even amoebae. Members of Zoopagales, Dimargaritales and Mucorales may be parasitic on other fungi (including mushrooms, as well as other zygomycetes). Trichomycetes (Harpellales and Asellariales) have specialized flagellum for arthropod gut wall attachment. Some Harpellales are remarkable in their ability to shift from a commensalistic to parasitic mode for dispersal. Other parasitic groups have invasive haustoria (Dimargaritales and Zoopagales) or grow as naked protoplasm inside the host cell wall where they are in direct contact with the invaginated host cytoplasm (Entomophthorales). The Endogonales are either saprophytic or ectomycorrhizal with plants (White et al. 2006).
Zygomycota Characteristics
Not only do these fungi display a variety of life histories, but also the morphology of the Zygomycota is diverse with regard to reproduction and dispersal (Figure 3). Asexual spores are single-celled and include mitosporic sporangiospores and true conidia. Most zygomycetes reproduce by sporangiospores, which are derived from the internal cleavage of sporangial cytoplasm. These spores are dispersed through wind or animals after rupture of the sporangium wall. Asexual spores of the Entomophthorales appear to have a different ontogeny and are referred to as conidia. They are produced at the end of differentiated hyphae and lack a sporangial wall. Most are forcibly discharged and some can germinate and produce a secondary spore. Meiospores called zygospores, where known, are produced with or without the conjugation of compatible hyphae and are usually thick-walled and globose; however they are biconical in the Harpellales (White et al. 2006).
The Need for Fungal Phylogenetic Studies
A recent study on the phylogenetic tree encompassing more than 1000 uncultivated organisms highlighted the large number of organisms for which cultured representatives are
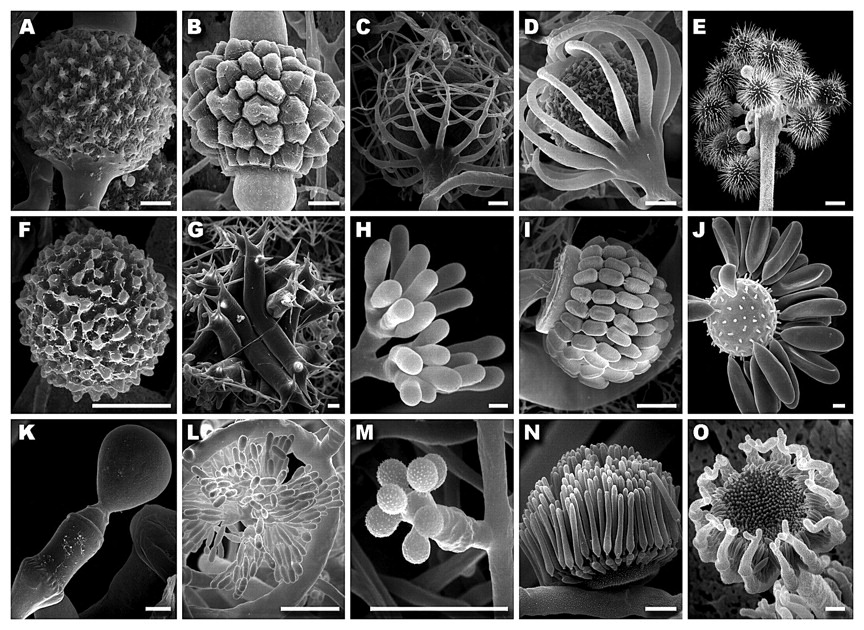
Figure 3: Scanning electron micrographs of Zygomycetes illustrating morphological diversity of sexual and asexual reproductive structures. A–E. Mucorales. Zygospores of A. Cokeromyces recurvatus, B. Cunninghamella homothallicus, C. Radiomyces spectabilis and D. Absidia spinosa. E. Hesseltinella vesiculosa sporangia. F–G. Mortierellales. F. Mortierella (Gamsiella) multidivaricata chlamydospore. G. Lobosporangium transversalis sporangia borne on arachnoid mycelium. H–J. Zoopagales. H. Piptocephalis cormbifera immature sporangia. I. Syncephalis cornu sporophore bearing senescent sporangia with uniseriate sporangiospores. J. Rhopalomyces elegans fertile vesicle with monosporous sporangia. K. Basidiobolus ranarum monosporous sporangium. L. Dimargaritales. Dispira cornuta two-spored sporangia. M–O. Kickxellales. Monosporous sporangia of M. Spiromyces minutus, N. Linderina pennispora and O. Kickxella alabastrina. Bars: A–F, I–O = 10 μ m; G, H = 20 μ m (White et al, 2006).
unknown. New sequencing techniques frequently reveal large numbers of uncharacterized taxa that have not been described due to the lack of representative reference specimens in the fungal gene bank collection. A major gap in our understanding of fungal diversity lies in determining the connections between fungi detected through next-generation sequencing or other culture-free methods and fungi already identified by mycologists based on morphology. Many branches of the fungal phylogenetic tree are still poorly resolved and underrepresented in phylogenies, and this is particularly true for lineages of early diverging terrestrial fungi (including those formerly classified as Zygomycota) due insufficient sequence data analysis. Improved sampling of diversity in these groups is critical for identifying evolutionary changes in the fungal kingdom and assessing the ecological functioning of novel taxa or those reported previously as nonculturable (or uncultured) in the fungal gene data bank in order to expand our understanding of the our environment (Torres-Cruz et al. 2017).
Phylogenomic analysis consists of using phylogenetic signals integrated over many genes used as proxy for the species within the phylogeny (Ebersberger et al. 2012). This approach is used to reduce gene-specific signals, or background noise, and to emphasize phylogenetic signal created by evolutionary relationships of the species being studied. Recent fungal phylogenetic studies have utilized larger set of genes, but confined their analysis to relatively few taxa. While this method did substantially increase branch support values, it also led to “potentially misleading conclusions on phylogenetic relationships due to insufficient taxon sampling” (Ebersberger et al. 2012). The use of expressed sequence tag (EST) has also recently been used in many studies, and has the potential to resolve the fungal phylygenetic tree by maximizing taxon and gene sampling (Ebersberger et al. 2012).
Sources of Error with Phylogenetic Studies
While using molecular approaches to sort out the fungal part of the tree of life has yielded helpful and conclusive results, the process isn’t always flawless, especially for difficult phylogenetic questions that are usually related to short internal branches the placement of rapidly evolving clades (Ebersberger et al. 2012). Often times, simply increasing the amount of data does not guarantee a true tree as the end result; “data sets may suffer from the consideration of non-orthologous genes, of genes whose phylogenetic information content has been severely compromised by multiple substitutions, and from sampling of too few taxa or taxa that are evolving too quickly” (Ebersberger et al. 2012). Furthermore, using the wrong models of sequence evolution can also lead to an inaccurate interpretation of the phylogenetic signal in the data. Issues with the tree are usually identified afterward when “the reconstructed tree is either incompatible with accepted phylogenetic relationships or when different data sets or different tree reconstruction methods obtain incongruous results” (Ebersberger et al. 2012).
Using Actin for Phylogenetic Analysis
For the phylogenetic analysis of our samples, in addition to small ribosomal subunit 18S and 28S and the ITS region, the actin gene was also utilized. The gene for actin as a highly conserved and functionally essential genetic element is developing into a major tool for phylogenetic analysis within a broad organismic range. The actin protein plays a crucial role in a broad range of elementary eukaryotic cellular processes, especially all forms of cell motility (transport of macromolecules within the cell, phagocytosis, chromosome movement and condensation, cytokinesis), cell division, cell growth and cell differentiation. Actin triggers muscle contraction in motile organisms, whereas in non-motile organisms actin functions in cytoskeletal integrity. As the major component of microfilaments in the cytoskeleton, it provides structural stability and is responsible for cytoplasmic streaming. Although the functions of this abundant protein are diverse, the primary structure of the 42,000-dalton protein is highly conserved among kingdoms and phyla. Strong selection for functional efficiency in essential processes does not allow actin proteins to evolve rapidly, acting as a constraint to conserve its primary structure to render the actin gene ideally suitable for phylogenetic analyses, especially if the investigated taxa are only distantly related (Voigt & Wostemeyer 2000).
Further Experiments
In addition to phylogeny, we are also interested in understanding the morphology and characteristics of our fungi samples. Because our samples appeared to be new species within Zygomycota, morphology tests were conducted using a number of different medias, including malt extract agar (MEA), water agar (WA), cornmeal agar (CMA), Czapek’s agar, and potato dextrose agar with lecithin (L-PDA). MEA and WA are used for growth measurements in different media with different concentrations of nutrients; CMA and Czapek’s agar was used to examine growth capacity and morphology; and L-PDA was used for mating experiments between different clusters of our fungal sample species. To understand their characteristic and their role in the natural ecosystem, we also conducted enzyme interaction tests and plant-fungi interaction tests. Our goal is to determine what role our sample species may play in the natural environment and how they relate to other species in the fungal phylogenetic tree.
Materials and Methods
Fungal Isolation
Samples were collected from New Jersey Pine Barrens from both pygmy pines (Pinus rigida) and mountain laurel (Kalmia latifolia) grass roots. After collection, samples were thoroughly rinsed to remove soil from the surface. They were then cut into smaller pieces, usually 10 – 20 mm pieces. Once cut, the root pieces were surface sterilized with sequential washes of 95% ethanol, 0.5% NaOCl (also known as bleach), and 70% ethanol, with varying durations for each wash. Samples were then rinsed with sterile water several times and dried to remove any remaining ethanol and NaOCl. Afterwards, surface sterilized samples were cut into 5 mm pieces and plated onto agar plates and incubated at room temperature to allow them to grow. The fungal cultures were then transferred to malt extract agar (MEA) plates, and purified through subculturing using hyphal tipping, in which the edge of the fungal growth is cut out and placed in a new agar plate.
Morphology
Samples were grown on four different media: Malt Extract Agar (MEA), Water Agar (WA), Corn Meal Agar (CMA), and Czapek’s agar. For MEA and WA media, cultures were incubated in 3 conditions: 25°C in light, 25°C in dark, and 30°C in dark. Three replicates were made for each sample in each condition. Samples were checked and measured at 3-day, 5-day, 7-day, 10-day, and 14-day intervals. For CMA media and Czapek’s agar, cultures were incubated at 25°C in light with three replicates. CMA media samples were checked and measured 5-day and 10-day intervals. Czapek’s agar plates were checked every other day after 5 days of incubation for spore growth.
DNA Extraction, PCR, and Sequencing
Once the fungi samples were purified, DNA was extracted using the MoBio Soil DNA Kit, following the manufacturer’s instructions. The concentration of the extracted DNA was determined using Nanodrop, to verify enough DNA sample was present to perform further experiments. For samples with enough concentration, PCR was performed using the Taq 2X Master Mix, following the manufacturer’s instructions, to amplify the DNA. Primers used for these isolates were internal transcribed spacer (ITS) for barcoding and actin for species differentiation. PCR cycling conditions for ITS sequences consisted of an initial denaturation step at 94 C for 2 min, 35 cycles of 94 C for 45 s, 54 C for 45 s, 72 C for 1.5 min, and a final extension at 72 C for 5 min. PCR cycling conditions for actin sequences consisted of an initial denaturation step at 94 C for 2 min, 30 cycles of 94 C for 30 s, 65 C for 30 s, 72 C for 30 s, and a final extension step at 72 C for 10 min. Once amplified, the PCR products were run through gel electrophoresis to visualize if there were any bands present, the intensity of the bands indicating concentration, and the size of the bands indicating basepairs. Afterwards, PCR products were purified using ExoSAP-IT for single band samples, and Qiagen Cleanup Kit for samples with primer dimers. Once purified, the samples were sent out for sequencing at Genscript Inc. with the ITS and actin PCR primers.
Sequence Alignment and Phylogeny
After the sequence was returned from the above mentioned procedure, it was analyzed using either 4Peaks or FinchTV to determine if the sequence was readable and reliable. Afterwards, blastn was used for identification purposes, to determine if the sample sequence matched with any existing sequence and by how much. The sample sequence was only matched with verified sequences in the data bank. Once the sequence was analyzed and barcoded, the information was then used to make a phylogenetic tree using MEGA6. Along with the sample sequence, sequences from other fungi species that were within the same class are also used to determine the placement of the sample sequence in the existing fungi phylogeny tree.
Enzyme Interaction Tests
In order to determine the function of the fungal species, enzyme interaction tests were performed. For these tests, special agar plates were made. The first kind is an amylase media, which contains: potato starch, glucose, CaCl2, NaCl, KH2PO4, MgSO4.7H2O, H2O, and agar. This media tells whether the fungi species has the enzyme amylase to break down starch. The second kind is a cellulase media, which contains: malt extract, glucose, CaCl2, NaCl, KH2PO4, MgSO4, cellulose, Congo red, gelatin, H2O, and agar. This media shows whether the fungi have the enzyme cellulase to break down cellulose. The third kind is a phosphatase media, which contains: malt extract, glucose, Ca(H2PO4)2, (NH4)2.SO4, KCl, MgSO4, MnSO4.H2O, FeSO4, Bromophenol blue, H2O, and agar. This media tells whether the fungi species contains the enzyme phosphatase to digest phosphates. The fourth kind of media is a gelatinase, which contains: malt extract, glucose, CaCl2, NaCl, KH2PO4, MgSO4, H2O, and gelatin. This media shows whether the fungi produce the enzyme gelatinase to break down the gelatin. The fifth kind is a lipase media, which contains: malt extract, glucose, CaCl2, NaCl, KH2PO4, MgSO4, H2O, agar, and TWEEN 20, which is added after autoclaving. This media tells whether the fungi produce the enzyme lipase to digest fats. The sixth kind is a chitinase media, which contains: MgSO4.7H2O, (NH4)2.SO4, KH2PO4, citric acid monohydrate, agar, Tween-80, colloidal chitin, and bromocresol purple. After autoclaving, Tween is added and pH is adjusted to 4.7. This media shows whether the fungi produce the enzyme chitinase to break down chitin. The fungi samples were plated on these enzyme media plates, with three replicates for each, and were incubated at room temperature. They were checked after 3 weeks for amylase and phosphatase, 5 weeks for cellulase and gelatinase, 16 weeks for lipase, and 2 weeks for chitinase, to allow enough time for the fungi to grow and interact with its environment fully (Rice & Currah, 2005; Agrawal & Kotasthane, 2012).
Plant-Fungi Interactions
In order to determine the role of the fungi species in the environment, particularly its relationship with its natural host, plant-fungi interactions experiments were conducted. Before these experiments were set up, the seeds of choice were tested for viability. One of the common plant seeds used is leek seeds because of its simple plant structure, making it easier to see if the fungi resides inside the plant, and also for its quick growth rate. Usually, seeds are chosen based on which plant or grass type the fungi was originally found near. For our samples, we used switchgrass, a native plant that was ready available, pine needle agar to imitate pine cones, which was one of the host plants, and leek, as a model plant. To determine seed viability, the 1% tetrazolium (TZ) test was used. The TZ test is a biochemical test, which differentiates live from dead seeds based on the activity of the respiration enzymes in seeds. The seeds are first hydrated with water, as this increases the activity of dehydrogenase enzymes, resulting in the release of hydrogen ions. The hydrated seeds are then either cut or punctured, depending on the type of seed and its anatomy, such as was done the leek and hard fescue seeds, which allows the TZ
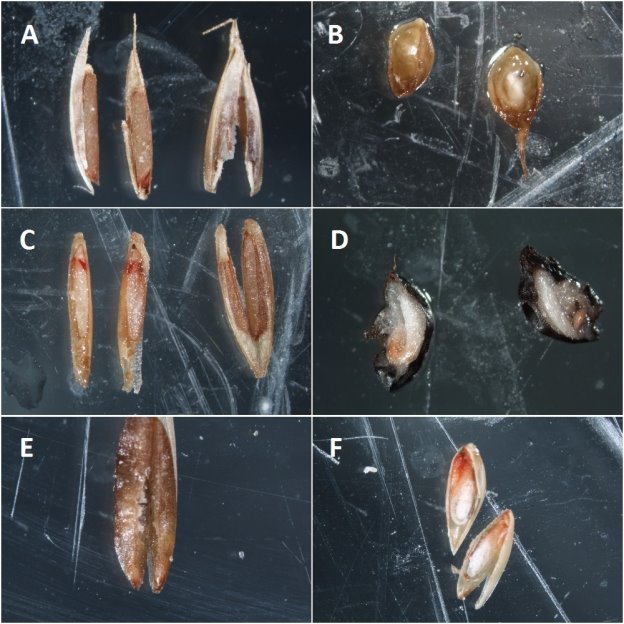
Figure 4: Results of the 1% TZ Seed Test. All seeds, except the Carex, were viable. Seeds tested are: (A). Beacon, positive (viable) on the left and negative (non-viable) shown on the right for comparison (B). Carex, negative (C). Hard Fescue – Beacon, positive (D). Leek, positive (E). Switchgrass – Kanlow, negative (F). Switchgrass – Kanlow, positive
solution to penetrate inside the seed. The seeds are then placed in the 1% TZ solution for a period of time ranging from 3 hours to 24 hours, depending on the type of seed. While in the TZ solution, the increase in hydrogen ions from hydration reduces the colorless tetrazolium salt solution (2,3,5-triphenyl tetrazolium chloride) into a chemical compound called formazan, which stains living cells with a red color and leaves dead cells colorless (Elias). In order to interpret the pattern of staining and conclude the seeds’ viability, the seeds are cut open under a microscope and inspected to see if the embryo of the seed is fully stained, indicating the seed is viable, as shown in Fig. 1. Once the seeds were confirmed to be viable, they were surface disinfected with 95 % ethanol for 30 s, 0.5 % NaOCl for 1 min, 70 % ethanol for 1 min, and rinsed with sterile distilled H2O to remove any remaining ethanol and bleach. The surface disinfected seeds were then left to germinate in the ideal condition for the seed type in a moist plate for 3 days. Agargel plates were made according to the manufacturer’s instruction and cut in half, with one half being removed from the plate. On the cut surface of the plate, three 10 mm x 10 mm x 5 mm plugs from one-week old fungi samples grown on MEA were placed equally apart from each other. Germinated seeds with visible radical were then placed on the fungi sample plugs. Plates with only fungi plugs were used as negative controls. Nine replicates of each fungi sample were made, and the seeds were incubated at room temperature under 12 hour light and dark cycle. The seeds were checked after 7 days for signs of growth and root length was measured for seeds that had grown.
Result
Morphology
Once the fungi were extracted from the collected field sample, each isolate was grown on MEA and WA to observe growth and appearance. Different environmental conditions were also tested for: Light vs Dark and temperature change. Since zygomycetes are known to be fast growing fungi, measurements were taken after 3, 5, 7, 10, and 14 days. After taking our measurements, it was found that there was no significant difference with temperature change. The growth measurements are as follows for MEA and WA:
| Isolate | MEA
Light (7 D) |
MEA
Dark (7 D) |
WA
Light (7 D) |
WA
Dark (7 D) |
MEA
Light (14 D) |
MEA
Dark (14 D) |
WA
Light (14 D) |
WA
Dark (14 D) |
| K10A | 2.95 | 2.65 | 0.70 | 0.63 | 4.50 | 3.95 | 0.73 | 0.63 |
| K26 | 2.50 | 2.40 | 0.70 | 0.67 | 3.10 | 3.45 | 0.80 | 0.73 |
| K33A | 2.45 | 2.00 | 0.70 | 0.67 | 3.55 | 2.60 | 0.80 | 0.70 |
| K77A | 3.20 | 2.90 | 0.70 | 0.67 | 4.75 | 3.10 | 0.73 | 0.73 |
| P25 | 2.25 | 1.60 | 0.70 | 0.60 | 3.15 | 2.15 | 0.70 | 0.60 |
| P16A | 3.45 | 3.05 | 0.67 | 0.60 | 6.30 | 5.55 | 0.70 | 0.60 |
| P31 | 2.95 | 3.00 | 0.83 | 1.00 | 5.45 | 5.55 | 1.10 | 1.13 |
| K17 | 3.35 | 3.05 | 2.00 | 2.95 | 4.85 | 4.60 | 3.60 | 4.45 |
| K95 | 2.25 | 2.00 | 2.55 | 2.65 | 3.50 | 3.70 | 3.95 | 3.60 |
| P75 | 3.70 | 3.60 | 2.55 | 2.45 | 4.45 | 4.45 | 4.05 | 4.15 |
| P60 | N/A | N/A | 3.07 | 3.20 | N/A | N/A | 5.40 | 5.10 |
| P33A | 2.80 | 2.95 | 1.00 | 1.50 | 4.45 | 4.40 | 1.65 | 2.20 |
After analyzing the growth measurements, majority of fungal isolates show significant growth on MEA media, which is expected as MEA is rich in nutrients that the fungal isolates need to grow. In addition, fungal isolates grown on MEA show distinct appearances similar to how they would appear in the natural environment (see Figure 5), whereas morphology characteristics are not observed as much on the WA plates. In addition, most of the isolates tend to grow faster in light conditions as opposed to dark conditions.
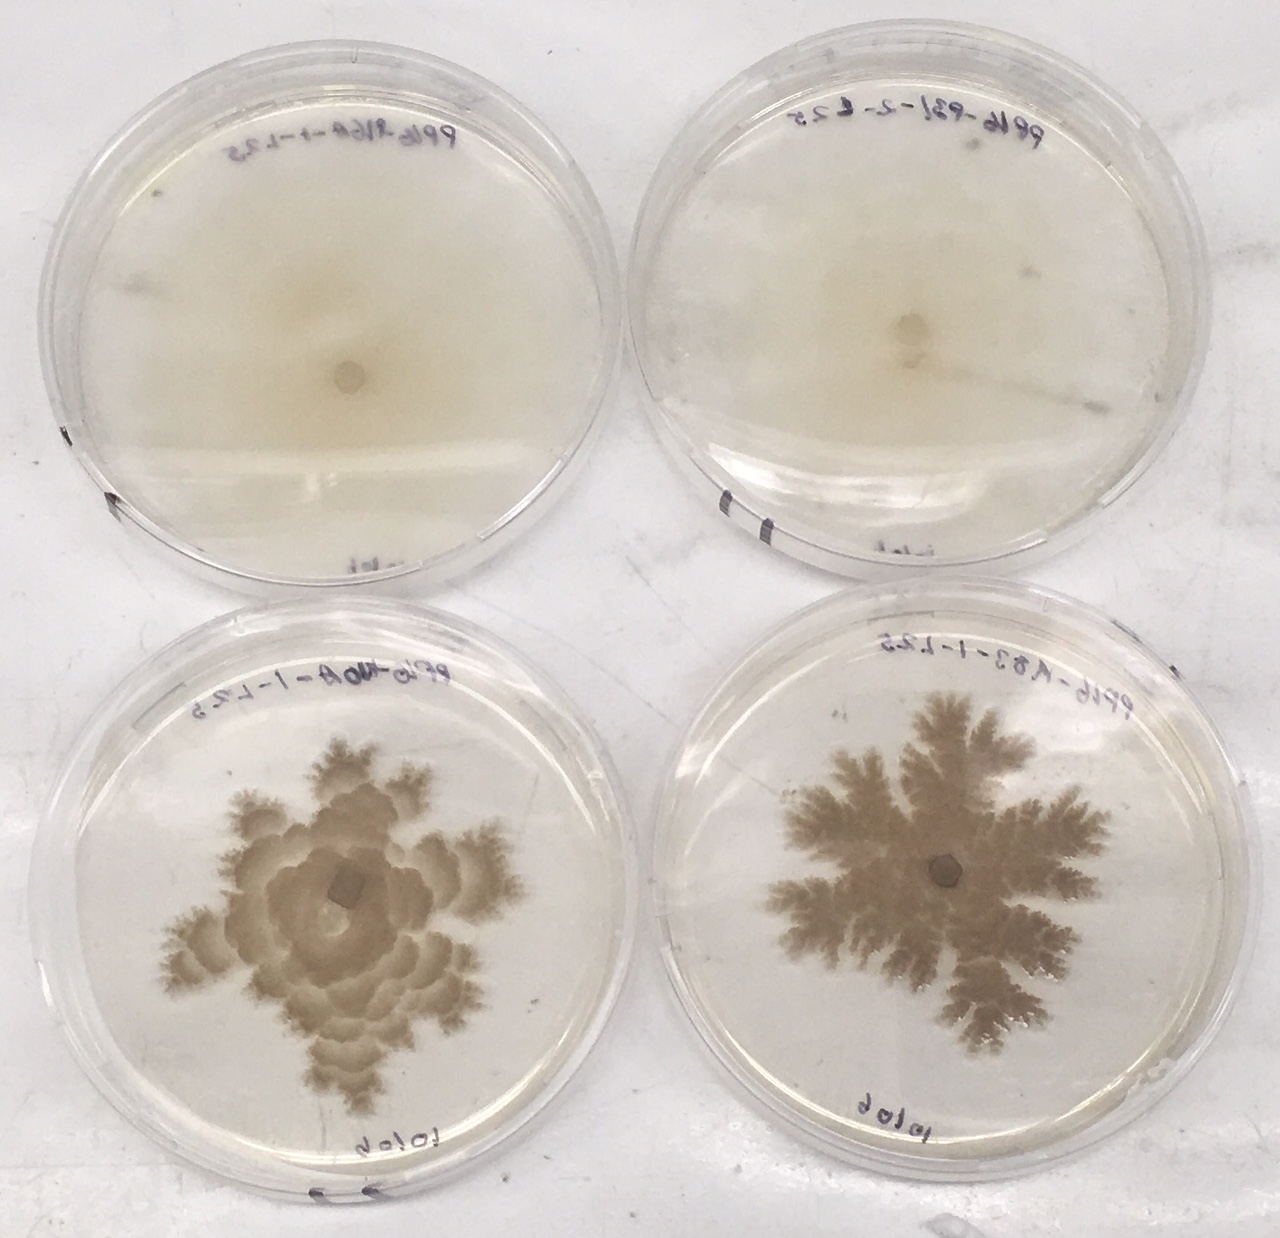
Figure 5: MEA plates after about 2 weeks for morphology test. Isolates shown from top left to bottom right are: P16A, P31, K10A, and K33A.
Based on appearance, the fungal isolates can be divided into different groups. The first group, which is the majority of isolates, consists of isolates K10A, K26, K33A, K77A, and P25. These isolates grow mostly within the agar, with a leathery appearance on top. They appear to have a half-white color initially, but change to a dark brown color as they continue to grow. These isolates also appear to make a wave like pattern as they grow in diameter, and tend to branch off and expand towards the edges. Two of these isolates, K10 and K33A, are shown in bottom two plates in Figure 5.
The second group consists of P16A and P31. These isolates mostly grow aerially, with a fuzzy appearance on top. They initially have a white color, and change slightly to a brown-ish/half-white color as they continue to grow. Unlike the isolates in the first group, these isolates grow in a consistent and even pattern in a round diameter. As they continue to grow, the edges appear a little leathery in texture, but remain fuzzy towards the center. These isolates also grow a little faster in diameter than the other isolates based on the growth measurements. Both of these isolates are shown in the top two plates in Figure 5.
The third group consists of K17 and P75. These isolates mostly grow aerially, with a thick, fuzzy appearance on top. They initially have a white color, and begin to have streaks of brownish mauve starting from the center and going outwards mixed with the original white color. Similar to the previous group of P16A and P31, these isolates grow in a consistent and even pattern in a round diameter. They also appear to grow as fast in diameter as the previous group. Both isolates can be seen in Figure 6.
The fourth group consists of P60 and P33A. These isolates mostly grew aerially, with some growth within the agar, and had a thick, fuzzy appearance on top. They initially have a white color, but began to change their color to a brown starting from the center and moving outwards. The growth rate for these isolates is similar to the previous two groupings. Isolate P33A can be seen in Figure 6.
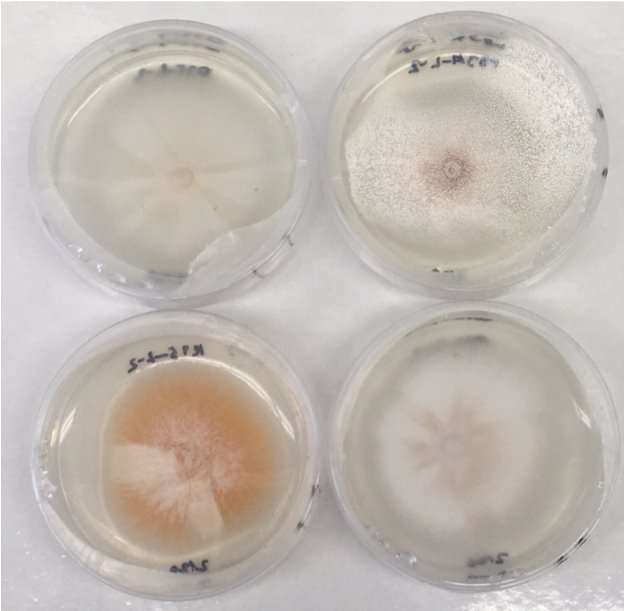
Figure 6: MEA plates after about 2 weeks for morphology test. Isolates shown from top left to bottom right are: P75, P33A, K95, and K17.
Isolate K95’s morphology was different than the rest of the isolates. It grew aerially, with a thick fuzzy texture. Unlike most of the isolates, isolate K95 only appeared white for a small duration initially, and then its color uniformly changed to a bright orange color mixed with white towards the center. This isolate’s growth rate was slightly slower than the previous groups.
These fungal isolates were also grown on CMA and Czepak’s agar to observe any spore formation and growth structure. CMA was used because it is a commonly used media for observing spore formation and growth structure for many fungi. However, for these zygomycete isolates, this media did not induce any spore formation. Because conclusive results were not obtained using CMA, Czepak’s agar was used as it was specific to zygospore formation based on literature search. After allowing the isolates to grow to maturity (~3 weeks), they were observed
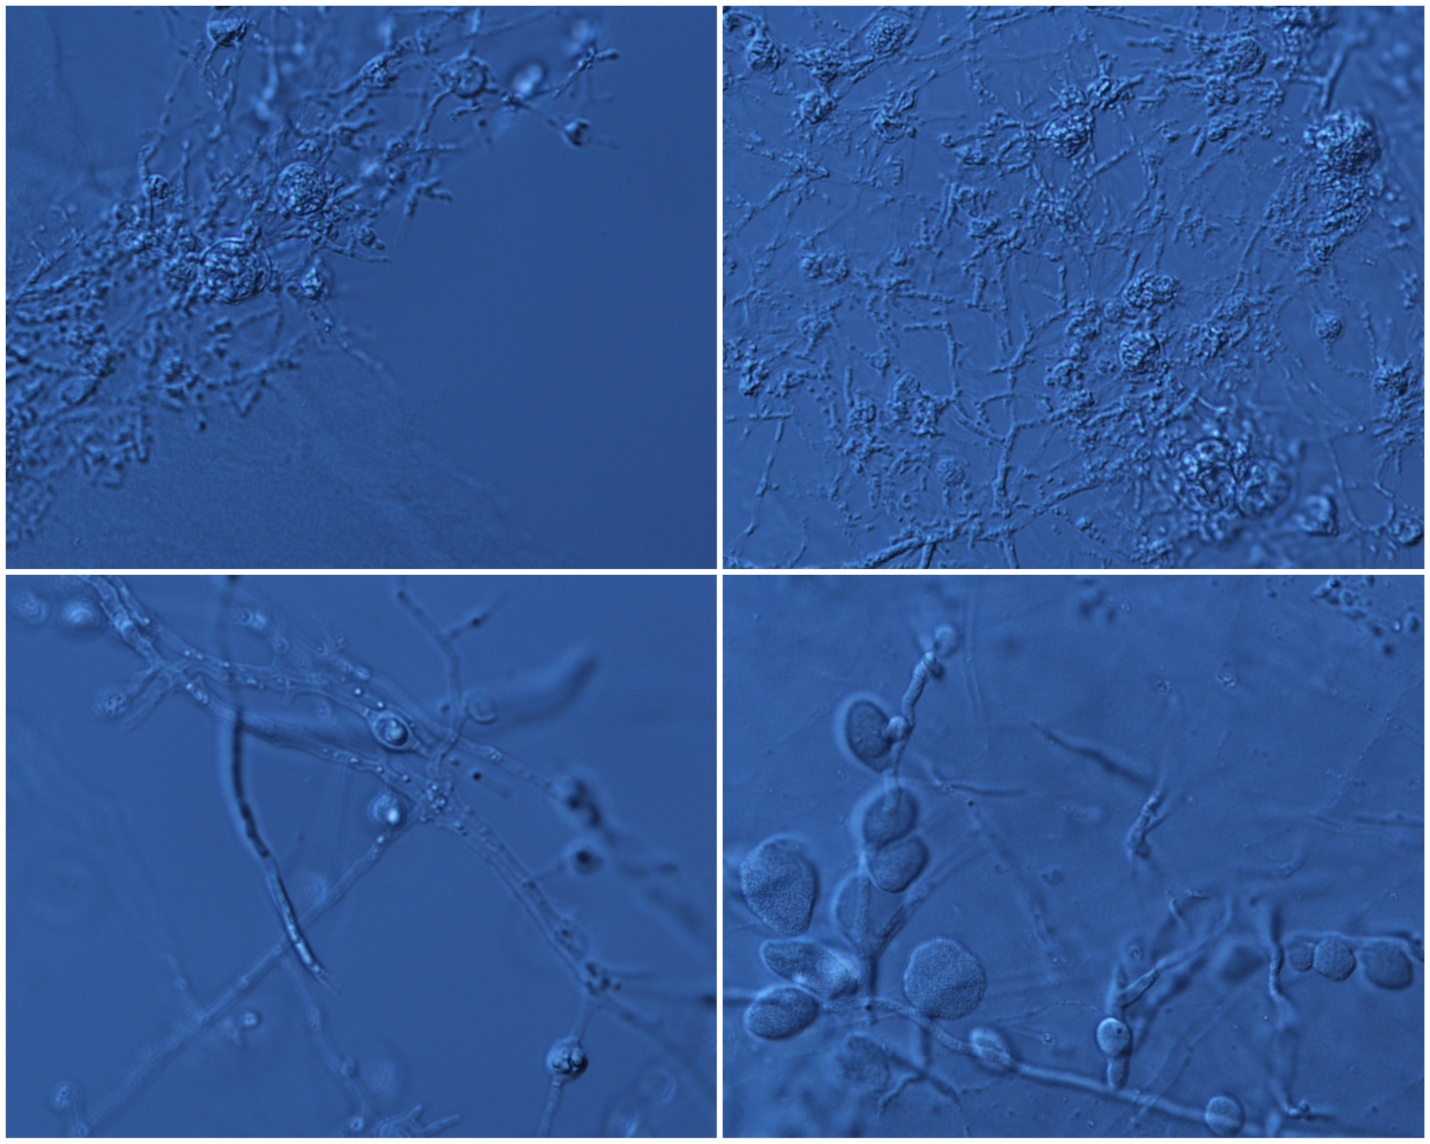
Figure 7: Zygospore formation and growth structure on Czepak’s agar. Images taken at 60x magnification using a light microscope. Isolates shown from top left to bottom right are: K10A, K26, P16A, and K95.
under a light microscope at 40x and 60x magnification. Spore formation was observed in most of the isolates, with variations in spore size and shape. Furthermore, there different in fungal growth structure was also observed, with the groupings of the isolates matching the groupings for the MEA morphology tests mentioned above. As seen in Figure 7, zygospores of isolates K26 and K10 appear to large, round and scattered across the hyphae, with the hyphae being long and thin in appearance. For isolate P16A, the zygospores appear to be much smaller, round, and scattered, with the hyphae structure the same as previously mentioned. For isolate K95, the zygospores appear to be of mixed shapes, with some being round and some being more elongated into ovals, large in size, and clustered together. The hyphae appear to be the same as the previous isolates.
Sequence Alignment and Phylogeny
In order to understand where our fungal isolates belonged in the phylogeny tree, we used the ITS region and actin protein coding region of the above mentioned isolates. The sequences were run through blastn for reference sequences, or sequences that were close to our isolate’s sequence. A doing so, a pattern was observed with the groupings of the fungal isolates. For isolates K10, K26, K33A, K77, and P25, the closest match for the ITS sequences were Umbelopsis ramanniana and Umbelopsis angularis, with an identity match of ~90% with each isolate. For isolates P16A and P31, the closest match for the ITS sequences were Umbelopsis ramanniana and Umbelopsis isabellina, with an identity match of ~90% with each isolate. For isolates K17, K95, and P75, the closest match for the ITS sequences were Umbelopsis dimorpha and Umbelopsis nana, with an identity match of ~99% with each isolate. For isolates P60 and P33A, Umbelopsis ramanniana and Umbelopsis angularis, with an identity match of ~99% with the first species and ~96% with the second species. When actin sequences were analyzed using blastn, there were no sequences
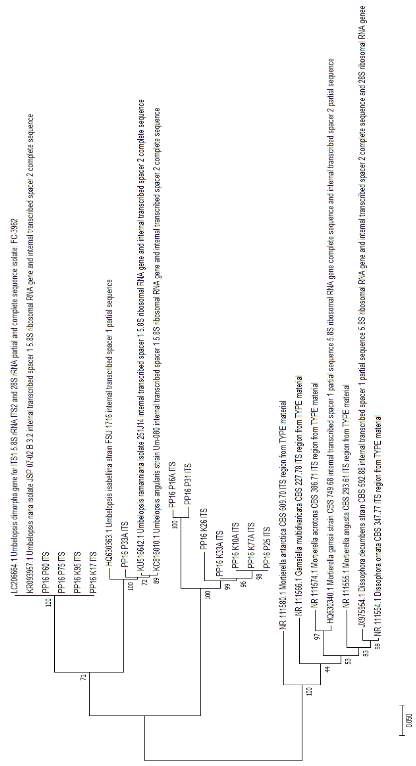
Figure 6: Phylogeny tree of zygomycete isolates using ITS DNA sequence. Sequences from Mucorales were used as the sister clade and sequences from Mortierellales were used as the outgroup based on GenBank analysis.
that were significantly similar to the isolate sequences. For isolates K10, K26, K33A, K77, and P25, the closest matches were Rhizopus schipperae, with an identity match of 85%, and Rhizopus stolonifer, with an identity match of 84%. Both matches belong within the Mucorales genus, which is the neighboring genus to Umbelopsis within Mucoromycotina. Similarly, for isolates P16A and P31, the closest matches were Rhizopus schipperae and Rhizopus stolonifer, with an identity match of 82% for both. For isolates K17, K95, and P75, the closest matches P25 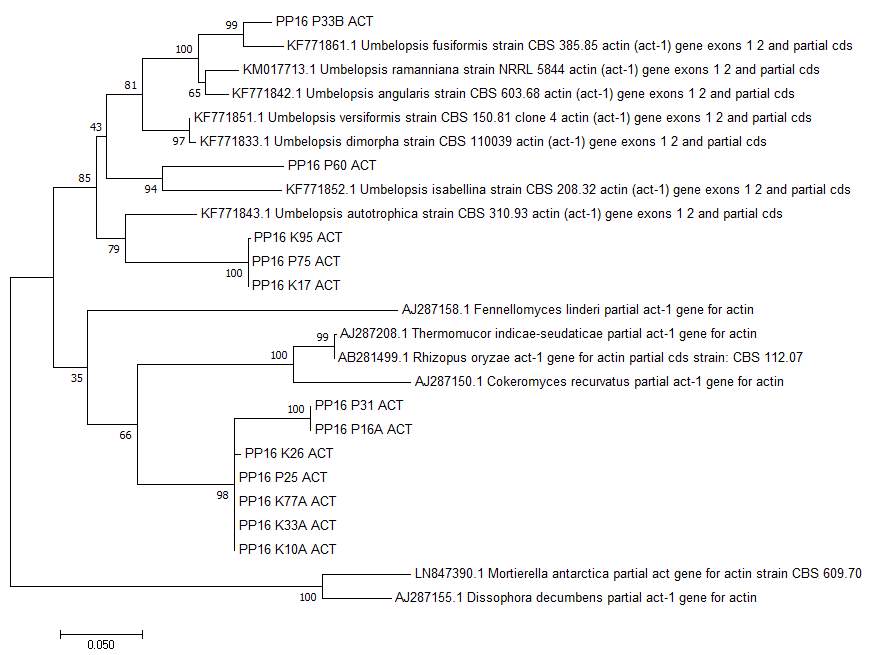
Figure 7: Phylogeny tree of zygomycete isolates using actin DNA sequence. Sequences from Mucorales were used as the sister clade and sequences from Mortierellales were used as the outgroup based on GenBank analysis.
form a new were Umbelopsis vinacea, with an identity match of 90%, and Umbelopsis versiformis, with an identity match of 89%. For isolates P60, the closest matches was Umbelopsis isabellina, with an identity match of 89%, and for isolate P33B, the closest match was Umbelopsis fusiform, with an identity match of 94%. Outgroup sequences were from the neighboring genus Mortierella, which is also part of the Zygomycota phylum. Using reference sequences from the Umbelopsis genus based on the NCBI’s GenBank search and outgroup sequences from the Mortierella, two trees were constructed. ITS sequences were used to determine the overall placement of the isolates (see Figure 6). Actin sequences were used to determine species separation within Mucoromycotina (see Figure 7). As evident in the actin tree, isolates K10, K26, K33A, K77, and genus within Mucoromycotina, and this group will be referred to by isolate K26. Isolates P16A and P31 also form a new genus within the Mucoromycotina, and this group will be referred to by isolate P16A. Isolates K17, K95, and P75 may belong within Umbelopsidaceae as a new grouping, and will be referred to by K95. Isolates P60 and P33A/B belong within the Umbelopsis genus, and with P60 being closely related to Umbelopsis isabellina and P33A/B closely related to Umbelopsis fusiform.
Enzyme Interaction Tests
After conducting the phylogenetic analysis, the isolates were grouped into different clades, and a representative sample was picked for each clade as all isolates within the clade showed the same or very similar characteristics. From this point forward, isolate K26 will be used to represent isolates K10, K33A, K77A, and P25; isolate P16A will be used to represent isolate P31; isolate K95 will be used to represent isolates K17 and P75; and isolate P60 will be used to represent P33A.
Results of enzyme interaction tests were determined on a sliding scale of the number of pluses, ranging from negative (no pluses) to slightly positive (+ or ++) to clearly positive (+++). The phosphatase test is observed for a color change of the media from blue to green around where the fungus is growing. This test indicates whether a fungus can live in harsh conditions if it has the ability to digest phosphates from the soil, as opposed to drawing nutrition from the plant. The cellulase test is observed for a halo of light red color around the fungi growth. This test indicates whether a fungus might be a decomposer if it has the ability to digest cellulose from dying plants. The amylase test was observed for bright orang-ish red color in the plate. While the media is initially colorless, iodine is added and allowed to soak through the gel, and then the plate is looked at in the light to determine is a light yellow colored halo is present around the fungal growth. Similar to the cellulose test, this test indicates whether a fungus might be a decomposer
| Isol. | Phosphatase | Cellulase | Amylase | Lipase | Gelatinase | Chitinase | ||||||||||||
| Rep | 1 | 2 | 3 | 1 | 2 | 3 | 1 | 2 | 3 | 1 | 2 | 3 | 1 | 2 | 3 | 1 | 2 | 3 |
| K26 | ++ | + | + | – | – | – | – | – | – | – | – | – | +++ | ++ | ++ | + | ++ | ++ |
| P16A | – | – | – | + | + | + | – | – | – | + | + | + | +++ | +++ | +++ | – | – | – |
| K95 | – | – | – | +++ | +++ | +++ | ++ | ++ | ++ | – | – | – | ++ | ++ | ++ | + | + | + |
| P60 | +++ | +++ | +++ | +++ | +++ | +++ | ++ | ++ | ++ | – | – | – | +++ | +++ | +++ | ++ | ++ | ++ |
if it has the ability to digest starch from dead plants. The lipase test is observed for the formation of crystals around the fungi. This test indicates whether the fungus has the ability to digest fats in decomposing plants, similar to the amylase and cellulase tests. The gelatinase test is observed for how much of the media it degrades and the amount of liquid present in the plate. This test indicates whether the fungus has the ability to break down proteins and decompose plants, similar to the amylase, cellulose and lipase tests. The chitinase is observed for a color change from bright yellow to orange to dark purple. This test indicates whether the fungi are able to decompose small insects as opposed to plants since most insects have chitin in their outer covering.
The results for the 4 representative isolates are shown in the table below. For the K26 isolate group, the phosphatase and chitinase test showed slight positive results, gelatinase showed clear positive results, and cellulose, amylase, and lipase showed clear negative results. This indicatesthat the isolates in the K26 clade are able to survive in somewhat harsh conditions and are not decomposers of plants, but can decompose insects. For the P16A isolate group, cellulase and lipase test showed slightly positive results, gelatinase test showed clear positive results, and phosphatase, amylase, and chitinase tests showed clear negative results. This indicates that the isolates in the P16A clade are decomposers of plants and may not be able to with stand nutrient deprived living conditions. For the K95 isolate group, the amylase, gelatinase, chitinase test showed slightly positive results, the cellulase test should clearly positive results, and the phosphatase and lipase showed clear negative results. This indicates that the isolates in the K95 clade are decomposers of plants and small insects and are not able to with stand harsh living conditions. For the P60 isolate group, amylase and chitinase tests showed slightly positive results, phosphatase, cellulase, and gelatinase tests showed clear positive results, and lipase test showed clear negative results. This indicates that the isolates in the P60 clade are heavy decomposers of plants and insects and are able to with stand harsh living conditions.
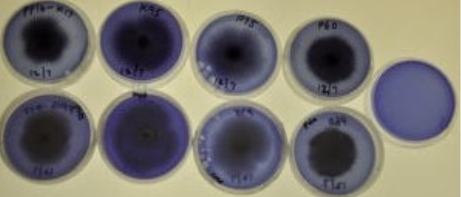
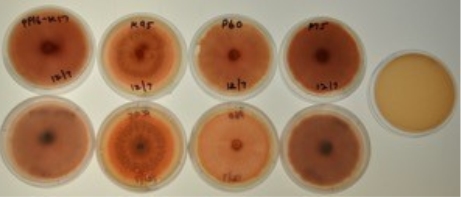
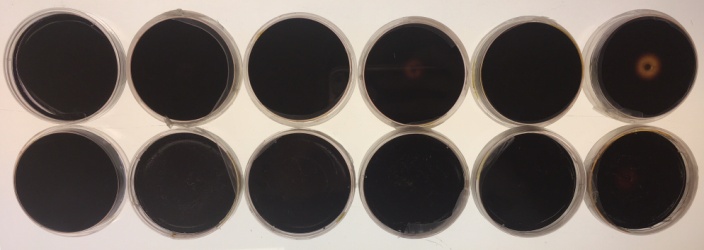
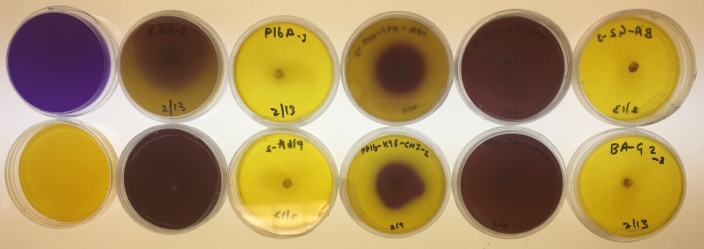
Figure 8: Enzyme interaction test results for select isolates. From top to bottom: phosphatase, cellulase, amylase, and chitinase enzyme interaction test.
Plant Fungi Interaction Tests
In order determine the results of this test, the first aspect looked at was whether the seeds
germinated or not. This tells us whether the fungus interferes with the plant by inhibiting it from from the very beginning. For isolates in the K26 group, 6 out of 9 seeds planted with the fungal isolate germinated and grew, as compared to 2 out of 3 seeds in the control plate. This indicates that the isolates in the K26 clade do not inhibit plant growth, but instead allow the plant to grow along with the fungal isolate itself. For isolates in the P16A group, 8 out of 9 seeds planted with the fungal isolate germinated and grew, as compared to 2 out of 3 seeds in the control plate. This indicates that the isolates in the P16A clade also co-exist with and promote plant growth. For isolates in the K95 group, 9 out of 9 seeds planted with the fungal isolate germinated and grew, as compared to 2 out of 3 seeds in the control plate. This indicates that isolates in the K95 clade promote plant growth, and co-exist with their host. For isolates in the P60 group, 7 out of 9 seeds
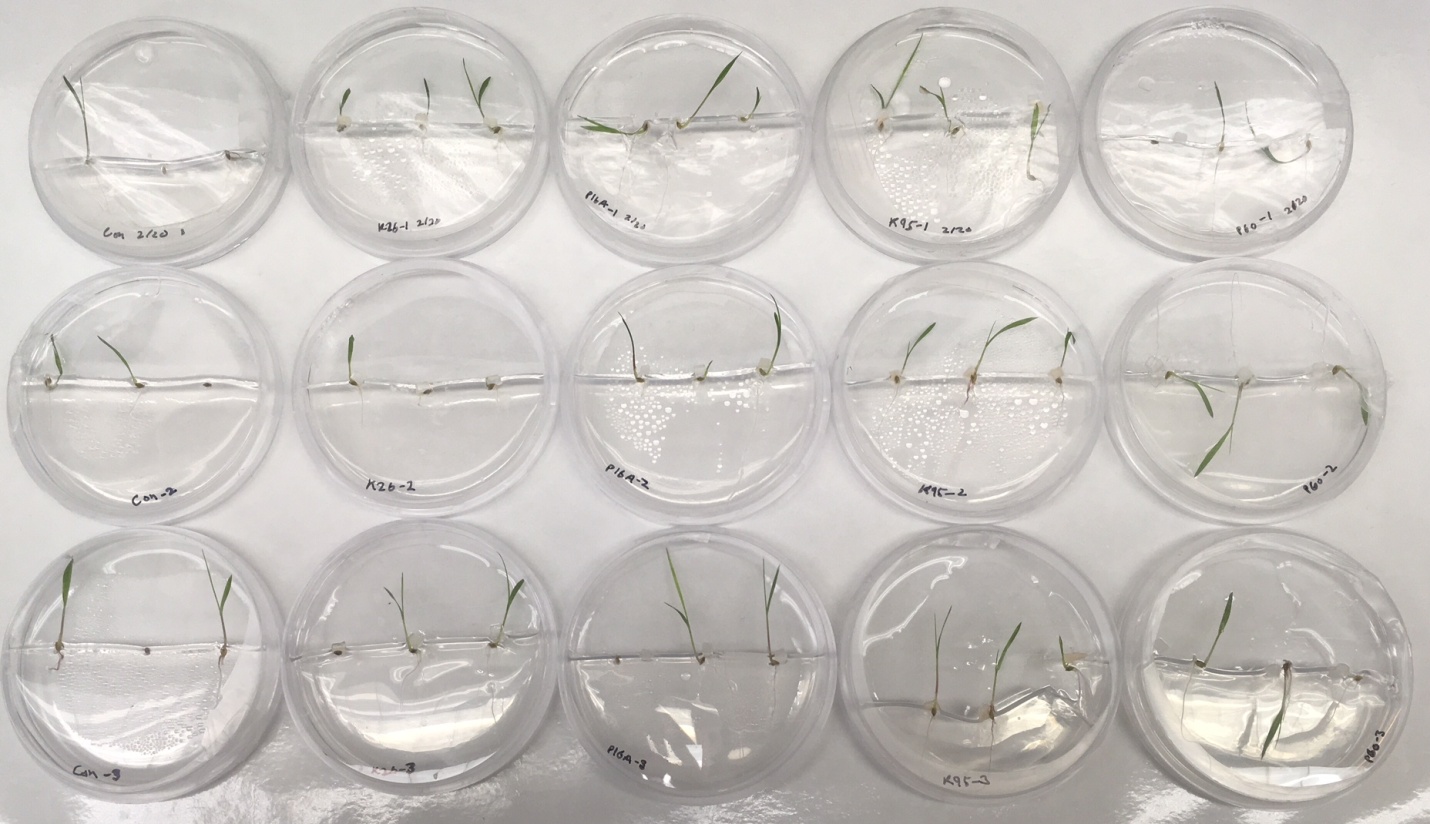
Figure 9: Results of the plant-fungi interaction test. Left most column plates are the seed control plates. From left to right column-wise, isolates shown are K26, P16A, K95, and P60.
planted with the fungal isolate germinated and grew, as compared to 2 out of 3 seeds in the control plate. This indicates that isolates in the P60 clade grow along with their host plant, and do not inhibit nor promote plant growth. Furthermore, none of the isolates interfered with plant growth after germination as all host plants were growing in a healthy manner alongside the fungal isolates.
Discussion
The Fungal kingdom remains one of the least known, even though it is the second largest kingdom in the Eukarya phylogenetic tree of life. While there has been an increase in research in this field in recent years, there are still many gaps that remain in our understanding of the role of fungi in various ecological environments and the evolutionary changes they continue to go through. For this research, we focused on fungal species in the NJ Pine Barrens environment where wild plants continue to thrive even in arid and harsh conditions that domestic crops are not able to live in. Within this environment, we chose to focus on the zygomycetes species as many of the isolated fungal samples grouped within Zygomycota during our preliminary phylogenetic analysis. Through the various tests and phylogenetic analysis, we were able to understand the possible ecological role of these isolates in the NJ Pine Barrens and their placement in the fungal phylogenetic tree.
Through the morphology test, we were able to identify the distinct morphological characteristics of the isolates and group them according to similar characteristics. The largest grouping consisted of K26, K10A, K33A, K77A, and P25, with a distinct brown color and wave-like pattern as it matures. Isolates P16A, P31, K17, P75, P60, and P33A all appeared to look similar morphologically initially, being white in color and fuzzy texture, but begin to show distinct characteristic as they grow and mature. In addition, zygospore formation and hyphae structure also appear to be different in these isolate, and the groupings are the same as the groupings based on morphological traits.
After observing the morphological traits, DNA analysis was performed to determine the phylogenetic placement of these isolates. Two sequences were extracted and sequenced for al is all isolates, ITS and actin. ITS sequences were used to understand the overall placement of the fungal isolates within the fungal tree of life, more specifically which genus within Zygomycota they belonged to or were close to. Through this analysis, we determined that the isolates belonged to the Mucoromycota within Zygomycota and were either within or close to the Umbelopsis genus. Actin sequences were used to further separate between species and determine more specifically how the isolates grouped together in comparison to each other and sequences from Umbelopsis. From this analysis, we discovered that isolates P60 and P33A/B belonged were new species that belonged within Umbelopsis. Isolates K17, K95, and P75 might also be new species within Umbelopsis or may form a sister genus of their own, requiring further analysis to confirm their placement. Isolates P16A and P31 formed a new genus sister to Mucorales and Umbelopsis. Isolates K26, K10A, K33A, K77A, and P25 formed a second new genus also sister to Mucorales and Umbelopsis. Furthermore, through NCBI’s GenBank analysis, we found that many Umbelopsis sequences that were closely matched to our isolate sequences were found from native plants, similar to where our isolates were collected from. This suggest that these fungal species are highly selective with their host plant and live where ever native plants such as mountain laurel and pine trees are growing.
Lastly, after the phylogenetic analysis, enzyme interaction test and plant-fungi interaction test were conduct to understand the ecological role of the fungal isolates. For the K26 group, the fungal isolates could be endophytes as they are not able to break down decomposing plants, and may also be able to withstand poor nutrient environments. For the P16A group, the fungal isolates may be endophyte as well because they also lack the necessary enzymes to break down plants. For the K95 group, the isolates may be endophytes or saprobes as they have some ability to decompose plants, but not for all nutrients. For the P60 group, the fungal isolates may be saprobes or pathogenic to plants as they have strong capabilities to decompose plants and small insects in its environment. From the plant-fungi interaction tests, K26 group did not appear to promote nor inhibit plant growth. With the remain groups, P16A, K95, and P60, the fungal isolates may promote plant growth, but this finding was not statistically significant based on plant and root length. It is also worth noting that the plant seed for these tests were not the original host cell, and therefore may exhibit different interaction patterns with its host plants. While we tried making pine needle agar, which was one of the host plants) and conducting plant-fungi interactions with it, there was no result obtained, and was therefore omitted. In further studies involving plant interaction tests, we plan to perform plant-fungi interaction tests using mountain laurel, one of the host plants, and leek, which is a model organism for studying plant-fungi interactions on a microscopic level.
Through this research, we are able to expand our current knowledge about the fungal kingdom and fill in the evolutionary and ecological gaps within the fungal phylogenetic tree. We are able to understand the role these fungal isolates play in the natural environment. If these fungal isolates are discovered to be the reason behind why wild plants such as mountain laurel and pine trees are able to grow in such arid and nutrient poor environments, then these fungal isolates can be used to inoculate domestic crops grown in areas with similar arid climates and poor soil conditions. By doing so, farmers in those areas will be able to grow their crops without excessive use of fertilizers and other chemicals to keep their crops alive. Not only will this research expand our knowledge about the fungal kingdom and the role these fungal isolates play in the environment, but it will also allow us to make better use of our varying ecosystems.
References
- Agrawal T, Kotasthane A. Chitinolytic assay of indigenous trichoderma isolates collected from different geographical locations of chhattisgarh in central india. SpringerPlus. 2012;1(1):1-10. doi: 10.1186/2193-1801-1-73.
- Anderson IC, Campbell CD, Prosser JI. Potential bias of fungal 18S rDNA and internal transcribed spacer polymerase chain reaction primers for estimating fungal biodiversity in soil. Environ Microbiol. 2003;5(1):36-47. doi: 10.1046/j.1462-2920.2003.00383.x.
- Benny GL, Smith ME, Kirk PM, Tretter ED, White MM. Challenges and future perspectives in the systematics of kickxellomycotina, mortierellomycotina, mucoromycotina, and zoopagomycotina. In: Biology of microfungi. Springer, Cham; 2016:65-126. Accessed Nov 13, 2017.
- Ebersberger I, de Matos Simoes R, Kupczok A, et al. A consistent phylogenetic backbone for the fungi. Mol Biol Evol. 2012;29(5):1319-1334. Accessed Nov 13, 2017. doi: 10.1093/molbev/msr285.
- Elias, S, Garay A. Tetrazolium test (TZ) a fast, reliable test to determine seed viability. Oregon State University Seed Laboratory.
- Gherbawy Y, Kesselboth C, Elhariry H, Hoffmann K. Molecular barcoding of microscopic fungi with emphasis on the mucoralean genera mucor and rhizopus. ; 2010:250. 10.1007/978-3-642-05042-8_11.
- Hall, BG (2011). Phylogenetic trees made easy: a how-to manual (4th ed.). Sunderland: Sinauer Associates.
- Helgason T, Watson IJ, Young J. Phylogeny of the glomerales and diversisporales (fungi : Glomeromycota) from actin and elongation factor 1-alpha sequences. FEMS Microbiol Lett. 2003;229(1):127-132. doi: 10.1016/S0378-1097(03)00802-4.
- Hibbett DS, Binder M, Bischoff JF, et al. A higher-level phylogenetic classification of the fungi. Mycological Research. 2007;111(5):509-547. Accessed Nov 13, 2017. doi: 10.1016/j.mycres.2007.03.004.
- Hirose D, Degawa Y, Inaba S, Tokumasu S. The anamorphic genus calcarisporiella is a new member of the mucoromycotina. Mycoscience. 2012;53(4):256-260. Accessed Nov 13, 2017. doi: 10.1007/S10267-011-0160-1.
- Hoffmann K, Discher S, Voigt K. Revision of the genus absidia (mucorales, zygomycetes) based on physiological, phylogenetic, and morphological characters; thermotolerant absidia spp. form a coherent group, mycocladiaceae fam. nov. Mycological Research. 2007;111(10):1169-1183. Accessed Nov 19, 2017. doi: 10.1016/j.mycres.2007.07.002.
- Hoffmann K, Voigt K, Kirk PM. Mortierellomycotina subphyl. nov., based on multi-gene genealogies. Mycotaxon. 2011;115(1):353-363. Accessed Nov 13, 2017. doi: 10.5248/115.353.
- James TY, Kauff F, Schoch CL, et al. Reconstructing the early evolution of fungi using a six-gene phylogeny. Nature. 2006;443(7113):nature05110. Accessed Nov 13, 2017. doi: 10.1038/nature05110.
- Kerstin Voigt, Elizabeth Cigelnik, Kerry O’donnell. Phylogeny and PCR identification of clinically important zygomycetes based on nuclear ribosomal-DNA sequence data. Journal of Clinical Microbiology. 1999;37(12):3957-3964.
- Liu X, Voigt K. Molecular characters of zygomycetous fungi. ; 2010:488. 10.1007/978-3-642-05042-8_20.
- Lutzoni F, Kauff F, Cox CJ, et al. Assembling the fungal tree of life: Progress, classification and evolution of subcellular traits. Am J Bot. 2004;91(10):1446-1480. doi: 10.3732/ajb.91.10.1446.
- O’Donnell K, Lutzoni FM, Ward TJ, Benny GL. Evolutionary relationships among mucoralean fungi (zygomycota): Evidence for family polyphyly on a large scale. Mycologia. 2001;93(2):286-297. Accessed Nov 19, 2017. doi: 10.2307/3761650.
- Rice AV, Currah RS. Oidiodendron: A survey of the named species and related anamorphs of myxotrichum. Studies in Mycology. 2005;53:83-120. http://www.sciencedirect.com/science/article/pii/S0166061614602256. Accessed Jan 26, 2018. doi: 10.3114/sim.53.1.83.
- Rossman AY, Palm ME. Why are phytophthora and other oomycota not true fungi? American Phytopathological Society Web site. https://www.apsnet.org/edcenter/intropp/pathogengroups/pages/oomycetes.aspx. Updated 2016. Accessed Jan 18, 2018.
- Spatafora JW, Chang Y, Benny GL, et al. A phylum-level phylogenetic classification of zygomycete fungi based on genome-scale data. Mycologia. 2016;108(5):1028-1046. doi: 10.3852/16-042.
- Tanabe Y, Saikawa M, Watanabe MM, Sugiyama J. Molecular phylogeny of zygomycota based on EF-1alpha and RPB1 sequences: Limitations and utility of alternative markers to rDNA. Molecular Phylogenetics & Evolution. 2004;30(2):438-449.
- Tanabe Y, Watanabe MM, Sugiyama J. Evolutionary relationships among basal fungi (chytridiomycota and zygomycota): Insights from molecular phylogenetics. J Gen Appl Microbiol. 2005;51(5):267-276. doi: 10.2323/jgam.51.267.
- Terry J. Torres-Cruz, Terri L. Billingsley Tobias, Maryam Almatruk, et al. Bifiguratus adelaidae, gen. et sp. nov., a new member of mucoromycotina in endophytic and soil-dwelling habitats. . 2017;109(3):363-378. Accessed Nov 13, 2017. doi: 10.1080/00275514.2017.1364958.
- Thi Thuong Thuong Nguyen, Lee SH, Bae S, Jeon SJ, Mun HY, Lee HB. Characterization of two new records of zygomycete species belonging to undiscovered taxa in korea. Mycobiology. 2016;44(1):29-37. doi: 10.5941/MYCO.2016.44.1.29.
- Truong C, Mujic AB, Healy R, et al. How to know the fungi: Combining field inventories and DNA-barcoding to document fungal diversity. New Phytol. 2017;214(3):913-919. Accessed Nov 13, 2017. doi: 10.1111/nph.14509.
- Větrovský T, Kolařík M, Žifčáková L, Zelenka T, Baldrian P. The rpb2 gene represents a viable alternative molecular marker for the analysis of environmental fungal communities. Mol Ecol Resour. 2016;16(2):388-401. Accessed Nov 19, 2017. doi: 10.1111/1755-0998.12456.
- Voigt K, Vaas L, Stielow B, de Hoog GS. The zygomycetes in a phylogenetic perspective INTRODUCTION. Persoonia. 2013;30:IV.
- Voigt K, Wostemeyer J. Phylogeny and origin of 82 zygomycetes from all 54 genera of the mucorales and mortierellales based on combined analysis of actin and translation elongation factor EF-1 alpha genes. Gene. 2001;270(1-2):113-120. doi: 10.1016/S0378-1119(01)00464-4.
- Voigt K, Wöstemeyer J. Reliable amplification of actin genes facilitates deep-level phylogeny. Microbiological Research. 2000;155(3):179-195. Accessed Nov 19, 2017. doi: 10.1016/S0944-5013(00)80031-2.
- Wang Y, Liu X, Zheng R. Umbelopsis longicollis comb. nov. and the synonymy of U. roseonana and U. versiformis with U. nana. Mycologia. 2015;107(5):1023-1032. Accessed Nov 19, 2017. doi: 10.3852/14-339.
- White MM, James TY, O’Donnell K, Cafaro MJ, Tanabe Y, Sugiyama J. Phylogeny of the zygomycota based on nuclear ribosomal sequence data. Mycologia. 2006;98(6):872-884. Accessed Sep 25, 2017.
Cite This Work
To export a reference to this article please select a referencing stye below:
Related Services
View all


Related Content
All TagsContent relating to: "Environmental Science"
Environmental science is an interdisciplinary field focused on the study of the physical, chemical, and biological conditions of the environment and environmental effects on organisms, and solutions to environmental issues.
Related Articles

DMCA / Removal Request
If you are the original writer of this dissertation and no longer wish to have your work published on the UKDiss.com website then please: