Solar Tracking and Web Based Data Monitoring of PV Solar Module via Lab-view
Info: 8397 words (34 pages) Dissertation
Published: 17th Dec 2019
Tagged: Engineering
“SOLAR TRACKING AND WEB BASED DATA MONITORING OF PV SOLAR MODULE VIA LAB-VIEW”
CONTENTS
1.1 PROBLEM SUMMARY AND INTRODCTION
1.1.2 Introduction to Solar tracking
1.1.3 Introduction to Web-based Service
1.1.5 Introduction to DC motor for tracking
1.4 BRIEF LITERATURE REVIEW AND PRIOR ART SEARCH ABOUT THE PROJECT
1.4.1 Brief about literature review
1.6 MATERIALS OR TOOLS REQUIRED
CHAPTER – 2 BUSINESS MODEL CANVAS
3.1 DESIGN OF CONSIDERATION FOR DETAIL DESIGN PART
3.2.1 LABVIEW PROGRAM OF TEMPERATURE
3.2.2 STEPS FOR LABVIEW PROGRAM OF TEMPERATURE
3.2.3 LABVIEW PROGRAM OF LIGHT INTENSITY
3.2.4 STEPS FOR LABVIEW PROGRAM OF LIGHT INTENSITY
3.2.5 LABVIEW PROGRAM OF CURRENT
3.2.6 STEPS FOR LABVIEW PROGRAM OF CURRENT
4.4 USEFULNESS WITH EXISTING PRODUCT
ABSTRACT
This project is aimed to obtain the highest efficiency of solar panel by moving it using solar tracking system. It consists of a DC motor connected to underneath of a solar module. By rotating solar module on single axis at optimum angle, we will get the maximum output as the solar radiation would change its direction throughout the day. According to that radiation, we would have to set our angle of rotation. Moreover, solar plants are placed at the wide desert area, far from the control center. Therefore, we can utilize LabVIEW web service to get the real time data at control room. No one would have not to go to every panel to check and watch the reading and output value. We will get the output at the computer screen. This proposes very simple, low cost, high reliable, photovoltaic monitoring system.
Chapter-1 INTRODUCTION
1.1 PROBLEM SUMMARY AND INTRODCTION
1.1.1 Problem summary
India is the seventh largest nation with an area of 3.287 million km2. It is a relatively rich and rapidly developing country and so demand for electricity is growing on average at around 5% annually. One of the most fascinating aspects of solar cells is their ability to convert the most abundant and free forms of energy into electricity without moving parts or components. Also, they do not produce any adverse forms of pollution that affect the ecosystem. India’s rooftop solar capacity addition grew 66 percent from last year to reach 525 mega watts. Based on recent studies, PV technology and application is economically viable to be adopted in tropical countries like India where it receives more than 7 hours of direct sunlight each day throughout the year. But solar panels are more efficient if they are rotated in either direction. The LabVIEW software is a national instrumentsTM product that is used to monitor as well as send the data to other PC for real time applications. Laboratory Virtual instrumentation for Engineering Workbench is an abbreviation for LabVIEW. One benefit of LabVIEW over other development environments is that it provides web services.
1.1.2 Introduction to Solar tracking
A solar tracker is a device that orients a payload toward the Sun. Payloads are usually solar panels, parabolic troughs, fresnel reflectors, mirrors or lenses. Sunlight has two components, the “direct beam” that carries about 90% of the solar energy, and the “diffuse sunlight” that carries the remainder – the diffuse portion is the blue sky on a clear day and increases proportionately on cloudy days. As the majority of the energy is in the direct beam, maximizing collection requires the Sun to be visible to the panels as long as possible. The Sun travels through 360 degrees east to west per day, but from the perspective of any fixed location the visible portion is 180 degrees during an average 1/2 day period (more in spring and summer; less, in fall and winter). Local horizon effects reduce this somewhat, making the effective motion about 150 degrees. A solar panel in a fixed orientation between the dawn and sunset extremes will see a motion of 75 degrees to either side, and thus, according to the table above, will lose 75% of the energy in the morning and evening. Rotating the panels to the east and west can help recapture those losses. A tracker rotating in the east–west direction is known as a single-axis tracker.
The Sun also moves through 46 degrees north and south during a year. The same set of panels set at the midpoint between the two local extremes will thus see the Sun move 23 degrees on either side, causing losses of 8.3% A tracker that accounts for both the daily and seasonal motions is known as a dual-axis tracker. Generally speaking, the losses due to seasonal angle changes is complicated by changes in the length of the day, increasing collection in the summer in northern or southern latitudes. This biases collection toward the summer, so if the panels are tilted closer to the average summer angles, the total yearly losses are reduced compared to a system tilted at the spring/fall solstice angle.
Single Axis Tracker
Single axis trackers have one degree of freedom that acts as an axis of rotation. The axis of rotation of single axis trackers is typically aligned along a true North meridian. It is possible to align them in any cardinal direction with advanced tracking algorithms. There are several common implementations of single axis trackers. These include horizontal single axis trackers (HSAT), horizontal single axis tracker with tilted modules (HTSAT), vertical single axis trackers (VSAT), tilted single axis trackers (TSAT) and polar aligned single axis trackers (PSAT). The orientation of the module with respect to the tracker axis is important when modeling performance.
1.1.3 Introduction to Web-based Service
Web Services uses standard web protocols like HTTP, etc. HTTP is supported by all Web Browser, Servers and many Programming Languages. This means you can create and use Web Services in all the popular programming languages.
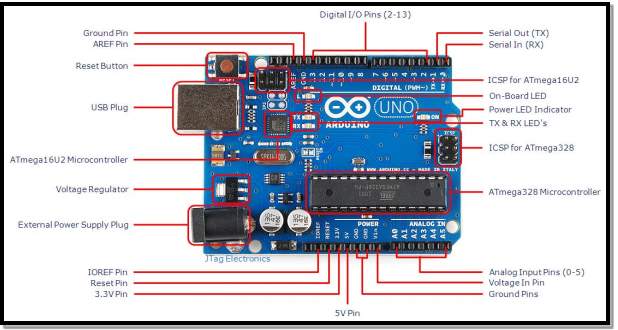
1.1.4 Introduction to Arduino
Arduino is an open source, computer hardware and software company, project, and user community that designs and manufactures microcontroller kits for building digital devices and interactive objects that can sense and control objects in the physical world. Arduino board designs use a variety of microprocessors and controllers. The boards are equipped with sets of digital and analog input/output (I/O) pins that may be interfaced to various expansion boards (shields) and other circuits. The boards feature serial communications interfaces, including Universal Serial Bus (USB) on some models, which are also used for loading programs from personal computers. The microcontrollers are typically programmed using a dialect of features from the programming languages C and C++. In addition to using traditional compiler toolchains, the Arduino project provides an integrated development environment (IDE) based on the Processing language project.
Arduino is open-source hardware. The hardware reference designs are distributed under a Creative Commons Attribution Share-Alike 2.5 license and are available on the Arduino website. Layout and production files for some versions of the hardware are also available. The source code for the IDE is released under the GNU General Public License, version 2.[8] Nevertheless, an official Bill of Materials of Arduino boards has never been released by Arduino staff.
Most Arduino boards consist of an Atmel 8-bit AVR microcontroller (ATmega8, ATmega168, ATmega328, ATmega1280, ATmega2560) with varying amounts of flash memory, pins, and features. Arduino microcontrollers are pre-programmed with a boot loader that simplifies uploading of programs to the on-chip flash memory. The default bootloader of the Aduino UNO is the optiboot bootloader.[14] Boards are loaded with program code via a serial connection to another computer. Some serial Arduino boards contain a level shifter circuit to convert between RS-232 logic levels and transistor–transistor logic (TTL) level signals. Current Arduino boards are programmed via Universal Serial Bus (USB), implemented using USB-to-serial adapter chips such as the FTDI FT232.
Development of Software
A program for Arduino may be written in any programming language for a compiler that produces binary machine code for the target processor. Atmel provides a development environment for their microcontrollers, AVR Studio and the newer Atmel Studio.[39][40][41]
The Arduino project provides the Arduino integrated development environment (IDE), which is a cross-platform application written in the programming language Java. It originated from the IDE for the languages Processing and Wiring. It includes a code editor with features such as text cutting and pasting, searching and replacing text, automatic indenting, brace matching, and syntax highlighting, and provides simple one-click mechanisms to compile and upload programs to an Arduino board. It also contains a message area, a text console, a toolbar with buttons for common functions and a hierarchy of operation menus.
A program written with the IDE for Arduino is called a sketch.[42] Sketches are saved on the development computer as text files with the file extension .ino. Arduino Software (IDE) pre-1.0 saved sketches with the extension .pde.
The Arduino IDE supports the languages C and C++ using special rules of code structuring. The Arduino IDE supplies a software library from the Wiring project, which provides many common input and output procedures. User-written code only requires two basic functions, for starting the sketch and the main program loop, that are compiled and linked with a program stub main() into an executable cyclic executive program with the GNU toolchain, also included with the IDE distribution.
1.1.5 Introduction to DC motor for tracking
Solar trackers rely on a direct-current (DC) motor driver circuit to control the movement of the solar panel. However, conventional DC motor drivers used in solar tracking system do not provide any options for speed and torque control. Hence, the fixed speed of the DC motor leads to either too fast or too slow tracking movement. Usually, the output torque is set to the maximum. If the load (solar panels’ weight) is small, the maximum torque is not fully utilized and therefore energy is wasted. So, a fully adjustable DC motor driver for solar tracking system shows great potential in commercialization because highly energy efficient DC motor driver circuit can improves the total efficiency of the solar tracker. Fewer solar panels are needed when they are attached to high efficiency solar tracking system, which will be reflected to lower system cost. Therefore, this enhanced motor driver will bring significant impact to the solar energy industry. The proposed DC motor driver is fully adjustable in term of speed and torque. The speed and torque of the motor is directly proportional to the output voltage and output current of the proposed DC motor driver, respectively. Adaptive controlling of the output voltage and current are possible by installing algorithm in the microcontroller of the DC motor driver and it can be reprogrammed according to the requirement. The speed control makes the solar tracking system to track the Sun more accurately and the torque control saves energy.
1.2 AIM OF PRESENT WORK
The conventional mode to assess the information of any system was very difficult because of lack in technological advancement. First limitation is that the data cannot be transferred from one place to remote area. The advent of computers is a profound technological revolution, entirely changed the way people work and live. However, the need to run the computer program, the general text programming personnel demanding, LabVIEW now abandoned the obscure text code, which allows graphically programmed to applications continue to develop. At present, LabVIEW web application reach has covered industrial automation, test and measurement, computer simulation, and other fields. In automated data acquisition systems, the LabVIEW web services pass on a GUI straight forwardly to another computer.
The aim of the particular work is to make collaboration among other labview softwares to obtain the behaviour as well as the output of the photo voltaic stand alone energy system. LabVIEW has some more advantages over the other software. One of the advantages is that it provides extensive support for accessing instrumentation hardware.
Therefore, the aim of our present work is:
- Tracking a solar panel
- Send out the data via Labview web services
- To develop a simple, sensitive, accurate and economical real time system
1.3 PROBLEM SPECIFICATION
In the prior technologies, there was not advancement in technology that we can plan a solar energy plant. So, now as the solar panels are available with satisfactory efficiency, we are able to make a solar plant. They are usually at far distances from load centres, so it is very cumbersome and lengthy which required a great deal of period with manpower to take reading coming out from any solar plant. Furthermore, sun rays are changed their direction over the period of a day. The efficiency of any solar panel would be increased by solar tracking. They get tracked by the solar radiation and according to that they change their direction. Also, in LabVIEW, there is a facility to send data to farther area named as LabVIEW web service. By using that service, we can check the reading of any solar panel from our control-room computer. This way, we can save many energy and also it is trustworthy and satisfactory giving result.
1.4 BRIEF LITERATURE REVIEW AND PRIOR ART SEARCH ABOUT THE PROJECT
1.4.1 Brief about literature review
Title: PV SOLAR CELL REAL TIME DATA MONITORING USING LAB VIEW AND DAQ
This research paper is devoted to current measurement and data acquisition systems for PV system. There are a few basic guidelines given to produce a VI and configuring a VI to run continuously. Furthermore, there are every steps are given for creating an NI DAQMX task as well as for graphing data from a DAQ device. Some unknown LabVIEW features are demonstrated very depthly. An interfacing device DAQ hardware description, block diagram and pin configuration is also given. Moreover, block diagram, circuit of the system, functional block of current sensor and pin configuration is depicted. In the given work, there are also details of pin diagram and an electric characteristic of IC 7805 is given.
Title: Development of Virtual Laboratory for Simulation and Performance Analysis of PV System
In this research paper, description and mathematical modelling of PV system and also the front panel is viewed and controlled by web browser is demonstrated. This method integrates the various sorts of measurements in one software. In the given paper, current, voltage and power measurements are given with LabVIEW software and output results graphs are shown. The output from the sensors is given on DMM. A photo of experimental set-up is shown. Here, in the given paper, how to send the data from one place to remote area by web browser is also given with photographs.
Title: Data Acquisition in Photovoltaic Systems
In this work, the activity and results about the function of a PV system plus aspects on monitoring the electric energy supplied through a PV system which is built in Romania. This solar panel of 66 cells which produces 10 kWp. In the given work, the block diagram of DAQ card is given. The LabVIEW program of voltage, current and power is also given. How to quantize the signal is demonstrated very depthly. Moreover, the functional components of a basic data acquisition are also stated. The simulation graph is shown of current versus voltage, power versus voltage and power versus load. The phase diagram of 3 phase is also given by figure and harmonics in voltage along with current are shown in figure.
1.4.2 Summary of PSAR report
Title: Photovoltaic generating data monitoring system
In the present invention, the solar panel gets the sun rays and solar cell converts it into equivalent electrical output voltage. this gets damaged by any high frequency noise which should be avoided by means of a set of signal conditioning means of amplification, attenuation, isolation, multiplexing, filtering etc. signal conditioning would be connected with the data acquisition equipment. Monitoring system using industrial RS485 bus for communication between the lower machine and monitors the main PC. RS485 bus can achieve greater transmission distance, and data distribution module is based on LAB-VIEW software programming and software stored in the memory module. The data acquisition module module connected to the data distribution, data distribution module is connected to the lower machine; the data acquisition module and data distribution module is based on LAB-VIEW software programming and software stored in the memory module. This how the data of solar energy is obtained and stored in software and whenever required it can be retrieved.
Title: LabVIEW based intelligent household monitoring system
In the present invention, Intelligent residence inspection system LabVIEW user interface by means of LabVIEW. The smart home monitoring system based lying on LabVIEW, together with acquisition element temperature in addition to humidity acquisition unit, light acquisition unit, smoke acquisition unit, an infrared acquisition unit, access unit, data acquisition card, lighting control switches, air conditioning control switch, curtain switch control, exhaust control switches, controllers, and wireless wifi module USB camera, temperature acquisition unit, acquisition unit humidity, light acquisition unit, smoke acquisition unit, an infrared acquisition unit, correspondingly, through the access control unit and a signal conditioning circuit data acquisition card is attached to the input terminal to controller via data acquisition card. The present invention is based lying on the smart home monitoring system on LabVIEW, through a variety of sensor module collection subsequent to signal conditioning, via USB-6009 data capture card into the controller, the controller sends to the mobile terminal equipped with LabVIEW through a wireless wifi module, complete the environmental parameters display, analyze, store and alarm functions. The output terminal of the battery power conversion circuitry linked to the output of the power translation circuit is provided for the smart home monitoring system power supply.
1.5 PLAN OF WORK
Here, the prospect plan of this task work has been demonstrated. The project is divided into two stages, which are hardware and software development. In hardware development, solar module would be attached to the dc motor by means of some mechanism. The motor shaft will attach to the solar panel. On the software part, we will send data from one labview to another computer. First of all, we shall study the essential documents in order to understand how we are going to complete our task on time. Then, we are about to construct arduino program in arduino software. After that, we will formulate P MOSFET circuit to give the input voltage to arduino. Next, we will join that structure with a solar panel. And last, we will connect and check the output in other labview service. This how, we are going to fulfil the project.
1.6 MATERIALS OR TOOLS REQUIRED
1.6.1 Tools required
In the current study, we required several tools which are given.
- NI labview software
- DAQ hardware 6008/6009
- Personal computer or laptop.
- Battery (12 V, 4 A)
- Charge controller
- Arduino software
- DC motor
- P Mosfet circuit
- Solar module
- Digital multimeter
1.6.2. Materials required
In the present work, we required these following materials for studying.
- Official manual on LabVIEW of National Instruments
- DAQ card datasheet
- Research paper on solar tracking
- Articles on arduino and dc motor
- Paper published related to the project
- Circuits of Mosfet
CHAPTER – 2 BUSINESS MODEL CANVAS
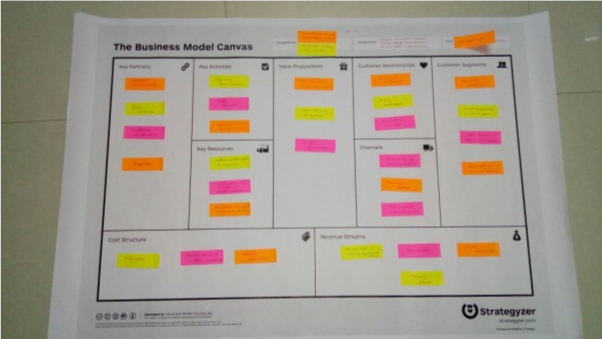
Business Model Canvas has been introduced to make a good product out of the students final year project to help the society & increase manufacturing industries in India. One can also make a patent from their project.
Content of Business Model Canvas:
Key Partners: In this students can do the partnership with different companies according to their product. By doing this students got the idea about what is market scenario, optimization in product & cost can be achieved, from where they got raw material of their product.
We are making our partners to prepare this projects are different organizations, joint ventures, institutes and faculties, and suppliers.
Key Activities: In this students got aware about how will they represent their product to customers. They can use the media, radio, newspapers etc. for marketing of the product.
The main activities were testing and prior art research about this project. Another activities are solar tracking of a solar panel and LabVIEW web services.
Value Proposition: In this one can directly come in contact with customer requirement. In this they will aware the customer about their product. How it is usable & beneficial over the conventional product and which kind of services they will provide to customers.
This project is energy saving or energy conservative. It is very beneficial to the solar energy power plants as many tropical countries like India. And labview is also automatic data (GUI) Transferring to another computer.
Key Resources: In this section student got idea about, from which kind of industries, they will purchase raw material for their product. The key activities are mainly institute and laboratory as they are the main substances.
Customer Relationship: in this section students got to know about how they will manage the relationship with customer by giving them lucrative services. The customers are very attracted or fascinated towards the project. They believe that it is very innovative and unique.
Customer Segment: Bifurcate the customer according to their product to which kind of customer they can sell their product. The major customers are enterprisers and smaller shoppers who sell solar equipment. Another customers are institutes and research scholars.
Channel: in this students got to know about how they will approach customers, which media they should select for the marketing of their product. Here, channels are personal contact to the customer or virtual channels like social networking websites.
Cost Structure: they can attract customers towards their product by giving them lucrative offers in cost. In which department, they should have to invest most. It is general expenditure and free trial periods and in economical terms.
Revenue Stream: in this section students got know about, from where revenue will generate from their product. Price can be negotiable according to customer requirement. How it is beneficial in cost as compare to same product available in market.
It is done by giving rights or selling project to others, sponsorships or trending projects and some direct sellings.
CHAPTER-3 IMPLEMENTATION
3.1 DESIGN OF CONSIDERATION FOR DETAIL DESIGN PART
3.1.1 SYSTEM BLOCK DIAGRAM
Solar Tracking

Charge Controller

Battery


Current sensor
Voltage sensor
Temperature sensor
Light intensity sensor


DAQ hardware

LabVIEW software
3.1.2 SOLAR MODULE
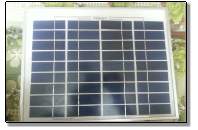
Fig. 3.1 solar module (36 cells, 10 W)
This is the diagram of solar module which we have used in our project work. It is of about 36 cells with rating of 10 W and 4 mA.
3.1.3 BATTERY
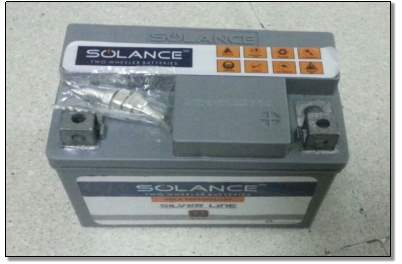
Fig 3.2 battery (12 V, 4 A)
This is the battery which has been used in our project work. Its output is about 12 V and 4 A.
3.1.4 CHARGE CONTROLLER
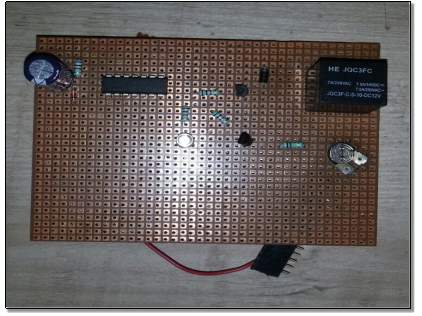
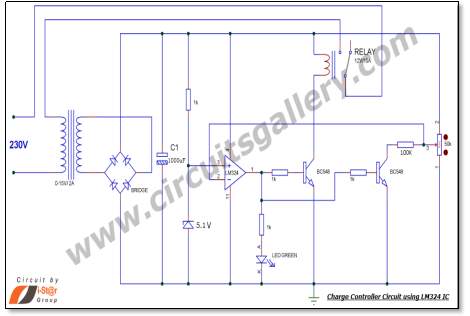
Fig. 3.3 circuit of charge controller
Fig. 3.4 charge controller
The main function of charge controller is to limit the rate at which the current drawn or added to batteries. This prevents the batteries from over-charging, which extends the battery life. Charge controller gets signal from the solar module. It may also prevent draining completely a battery depending upon the battery technology to prevent the battery life. This charge controller terms may refer to either a stand-alone device within a battery pack.
This is a circuit of charge controller on printed circuit board. It consists of a relay (12 V, 10 A), Diode, Capacitor, Resistors, IC LM324, an LED, Transistor BC548x2 and connecting Wires. The output voltage coming out from this circuit is about 12 V.
3.1.5 CURRENT SENSOR
3.1.6 TEMPERATURE SENSOR
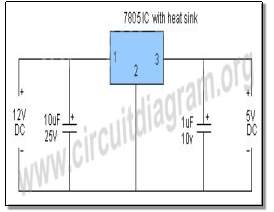
Fig. 3.5
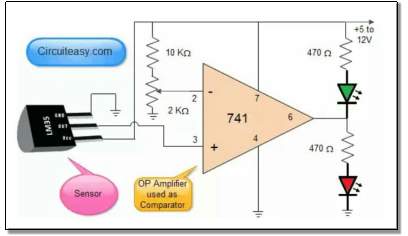
Fig. 3.6 Temperature sensor circuit
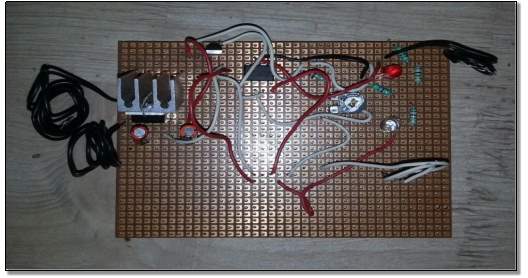
Fig. 3.7 Temperature sensor
We have also made a circuit of temperature sensor on printed circuit diagram. This circuit consists of a heat sink, IC LM 35, 2 resistors of 470 ohm, one resistor of 10k ohm and one of 2k ohm. Here, IC LM35 detects accurate temperature. It has a wide range of measurement and a good accuracy. The output of IC increases as the temperature rises. This changing voltage is fed to a comparator IC. The op-amp is one type of differential amplifier which has two input inverting and non-inverting and one output pin. This circuit amplifies the difference between its input terminals.
3.1.7 LIGHT INTENSITY SENSOR
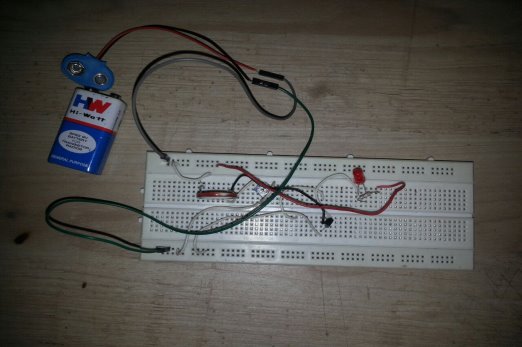
Fig. 3.8 Light intensity sensor
3.1.8 DAQ HARDWARE
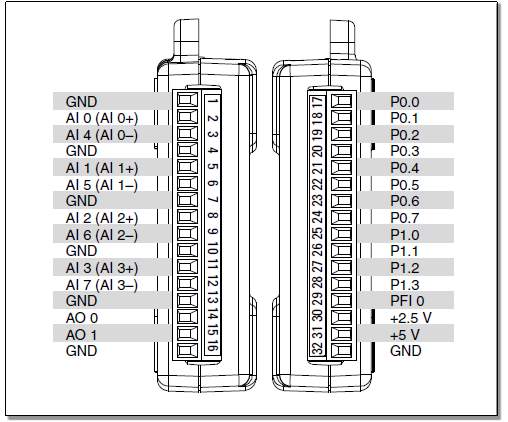
Fig.3.9 Pin diagram of DAQ hardware
This is the actual pin diagram of NI DAQ card 6008/6009 which having 32 input/output pins. The National Instruments USB-6008/6009 devices provide eight single-ended analog input
(AI) channels, two analog output (AO) channels, 12 DIO channels with a full-speed USB interface. Here, it has two parts, one comprises analog input pins (1 to 16) and alternate side has the digital input pins (17 to 32). AIx pins are the input channels where input analog quantities are to be given whereas AO pins are the output channels where the output is to be obtained.
3.2 RESULTS
3.2.1 LABVIEW PROGRAM OF TEMPERATURE
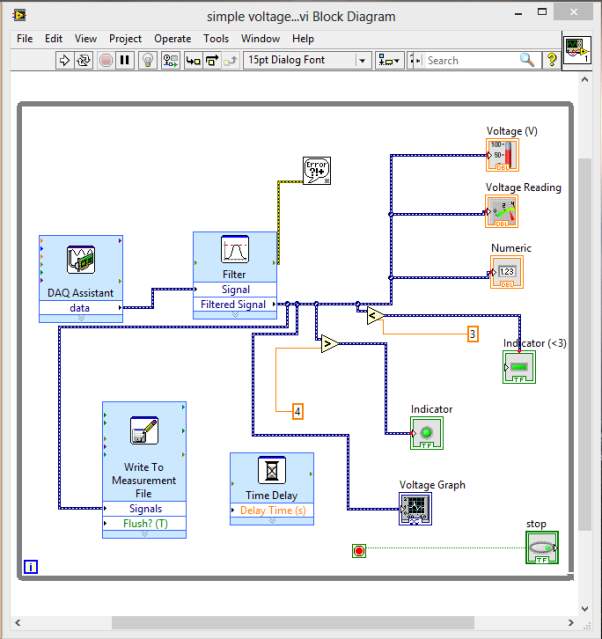
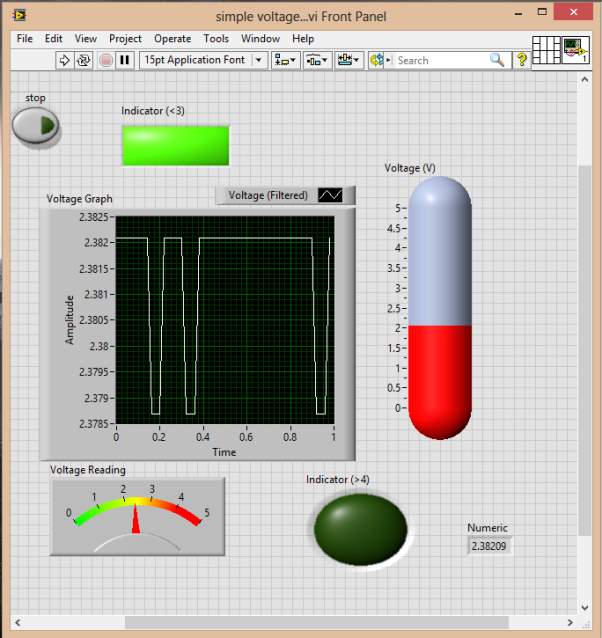
3.2.2 STEPS FOR LABVIEW PROGRAM OF TEMPERATURE
Complete the following steps to add a While Loop to the block diagram.
1. Display the front panel and run the VI. The VI runs once and then stops. The front panel does not have a stop button.
2. Display the block diagram.
3.2.3 LABVIEW PROGRAM OF LIGHT INTENSITY
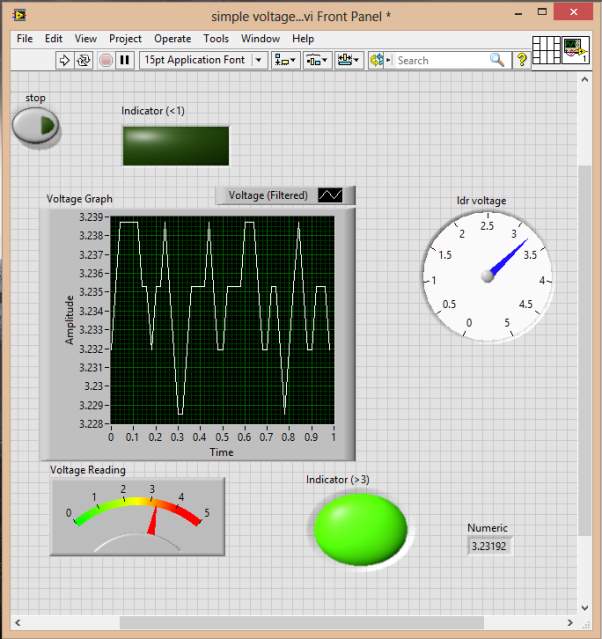
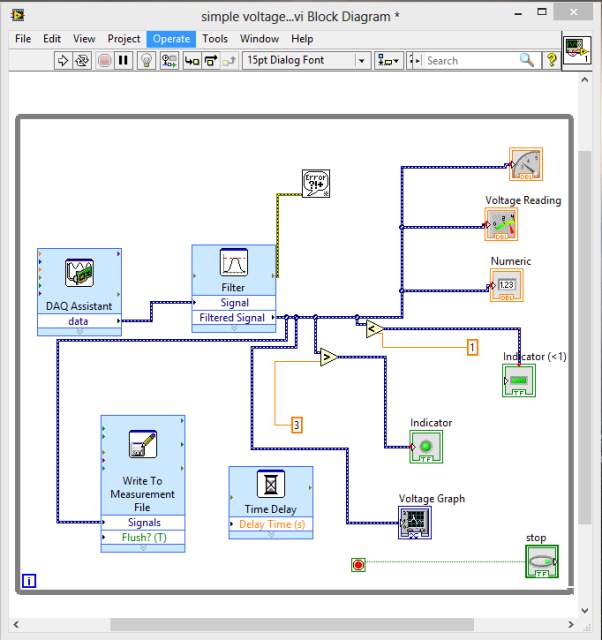
3.2.4 STEPS FOR LABVIEW PROGRAM OF LIGHT INTENSITY
Complete the following steps to add a While Loop to the block diagram.
1. Display the front panel and run the VI. The VI runs once and then stops. The front panel does not have a stop button.
2. Display the block diagram.
3.2.5 LABVIEW PROGRAM OF CURRENT
3.2.6 STEPS FOR LABVIEW PROGRAM OF CURRENT
Complete the following steps to add a While Loop to the block diagram.
1. Display the front panel and run the VI. The VI runs once and then stops. The front panel does not have a stop button.
2. Display the block diagram.
3. Click the Search button, shown at left, on the Functions palette, and enter while in the text box. LabVIEW searches as you type the first few letters and display any matches in the search results text box. If there are objects with the same name, use the information in the brackets to the right of each object name to decide which object to select. Some objects are located on multiple palettes because you can use them for multiple applications.
4. Double-click While Loop <<Execution Control>> to display the Execution Control sub palette and temporarily highlight the While Loop on the sub palette.
5. Select the While Loop on the Execution Control palette.
6. Move the cursor to the upper left corner of the block diagram. Click and drag the cursor diagonally to enclose allthe Express VIs and wires, as shown in Figure.
7. Release the mouse to place the While Loop around the Express VIs and wires. The While Loop, shown at left, appears with a STOP button wired to the conditional terminal. This While Loop is configured to stop when the user clicks the STOP button.
8. Display the front panel and run the VI. The VI now runs until you click the STOP button. A While Loop executes the VIs and functions inside the loop until the user clicks the STOP button.
9. Click the STOP button and save the VI.
3.1.14 LABVIEW PROGRAM OF VOLTAGE
3.1.15 STEPS FOR LABVIEW PROGRAM OF VOLTAGE
Complete the following steps to add a While Loop to the block diagram.
1. Display the front panel and run the VI. The VI runs once and then stops. The front panel does not have a stop button.
2. Display the block diagram.
CHAPTER -4
4.1 SUMMARY OF THE RESULTS
Currently, India leads the world with largest amount of solar energy expected to fast developing industry. Statistic data shows that the solar energy is going to be used everywhere from industries to house for generating electricity. In earlier time period, there were not any advance techniques to acquire the data coming from solar panel.
In present work, LabVIEW software has been used to acquire the data from solar cell. Furthermore, this data is sensed by various sensors as well monitored continuously by software (LabVIEW) which uses graphical programming language. These programs are easier to understand who do not have any technical knowledge of programming languages. In addition, DAQ hardware has been used to perform a role of mediator between sensors and LabVIEW software. The advantage of this work is that for any solar plant located at far side, the data can be obtained and analysed continuously by web services.
4.2 CONCLUSION
Even though the costs of installations producing electric energy with PV modules are high compared to the costs of conventional installations, the number of such systems is continuously increasing. Thus, it is very important to determine the output characteristics of the PV panels in order to achieve an accurate connection and operation of the device and reduce the energy losses. To quantify the potential for performance improvement of a PV system, data acquisition system has been used.
The main goal of this work is to increase decision effectiveness in PV power system through the design and implementation of a new real-time system for measuring variables, monitoring and making a decision for the photovoltaic power system. From the experimental results, it can be said that the proposed monitoring system is very robust and control signals are very accurate. This system is very reliable, precise, cheap and more flexible for large scale photo voltaic power plant monitoring. The monitoring results are very satisfactory. By making this project, we have concluded that this product has high potential for marketing in the future.
4.3 ADVANTAGES OF THIS WORK
This project has many benefits which are given below:
The data is acquired in real time which is the biggest advantage of the work. This system is very reliable, compact in size and accurate in measurement. The present work is precise in results and high performance. This hardware is also robust, simple in working, very rapid in time manner, highly sensitive, accurate working and economical in price. The present invention is very stable, friendly interface, easy to operate and low cost along with easy to use features.
Trackers add cost and maintenance to the system – if they add 25% to the cost, and improve the output by 25%, the same performance can be obtained by making the system 25% larger, eliminating the additional maintenance.[28] Tracking was very cost effective in the past when photovoltaic modules were expensive compared to today. Because they were expensive, it was important to use tracking to minimize the number of panels used in a system with a given power output. But as panels get cheaper, the cost effectiveness of tracking vs using a greater number of panels decreases.
Tracking is also not suitable for typical residential rooftop photovoltaic installations.
Since tracking requires that panels tilt or otherwise move, provisions must be made to
allow this. This requires that panels be offset a significant distance from the roof,
which requires expensive racking and increases wind load. Also, such a setup would
not make for a very aesthetically pleasing install on residential rooftops. Because of
this (and the high cost of such a system), tracking is not used on residential rooftop
installations, and is unlikely to ever be used in such installations. This is especially
true as the cost of photovoltaic modules continues to decrease, which makes
increasing the number of modules for more power the more cost-effective option.
Tracking can (and sometimes is) used for residential ground mount installations, where greater freedom of movement is possible.
4.4 USEFULNESS WITH EXISTING PRODUCT
It is very valuable with respect to the existing product as the LabVIEW software is being used here which is very demandable in industries for automation. Nowadays, as the automation is used everywhere industry as well as home to meet that demand this project is vital needs for other similar products. In industries, to acquire the real time data from any system, many software are being used, but among them LabVIEW software has highest benefits than any other software. This product is compact which is very advantageous than the other existing products. Hence, this system is very usefulness.
4.5 SCOPE OF FUTURE WORK
From the present work, there are many ways for further up gradation. Basically, there are four ways which are given below:
We can send the data of any solar panel from one place to remote area by using internet. We can also connect a dual-axis stepper motor to move the solar panel as the sunrays changed their direction for getting high efficiency. We can connect an inverter across the battery to generate ac electricity. To combine PV system with other renewable system to monitor the data continuously make it as a hybrid system.
4.6 UNIQUE FEATURES
This model has many unique features which are given below:
This model is reliable and uses less energy and meets the goal of data acquisition system as high speed, real time calculation. This system is less time consuming along with easy to drive. Maintenance cost and up gradation cost of system is also reducible due to use of software. You can use various nodes to perform mathematical operations on the block diagram. You also can use the LabVIEW Math Script text-based language to write mathematical functions and scripts. The present invention is stable, friendly interface, easy operation and low cost, easy to use features.
REFERENCES
- Valentin Dogaru Ulieru, Costin Cepisca, Horia Andrei and Traian Ivanovici, “Data Acquisition in Photovoltaic Systems.” Valahia University of Targoviste, University Politehnica of Bucharest, Romania.
- H.Bala Murugan, S.V.Siva Nagaraju, K.Satish Kumar, K.C.Ramakrishnan, V.E.Sowjanya, “PV Solar Cell Real Time Data Monitoring Using LabVIEW And DAQ.” International Journal of Advanced Research in Electrical, Electronics and Instrumentation Engineering Vol. 2, Issue 8, August 2013.
- M.Hamdaoui, A. Rabhi, A. El Hajjaji, M. Rahmoun, M. Azizi, “Monitoring and control of the performances for photovoltaic systems.” International Renewable Energy Congress, 2009.
- LabVIEW“Getting Started with LabVIEW.” National Instruments June 2009.
- “USER GUIDE NI USB-6008/6009.” National Instruments.
- Hans-Petter Halvorsen, “Introduction to DAQ with LabVIEW.”
- Hans-Petter Halvorsen, “Data Acquisition in LabVIEW”, Telemark University College, Department of Electrical Engineering, Information Technology and Cybernetics, Issue 16, August 2013.
- Aissa Chouder, Santiago Silvestre, Bilal Taghezouit, Engin Karatepe, “Monitoring, modelling and simulation of PV systems using LabVIEW”, Sciverse ScienceDirect, October 2012.
- Narendra Singh Chauhan, Abhishek Kumar Gupta and Ravi Saxena, “Development of Virtual Laboratory for Simulation and Performance Analysis of PV System”, International Journal for Research in Emerging Science and Technology, Volume-2, Issue-5, May 2015.
- Napat Watjanatepin and Pakorn Somboonkij, “The Development of the Monitoring Software for the Mobile Weather Station”, International Journal of Information and Electronics Engineering, Vol. 3, No. 4, July2013.
Cite This Work
To export a reference to this article please select a referencing stye below:
Related Services
View allRelated Content
All TagsContent relating to: "Engineering"
Engineering is the application of scientific principles and mathematics to designing and building of structures, such as bridges or buildings, roads, machines etc. and includes a range of specialised fields.
Related Articles
DMCA / Removal Request
If you are the original writer of this dissertation and no longer wish to have your work published on the UKDiss.com website then please:

