Quality Function Deployment in the Mobile Phone Industry
Info: 9170 words (37 pages) Dissertation
Published: 29th Sep 2021
Tagged: Business
1 Project Aims and Objectives
1.1 Aims
The primary aim of this project is to gain an understanding of Quality Function Deployment and the methods that can be applied to the mobile phone industry in order to enhance the products at a rate that can cope with customers and their growing demands.
As this is a broad topic area it will be essential to carry out a large amount of research and produce a detailed literature review in both areas of QFD and the mobile phone sector. A case study will be reviewed regarding a company that has applied QFD to the mobile phone industry. Furthermore, a questionnaire will be analysed, using the House of Quality method, to view what aspects people of the modern era like to see in the phones they buy, what areas can be improved and how this customer satisfaction can be achieved using QFD.
1.2 Objectives
- To gain an in depth understanding of Quality Function Deployment by conducting a detailed literature review in the history of QFD, its applications and various methods used.
- To gain some background information into the mobile phone industry, how it has changed over the years and how companies have coped with problems along the way.
- To understand case studies in the mobile phone industry that have been undertaken by companies using QFD.
- A questionnaire will be sourced based on the most desired mobile phone features. Thereafter, the results from the questionnaire will be analysed and applied using the House of Quality approach to view what aspects people of the modern era like to see in the phones they buy, as well as what areas can be improved and how this customer satisfaction can be achieved using QFD.
- Discuss and come to a conclusion, using all the information acquired as to whether QFD and its techniques are substantial enough to help companies cope in the modern-day society in which we live.
2 Project Background
2.1 Introduction to QFD
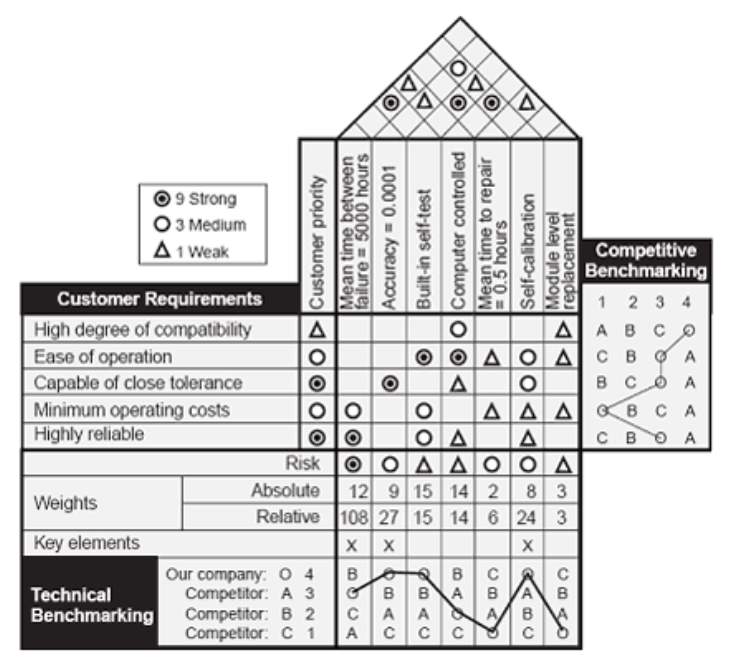
Quality is a major characteristic when it comes to products and services. It can be defined as meeting customer needs and providing a higher value to the products. The focus required on meeting the customer’s needs can be achieved by using methods such as Quality Function Deployment. This aspect can be used to help plan, develop and produce a product that will hold superior value. Quality Function Deployment (QFD) is ‘‘an overall concept that provides a means of translating customer requirements into the appropriate technical requirements for each stage of product development and production (i.e., marketing strategies, planning, product design and engineering, prototype evaluation, production process development, production, sales)’’ [1] This helps to manufacture a product to meet those needs. A way to ascertain the needs of the customer is through the “voice of the customer”. This can be achieved via questionnaires, focus groups, interviews and simple observations. These factors are then summarised using a matrix called “house of quality”, as seen in Figure 1, which uses the “what” factors that satisfy the customer, along with the “how” factors which are listed as the product requirements that are necessary to satisfy those needs.
QFD can be of high advantage to companies when a team of people from various functional departments come together in the product development stage, such as Marketing, Design, Development, Manufacturing, etc. The dynamic contributions of all these teams help to interpret the customer’s “what” values and allows each team to make an input with their own knowledge and understanding of the area in which they work. This is essential as one department may have more knowledge in one area compared to that of the organization throughout. QFD allows the development team to focus on the customer and minimises the misinterpretation of the customer’s needs. Hence, it is seen and used as an effective communications and development-planning tool.
Quality Function Deployment originated and was practised in Japan in the early 1960s and since then it has been proclaimed as an important factor when it comes to the product development process. Studies indicate that as many as between 35 – 44 per cent of all new products launched are considered failures. It is also documented that the use of QFD can reduce the development time by 50 per cent, and the start-up and engineering cost can be reduced by 30 per cent. [3] Hence, in the modern, fast moving society we live in, it is important to find new techniques such as QFD to help cope with the increased demand, and to reduce the stress on companies and their development teams.
2.2 Introduction to Mobile Phones
“By the year 2020, an entire generation, Generation C (for “connected”), will have grown up in a primarily digital world. Computers, the Internet, mobile phones, texting, social networking — all are second nature to members of this group. And their familiarity with technology, reliance on mobile communications, and desire to remain in contact with large networks of family members, friends, and business contacts will transform how we work and how we consume.” [4] The effects of this new digitized world on people are changing the way we live owing to three main factors that reinforce one another:
- Customer pull: The so-called Generation C and consumers of the modern day are now getting to grips with technology at a rate that has never been seen before. People are naturally expected to be connected all the time, and through reference to the likes of their closest friends, they are sharing more and more personal data with one another.
- Technology push: The digital industry has a large influence on its users and the foundation structure that it is bringing to the world is providing users with low cost connected devices, broadband and cloud based computing. In addition, the immeasurable amount of machinery involved to provide these products and services is being developed at a rate like no other.
- Economic benefits: The movement and development of the digitized industry provide the economy and the business with an unprecedented number of benefits, and these will continue to grow as Generation C and future generations live a life that is completely involved and based around technology. [4]
The dominant industry in the digitized world, integrated across the majority of the globe, is the mobile phone industry. Providing everyday users with a means of communication, Internet, messaging, entertainment and more, it does so whilst the user is on the move throughout the day.
Figure 2. Shows the average number of hours in a month that a person spends browsing the Internet on a smartphone. Conducted in August 2016, it shows that UK users typically spend 66 hours per browsing the internet, which is an average of nearly 2.5 hours a day.
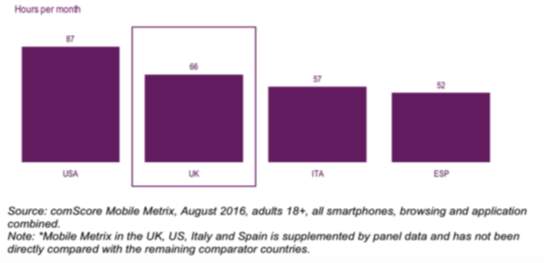
Figure 2 Average time spent browsing on a smartphone: August 2016 [5]
With mobile phones having so many functions and abilities both in terms of hardware and software or even general convenience, it would be expected for there are many advantages and disadvantages associated with the product. These advantages and disadvantages will be looked into further later on in the report.
2.3 Project Background Conclusion
In terms of Quality Function Deployment and the mobile phone industry, companies need to take an approach that will improve and change their efforts with regard to managing the consumer decision journey. One that will allow them to keep up with the rapid development in technology trends, whilst still focusing on the capabilities in three main areas: Discover, Design and Deliver (Figure 3). With the vast amount of data available to companies, they
must analyse and structure their approach towards the data available in order to gain a 360-degree view of their customers. They can achieve this by looking at recent behaviours, past
experiences customers have had with the company, as well as various signals and data from the customer’s mobile and social media. Design plays a big part in the customer satisfaction journey. Consumers have a vast amount of control as to where they focus their attention and, consequently, companies should prioritise the customer’s experience by tailoring the interaction they have with one another so that it enhances the journey between company and consumer.
Lastly, delivering or marketing the mobile phone to the customer through the means of marketing programmes, engages the customer. This requires highly knowledgeable cross functional teams that are experts in technology, marketing and experience design to communicate efficiently as well as test, learn and scale at a pace that is proven to be challenging. [6]

3 Literature Review
3.1 History of QFD
QFD originated in Japan in the late 1960s, after the second world war, as a method for new product development under the influence of Total Quality Management/Control (TQM). During that time, the Japanese automotive industry was booming and therefore going through new product developments and changes to existing models. Methods to develop QFD began to take shape owing to the two following issues that arose during the time:
- People and companies started to appreciate how factors like quality can affect the value of products and, consequently, what the effects of designing for high quality can achieve. However, there were no written books or existing methods on how this could be achieved.
- Quality Control (QC) charts were already being used to inspect the quality of products but this was done at the manufacturing stage after new products had been introduced to the line.
A Japanese man, Joji Akao, and his colleagues worked on developing the process that involved designing and manufacturing a product that was of high quality from the start of the production and development phases. Akao questioned, [8] “By the time design quality is determined, there should already exist critical quality assurance (QA) points that are needed to ensure certain qualities. Why, then, could we not note these critical points on the QC process chart as predetermined control points or check points for production activity, prior to production start-up?”. It was from this point that they began to investigate and refine methods in which QFD could be applied, and also what they should call this new technique.
The Japanese characters for QFD are:
 (hinshitsu), meaning “quality”, “features”, “attributes” or “qualities”
 (kino), meaning “function” or “mechanization”
 (tenkai), meaning “deployment”, “diffusion”, “development” or “evolution”
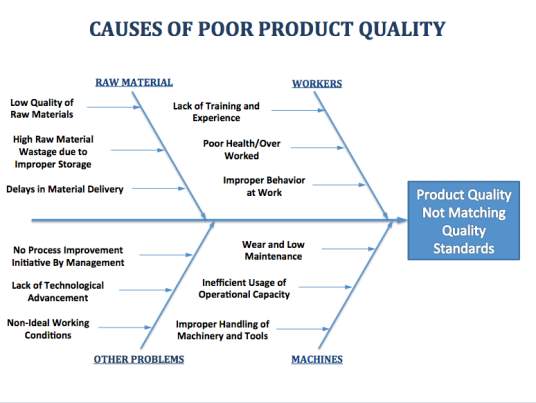
When Mr. Akao worked with Kiyotaka Oshiumi of Bridgestone Tire, the word hinshitsu tenkai, or quality deployment, was used to describe QFD. At this stage, a fishbone diagram was used to identify the customers’ requirements (effects), along with the design quality characteristics and process factors (causes) that were needed to control and measure the effects. This technique involved the four corresponding steps:
- Identify the effect (problem):
The first step involves writing down the main problem in the area of interest, this may not be as simple to find therefore brainstorming or team meetings may be required to identify the main problem. The problem is then written on the far-right side of the page inside a box, an arrow is then drawn coming from the left hand side towards the problem.
- Identify and categorise causes:
The next step is to identify the relevant causes of the problem and categorise them in a means that is easy to understand. If this cannot be done a simple category 1, 2, 3 type example can be used. Lines are then used to join these categories to the main arrow (backbone of the fish), these make up the bones of the fish.
- Brainstorm possible causes:
For each category, causes for the problem are brainstormed to make smaller sub categories or bones. This is done a number of times until the company is satisfied that have enough categories to solve the problem.
- Analyse the Fishbone diagram:
With the fishbone diagram complete, the team will sit down and look at all the causes of the problem and come to a decision as to what the main cause of the problem is and find a collective solution to fix the problem in question.
In 1972, the word hinshitsu tenkai was modified to hinshitsu kino tenkai, or Quality Function Deployment, when an oil tanker was being manufactured at the Kobe Shipyards of Mitsubishi Heavy Industry to relate to the customer’s needs and the quality characteristics. However, any of the phrases listed above could have been used. Mr. Akao tried to change the meaning at one stage but due to its popularity in the US it has continued to be used ever since. [9] The fishbone diagram was proven to be impractical to use when designing the oil tanker as there were multiple customer requirements that shared the same causes. Thus, the fishbone diagram was refurbished into a spreadsheet/matrix format with rows showing the effects and columns showing the causes.
[3…]
After ten years of development in Japan, Kogure and Akao published their first book showing their findings and methods of QFD. The book was called “Quality Function Deployment and CQWC in Japan”. The first full length book on QFD in the US was published by B. King, Founder and Executive Director of GOAL/QPC. B. King and D. Clausing of Xerox and later MIT, were the first two to learn QFD in the US. Clausing and J. Hauser created an article called “The house of quality” which has been cited as increasing the popularity of QFD in the US. In 1986, the first recorded case study was created when Kelsey Hayes developed a coolant sensor. This was followed by other popular companies that used QFD in their products, such as AT&T, Goodyear, Ford Motor, NASA, Polaroid and Motorola followed soon after. [10]
In June 2016, ISO 16355 was approved. This was the first ISO standard for QFD and was proposed to guide both beginner and expert product and process designers who use QFD. The standard incorporates both detailed examples with guidance on new modern product development, VOC analysis, customer requirements management, innovation, and business redesign. The ISO has changed the way people use the standard house of quality approach and in the 21st century it has helped companies around the world to heap the benefits of new innovation, design and quality of many. [11]
To summarise, QFD originated to develop products in the early stages to help suit the customer’s needs by collecting and analysing certain factors or effects. Primary factors consist of product development, quality management and customer needs analysis. QFD is now used widely in many fields, such as design, planning, decision making, engineering, teamwork and costing.
3.2 Methods of QFD
There are many tools and techniques used within QFD, each different from the other, but overall providing the same outcome. Below is a list of techniques that have commonly been used:
- Affinity Diagrams
- Relationship Diagrams
- Hierarchy Trees
- Various Matrixes
- Process Decision Program Diagrams
- Analytic Hierarchy Process
- House of Quality
House of Quality is the preferred method of QFD that is used by many companies today. This method will also be applied to analyse the data later on in this report. The House of Quality diagram is a selection of hierarchies and tables consisting of the Demanded Quality Hierarchy, Quality Characteristics Hierarchy, the Relationships Matrix, the Quality Planning Table, and the Design Planning Table. All of these listed hierarchies and tables form one main diagram that involve connecting dots, based on how strong the relationship is between the voice of the customer and the voice of the engineer. In other words, House of Quality is a method used by a group, made up of smaller teams from different sectors in the company, to interpret and therefore establish the needs of the customer. This is done using market research and benchmarking data, and prioritises these targets into an appropriate number that will be met by a new product design. The six major sectors that make up the House of Quality diagram are looked into further below.
3.2.1 Customer requirements
The customer requirements, often referred to as the HOWs of the matrix, allow the Voice of the Customer (VOC) to be perceived by the company/organisation conducting the research. A team made up of people working in different areas within the organisation, come together and analyse the data received from the market research carried out beforehand. The typical team is composed of people from sales, R&D, quality control, production, design and various other areas within the business. This large mix of people is essential to ensure all areas of the VOC are referred to correctly via team discussions. These meetings allow the team to generate equivalent weightings for each of the customer’s characteristics, helping to identify what features are most important in the customer’s point of view. The customer requirements are essentially a translation of the customers’ requirements that are placed into a structured list.
3.2.2 Technical requirements
Often referred to as the WHATs of the matrix, this section shows the Voice of the Company or the technical requirements. Looking at the customer requirements, teams will discuss how each need can be translated into a technical and measurable part of the product. For example, in a mobile phone, if customers prefer a more ergonomic design, then companies may list points such as screen size, shape of phone, weight of phone, etc. With further discussion within the team, these points can then be specified even further consequently resulting in more technical style points corresponding to the VOC. To summarise, the technical requirements are a list of characteristics that can be measured in the product, which are required to meet the customer’s needs. These make up the vertical section of the House of Quality.
3.2.3 Planning matrix
The planning matrix is located to the right of the House of Quality diagram, it shows how well the specifications of the customer are currently being met by the company’s competitors. For example, company A’s product may have a more appealing design than the company carrying out the QFD research, whereas company C may not have a feature that company A has. This allows the team to find niches in the market with regards to their competitors, and also permits them to find pitfalls in their own products that they may not have otherwise noticed. The team can then choose whether to innovate a new product or redesign and develop a current product.
3.2.4 Interrelationship matrix
The body of the diagram, also referred to as the planning matrix, shows how closely each of the customer’s need relate to the technical requirement of the company. The matrix illustrates the interrelationships between the customer requirements and the technical requirements. This is developed by the QFD team and the perceptions they have of the two requirements, it is organised as a grid type matrix, whereby each relevant box is filled with either a number or a shape relating to how positively/negatively the points correlate to one another. Not all boxes have to be filled, for example if two points don’t correlate what so ever, then this box can be left blank. This part of the matrix can be filled in after many discussions between the team. Hence it is considered to be very time consuming. Finding the key relationships and minimising the number of requirements reduces the overall demands on the resources available. The interrelationship matrix is a good place for the teams to see which of the customer’s needs and which of the technical specification best link together and which don’t, helping them to prioritise what features they should spend more time taking attention to and which are not so important.
3.2.5 Technical correlation, the ROOF of the matrix
The roof matrix, located at the top of the HOQ diagram is used as a means to identify whether the technical requirements support, or conflict with, each other in the product design. Similar to that of the body of the diagram, it shows a grid like area where certain shapes or numbers are placed depending on how well or not so well the technical specifications correlate to one another. This allows the team to see which specific points link together and benefit each other and which ones could cause a risk if linked together in the development stage. It can also be used to identify innovative opportunities that may be at hand.
3.2.6 Technical priorities, benchmarks and targets
This is the final section of the house of quality diagram, it is used to judge how feasible the whole project would be. A more technical statistical form of data compared to the previous sections, it shows the cost required to produce and develop each factor of the project, this helps to decrease the risk associated with the project by allowing the team to assess where expenses will be used.
This section is used to record:
- The priorities assigned to the technical requirements that are in the matrix
- The technical performance achieved by the competitive products
- The degree of difficulty that is involved in developing each requirement
A set of values from the targets and technical requirements to be met are then linked back to the original demands of the customer. This produces the final output of the matrix in the HOQ diagram [12].
In essence, the House of Quality diagram is a conceptual map that illustrates a means to the planning and coordination of product improvement, and development of the product. This method therefore brings the needs of the customer into focus which in turn allows the product or service to be designed or redesigned to fulfil the customer’s needs. Primary, secondary and tertiary attributes are established by carrying out market research in the form of a survey or questionnaire about the product that is being designed. These attributes form the base of the house. Equivalent characteristics are then specified in clear measurable terms, and the interdependencies are listed in the form of the roof of the house. During this process, technical difficulties will arise when attempting to achieve the changes required. These will be calculated and thereafter the cost will be worked out from the corresponding importance of each characteristic. The final targets are set and the product is designed or redesigned in a clear, measurable manner. [12]
3.3 Applications of QFD
In the present day, QFD has been practically applied in almost every industry, from software systems to services such as banking. As it is such a broad technique it allows businesses from these various industries to easily manipulate and suit the House of Quality diagram to their requirements. Nevertheless, the first two reported applications of QFD were in the shipbuilding and electronics industries.
QFD was then used in the industries, such as the automotive, electronics and software sectors, eventually moving to a whole range of fields. It is difficult to identify a field in which QFD has not yet been applied. A few examples of companies that use QFD in the electrical sector are as follows: AT&T, DEC, IBM, Intel, Motorola and Phillips.
QFD, as mentioned before, has also been used in the services sector, from airlines to education. The application of product design with quality assurance presents a whole new range of unique challenges when used in the services sector. This is especially true for mobile services. A mobile phone is made up of a single physical product while the mobile services are embedded within to enable various consumption and interaction experiences. However, Nokia is one of the only known mobile phone companies to produce a study on QFD on its mobile phones. A QFD has rarely been applied in the mobile phone industry, this report aims to produce a House of Quality diagram for the industry, and show how QFD can be applied in such a widely used product in the modern world.
QFD has many techniques that can be applied depending on the company’s aims and outcomes. The House of Quality diagram can also be manipulated and sections can be added or removed dependant on what the company is looking to achieve from the research and process of applying QFD to their production line.
3.4 Benefits and Disadvantages of QFD
3.4.1 Benefits of QFD
Using QFD allows businesses to focus on the customer in the early stages of the product lifecycle, helping to understand what their customers are looking for in a certain product.
This can help businesses gain a strong understanding of the customer’s needs, increasing the effectiveness of the business, as well as their overall knowledge of the customer. Using QFD, an aspect of quality will arise that will increase the overall positivity, as well as create a sense of value of a product. Essentially this can be done using the spoken and unspoken customer requirements. QFD is beneficial in a sense that, instead of typically focusing on the manufacturing/engineering capabilities of a product, it focuses all of its activities on the customer needs via the product development stage. It helps to increase the value of the product immediately compared to products produced using conventional design processes. Overall this will improve reliability by guaranteeing consistency between the requirements of the customer and the specifications of the product, as well as with the planning and production phases. In terms of business benefits, QFD enables functional teams from various backgrounds in the business to communicate with one another and input ideas using their specific expertise. Thus, increasing teamwork and participation in the business helps to expand potential in the decision-making process.
As QFD is conducted in the early stages of the planning process, it saves a large amount of time and cost downstream, as more time will be spent creating a valuable product for the customers before manufacturing and sales take place. In comparison to releasing a product then seeing how well it is doing in the market and redeveloping it based on the information gathered. Techniques such as the House of Quality can be re used again and again, on further products or to redevelop current products and once teams learn how to use the diagram effectively, this tool can be proven to play an important part in the company.
In summary, QFD improves the quality of the product as well as the relationship between businesses and customers whilst increasing the customer satisfaction and reducing the design and manufacturing costs. Similarly, reducing the design changes that would otherwise have to be solved later in the product development stage. [13]
3.4.2 Disadvantages of QFD
Although there are many benefits with QFD, there are a small number of limitations when using this method, some of which include the issue of finding out the customer’s perception on what they would like to see in a product. As mentioned before, this can be established by using a questionnaire or market survey. However, if this is not carried out in an adequate manner it can harm the whole analysis and process and, in turn, damage the reputation of the firm. Another factor associated with the pitfalls of QFD is the rate at which a customer’s needs change. Customers are easily influenced by social media, television, the internet and by their friends and family, which can affect their thoughts on a product, as well as change their perception of what is satisfactory to them. Therefore, businesses have to keep up to date and adapt quickly to these continuous changes in customer requirements. This is often why products are developed and newer generations of a product are released in a small timeframe.
QFD requires the right organisational environment in order for it to be most effective. It cannot be constructed on a piece of paper or a chart. The most effective way to do this is online, this creates a more structured and neat diagram that can be easily read and interpreted. This however still requires a large amount of time to construct, especially if it has not been done before in the company and a template is not available to hand. Likewise, modifications, additions and things that need to be deleted can cause problems to the diagram itself, which can create extra work for the company.
Fiorenzo Franceschini stated that QFD doesn’t work well in companies that are split into divisions or into smaller departments, this is due to that fact that effective QFD environments require innovation and teamwork. [1…] Sharing information between each other to come to a final conclusion. Many larger organisations cannot accomplish this process with departments, making QFD an additional work process rather than an effective one to suit target customer’s needs.
Overall, it can be established that the benefits of QFD outweigh the limitations, hence the reason QFD is used widely across the globe. This does not mean that businesses are not challenged when it comes to manufacturing new products to meet customer requirements. It simply means that it significantly reduces the time and cost that may be required in another part of the product development lifecycle, thereby benefitting the business. [14]
3.5 Background into Mobile Phone Industry
Mobile phones have been around since the early 1900s and have served as an essential product to many throughout history and the present day. Serving as one of the most used products people can buy, the number of smartphone users in the world is estimated to be almost 2.53 billion, and by 2018 it is expected that over a third of the world’s population will own a smartphone. [15] With the mobile phone serving people with a means of everyday telecommunication, entertainment and leisure abilities, it is necessary to look into the history of the mobile phone and how it has developed since it was first a patented product.
The mobile phone was first patented in 1908 by Mr. N. B. Stubblefield. This patent was issued in May 12th 1908 with the title of wireless telephone, a means for electrically transmitting signals for securing telephonic communication between moving vehicles and way stations. However, it was not until 1948 that the mobile phone was invented and commercialised by the company AT&T. It introduced a service called MTS, Mobile Telephone Service, to over a hundred towns and highway paths by the end of that year. An operator was required to connect the incoming and outgoing calls and the telephones where not as portable as desired. They also required a press to speak system which only allowed the user to hear the other end of the line if they released the button. This new mobile telecommunications device was used in North America until the 1980s.
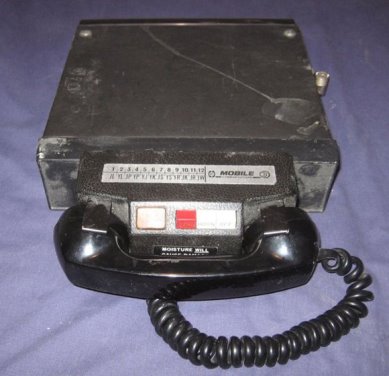
In 1965 a new version of the service by AT&T was introduced by the name of IMTS or Improved Mobile Telephone Service. The device used a dialler, and an operator was no longer required as the device used additional radio channels to increase the number of subscribers and calls over a larger area of coverage. However, this service was limited to only 40,000 subscribers across the whole of North America. To put this into perspective, 2000 customers in a city such as New York had to share 12 radio channels resulting in an average time to place a call of 30 minutes. Another device seen in Figure 4 shows a solution that was designed to compete with the MTS and IMTS systems. However, some devices used the push to talk feature mentioned earlier, whilst others required a full duplex, almost wired telephone like feature. Other customers carried around devices as big as a briefcase, but RCCs overall were designed to be used in cars so this large size was expected. [16]
This all changed in 1983 when a company called Motorola released the DynaTAC 8000x to the market. This was established as the first true mobile phone as it was small enough to carry compared to other devices seen beforehand. The Motorola was largely made popular by celebrities in the pop culture at the time. Figures such as Gordon Gekko in the movie Wall Street and Zack Morris from Saved by the Bell were seen using the devices and as the Journalist and Industrial Design instructor, Patricia Grullon, says “You always have the trendsetters who are not afraid of trying new things and then everyone else follows” and “These trendsetters are key to make any product popular”. However, another industrial design called Kreg Jones says the Motorola devices “Were primarily used in the sales and business world, but not often for personal use like you see today” as the general public did not, in general, have access to these phones at the time. [18] This was largely because of the price they sold at and, the fact that people did not hook onto this new trend until being influenced by these celebrity figures.
In 1977 a new type of technology was being built in Chicago, known as the cellular network or 1G for first generation. It used multiple cell tower sites, each connected one by one through a network which allowed users to move around and travel with their devices, as well as switch from one cell tower to another whilst still being on a call. This was a revolutionary phase in this industry which had not been seen before, and it was all built upon an existing, analogue system.
The name given to the system by AT&T was AMPS for Analog Mobile Phone System. It took the Federal Communications Commission 11 years to approve the system and for AT&T to be assigned the 824-894MHz range which was required to operate the AMPS system. Following these events, the Japanese telecommunications company, NTT, built its own version of the network in 1979, making it the first 1G network to cover an entire country five years after it was first launched. Similarly, NMT, the Nordic Mobile Telephone network developed the first network that featured international roaming in 1981, operating in Denmark, Sweden, Finland and Norway. During the 1990s, technology was advancing rapidly and so were mobile phones. Two new technologies arose: European GSM standard and the North American CDMA standard. Demand grew for mobile phones and a large number of cell towers were built. Another factor included the batteries and the internal components of the mobile phone becoming smaller, making the overall device smaller in size compared to the previous Motorola models. The 2G network allowed SMS messaging to be introduced which allowed people to send messages from one device to another. As the popularity of mobile phones increased, pre-paid plans emerged in the late 1990s.
3G came about in Japan in 2001, followed in 2003 by South Korea, the US and the UK. This network transformed the mobile industry, enabling mobile internet and transmission services like radio and TV to be used across a large area of coverage. The fourth generation of network, also known as Native IP, was the next and latest form of technology to hit the markets. Allowing it to do everything the 3G network offered but faster and smarter, and offereing a new range of internet services to downloading full length movies in high definition, all in a matter of minutes. [16] The faster mobile internet connectivity brought along smooth internet browsing and ended the previous issues of webpages crashing and failing to load during peak usage times. As a final point, the online gaming network in phones was improved extensively, allowing users to play with one another online with great connection speeds, something which was hard to achieve beforehand. The latest network version, 4G, is not yet available to everyone and users that want it will have to pay extra in some cases to upgrade to the high-speed network, meaning that many users of the modern telecommunication world are still on 3G. [19]
3.6 Applications of QFD in the mobile phone industry via a case study from Nokia
Nokia began applying QFD on its products from the 1990s after viewing how successful the technique was when it was first introduced to the US in the automotive industry in the 1980s. Nokia consequently carried out a case study on QFD to develop the product definition process in 1998. Aiming to use QFD to describe future products and collecting the views of the customer to achieve this. Nokia studied the customer and found an alternative research method, which they used in their case study, called GEMBA.
Traditional customer research focused on testing a new product that was already being developed to a certain degree, phoning and interviewing customers and asking them about certain aspects of the product, such as the overall attractiveness of the product/feature, such research was conducted as part of the new product development process. The alternative method used by Nokia, the GEMBA method, meaning the source (location) or the raw information where things actually occur, focused more on finding the customer needs. GEMBA in Japanese means ‘The Real Place’. In manufacturing the GEMBA is the most important location for any team. It is a place where time, productivity and space are crucial and not to be wasted. For manufacturers it is the factory floor. [20] For Nokia, this was a social interaction between the company representatives and the customers in an environment where the product was being used. In other words, the representatives would physically observe the customers behaviours, then interview the customers and ask for their opinions on the product. Thus, finding out in the early phases of the product development process what problems and needs the customers require. As the benefits of the GEMBA process are similar to those stated earlier in the report, in section 3.3.1, it will not be discussed in this section. The case study explores the GEMBA research for Nokia and how it was carried out and designed in Japan to take on cultural issues in order to fully maximise the effectiveness of the research. [21]
3.6.1 Planning the Project
Nokia’s primary aim when planning the project was to improve their understanding of the end users of their products. As most of the product development for the Japanese market took place in the UK, it was essential that they included members of their research and development team in the project, consequently calling them to Japan to be involved with the project. However, as both the UK and Japanese personnel did not understand the customer needs fully, it was decided that additionally, a more local team of people from Tokyo needed to be involved in the project so that a real and perceived improvement of the understanding of the customer could be achieved. The final team consisted of member from the sales, marketing and research and development teams from the UK and Tokyo. The team was guided by an external QFD expert, and even though all the members did not meet together as a whole, the individual members of each team participated at various stages of the planning process. [21]
3.6.2 Project Objectives
The team in Nokia called this phase ‘define the objectives of the product’. The team met in their Tokyo office and created a brainstorm of the objectives, by the end of which six objectives had been defined using a SMART model (Specific, Measurable, Achievable, Realistic and Time related) and are listed as follows:
- Profit
- Time to market, i.e. the time until launch
- Branding, to support the brand of Nokia as a whole
- Technology re-use
- Quality
- Market share
The SMART model was used to ensure that the objectives listed were clear and that the team could understand what was trying to be achieved, as well as making sure that each objective would be feasible and realistic. [21]
3.6.3 Prioritising the Objectives
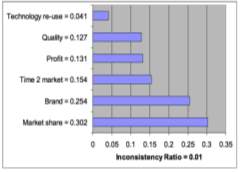
The next phase was to prioritise the objectives, as not all the objectives have the same value. Some objectives such as profit may have a greater value to the company than time to market, for example. Similarly, Nokia may want their new product to increase their brand awareness, therefore this would have a higher priority value than some of the other points. The team used a process called AHP (Analytic Hierarchy Process), whereby each objective was compared with one another. The discussion that took place during this process helped the team to not only agree what objectives should be prioritised, but to gain an understanding of why each objective was prioritised in the manner decided. Figure 5 shows the priority each objective was given. [21]
3.6.4 Selecting the Target Customer Segments
The team had to decide who their target customers would be. In Japan, there is a strong relationship between mobile phone companies and trade customers, also known as the mobile service operators. They play a big part in influencing the product specification, and operators often stipulate that certain features must be included in the phone. However, the Nokia team decided to focus its attention on the end users, the direct customers, as this is where the biggest improvements would occur. The end users would be the final customers, and even though mobile service operators would influence and brand the phone, their needs would be specific to benefit themselves. Another point was that the end users are the only people benefiting the company overall as they are putting in money to buy the phone, whereas everyone else would be taking money out from the overall profit. Hence, if the end users are happy with the products then everyone in the chain would benefit, due to more sales and ultimately more profit. [21]
3.6.5 Forming the base of the House of Quality diagram
At this stage of the study, questionnaires would have been given out to the customers in order for the company to see the areas in which people wanted to see an improvement in mobile phones, i.e. which factors satisfied their needs and which areas could be worked on. Using the data extracted from the questionnaire, the sales advantage values were determined by calculating the Improvement Ratio, Absolute Weight and Relative Weight (%), using the method below:
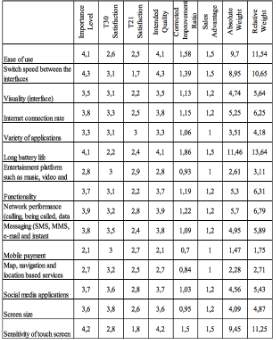
Improvement ratio =
Intended Quality LevelSatisfaction of QFD Firm
Absolute Weight = (Importance level) x (Improvement Ratio) x (Sales Advantage)
Relative Weight (%) =
Absolute weight of any rowTotal absolute weightx 100
These results can be seen in Figure 6 [23]
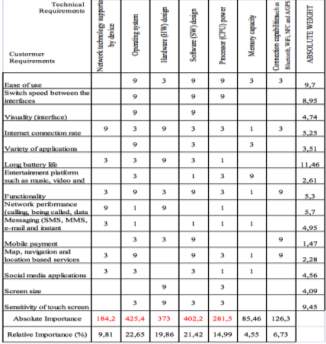
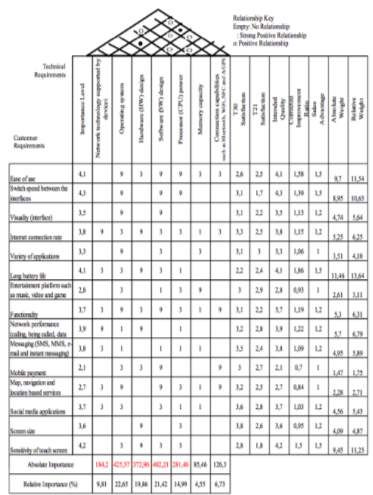
When it came to choosing the customer segments that would best support the objectives of the project that were listed, Nokia developed a segmentation model using the mobile phone users, which they had used in the earlier project planning activities. The benefits the customers expected to gain from the mobile phone were drawn into the segments, some of which included keeping in touch with family members or even enhancements to the work efficiency of the device. Using a correlation matrix, the segments were analysed by asking themselves, “if we target this segment, to what degree can we expect to achieve the objectives?” This was carried out for all the segments and for each objective. The absolute and relative importance levels were then calculated by looking at the correlation between customer demands and the technical requirements, seen below. [21]
3.6.6 Formation of the final stage of the House of Quality diagram
The roof of the matrix was formed by looking at how the technical features of the phone affect one another, as there are many strong and weak factors between the technical specifications. For example, the design of the hardware provides a strong positive correlation with the connection capabilities. If the hardware is of a high standard then there will be an improved and reliable connection between the phone and the network. Similarly, there is no correlation between the operating system and the hardware design as they do not directly affect one another. Figure 7 shows the final stage of the house of quality diagram. [23]
3.6.7 Selecting the GEMBA and conducting long term research
Once the House of Quality diagram was used and the consequent development of the mobile phone took place, a GEMBA needed to be decided and further research into the new model needed to be carried out. The Nokia team decided to select the GEMBA and conduct the research in the public areas of Tokyo, more specifically in the metropolitan area. This was done primarily as the Nokia office is located in Tokyo and they wanted to make it easy for employees from the office to interact and take part with the direct customers, increasing the company to customer feel. Another factor was that 25% of the Japanese population live in the area of Tokyo, and owing to this high population density, with almost 41% of people using a mobile phone in the area, it was easy to find mobile phone users in the public that would participate in the study. Similarly, a nationwide survey indicated that a high amount (70%) of mobile phone usage took place in either public spaces or on public transport, hence choosing the GEMBA in this area of Japan was proven to have a great number of advantages. [21]
4 Methodology
The House of Quality (HOQ) diagram will be created and used to produce an overall view of customer requirements in mobile phones, as well as an overall perspective on the mobile phone in the current market. This will be achieved using the raw data seen below in table…, this has been sourced from a report by Statista and Dossier. It shows data based on 929 respondents aged 18 or above, during a week-long survey conducted from 3rd May 2017 to 11th May 2017.
The main steps involved in creating the final diagram are listed as:
- Using the customer requirements and technical requirements to build the structure of the HOQ
- Determining how these requirements link together with one another
- Weighting the importance value of each requirement
- Comparing existing mobile phones on the market to help generate a specification and design of the proposed phone.
Each section will be broken down below to show how the final HOQ diagram was created.
4.1 Raw Data
| Important smartphone properties for purchase decision making in the UK 2017 | ||
| Ranking of the most important properties of smartphones when considering a purchase in the United Kingdom (UK) in 2017 | ||
| Share of respondents | ||
| Long battery time | 84 | in % |
| Good camera | 69 | in % |
| Good display | 64 | in % |
| High quality | 62 | in % |
| Large storage capacity | 59 | in % |
| Good design | 54 | in % |
| Fast processor | 54 | in % |
| Good sound quality | 52 | in % |
| Long service life | 51 | in % |
| The brand | 34 | in % |
[1]
4.2 Customer Requirements
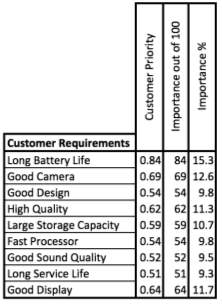
The data from the table was used to form the customer requirements matrix and the percentages were converted to decimals to produce the importance weighting on the diagram. These weighting were added together to get a total and each requirement was given a corresponding percentage importance weighting. This shows which customer requirements are most important to the customers, in this case, long battery time and good camera are some of the highest.
4.3 Technical Requirements
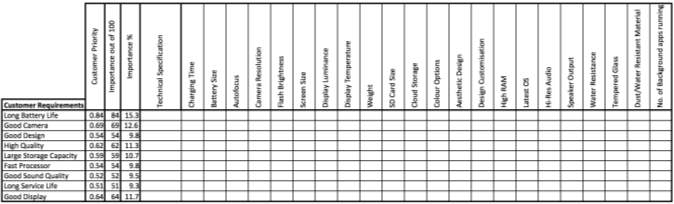
For each customer requirement, there were several technical requirements that needed to be considered to achieve the customer requirement. For example, long battery life can be achieved by looking into the charging time, battery size and number of background apps running. Technical requirements are measureable terms that represent the technical information of the mobile phone, hence they have to be more detailed than the customer requirements.
4.4 Interrelationship Requirements
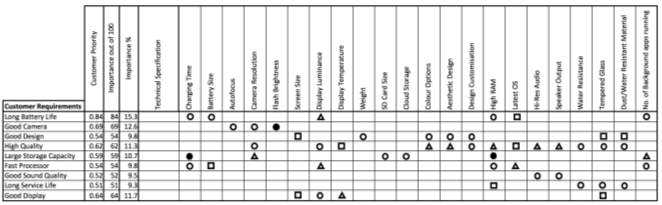
This makes up the body of the diagram, and shows how each technical requirement links to the customer requirements. Not all boxes are filled as not all factors link together, some however are strongly correlated and other weakly, this is shown below. The key displays the weight each shape has.

4.5 Technical Correlation Matrix
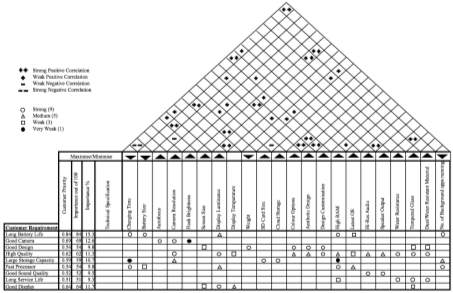
This matrix makes up the roof of the House of Quality diagram. It shows how each of the technical requirements relate to one another. This shows at a perspective, how each requirement may conflict or work with each other, if one requirement is changed then the technical correlation matrix can be used to see which other of the requirements get effected also. The key shows whether the corresponding requirements have a strong or weak relationship, as well as a positive or negative correlation. Additionally, a maximise/minimise row has been added to show whether the requirement is intended to be maximised or minimised. For example, charging time is aimed to be decreased, or minimised.
4.6 Planning Matrix
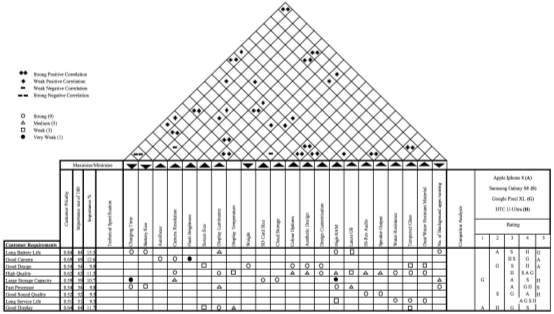
The planning matrix shows how strongly each of the customer requirements in the competitor’s mobile phones. The rating from 1 to 5, 1 being weak and 5 being strong, allows companies to see where there are areas for improvement and how different mobile phones are doing in the current market. Giving companies a perspective on where certain criteria can be improved further in the proposed design.
4.7 Technical Priorities
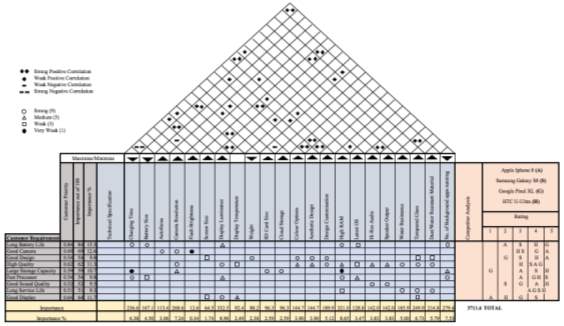
This final section in the diagram shows the importance rating of the technical requirements. It also shows the total percentage importance of each requirement. Colours have been added to show each section of the HOQ.
Cite This Work
To export a reference to this article please select a referencing stye below:
Related Services
View all


Related Content
All TagsContent relating to: "Business"
The term Business relates to commercial or industrial activities undertaken to realise a profit including producing or trading in products (goods or services). A general business studies degree could cover subjects such as accounting, finance, management and increasingly, entrepreneurship.
Related Articles

DMCA / Removal Request
If you are the original writer of this dissertation and no longer wish to have your work published on the UKDiss.com website then please: