The recovery rates of older adults in Southwark Psychological Therapies Service (SPTS)
Info: 13249 words (53 pages) Dissertation
Published: 28th Jan 2022
Tagged: PsychologyTherapy
Abstract
Introduction
The population in the UK is aging, and there are therefore a significant number of older adults (OAs) who require mental health interventions.Although there is a growing evidence-base for psychological interventions for this clinical population, older adults are still under-represented in mental health services such as IAPT.This study had two specific aims which focused on the recovery rates of older adults in SPTS, an IAPT service.
Method
A retrospective case note review was completed using the data that was routinely collected by clinicians between 2008 and 2014.Data about the number of referrals received, completed assessments, demographic information, recovery rates, and clinical outcome measures for different treatment options were included in the analyses.Data was included about OAs, as well as the service as a whole.
Results
The first aim of this study compared the recovery rates of OAs for different treatment options.The recovery rate was 49% for step 3 treatment, 57% for step 2 guided self-help and 40% for step 2 groups and workshops.In terms of the proportion of OAs completing each treatment option, 72% of OAs completed step 3 treatments, 18% completed guided self-help and 10% completed step 2 groups and workshops.The overall recovery rate was 50% (meeting national target) for OAs and 39% for the whole service.
The second aim used Wilcoxon signed-rank tests to compare pre and post scores for OAs who either started treatment below the IAPT clinical cut-off or who ended treatment above this cut off.This study found a significant difference between pre and post scores for OAs who started treatment below caseness, whereas no significant differences were found for OAs who finished treatment above caseness.
Conclusions
Older adults who complete treatment at SPTS show significant improvement in their clinical presentation.In line with the growing evidence-base OAs predominately complete step 3 treatment.Despite a lower proportion of OAs completing step 2 guided self-help, patients who completed this treatment option show good clinical outcomes.It may be useful for future research to pilot further ways of engaging OAs in step 2 treatments, including groups and workshops.
Contents
Click to expand Contents
1. Introduction
1.1 Aging population
1.2 Prevalence of depression and anxiety in older adults
1.3 Cognitive Behavioural Therapy (CBT) for older adults
1.3.1 Evidence-base for CBT for depression in older adults
1.3.2 Evidence-base for CBT for anxiety in older adults
1.3.3 Counselling and Interpersonal Psychotherapy (IPT) for older adults
1.3.4 Summary of evidence base of psychological interventions for older adults
1.4 Improving Access to Psychological Therapies (IAPT)
1.4.1 IAPT treatment options
1.4.2 IAPT calculating recovery
1.4.3 Access of older adults to IAPT
1.5 Southwark Psychological Therapies Service (SPTS)
1.5.1 Older adults in SPTS
1.5.2 Patient screening protocol at SPTS
1.5.3 Improving access for older adults in SPTS
1.5.4 Treatment options offered at SPTS
1.6 Aims and hypotheses
1.7 Service user involvement
2. Method
2.1 Design
2.2 Measures
2.2.1 Patient Health Questionnaire (PHQ-9)
2.2.2 Generalised Anxiety Disorder (GAD-7)
2.2.3 Work and Social Adjustment Scale (WASAS)
2.3 Data collection
2.4 Participants
2.5 Data Extraction
2.6 Data analysis
2.6.1 Referrals
2.6.2 Demographic information
2.6.3 Provisional diagnosis
2.6.4 Recovery rates
2.6.5 Pre and post scores
3. Results
3.1 Referrals
3.1.1 Whole service
3.1.2 Older adults
3.2 Demographic information
3.3 Provisional diagnoses
3.4 Recovery rates of the whole service and older adults
3.5 Recovery rates of older adults who completed different treatment options
3.6 Proportion of older adults who completed different treatment options
3.7 Statistical tests on pre and post scores for older adults
3.7.1 PHQ-9
3.7.2 GAD-7
3.7.3 WASAS
4. Discussion
4.1 Access rate
4.2 Opt-in rate
4.3 Recovery rate of older adults
4.4 Recovery rates of older adults and the whole service
4.5 Recovery rates of older adults who completed different treatment options
4.5.1 Step 3 treatment
4.5.2 Guided self-help
4.5.3 Groups and workshops
4.6 Proportion of older adults who completed different treatment options
4.7 Statistical tests on pre and post scores for older adults
4.8 Limitations
4.9 Leadership
4.10 Dissemination of results
4.11 Conclusions
5. References
6. Appendices
Appendix 1: Excel formula used to confirm OA labels
Appendix 2 Q-Q plots and Histograms for patient’s first and last scores on the PHQ-9, GAD-7 & WASAS…..
Appendix 3: Matrixes for PHQ-9, GAD-7 & WASAS
List of Tables
Table 1 Treatment options offered at SPTS
Table 2 Options selected for referral count reports
Table 3 Ethnicity of older adults who completed the assessment stage at SPTS
Table 4 Provisional diagnosis of older adults who completed the assessment stage at SPTS
Table 5 Options selected for caseness/recovery reports
Table 6 Example table provided by IAPTus from a caseness/recovery report
Table 7 Recovery rate information for the whole of SPTS
Table 8 Recovery rate information for older adults
Table 9 Recovery rate information for older adults who completed step 2 guided self-help
Table 10 Recovery rate information for older adults who completed step 2 groups and workshops
Table 11 Recovery rate information for older adults who completed step 3 individual therapy
Table 12 Proportion of older adults who completed different treatment options1. Introduction
1. Introduction
1.1 Aging population
Globally, the population is rapidly aging (WHO, 2013). In the UK, over the last 25 years the number of individuals aged 65 and over has increased by 1.7 million (Office for National Statistics, 2012).Although promoting and improving wellbeing is important for all ages, the increased number of older adults (OAs) has produced a specific patient group requiring both physical and mental health interventions.
1.2 Prevalence of depression and anxiety in older adults
There has been much debate about the prevalence mental health problems (MHPs) in this population (Bryant, 2010).Some have suggested that rates of depression in OAs are lower than rates reported for working aged adults (Blazer, 2010).For example, a survey carried out by the Office for National Statistics found that OAs were less likely to have MHP compared to other sections of the population.It found that 10.2% of individuals aged 65-69 and 9.4% of individuals aged 70-74 had a MHP, compared with 16.4% of the general population (Singleton et al., 2000).Similarly, according to the Adult Psychiatric Morbidity Survey (McManus et al., 2009) the prevalence of anxiety and depression is lowest in individuals aged 75 and older.This survey is particularly important to consider as the targets that IAPT services have are calculated based on its results.
On the other hand, these rates may be related to other factors. Older adults more commonly present with ‘subsyndromal’ or ‘subclinical’ depression (which is thought to be a risk factor for a full blown depressive episode) (Lyness, 2008). Also, OAs may be less comfortable in discussing emotions and therefore less likely to report mental health symptoms leading to underreported rates of MHPs (Pachana, 2008).
1.3 Cognitive Behavioural Therapy (CBT) for older adults
CBT is the recommended treatment for both anxiety and depression (NICE, 2011).It is been suggested that CBT for depression can be enhanced for OAs by using a comprehensive conceptualisation framework (CCF) (Laidlaw, Thompson & Gallager-Thompson, 2004).This framework combines the standard CBT longitudinal formulation with possible challenges faced by OAs.These additional factors include cohort beliefs: the beliefs held by shared by individuals of the same generation; transition in role investments: the transitioning between roles, for example, from professional employment to retirement; intergenerational linkages: the importance of family values passed between generations; socio-cultural context: societal beliefs about ageing, and physical health: consideration of physical health problems that are more common in OAs.
1.3.1 Evidence-base for CBT for depression in older adults
In a Cochrane review, Wilson, Mottram & Vassilas (2009) found that CBT was more effective than the control conditions.The overall conclusion was that “CBT may be of potential benefit” (P. 2).Similarly, Gould, Coulson & Howard (2012a) conducted a meta-analysis focused on CBT for depression in OAs.It included 23 randomised controlled trials (RCTs) and 1083 participants with a mean age of 68.4.The review concluded that CBT was more effective than both a wait-list control and treatment as usual (TAU).However, CBT was not found to be more effective than other treatment (such as medication or other psychotherapeutic approaches).
In another meta-analysis, pharmacotherapy and psychotherapeutic approaches yielded comparable effect sizes (Pinquart, Duberstein & Lyness, 2006).In a systematic literature review, Cuijpers et al (2009) compared the treatment outcomes of OAs in comparison to younger people.Interestingly, they found no significant difference between these two age groups.
1.3.2 Evidence-base for CBT for anxiety in older adults
Gould, Coulson & Howard (2012b) conducted a meta-analysis to review the magnitude and duration of factors associated with the effects of CBT for anxiety in OAs.12 studies were included in the review.Although it found that CBT was more effective than both a wait-list control and treatment as usual (TAU), when compared to an active control condition, there was not a statistically significant difference between groups.
1.3.3 Counselling and Interpersonal Psychotherapy (IPT) for older adults
In an evidence-based review, Scogin et al (2005) suggest that as well as CBT there are other treatment modalities that may be useful for OAs.In a more recent meta-analysis, Pinquart et al (2007) found that CBT is more effective than other treatment options including physical exercise, IPT and ‘miscellaneous’ interventions (e.g. music therapy).They suggest that more controlled studies focused on the effectiveness of IPT, psychodynamic and supportive interventions are needed before making recommendations on their use in OAs.
1.3.4 Summary of evidence base of psychological interventions for older adults
Taken as a whole, these results suggest that CBT is an effective form treatment for both depression and anxiety in OAs (both compared to TAU and other treatment approaches). It is important to note however that fewer studies have examined the effects of delivery method on therapeutic outcomes in OAs.It could be that OAs respond differently to CBT depending on whether it is delivered in a group or within individual sessions.This is particularly relevant when considering the context in which CBT is delivered in the NHS; through IAPT services.
1.4 Improving Access to Psychological Therapies (IAPT)
In 2006 Lord Layard published The Depression Report, highlighting the need for increased access to psychological therapies (Layard, 2006).The UK Government responded to this with a large-scale initiative to improve mental health outcomes (DoH, 2011a; 2011b).More specifically, IAPT services were first piloted (Clark et al., 2009; Richard & Suckling, 2009) and then rolled out nationwide.
1.4.1 IAPT treatment options
IAPTs offer interventions recommended by the National Institute for Clinical Excellence (NICE), focusing primarily on CBT.Treatment is provided within a system of stepped-care. IAPTs are therefore made up of step 2 (low-intensity) and step 3 (high-intensity) treatment options.Step 2 treatment options include guided self-help and computerised CBT, and are delivered by Psychological Wellbeing Practitioners (PWPs).The main step 3 treatment option is individual CBT.IAPT services also offer group treatment options and workshops.
1.4.2 IAPT calculating recovery
At every contact with an individual during treatment in an IAPT service, outcome measures are collected (IAPT, 2011).The outcome measures make up what is known as the Minimum Data Set (MDS).The MDS includes the Patient Health Questionnaire (PHQ-9), a measure of depression (Kroenke, Spitzer & Williams, 2001); the Generalised Anxiety Disorder (GAD-7), a measure of anxiety (Spitzer, Kroenke, Williams & Löwe, 2006), and the Work and Social Adjustment Scale (WASAS), a measure of impact on daily functioning (Mundt, Marks, Shear & Greist, 2002) .
The data collected from the MDS is used to calculate recovery rates.More specifically, in IAPT services, recovery rates are calculated in terms of ‘caseness’; in order to count as ‘recovered’ patients must score above a certain threshold pre-treatment, and then move to below this at the end of treatment.Caseness is defined as 10 and above on PHQ-9 or 8 and above on GAD-7.Patients must then be below caseness on both measures to count as ‘recovered’.The exception will be when there is an ADSM (Anxiety Disorder Specific Measure) used at two contacts, in which case the first occurrence and last occurrence of the ADSM define the first and last sessions for calculating caseness at start and finish using the PHQ-9 and ADSM. The recovery rate is then presented as a percentage representing what proportion of individuals ‘recovered’ according to these criteria.The national recovery rate target for IAPT services is 50% (Clark & Oates, 2014).
There are a number of possible limitations with this method of calculating recovery.Firstly, patients may reach the threshold for caseness, and by moving 2 points on the measures, reach recovery; one could therefore question whether this patient has actually ‘recovered’.Secondly, thinking specifically about OAs, because they may more commonly present with ‘subsyndromal’ or ‘subclinical’ depression (Lyness, 2008), they may never reach caseness and therefore their recovery rates would not be included in analysis. Finally another limitation of this approach is that an individual who scored at the severe range of depression and / or anxiety at the start of treatment can achieve a clinically significant drop in scores at the end of the therapy without them falling within the non-case range.
1.4.3 Access of older adults to IAPT
Despite the development of IAPT services, it is thought that only 1 in 6 of OAs with depression discuss it with their GP, and less than half get adequate treatment (Chew-Graham, Burns & Baldwin, 2004).Furthermore, data from IAPT first-wave sites showed that OAs only represented 4% of those accessing the services (the expected national rate given the age profile of the population and the community prevalence of depression and anxiety disorders, would be 12% (DoH, 2011c)).Thus, OAs have been underrepresented in IAPT services (Clark, 2011).
More recently, the UK Government has recognised this discrepancy between the rates of OAs with anxiety and depression, and the rates of these individuals accessing IAPTs. It has invested around 400 million between 2011-2015 to specifically focus on expanding provisionfor underrepresented patient groups, of which OAs is one of them (HM Government, 2011; DoH, 2011b).Also, an Older People Positive Practice Guide was published (IAPT, 2009).With this in mind, it is essential for IAPT services to monitor the care offered to OAs.This study focused on the treatment options and recovery rates of OAs at Southwark Psychological Therapies Service (SPTS), an IAPT service.
1.5 Southwark Psychological Therapies Service (SPTS)
SPTS became an IAPT service in 2008.It provides psychological interventions to individuals experiencing anxiety and/or depression.Individuals must be a minimum of 18 years old, live in Southwark and / or register with a Southwark GP.More specifically, SPTS is divided into four localities: North East, North West, South East and South West.
1.5.1 Older adults in SPTS
Prior to 2008, OAs in Southwark had access to the Southwark Older Adults Primary Care Psychology Service (SOAPCPS) (Wong & Boddington, 2011).This was funded by the Guys & St Thomas’s Charitable Foundation between November 2004 and February 2008 (and then by the corresponding NHS Trust for another 8 months).The service was a uni-disciplinary psychology service that was tailored specifically to the needs of OAs.
In 2008, the SOAPCPS was merged with SPTS (Wong & Boddington, 2011).Estimations suggest that 24,259 OAs live in the catchment area of SPTS (GLA, Round Population Projections, 2007).Over the first 2 year period (from November 2008 to June 2010) SPTS reported that 4.4% of its referrals were adults aged 65 years old and above (Wong, 2010).The SPTS Annual Report (April 2010 – March 2011) suggests that adults aged 60 years old are under-represented in SPTS referrals: “those 65 and older are estimated to form 10.92% of the adult population in Southwark, but they only formed 3.60% of referrals to SPTS in 2010 – 2011.” (Wingrove et al., 2011, P. 55).The Equality of Access (EoA) represents the percentage of OAs seen in a service divided by the percentage of adults aged 65 and above in the local adult population.In SPTS the EoA has been calculated to be 33% (Boddington, 2011).
On the other hand, the SPTS Annual Report also highlights that this method of estimating EoA does not take account of the relative prevalence of common MHPs in different age groups.Using the data from the proportion of older people among the adult population in Southwark (10.92%) and the Adult Psychiatric Morbidity Survey (prevalence rate for common mental health disorders for OAs = 4.46%), the estimate for Southwark access rate would be 7.5% (see SPTS Annual Report for further information about calculations).
1.5.2 Patient screening protocol at SPTS
Since 2008, the patient screening and assessment protocol has changed a number of times according to resources and service demands.Of note, these protocols have always included the use of an opt-in pack that individuals send into SPTS at the beginning of treatment.
In order to improve access for OAs, SPTS developed a different screening protocol specifically for this age group.The major difference in this screening process is that OAs are not required to complete an opt-in pack.Upon receiving a referral, the individual is screened by the OA lead.The OA lead offers the individual either a telephone or face-to-face assessment.The individual is also able to choose where this face-to-face assessment takes place; at an out-patient clinic, in a GP surgery or during a home visit.In another words, SPTS has been proactive in making sure that the barrier to access service for OAs are kept to a minimum. The MDS is collected during the initial assessment, and treatment options are discussed.
1.5.3 Improving access for older adults in SPTS
As well as providing a specific protocol for OAs entering SPTS, this IAPT service have put in place a number of other measures to increase access.These include:
- Offering home visits when appropriate;
- Adjusting treatment sessions in terms of pace, length, frequency and total number;
- Assisting OAs in the completion of MDS if needed;
- Training to step 2 and step 3 staff.
1.5.4 Treatment options offered at SPTS
The treatment options offered at SPTS are listed in Table 1.
Table 1 Treatment options offered at SPTS
| Step | Individual | Groups | Workshops |
| Step 2 | Guided self-help |
Relaxation |
|
| Step 3 | Individual therapy sessions | – | – |
1.6 Aims and hypotheses
This study had two specific aims.The first aim focused on OAs and the different treatment options offered within SPTS.Specifically, it compared the recovery rates of OAs who received different treatment options.In this study, because of the way the data was extracted and analysed, comparisons were made between step 3 treatment, step 2 guided self-help and step 2 groups and workshops.The proportion of OAs who took part in each treatment option was also calculated. Finally, as part of aim 1, the overall recovery rate for OAs was calculated and compared to the recovery rate of the whole service.
For aim 1, it was predicted that:
- Recovery rates for OAs would be higher for step 3 treatment in comparison to step 2 treatment options;
- A larger proportion of OAs would have taken part in step 3 treatment.
- Overall OAs would benefit from treatment as well as younger adults; thus recovery rates would be similar.
The second aim looked at a different method of calculating the MDS scores for OAs who have completed treatment in SPTS.It used statistical tests to calculate whether there is a significant difference between pre and post PHQ-9, GAD-7 and WASAS scores for OAs. For this aim, no specific hypotheses were made.
1.7 Service user involvement
When conducting research, service user involvement is crucial (Wallcraft et al., 2009).In relation to this study, the aims and hypotheses were presented and discussed at the SPTS Service User Forum.
2. Method
2.1 Design
This study was a retrospective case note review.
2.2 Measures
IAPTs use the Minimum Data Set (MDS) to calculate recovery rates.This consists of a number of outcome measures.The three specific outcome measures used in this study are detailed below.
2.2.1 Patient Health Questionnaire (PHQ-9)
The PHQ-9 is a measure of depression (Kroenke, Spitzer & Williams, 2001).The PHQ-9 has 9 items describing symptoms of depression, for example, “feeling down, depressed, or hopeless”.Patients rate their agreement on a 4-point likert scale ranging from “Not at all” to “Nearly every day”.A score is given out of 27, with higher scores representing a more severe depression.More specifically, the PHQ-9 provides a depression index score:
- 0-4 – None
- 5-9 – Mild
- 10-14 – Moderate
- 15-19 – Moderately Severe
- 20-27 – Severe
In IAPT, caseness is defined as having a score on the PHQ-9 of 10 and above.
2.2.2 Generalised Anxiety Disorder (GAD-7)
The GAD-7 is a measure of anxiety (Spitzer, Kroenke, Williams & Löwe, 2006).It has 7 items detailing symptoms of anxiety, for example “feeling nervous, anxious or on edge”.Patients rate their agreement on a 4-point likert scale ranging from “Not at all” to “Nearly every day”.A score is given out of 21, with higher scores representing a more severe anxiety.The GAD-7 also provides an anxiety index score:
- 0-4 – None
- 5-10 – Mild Anxiety
- 11-15 – Moderate Anxiety
- 15-21 – Severe Anxiety
In IAPT, caseness is defined as having a score on the GAD-7 of 8 and above.
2.2.3 Work and Social Adjustment Scale (WASAS)
The WASAS measures the impact of a patient’s mental health problem on different areas of their lives (Mundt, Marks, Shear & Greist, 2002).There are 5 items, each focused on a different area of functioning: work, home management, social leisure activities, private leisure activities, and family and relationships.Patients rate their agreement on a 8-point likert scale ranging from “Not at all” to “Very severely”.A score is given out of 40, with higher scores representing a more impaired levels of functioning.
2.3 Data collection
This study used data that had been collected between 01/11/2008 and 28/02/2014.The data had been collected from patients as part of routine practice and stored on IAPTus, an online, password protected database that is used to store and analyse patient information.
2.4 Participants
IAPT defines older adults (OAs) as those aged 65 and older. Thus, before any analysis was completed, every patient file was checked to confirm that all OAs had an OA referrallabel. In order to do this, the patient database was extracted from IAPTus into Excel, and then an Excel formula was used to confirm that all patients aged 65 and older had an OA referral label (see Appendix 1 for details).
2.5 Data Extraction
Once all OAs had been confirmed to have an OA referral label, information about these patients were extracted from IAPTus for the data analyses.IAPTus automatically only extracts patients who have finished treatment at SPTS.It is important to note however that IAPTus defines ‘finished treatment’ as patients who had a minimum of two MDS scores taken at two different time points.Thus, the patients extracted could have either completed a treatment option, dropped out of a treatment option,or completed two assessment appointments where two separate MDSs were recorded, but did not go on to have actual treatment.
2.6 Data analysis
In order to analyse the data, both IAPTus Hypercube and SPSS were used.IAPTus Hypercube was initially used to run a number of reports.Data about referrals, demographic information, provisional diagnosis, recovery rates, proportion of OAs who completed different treatment options, and pre and post scores were included in the analyses.
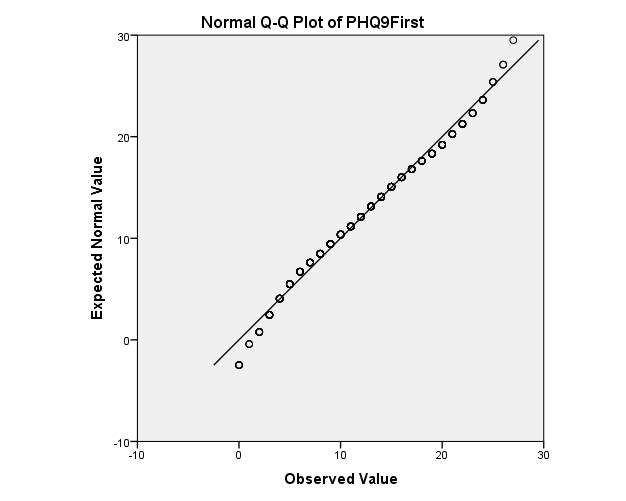
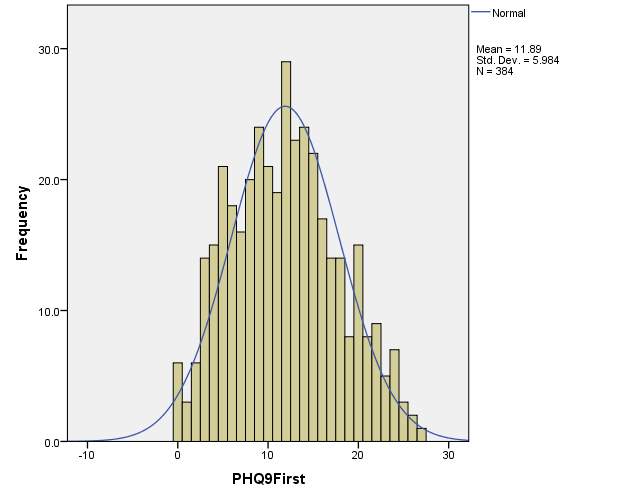
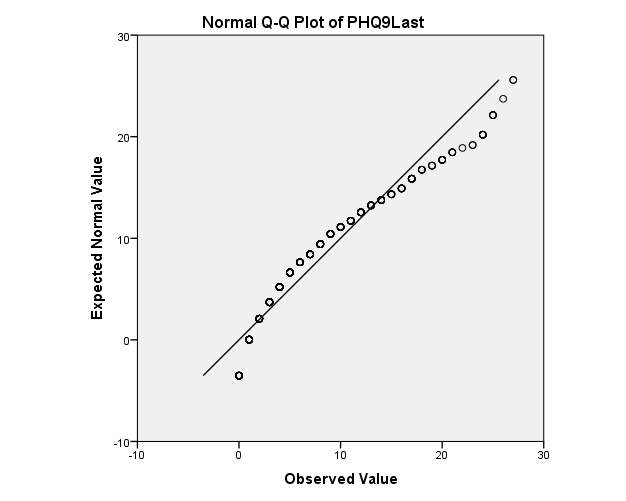
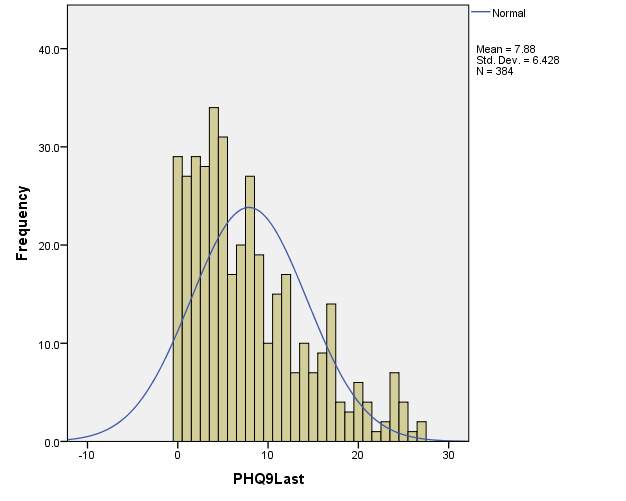
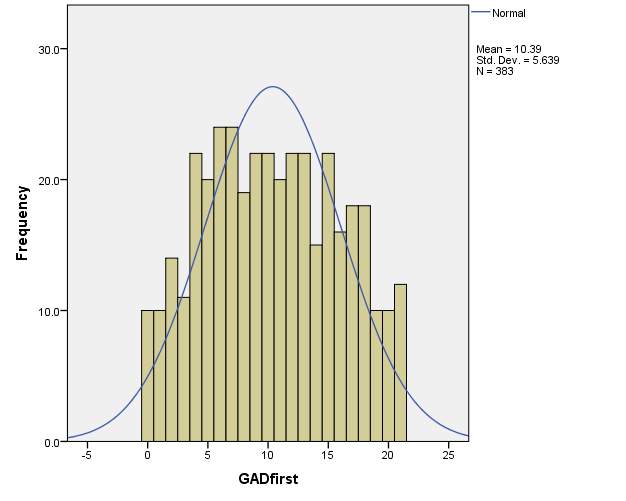
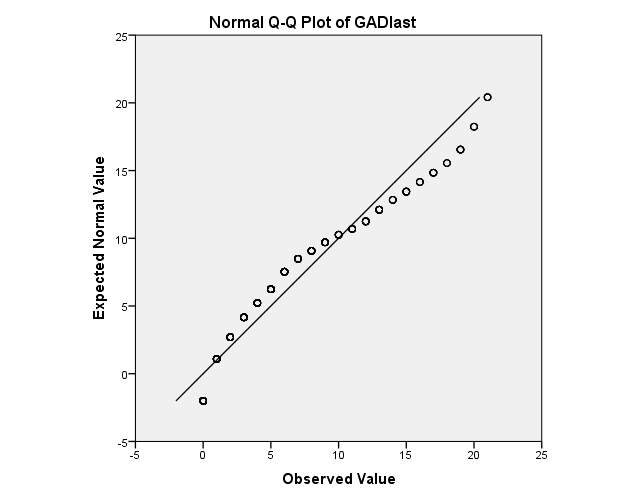
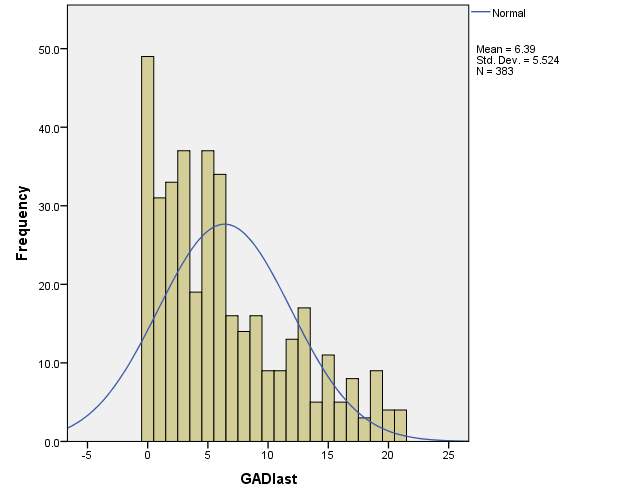
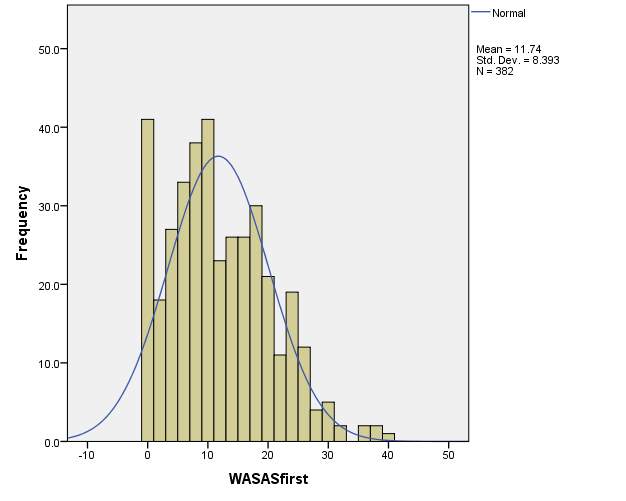
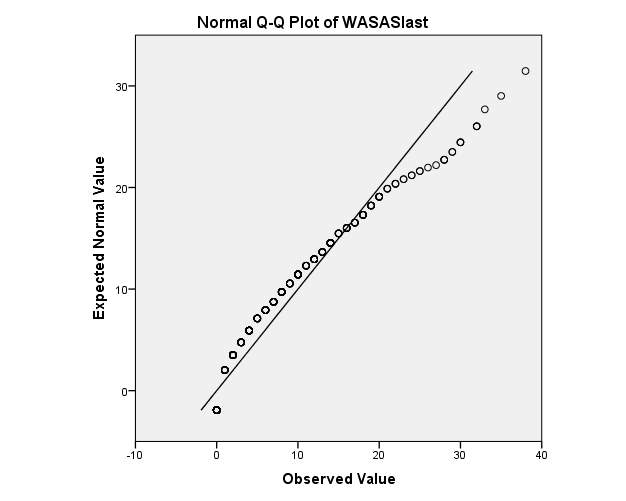
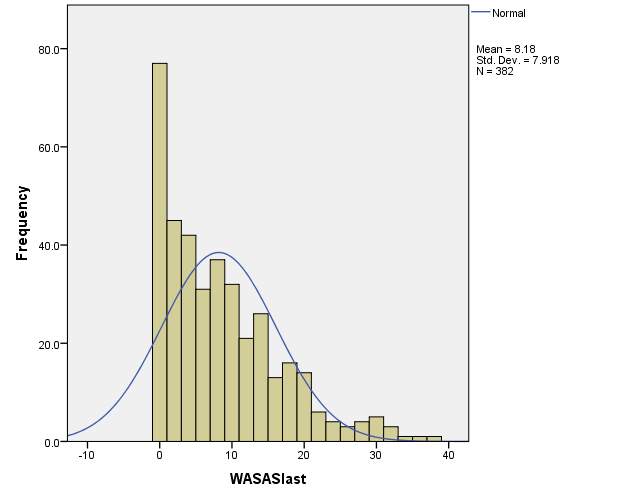
SPSS was then used to analyse the pre and post scores on the PHQ-9, GAD-7 and WASAS.Normality was tested for the PHQ-9, GAD-7 and WASAS separately by inspecting the data distribution using a Q-Q plot and histogram (see Appendix 2).Visual inspection suggested that the data sets were not normally distributed.Because of this, the non-parametric Wilcoxon signed-rank test was used.
2.6.1 Referrals
This study reports the number of referrals received and the number of referrals accepted in SPTS for the whole service, as well as specifically for OAs.It also reports the number of referrals who entered and completed the assessment stage at SPTS. This information was then used to calculate the opt-in rates for the whole service and both the opt-in and access ratesfor OAs.
2.6.2 Demographic information
This study reports the demographic information (age range, gender and ethnicity) of OAs who completed the assessment stage at SPTS.
2.6.3 Provisional diagnosis
This study reports the provisional diagnoses of OAs who completed the assessment stage at SPTS.
2.6.4 Recovery rates
This study reports the overall recovery rate for the whole service and specifically for OAs.It then reports separate OA recovery rates for each treatment option.The following treatment options were selected: step 2 guided self-help; step 2 groups and workshops, or step 3 individual therapy.It is important to note that if patients received more than 1 treatment option in one episode (for example, stepped up from step 2 to step 3, stepped down from step 3 to step 2, or given a different treatment option within the same step), IAPTus automatically includes their MDS scores in the recovery rate analysis for both options.
2.6.5 Pre and post scores
IAPTus defines pre-scores as the first MDS collected.IAPTus defines post-scores in two ways; either the clinician selects the ‘End of Treatment’ tab on the patient’s clinical contact, or if this has not been selected, the last MDS score is used. As mentioned, the exception will be when there is an ADSM (Anxiety Disorder Specific Measure) used at two contacts, in which case the first occurrence and last occurrence of the ADSM define the first and last sessions for calculating caseness at start and finish using the PHQ-9 and ADSM.
3. Results
3.1 Referrals
Firstly, ‘referral count’ reports were run using IAPTus Hypercube to calculate the number of referrals received and the number of referrals accepted for the whole service and specifically for older adults (OAs).For these reports, the options that were selected are listed in Table 2.For the reports focused on OAs, an ‘older adult’ referral label was also selected.
In order to calculate the number of referrals who entered and completed the assessment stage at SPTS a ‘referral count’ report was run (selecting the same options as in Table 2), and the option ‘assessment attended’ was added as a filter.
Table 2 Options selected for referral count reports
| From Date: | 01/11/2008 |
| To Date: | 28/02/2014 |
| Treatment Type: | IAPT |
3.1.1 Whole service
It was found that SPTS received 27433 referrals.Of these, 25479 individuals were accepted into the service.It was found that 16292 patients completed the assessment stage.
To work out the opt-in rate of patients in SPTS the number of patients who entered and completed the assessment stage was divided by the number of patients accepted into the service.Thus, the opt-in rate was calculated to be 64% ((16292/25479)*100).
3.1.2 Older adults
It was found that SPTS received 853 OA referrals.Of these, 776 OAs were accepted into the service.It was found that 582 OAs completed the assessment stage.
To work out the opt-in rate of OAs in SPTS the number of OAs who entered and completed the assessment stage was divided by the number of OAs accepted into the service.Thus, the opt-in rate was calculated to be 75% ((585/776)*100).
To work out the access rate for OAs the number of OAs who completed the assessment stage was divided by the number of completed assessments by the whole service.Thus, the access rate was calculated to be 3.58%.
3.2 Demographic information
The demographic information of OAs who completed the assessment stage was then calculated.This was done by running separate ‘referral count’ reports selecting the same information as in Table 2 and selecting the ‘group by’ function (i.e. group by age range, gender and ethnicity).
The age range was 63– 100.403 were female and 179 were male.The percentage breakdown of ethnicity is displayed in Table 3 (missing data was excluded).
Table 3 Ethnicity of older adults who completed the assessment stage at SPTS
| Ethnicity | Percentage of patients |
| White | 85.8 |
| Mixed race | 1.0 |
| Asian/British Asian | 3.1 |
| Black | 6.6 |
| Other | 2.7 |
| Unwilling to disclose | 0.8 |
Regarding the age range, it was identified that there was 1 patient aged 36 years old who had an ‘older adult’ label wrongly attached to it. Although there is no way of identifying which patient this is using IAPTus, because the demographic information relates to those who completed the assessment stage, it may be that the patient did not enter treatment and therefore may not affect the recovery rate analysis.There were also a handful of 63 and 64 years old patients wrongly labelled as OAs.
3.3 Provisional diagnoses
The breakdown of provisional diagnoses for OAs who completed the assessment stage are displayed in Table 4 (missing data was excluded).As described above, a ‘referral count’ report was run selecting the same information as in Table 2 and then selecting the ‘group by’ function (i.e. group by provisional diagnosis).
Table 4 Provisional diagnosis of older adults who completed the assessment stage at SPTS
| Provisional diagnosis | Percentage of patients |
| Mental and behavioural disorders due to use of alcohol | 0.4 |
| Depressive episode | 29.7 |
| Recurrent depressive disorder | 15.8 |
| Agoraphobia (with or without history of panic disorder | 2.9 |
| Specific (isolated) phobias | 4.8 |
| Generalised anxiety disorder | 9.9 |
| Mixed anxiety and depressive disorder | 17.6 |
| Obsessive-compulsive disorder | 1.5 |
| Post-traumatic stress disorder | 2.2 |
| Somatoform disorders | 0.7 |
| Mental disorder, not otherwise specified | 4.0 |
| Disappearance and death of family member | 3.3 |
| Panic disorder (episodic paroxysmal anxiety) | 2.9 |
| Adjustment disorders | 2.9 |
| Hypochondriacal disorder | 0.7 |
| Reaction to severe stress or adjustment disorders | 0.7 |
3.4 Recovery rates of the whole service and older adults
A ‘caseness/recovery’ report was run to calculate the overall recovery rate for the whole service, as well as specifically for OAs.For these reports, the options that were selected are listed in Table 5.
Table 5 Options selected for caseness/recovery reports
| From Date: | 01/11/2008 |
| To Date: | 28/02/2014 |
| First Stage Entered: | Referral |
| Treatment Type: | IAPT |
As described previously, in IAPT services, recovery rates are calculated in terms of ‘caseness’. It is therefore important to emphasise that in order to be included in the recovery rate analyses patients must have started treatment above caseness on both the PHQ-9 and GAD-7 and come down below caseness on both of these outcome measures (with the exception of ADSM as outlined before).The recovery rate is then presented as a percentage representing what proportion of individuals ‘recovered’ according to this criteria.
After a ‘caseness/recovery’ report is run, IAPTus presents the information in a table (see Table 6for description of each cell).Using Table 6,recovery rates were calculated by dividing the number of patients who ‘recovered’ (those who met caseness at the beginning of treatment and were below caseness at the end of treatment) by the total number of patients who met caseness.This number was then multiplied by 100 to turn it into a percentage.
Table 6 Example table provided by IAPTus from a caseness/recovery report
| Last measure to caseness | Last measure to recovery | Total | |
| First measure from caseness | Number of patients who met caseness at the beginning and end of treatment | Number of patients who met caseness at the beginning of treatment and were below caseness at the end of treatment (i.e. ‘recovered’) | Total number of patients who met caseness at the beginning of treatment |
| First measure from recovery | Number of patients who were below caseness at the beginning of treatment and met caseness at the end of treatment | Number of patients who were below caseness at the beginning and end of treatment | Total number of patients who were below caseness at the beginning of treatment |
| Total | Total number of patients who met caseness at the end of treatment | Total number of patients who were below caseness at the end of treatment | Total number of patients who completed treatment |
Table 7 shows the recovery rate information for the whole of SPTS.Using this table, the recovery rate was calculated to be 39% ((3652/9319)*100).
Table 7 Recovery rate information for the whole of SPTS
| Last measure to caseness | Last measure to recovery | Total | |
| First measure from caseness | 5667 | 3652 | 9319 |
| First measure from recovery | 350 | 1633 | 1983 |
| Total | 6017 | 5285 | 11302 |
As the second report focused on the recovery rate of OAs, the referral label of ‘OA’ was selected before another ‘caseness/recovery’ report was run.Table 8 shows the recovery rate information for OAs in SPTS.Using this table, the recovery rate was calculated to be 50% ((150/298)*100).
Table 8 Recovery rate information for older adults
| Last measure to caseness | Last measure to recovery | Total | |
| First measure from caseness | 148 | 150 | 298 |
| First measure from recovery | 6 | 79 | 85 |
| Total | 154 | 229 | 383 |
3.5 Recovery rates of older adults who completed different treatment options
The specific first aim of this study was to compare recovery rates for OAs who completed different treatment options.In order to calculate separate recovery rates, a number of ‘caseness/recovery’ reports, selecting a ‘treatment type’ filter, and then specifically selecting one of the 3 treatment options.
Table 9 shows the recovery rate information for OAs who completed step 2 guided self-help.Using this table, the recovery rate was calculated to be 57% ((28/49)*100).
Table 9 Recovery rate information for older adults who completed step 2 guided self-help
| Last measure to caseness | Last measure to recovery | Total | |
| First measure from caseness | 21 | 28 | 49 |
| First measure from recovery | 3 | 24 | 27 |
| Total | 24 | 52 | 76 |
Table 10 shows the recovery rate information for OAs who completed step 2 groups and workshops.Using this table, the recovery rate was calculated to be 40% ((10/25)*100).
Table 10 Recovery rate information for older adults who completed step 2 groups and workshops
| Last measure to caseness | Last measure to recovery | Total | |
| First measure from caseness | 15 | 10 | 25 |
| First measure from recovery | 1 | 16 | 17 |
| Total | 16 | 26 | 42 |
Table 11 shows the recovery rate information for OAs who completed step 3 individual therapy.Using this table, the recovery rate was calculated to be 49% ((117/238)*100).
Table 11 Recovery rate information for older adults who completed step 3 individual therapy
| Last measure to caseness | Last measure to recovery | Total | |
| First measure from caseness | 121 | 117 | 238 |
| First measure from recovery | 4 | 55 | 59 |
| Total | 125 | 172 | 297 |
3.6 Proportion of older adults who completed different treatment options
In order to work out the proportion of OAs who completed different treatment options the total number of patients included in each recovery rate analysis for each treatment option were compared, and turned into a percentage (See Table 12).
Table 12 Proportion of older adults who completed different treatment options
| Treatment option | Total number of patients | Proportion of OAs |
| Step 2 guided self-help | 76 | 18% |
| Step 2 groups and workshops | 42 | 10% |
| Step 3 individual therapy | 297 | 72% |
| Total | 415 | 100% |
3.7 Statistical tests on pre and post scores for older adults
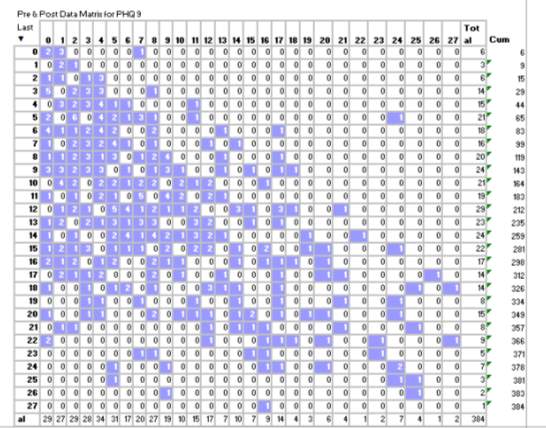
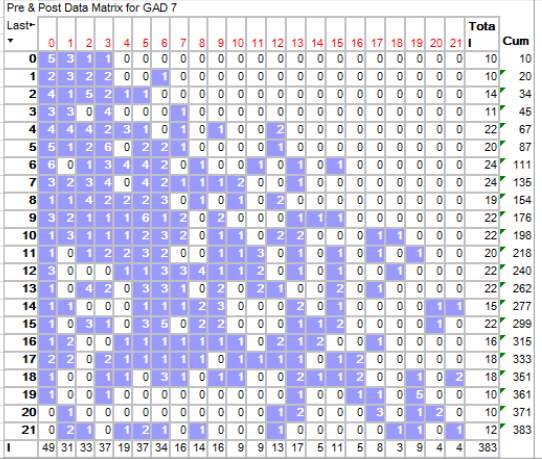
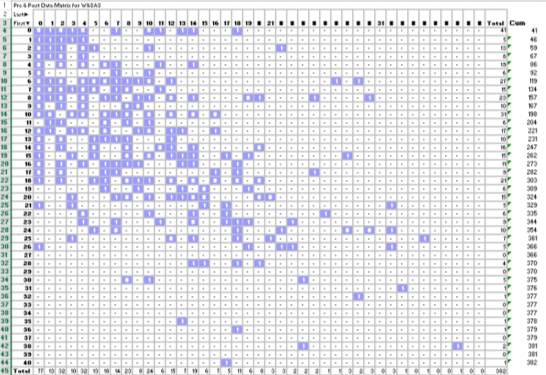
Aim 2 focused on comparing the traditional method of calculating recovery rates in IAPT with using t-tests to calculate whether there is a significant difference between pre and post scores on the PHQ-9, GAD-7 and WASAS.In order to extract the relevant patient data from IAPTus, Hypercube was used.A ‘Pre and Post Matrix’ was selected, and either ‘PHQ-9’, ‘GAD-7’ or ‘WASAS’ were selected in the data field.IAPTus therefore produced separate matrixes for each outcome measure.The matrixes show the number of patients who had different combinations of first and last scores (see Appendix 3for the original matrixes).Excel was then used to manipulate the data structure from the Matrixes into columns of pre and post data for individual patients.
As normality tests suggested that the data sets were not normally distributed (see Appendix 2), the non-parametric Wilcoxon signed-rank test was used.
3.7.1 PHQ-9
Firstly, a Wilcoxon signed-rank test were performed to compare pre and post scores on the PHQ-9.The Wilcoxon signed-rank test showed that there was a significant difference in the pre and post scores on the PHQ-9 [z = -11.30, N = 384, p
For the PHQ-9, patients were then selected who began treatment below caseness (a score of 9 and below).A Wilcoxon signed-rank test showed that there was a significant difference in the pre and post scores for these patients [z = -4.10, N = 143, p
Patients were then selected who finished treatment above caseness on the PHQ-9 (a score of 10 and above).A Wilcoxon signed-rank test showed that there was not a significant difference in the pre and post scores for these patients [z = -0.19, N = 123, p = ns].Scores did not significantly decrease at the end of treatment (M = 15.74, SD = 4.63), in comparison to the beginning of treatment (M = 15.74, SD = 5.16).Thus, OAs who finished treatment above caseness did not show significant decreases in low mood.
3.7.2 GAD-7
Secondly, a Wilcoxon signed-rank test were performed to compare pre and post scores on the GAD-7.The Wilcoxon signed-rank test showed that there was a significant difference in the pre and post scores on the GAD-7 [z = -12.00, N = 383, p
For the GAD-7, patients were then selected who began treatment below caseness (a score of 7 and below).A Wilcoxon signed-rank test showed that there was a significant difference in the pre and post scores for these patients [z = -4.09, N = 135, p
Patients were then selected who finished treatment above caseness on the GAD-7 (a score of 8 and above).A Wilcoxon signed-rank test showed that there was not a significant difference in the pre and post scores for these patients [z = -1.81, N = 127, p = 0.07].Scores did not significantly decrease at the end of treatment (M = 13.09, SD = 3.79), in comparison to the beginning of treatment (M = 13.84, SD = 4.43).Thus, OAs who finished treatment above caseness did not show significant decreases in levels of anxiety.
3.7.3 WASAS
Finally, a Wilcoxon signed-rank test was used to compare pre and post scores on the WASAS.The Wilcoxon signed-rank test showed that there was a significant difference in the pre and post scores on the WASAS [z = -9.14, N = 382, p
4. Discussion
The first aim of this study focused on comparing the recovery rates of older adults (OAs) who had completed different treatment options.As part of this aim the proportion of OAs who completed each treatment option was also calculated, as well as comparing the overall OA recovery rate to that of the whole service.
The second aim focused on comparing two methods for calculating OA recovery rates; the traditional IAPT method based on caseness, and using statistical tests to look for significant differences between pre and post scores on the IAPT outcome measures.
Before the specific aims of this study are discussed, the access rate and opt-in rate for OAs will be commented on.
4.1 Access rate
This study calculated the access rate for OAs was 3.58%, which is below the OA target access rate of 7.5%.This result highlights that this national target (but locally adapted) for OAs is not currently being met by SPTS.It suggests that it may be important for SPTS to consider ways of increasing the access rate for OAs.For example, it may be helpful to assess the feasibility of increasing the advertising of SPTS in places that are likely to be frequented by OAs such as in GP surgeries, libraries or day centres.Also, it may be useful to consider sessions for GPs and clinicians in secondary care to describe referral criteria and processes for OAs into SPTS.These initiatives may lead to increases in the number of referrals into SPTS thus potentially increasing the access rate.
4.2 Opt-in rate
This study calculated the opt-in rate for OAs was 75% in comparison to an opt-in rate of 64% for the whole service.This suggests that once an OA is accepted into SPTS, they are likely to complete the initial assessment stage. This result may be linked to the screening and assessment protocol that SPTS uses for OA. For example, reducing the barrier to access SPTS by offering home visit and not requiring OAs to complete the opt-in pack may increase the likelihood of an OA completing the assessment stage.
4.3 Recovery rate of older adults
The overall recovery rate for OAs in SPTS of 50% meets the national recovery rate target for IAPT services (Clark & Oates, 2014).Furthermore, the Wilcoxon signed-rank test which compared pre and post scores on the IAPT outcome measures confirmed a significant improvement at the end of completed treatment.This suggests that when these patients complete treatment, they are likely to have good therapeutic outcomes regardless of the treatment option they receive.Clinicians at SPTS are therefore meeting the needs of OAs who access the service, and that OAs find the psychological interventions offered at SPTS useful.
4.4 Recovery rates of older adults and the whole service
This study predicted that OAs would benefit from treatment as well as younger adults, meaning that the recovery rates would be similar.However, against this prediction, this study found the overall recovery rate was 39% for the whole service and 50% for OAs.
There are a number of potential factors that could be related to the differences in recovery rates for the two groups.Firstly, in relation to the Older People Positive Practice Guide (IAPT, 2009), it could be that clinicians think more consciously about the possible appropriate adaptations when treatment OAs.These might include a slower pace during sessions, or a greater number of longer sessions.This individualised approach to treatment might then lead to good outcomes with this age group. One angle for future research to explore this idea further could be using qualitative methods to interview clinicians at SPTS to look for any differences in the treatment approach taken when working with an OA in comparison to a younger patient.
Another aspect to consider is the typical treatment option that an OA would be offered at SPTS.It could be that OAs entering the service are more likely to be offered a step 3 intervention, whereas a young adult with comparable symptom severity would be offered a step 2 treatment option first, leading to overall potentially better outcomes for the OAs. This idea is discussed in more detail further on.
4.5 Recovery rates of older adults who completed different treatment options
This study predicted that recovery rates for OAs would be higher for step 3 treatments in comparison to step 2 treatment options.This prediction was partially upheld.Specifically, recovery rates were 49% for step 3 treatment, 57% for step 2 guided self-help and 40% for step 2 groups and workshops.Thus, the step 3 recovery rate was higher than step 2 groups but lower than step 2 guided self-help (as highlighted in the limitations section no statistical tests were performed on these figures).
4.5.1 Step 3 treatment
The recovery rate for step 3 treatment does indicate that CBT (and other step 3 interventions such as IPT) are potentially beneficial for OAs.One limitation with calculating an overall recovery rate for step 3 treatment is that it does not distinguish between different treatment options.It is known that the majority of OAs who complete step 3 are provided with a CBT intervention, since the majority of clinicians are trained in this psychological modality.However, it may be useful in the future for the service to have more detailed information in regards to the effectiveness of, for example, CBT compared with IPT.
This study found a lower recovery rate for step 3 treatment in comparison to guided self-help.It is possible that this difference is related to the patient characteristics of those who take part in each treatment option.Step 3 interventions are aimed at patients with moderate or severe anxiety and/or depression, and who are likely to have been suffering with related symptoms for a longer period of time.Because of this, it may be more difficult to see change in the symptoms that are measured by IAPT outcome measures such as the PHQ-9 and the GAD-7.Patients may also be less motivated to change (McCullough, 2003), or be more likely to drop out early (Persons, Burns & Perloff, 1988).It is also possible that patients may require a greater number of sessions to produce the symptomatic change that is required to be included in the recovery analysis.
Conversely, patients who were offered guided self-help would be more likely to have mild/moderate anxiety and/or depression, meaning that their symptoms would be less severe and enduring, possibly leading to a larger rate of recovery.
4.5.2 Guided self-help
The recovery rate of guided self-help suggests that when OAs complete this treatment option at SPTS, over 50% recover. Guided self-help typically involves patients working through a “standardised psychological treatment protocol” based on the principles of CBT (Cuijpers & Schuurmans, 2007, P. 284) with the support of a Psychological Wellbeing Practitioner (PWP).
Research focused on working-aged adults has produced favourable outcomes.In a large meta-analysis, Hirai & Clum (2006) found that several self-help formats were moderately effective for participants with certain anxiety disorders.Spek et al (2007) specifically focused on internet-based CBT for OAs (defined as aged 50 and above).They found that there was a larger effect size for the internet-based intervention in comparison to a waitlist control group.Interestingly there is a stronger evidence-base for guided self-help in comparison to pure self-help (Gellatly et al., 2007), suggesting that the therapeutic alliance between patient and therapist is important.This may be particularly important for OAs; they may respond particularly well to one-to-one contact with a clinician.
Another aspect to consider in regards to guided self-help that may be particularly relevant for the OA population is the flexibility in appointment structure that it allows for.Older adults are more likely to suffer with a long term physical health problem (Department of Health, 2012). Thus, guided self-help may increase access to certain patients who wouldn’t normally access the service due to physical disability (Nutting et al., 2002).
4.5.3 Groups and workshops
This study calculated the OA recovery rate for step 2 groups and workshops was 40%.This contrast in recovery rates for guided self-help and groups and workshops may be related to the different methods of delivery of these two step 2 intervention types.
Older adults may benefit from one-to-one interactions with a clinician.For example, when explaining Behavioural Activation for depression, a PWP would explain this strategy using examples specifically relating to a patient.In contrast, within groups and workshops it is likely that more generic examples would be used. Furthermore, the content of groups and workshops may not include aging related worries such as retirement or loss of social network.
One final point to bear in mind is the difference in structure of these treatment options.Step 2 groups and workshops at SPTS tend to run over 6-8 90 minutes sessions and day-long session respectively.Whereas guided self-help involves up to 8 sessions (telephone or face to face) which last around between 30 minutes.It may be that OAs benefit more from this style of delivery.
In light of these results, it could be useful to think about how to make groups more engaging for OAs.For example, in the future SPTS could think about the feasibility of developing a group specifically for this population, and possibly offering it at a day centre.
4.6 Proportion of older adults who completed different treatment options
In line with predictions made that a larger proportion of OAs would have taken part in step 3 treatment.This study found that 72% of OAs completed step 3 treatments, 18% completed guided self-help and 10% completed step 2 groups.Decisions about treatment are usually made collaboratively between clinician and patient, and there are a number of potential reasons why the majority of OAs are offered step 3 treatments.
It could be that when thinking about appropriate treatment options clinicians use the current evidence-base to guide their decisions. At present, very few research trials have focused specifically on the use of step 2 treatment options for OAs.Thus, clinicians may be more inclined to offer step 3 treatments.
It is also important to note the possible influence of stereotypes from both the clinician and patient perspective.Clinicians may have a stereotype of an OA who for example may not be as familiar with technology such as the internet (needed for computerised CBT), or preferring the structure of a ‘traditional’ face-to-face therapy, and therefore are less likely to offer a step 2 treatment option.Similarly, an OA may have an understanding of therapy based on the assumption of individual and face to face sessions, and therefore they may be less likely to engage with other therapy formats.It could be helpful for SPTS to think about how to advertise step 2 treatment options for OAs by for example developing specific materials that introduce them to each treatment option available.
4.7 Statistical tests on pre and post scores for older adults
Aim 2 focused on comparing the traditional method of calculating recovery rates in IAPT with using statistical tests to calculate whether there is a significant difference between pre and post scores on the PHQ-9, GAD-7 and WASAS.For this aim, no specific hypotheses were made.
Firstly, this study selected patients who began treatment below caseness on either the PHQ-9 or the GAD-7.This study found significant differences on both the PHQ-9 & GAD-7 in these patients. Caseness is defined as 10 and above on PHQ-9 (Kroenke, Spitzer & Williams, 2001) and 8 and above on GAD-7 (Spitzer, Kroenke, Williams & Löwe, 2006). Those who begin treatment below caseness could therefore still be in the mild ranges on both outcome measures.The significant difference between pre and post scores may be related to the fact that mild depression and anxiety are more responsive to treatment, resulting in a bigger different in these two sets of scores.
Secondly, this study also selected patients who completed treatment above caseness on either the PHQ-9 or the GAD-7.This study found no significant differences between the pre and post scores on either the PHQ-9 or the GAD-7 in this sub-set of patients.The explanation for this could be the converse reason for the significant different in pre and post scores for patients who start treatment below caseness; patients may be experiencing moderate to severe depression and anxiety which may be less responsive to treatment, leading to less movement on the quantitative outcome measures.It could be that the maximum number of sessions offered to patients at step 3 may not be adequate to shift more entrenched negative or thoughts anxious or beliefs about themselves.
4.8 Limitations
The major limitation of this study is related to drawing firm conclusions about why there were differences found between recovery rates between OAs and the whole service.These conclusions are limited due to differences in sample sizes, as well as the fact that the two groups of patients (the whole service compared to OAs) were not matched on personal characteristics such as ethnicity, provisional diagnosis or symptom severity. A similar limitation applies to making interpretations about the differences in recovery rates for different treatment options.Older adults were assigned to different treatment options based on their presenting needs, and the groups were not matched as they would be in a controlled research trial.Furthermore, because of the way that IAPTus extracts data, this study was unable to calculate whether the difference between the recovery rates for different treatment options was statistically significant.
Another limitation is related to the way that IAPTus records patient information.For example, on IAPTus a patient’s final scores on the MDS are used in the recovery rates analyses.This does not therefore distinguish between patients who have completed treatment, and those who have dropped out.This could be particularly relevant for the analysis in this study that focused on patients who completed treatment above caseness; this sub-set of patients may be more likely to drop out which may account for the lack of significant difference between pre and post scores.
4.9 Leadership
There were leadership opportunities at the beginning stage of this project.On commencing the placement at SPTS I sought out a project on OAs because of my interest in this clinical population.I discussed project ideas with both my placement supervisor and then the OAs lead for the service.Furthermore, I researched opportunities with the trust to discuss research ideas with service users.
In terms of potential leadership opportunities going forward SPTS could think about further potential ways to engage OAs in step 2 treatment options.For example, staff members could design leaflets giving information about each treatment option.SPTS also could assess the acceptability and feasibility of designing a treatment group or workshop specifically for OAs.
4.10 Dissemination of results
The findings of the study were disseminated in a number of ways:
- The findings were summarised and communicated to the Lead of the service;
- The report summary was included in the monthly service information e-bulletin;
- A copy of the final report was saved onto the service shared drive within ‘older adults resources’;
- Summaries of results will be included in future SPTS whole service reports.
4.11 Conclusions
Overall, the treatment offered to OAs at SPTS does produce significant improvements in patients.This study found differences between the recovery rates of OAs for different treatment options.Although fewer number of OAs complete step 2 guided self-help, the OA recovery rate was highest for this treatment option.This suggests that OAs respond well to using a one-to-one structured treatment programme with the support of a psychological wellbeing practitioner.Future investigations at SPTS may be useful to pilot ways of improving the uptake of this treatment option in OAs, as well as improving the engagement of OAs in other step 2 groups and workshops.When using statistical tests to calculate recovery, this study found a significant difference in pre and post scores for OAs who were below caseness at the beginning of treatment, but no significant differences in OAs who were above caseness at the end of treatment.
5. References
BLAZER, D. G. 2010. Protection from late life depression. International Psychogeriatrics, 22, 171-173.
BODDINGTON, S. 2011. Where are all the older people? Equality of access to IAPT services. PSIGE Newletter, No 113, Feb 2011: 11-14. British Psychological Society.
BRYANT, C. 2010. Anxiety and depression in old age: challenges in recognition and diagnosis. International Psychogeriatrics, 22, 511-513.
CHEW-GRAHAM, C., BALDWIN, R. & BURNS, A. 2004. Treating depression in later life: we need to implement the evidence that exists. BMJ: British Medical Journal, 329, 181.
CLARK, D. 2011. Implementing NICE Guidelines for the psychological treatment of depression and anxiety disorders: The IAPT experience. International Review of Psychiatry, 23, 375-384.
CLARK, D. M. & OATES, M. 2014. Improving access to psychological therapies – measuring improvement and recovery adult services. Version 2. Retrieved October 2014 from http://www.iapt.nhs.uk/silo/files/measuring-recovery-2014.pdf
CLARK, D.M., LAYARD, R., SMITHIES, R., RICHARDS, D.A., SUCKLING, R. & WRIGHT, B. (2009) Improving access to psychological therapy: Initial evaluation of two UK demonstration sites. Behaviour Research and Therapy , 47 , 910 – 920.
CUIJPERS, P. & SCHUURMANS, J. 2007. Self-help interventions for anxiety disorders: An overview. Current Psychiatry Reports, 9, 284-290.
CUIJPERS, P., VAN STRATEN, A., SMIT, F. & ANDERSSON, G. 2009. Is psychotherapy for depression equally effective in younger and OAs? A meta-regression analysis. International psychogeriatrics, 21, 16-24.
DEPARTMENT OF HEALTH 2011a. No Health Without Mental Health. Available at: https://www.gov.uk/government/publications/the-mental-health-strategy-for-england.
DEPARTMENT OF HEALTH 2011b. Talking Therapies: A Four Year Plan of Action. Available at: https://www.gov.uk/government/publications/talking-therapies-a-4-year-plan-of-action.
DEPARTMENT OF HEALTH 2011c. Impact Assessment of the expansion of talking therapies services as set out in the Mental Health Strategy. (p. 33) Available at: http://www.iapt.nhs.uk/silo/files/impact-assessment-of-the-expansion-of-talking-therapies.pdf
DEPARTMENT OF HEALTH 2012. Long Term Conditions Compendium of Information: Third Edition. Available at:https://www.gov.uk/government/publications/long-term-conditions-compendium-of-information-third-edition
GELLATLY, J., BOWER, P., HENNESSY, S., RICHARDS, D., GILBODY, S. & LOVELL, K. 2007. What makes self-help interventions effective in the management of depressive symptoms? Meta-analysis and meta-regression. Psychological Medicine, 37, 1217-1228.
GOULD, R. L., COULSON, M. C., & HOWARD, R. J. 2012a. Cognitive Behavioral Therapy for Depression in Older People: A Meta‐Analysis and Meta‐Regression of Randomized Controlled Trials. Journal of the American Geriatrics Society, 60(10), 1817-1830.
GOULD, R. L., COULSON, M. C., & HOWARD, R. J. 2012b. Efficacy of cognitive behavioral therapy for anxiety disorders in older people: A meta‐analysis and meta‐regression of randomized controlled trials. Journal of the American Geriatrics Society, 60(2), 218-229.
HIRAI, M. & CLUM, G. A. 2006. A Meta-Analytic Study of Self-Help Interventions for Anxiety Problems. Behavior Therapy, 37, 99-111.
HM GOVERNMENT 2011. No Health without Mental Health: A Cross-Government Mental Health Outcomes Strategy for People of All Ages. Available at: https://www.gov.uk/government/uploads/system/uploads/attachment_data/file/213761/dh_124058.pdf.
IMPROVING ACCESS TO PSYCHOLOGICAL THERAPIES 2009. Older People Positive Practice Guide. National IAPT programme. Available at: http://www.iapt.nhs.uk/silo/files/older-people-positive-practice-guide.pdf.
IMPROVING ACCESS TO PSYCHOLOGICAL THERAPIES 2011. The IAPT Data Handbook: Guidance on recording and monitoring outcomes to support local evidence-based practice. National IAPT programme. Available from: http://www.iapt.nhs.uk/services/measuring-outcomes.
KROENKE, K., SPITZER, R. & WILLIAMS, J. 2001. The PHQ-9: Validity of a brief depression severity measure. Journal of General Internal Medicine, 16, 606-613.
LAIDLAW, K., THOMPSON, L. W., & GALLAGHER-THOMPSON, D. 2004. Comprehensive conceptualization of cognitive behaviour therapy for late life depression. Behavioural and Cognitive Psychotherapy, 32(04), 389-399.
LAYARD, R. 2006. The depression report: A new deal for depression and anxiety disorders (No. 15). Centre for Economic Performance, LSE.
LYNESS, J. M. 2008. Naturalistic outcomes of minor and subsyndromal depression in older primary care patients. International Journal of Geriatric Psychiatry, 23, 773-781.
MCCULLOUGH JR, J. P. 2003. Treatment for chronic depression: Cognitive behavioral analysis system of psychotherapy (CBASP) (Vol. 13, No. 3-4, p. 241). Educational Publishing Foundation.
MCMANUS, S., MELTZER, H., BRUGHA, T., BEBBINGTON, P. & JENKINS, R. (EDS.). 2009. Adult Psychiatric Morbidity in England, 2007: Results of a household survey. The NHS Information Centre for Health & Social Care. Retrieved August 2011 from http://www.ic.nhs.uk/webfiles/publications/mental%20health/other%20mental%20health%
MUNDT, J. C., MARKS, I. M., SHEAR, M. K., & GREIST, J. M. 2002. The Work and Social Adjustment Scale: a simple measure of impairment in functioning. The British Journal of Psychiatry, 180(5), 461-464.
NICE 2011. Common mental disorders: Identification and pathways to care. NICE Clinical Guideline 123. London: National Institute for Health and Clinical Excellence.
NUTTING PA, R. K., DICKINSON M, WERNER JJ, DICKINSON P, SMITH JL, GALLOVIC. 2002. Barriers to initiating depression treatment in primary care practice. Journal of General International Medicine, 17, 103-111.
OFFICE FOR NATIONAL STATISTICS 2012. Population Ageing in the United Kingdom, its Constituent Countries and the European Union. Available at: http://www.ons.gov.uk/ons/rel/mortality-ageing/focus-on-older-people/population-ageing-in-the-united-kingdom-and-europe/rpt-age-uk-eu.html .
PACHANA, N. 2008. Ageing and Psychological Disorders. In E. Rigger (ed.), Abnormal Psychology. Sydney: McGraw Hill
PINQUART, M., DUBERSTEIN, P. & LYNESS, J. 2006. Treatments for later-life depressive conditions: a meta-analytic comparison of pharmacotherapy and psychotherapy. American Journal of Psychiatry, 163, 1493-1501.
PINQUART, M., DUBERSTEIN, P. R., & LYNESS, J. M. 2007. Effects of psychotherapy and other behavioral interventions on clinically depressed OAs: a meta-analysis. Aging & mental health, 11(6), 645-657.
PERSONS, J. B., BURNS, D. D., & PERLOFF, J. M. 1988. Predictors of dropout and outcome in cognitive therapy for depression in a private practice setting. Cognitive Therapy and Research, 12(6), 557-575.
RICHARDS, D.A. & SUCKLING, R. 2009. Improving access to psychological therapies: Phase IV, prospective cohort study. British Journal of Clinical Psychology , 48 , 377 – 396.
SCOGIN, F., WELSH, D., HANSON, A., STUMP, J., & COATES, A. 2005. Evidence‐based psychotherapies for depression in OAs. Clinical Psychology: Science and Practice, 12(3), 222-237.
SINGLETON, N., BUMPSTEAD, R., O’BRIEN, M., LEE, A., MELTZER, H. 2001. Psychiatric Morbidity Among Adults Living In Private Households. London: The Stationery Office.
SPITZER, R., KROENKE, K., WILLIAMS, J. & LÖWE, B. 2006. A brief measure for assessing generalised anxiety disorder: the GAD-7. Archives of Internal Medicine, 166, 1092-1097.
WALLCRAFT, J., SCHRANK, B., & AMERING, M. 2009. Handbook of service user involvement in mental health research (Vol. 6). John Wiley & Sons.
WILSON, K., MOTTRAM, P. & VASSILAS, C. 2008. Psychotherapeutic treatments for older depressed people. Cochrane Database of Systematic Reviews, 1(1).CD004853. doi: 10.1002/14651858.CD004853.pub2
WINGROVE, J., ANTHONY, L. & MERRITT, C. 2011. Southwark Psychological Therapies Service – Providing an Improving Access to Psychologial Therapies (IAPT) service for Southwark. Annual Report April 2010 – March 2011.
WONG. G. 2010. Graduating from a Primary Care Psychology Service to an IAPT Service – the Southwark experience. Manchester: BABCP Conference, 21 July.
WONG. G. & BODDINGTON, S. 2010. Graduating from a Primary Care Psychology Service to an IAPT Service – the Southwark experience. Manchester: BABCP Conference, 21 July.
WORLD HEALTH ORGANISATION 2013. Mental Health and Older Adults Fact Sheet No. 381. Available at: http://www.who.int/mediacentre/factsheets/fs381/en/.
6. Appendices contents page
Appendix 1: Excel formula used to confirm OA labels
Appendix 2: Q-Q plots and Histograms for patient’s first and last scores on the PHQ-9, GAD-7 & WASAS
Appendix 3: Matrixes for PHQ-9, GAD-7 & WASAS
Appendix 1: Excel formula used to confirm OA labels
- Export the patient database from IAPTUS to Excel.
- Create column header named: Age at Admission and in the cell below insert this formula:
- =DATEDIF(Date of Birth Cell,Date Referral Received Cell,”y”)
- Create column header named Older Adult and in the cell below insert the formula:
- =IF(Age of Admssion Cell>=65,”Older Adult”,FALSE)
- Export the “OA” labelled patients from IAPTUS to the same Excel sheet.
- Create column header named Label and in the cell below insert the formula:
- =IF(COUNTIF(column where the labelled patients’ ID is, cell where the first patient’s ID is in the big database),IF(Older Adult Cell=”Older Adult”,”Labelled”,”Check Multi-Ref”),IF(Older Adult Cell=”Older Adult”,”Label Needed”))
Appendix 2 Q-Q plots and Histograms for patient’s first and last scores on the PHQ-9, GAD-7 & WASAS
Q-Q Plots for scores on the PHQ-9 at the beginning of treatment
Histogram for scores on the PHQ-9 at the beginning of treatment
Q-Q plot for scores on the PHQ-9 at the end of treatment
Histogram for scores on the PHQ-9 at the end of treatment
Q-Q plot for scores on the GAD-7 at the beginning of treatment
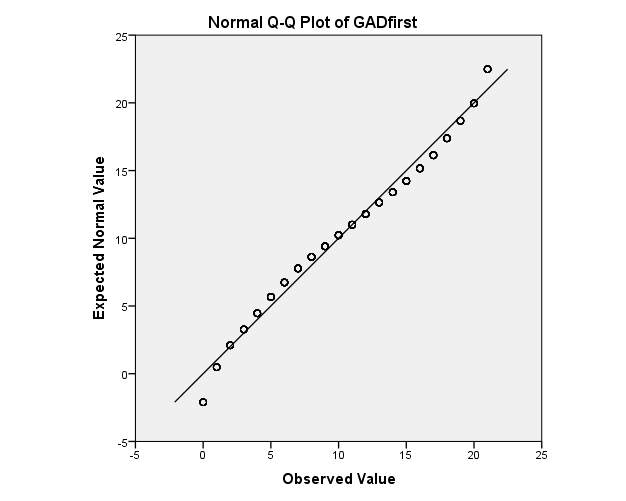
Histogram for scores on the GAD-7 at the beginning of treatment
Q-Q plot for scores on the GAD-7 at the end of treatment
Histogram for scores on the GAD-7 at the end of treatment
Q-Q Plot for scores on the WASAS at the beginning of treatment
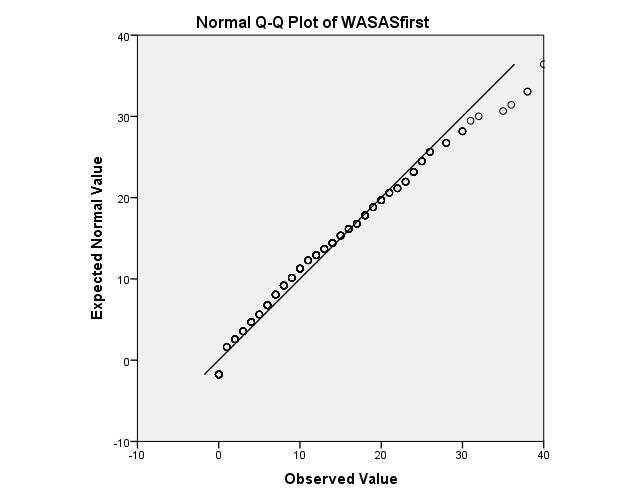
Histogram for scores on the WASAS at the beginning of treatment
Q-Q Plot for scores on the WASAS at the end of treatment
Histogram for scores on the WASAS at the end of treatment
Appendix 3: Matrixes for PHQ-9, GAD-7 & WASAS
Matrix for PHQ-9
Matrix for GAD-7
Matrix for WASAS
Cite This Work
To export a reference to this article please select a referencing stye below:
Related Services
View allRelated Content
All TagsContent relating to: "Therapy"
Therapy is often thought of in relation to talk therapy, or psychotherapy, but therapy is simply a treatment not involving drugs or surgery that attempts to remedy a health problem, whether physical or mental.
Related Articles
DMCA / Removal Request
If you are the original writer of this dissertation and no longer wish to have your work published on the UKDiss.com website then please:


