Playground Surface Material Effectiveness in Reducing Impact Force
Info: 10273 words (41 pages) Dissertation
Published: 3rd Sep 2021
Tagged: EngineeringMechanics
Table of Contents
Momentum, impulse and energy conversion
4. Material list and Apparatus
7. Difficulties Encountered and Errors
8. Discussion, Evaluation and Recommendation
Coarse sand: 16 to 20cm drops:
1. Introduction
Recently, the material using on surface have become a compulsory requirement for children playground. In 2003, more than 208,100 of age 14 children were treated in hospital emergency rooms for playground related injuries. Children ages 5 to 14 accounted for nearly 75% t of these injuries. (FACTS ABOUT INJURIES TO CHILDREN ON PLAYGROUNDS, n.d.). Research shows that wood chip, foams, peanuts shell and sands force absorbing materials helps to buff the cushion the fall and reduce the peak impact force. If the right material is used that occur on a playground will not be quite painful. There are many playground surfacing material options to choose from and to ensure the playground surface that meets the site’s safety needs. (How to select Playground Surfacing, n.d.). There are huge amount of products on the market, it is hard to identity which material has the greatest effect.
In this experiment, three different types of material were tested for their effectiveness in reducing the impact force of a collision. By testing those types of popular playground surface products and their ability to control the impact force. The peak impact force will be tested at a range of height and depths of different material with different layers.
Hypotheses
- By increasing the depth of different materials, the peak impact force exerted on the materials by an impacting object will decrease. The greater the depth of material, the more effectively it will absorb force.
- The larger particles of the material will absorb more force.
Aim
This experiment is aiming to test which material is the best for playground surface. Also test which one is more effective at absorbing force and whether various factors. The results can help lead towards a safer surface for future children when they playing on the playground. It will deceased the accident occurs.
2. Background
There are thouands of materials used as playground surfce, which are designed to contrl the impact force and create a safe area for children to play. Playground is one the most important things in the communities. Normally, chrildren playground have a loose fill material, such as sand and wood chips. These material must be able to decreased the impact force when heavy thing drop. Loose materials are normally more cost validl than other possible easily to move. All nature base material is crucial for preventign injury on impact when chrilden faill on the playground surface. However, it might be dangerous if the material is sharp or contamination can be hidden under the surface, as well as depth and quality needed. Eventually, the safety of playgorund very depends on how great of the impact force can the material absord. Then decide which surface is the most effective playground surface.
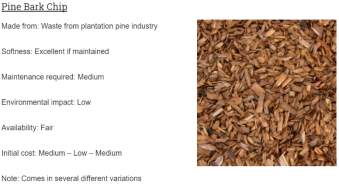
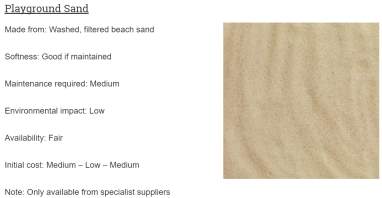
Two pictures above showed many details of two tested materials. (What is the best soft-fall surface?, n.d.)
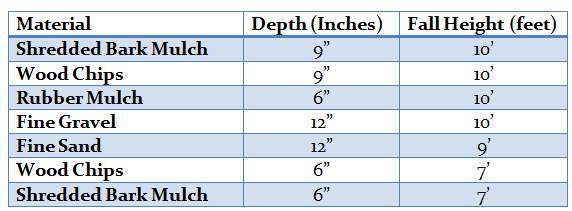
This graph shows safety height for playground. How thick of the tiles needed for each height. (How to Set Up Your Swing Set Safety Zone to Keep Your Kids Safe, n.d.)
Rebounding
Rebounding is when the collision involves a rebounding effect. It depend on vector speed in that it has a direction associated with it. In a collision, If an object is moving in one direction before a collision and rebounds or somehow changes direction, then its velocity after the collision has the opposite direction as before. (Momentum and Impulse Connection, n.d.)
Impulse Collision
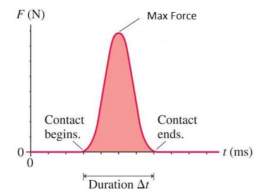
Impact effect: shock absorption capacity of sand as a base material. The graph below shows the collision happened, Force VS. Time, which called impulse graph. This type of impulse graph is called Hard Collision. The area under the curve represents the value of impulse. It is very marrow due to it happened over a short time. According to the formula:
Area= 12 d ∙h
If the impulse is the same and duration need to be longer. Then the max force will deceased. (Collisions – Impulse and Momentum, n.d.) When attempting to see whether a certain material can absorb force better than others can. This means the material is more effective in absorption of force.
Momentum, impulse and energy conversion
P in the formula is the measurement of momentum. Mass (m) in kilometre and velocity (v) metres/second. The implication of the object with greater mass impact the surface of body with greater force. The peak impact force is a physics concept. It will be hard to stop an object with momentum. If is necessary to use a force against its motion for stopping the object. However, the more momentum it has the harder to stop. An amount of time acting on an object will change an object’s momentum. If the force acts opposite the objects motion, then it will make the object slow down. Theorem states that the change in momentum of n object is equal to impulse exerted on it. If an object interacts with another, collide, momentum will always be conserved. (Mechanics: Momentum and Collisions, n.d.) (Momentum and Impulse Connection, n.d.)
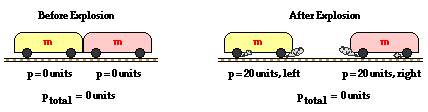
p=m∙v
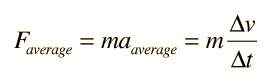
Newton’s second Law
Newton’s second law of motion is the behaviour of objects for which not all existing forces are balanced. The acceleration of an object is dependent upon two variables – the net force and the mass of the object. The acceleration of an object depends directly upon the net force acting upon the object, and inversely upon the mass of the object. The acceleration of an object depends directly upon the net force acting upon the object, and inversely upon the mass of the object.
When force increased, then acceleration of the object is increased. In addition, when as the mass increased, the acceleration of the object will decreased. (Newton’s Second Law, n.d.) This therefore means that an object subject to an external force, such as gravity, will accelerate proportional to the amount of force to which it is subjected.
Fnet= m • a a=Fnetm
- The acceleration is directly proportional to the net force, the net force equals mass times acceleration.
- The acceleration in the same direction as the net force; an acceleration is produced by a net force.
Kinetic energy
Kinetic energy an object get energy from motion and is directly proportional to the mass of the object ad to the square of its velocity. Kinetic energy can be transferred between objects and transformed into other energy. (What is kinetic energy?, n.d.)
m=mass
;
v=velocity
KE= 12 m ∙ v2
Potential energy
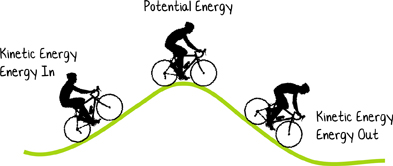
Potential energy depends on energy store of its position. It is the stored energy of position possessed by an object. In addition, the energy is stored due to the gravitational attraction to the earth on the object.
m=mass
;
g=9.8N/kg ;h=height
PE= m ∙ g∙h
CITATION Win l 3081 (Wind – Energy of Motion, n.d.)
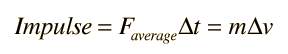
Impulse of Force
For collisions, the change of mass and velocity are easy to measure, but the force during the collision is not. The average force of impact is calculated, if the time of collision is measured. It is the overall effect of a force acing over time. J represent the impulse as well .
(Impulse of Force, n.d.)
J=F ∙∆t
Acceleration is the name of velocity changes. Since velocity is about speed and direction, there are only two ways for changing to accelerate.
v=final veloity
;
u=inital velocity ;a=acceleration ;s=displacement
v2=u2+2as
3. Safety
This experiment, which only involves the handling and dropping of a 4kg shotput, has low risk. In particular dropping the heavy item, must ensure everything is under safety control. In case of an emergency, safety measures must include wearing hard black school shoes. If safety boots are provided they would be better. Also, when testing is progressing hand and fingers must be kept out of the box when the shotput it is ready to drop. If fingers or toes get hurt, is essential to apply an ice pack as soon as possible.
During the experiment the tester, need to be very careful with using the equipment. If the first drop is over 5000N, then would need to increase the material height to do the next trials. The shotput need to be putted on the floor, which it should not be tripped over, or roll off a raised surface ad onto people’s feet. For data collecting, the PASCO USB cable need to be store back into the plastic bag.
More information reference back to the Risk Assessment
4. Material list and Apparatus
| Apparatus | Amount Requite | Visual Ad |
| Shotput (4kg) | 1 | 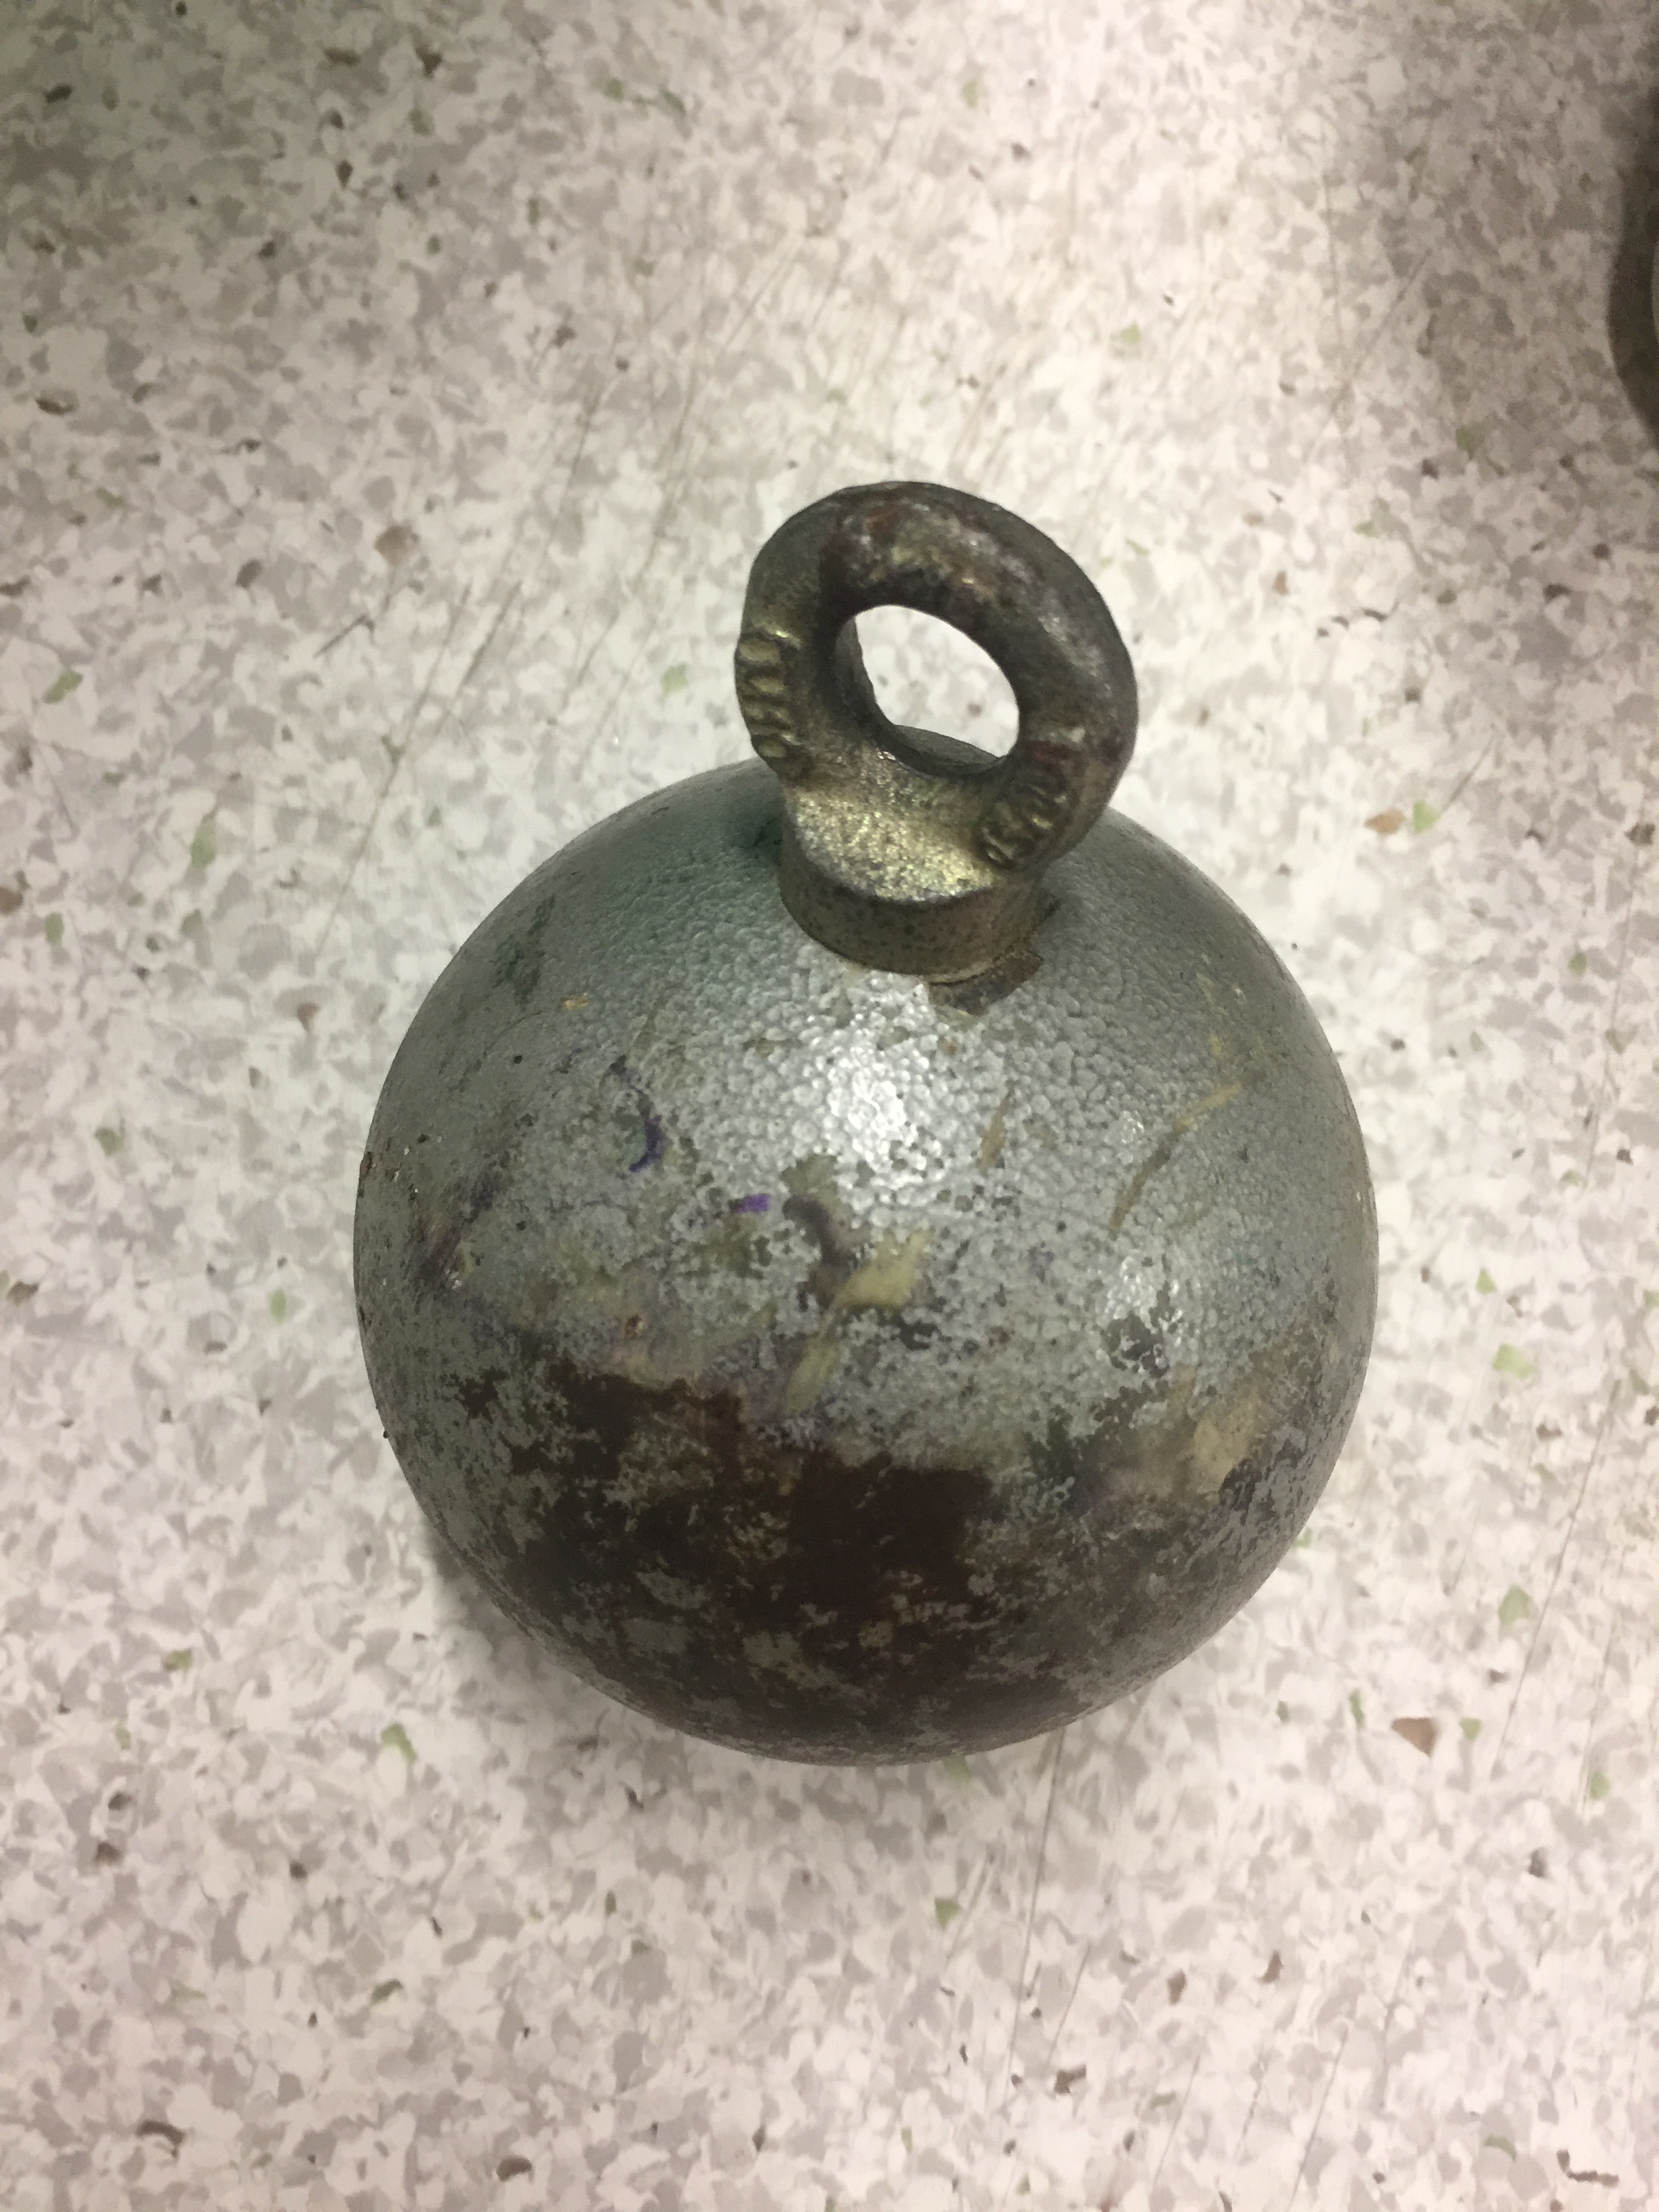 |
| Green soft foams
(The largest Particle) |
5 | 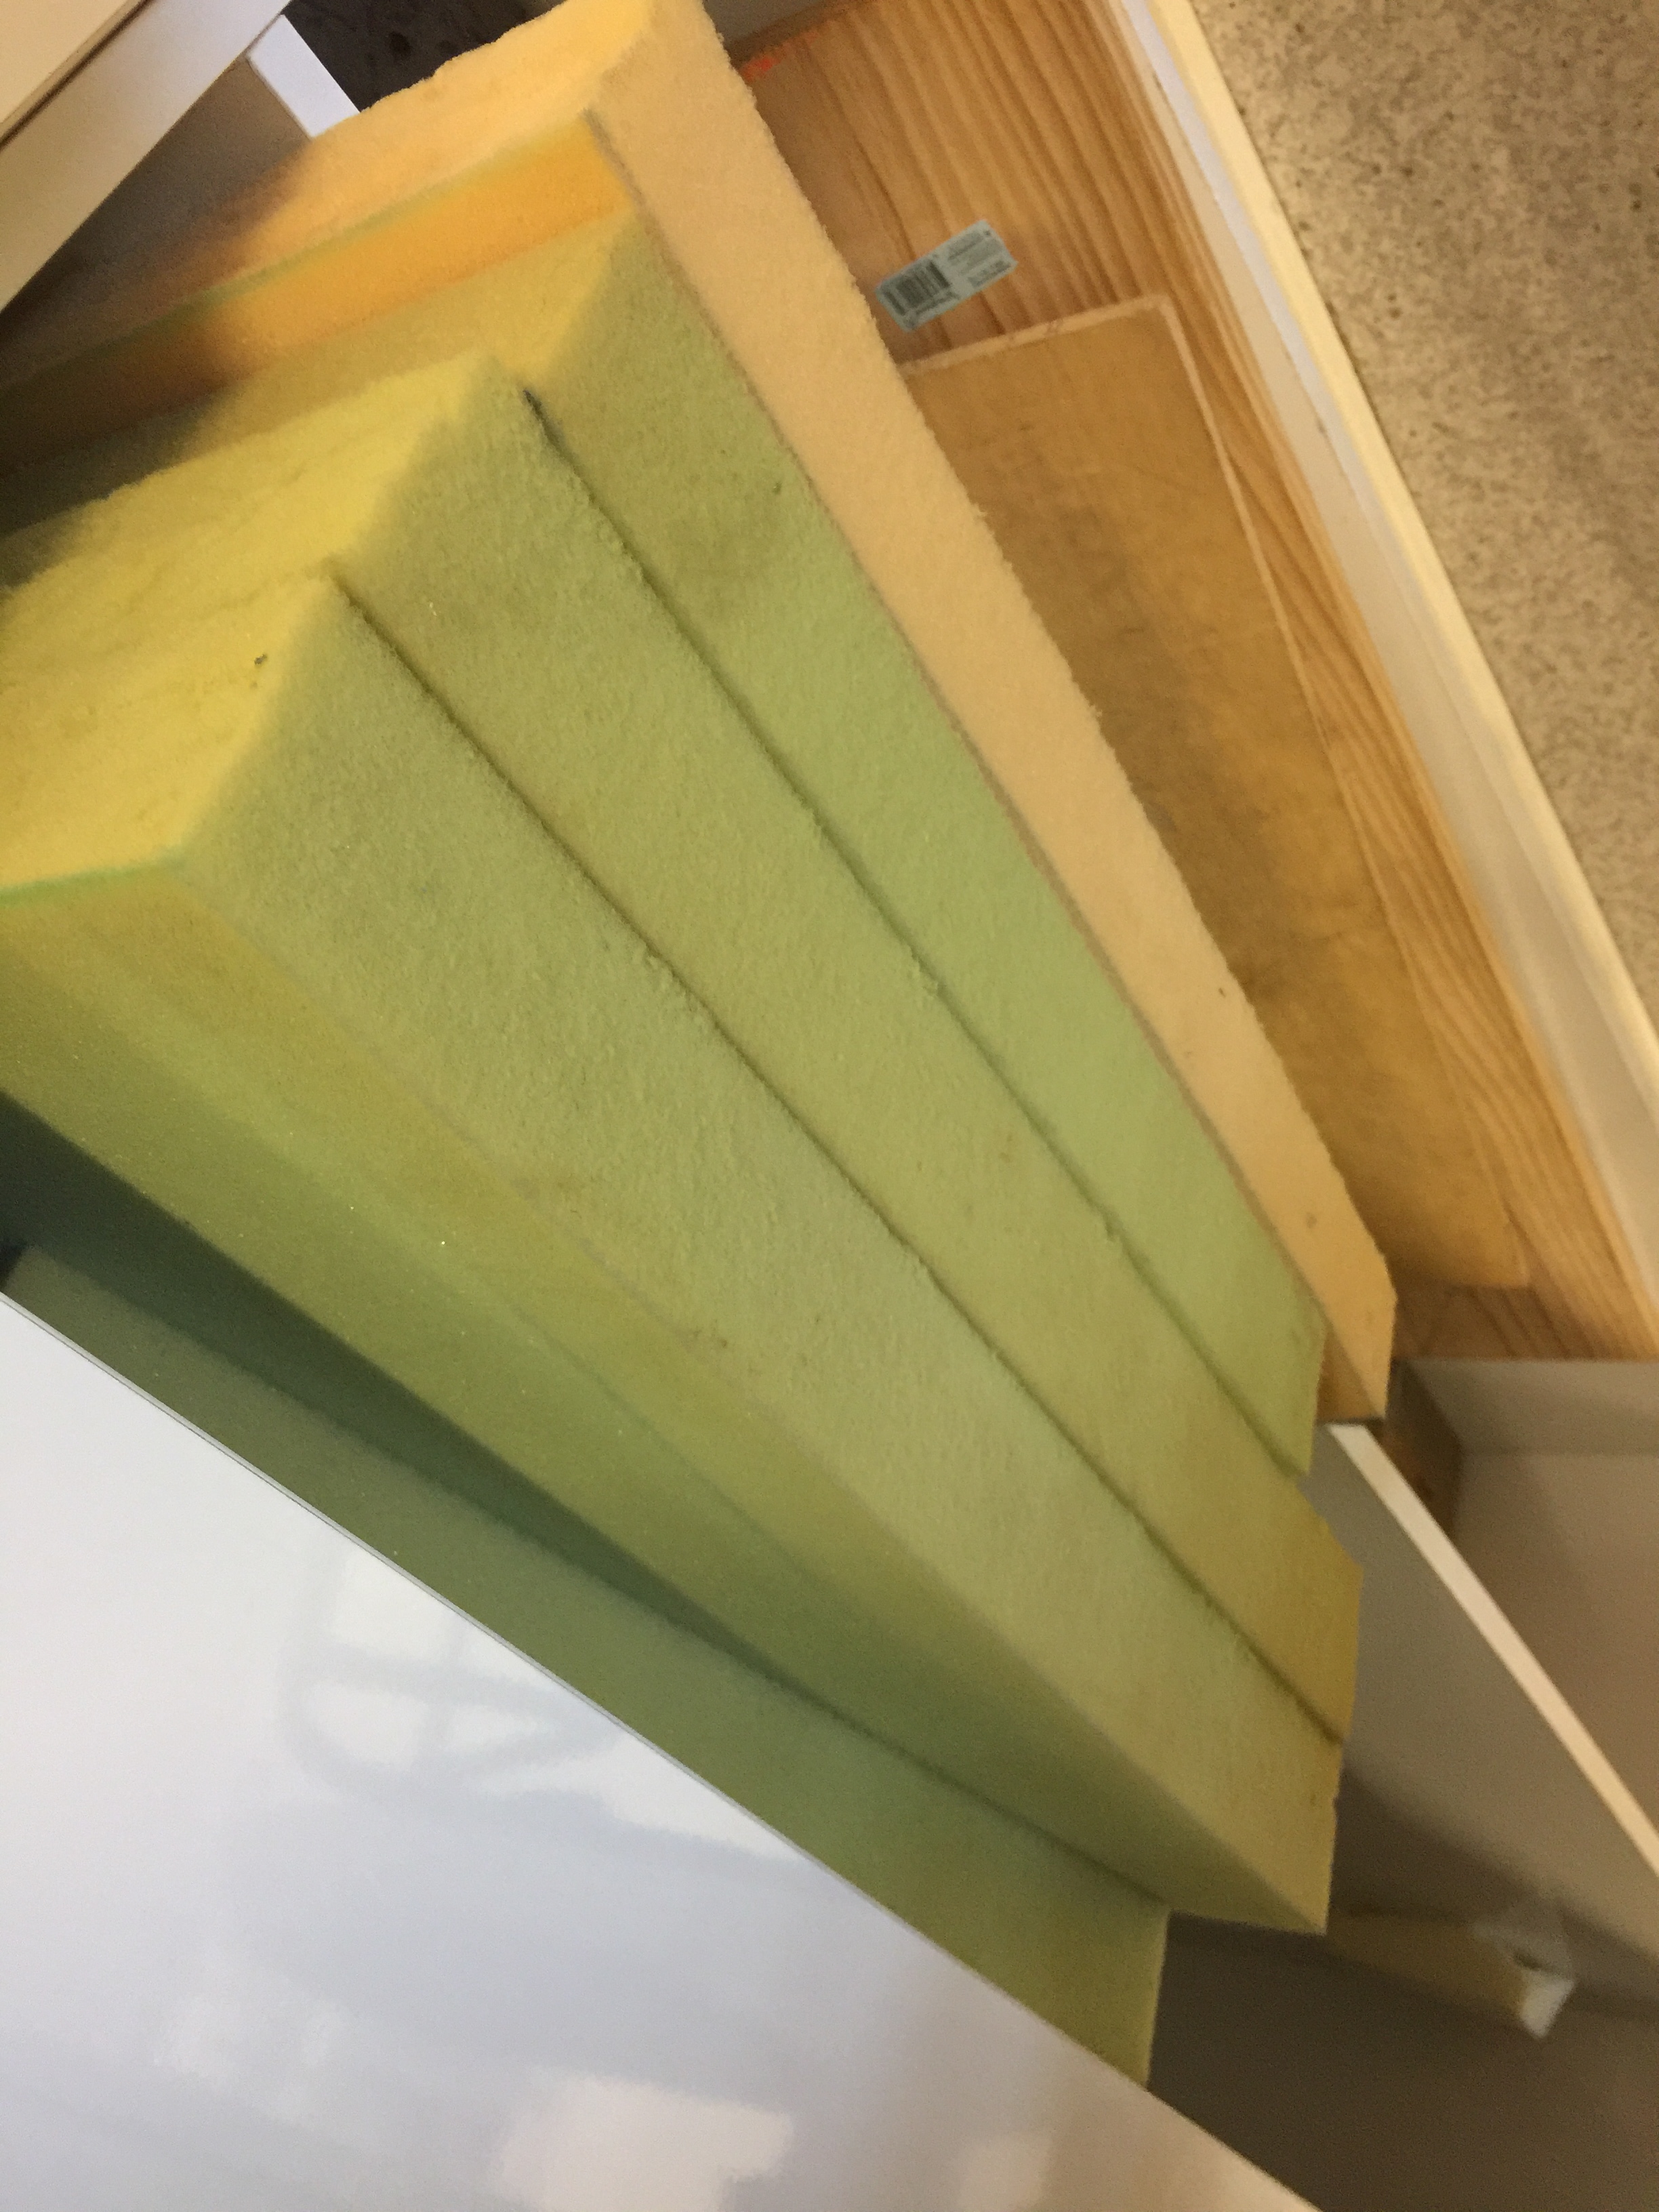 |
| Wood chips
(The second largest particle) |
1 | 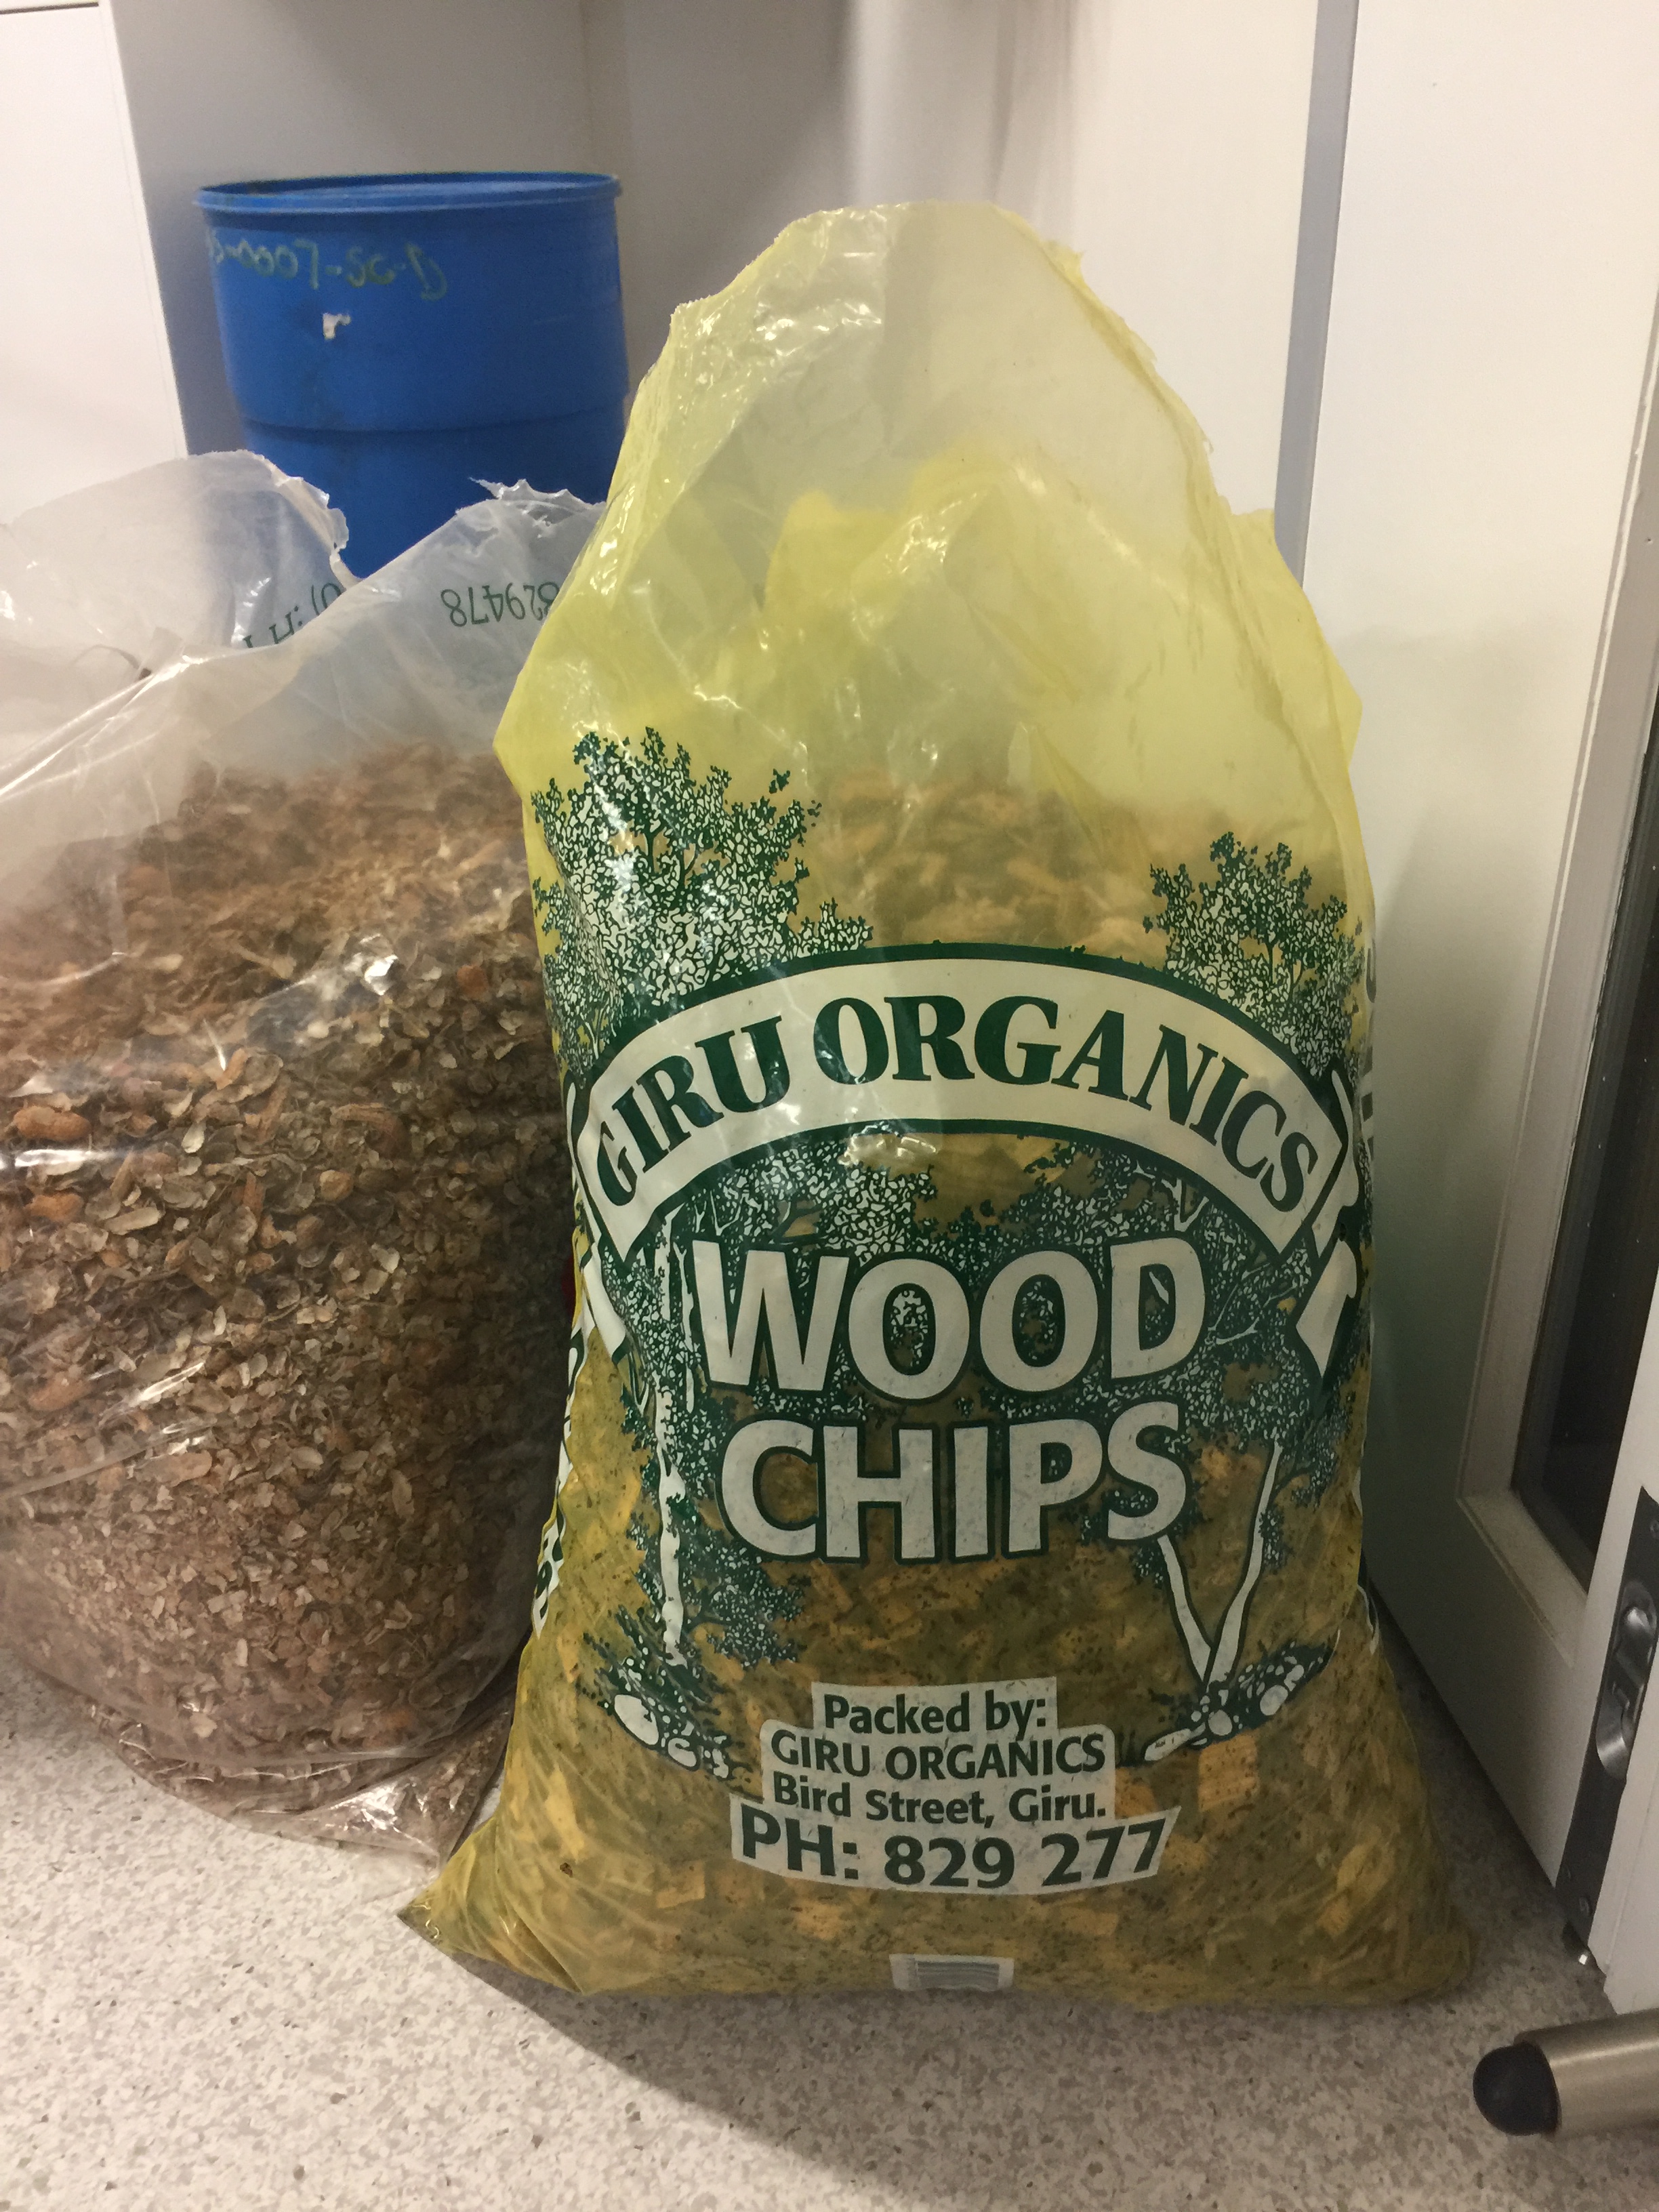 |
| Peanut Shell
(The third largest particle) |
1 | 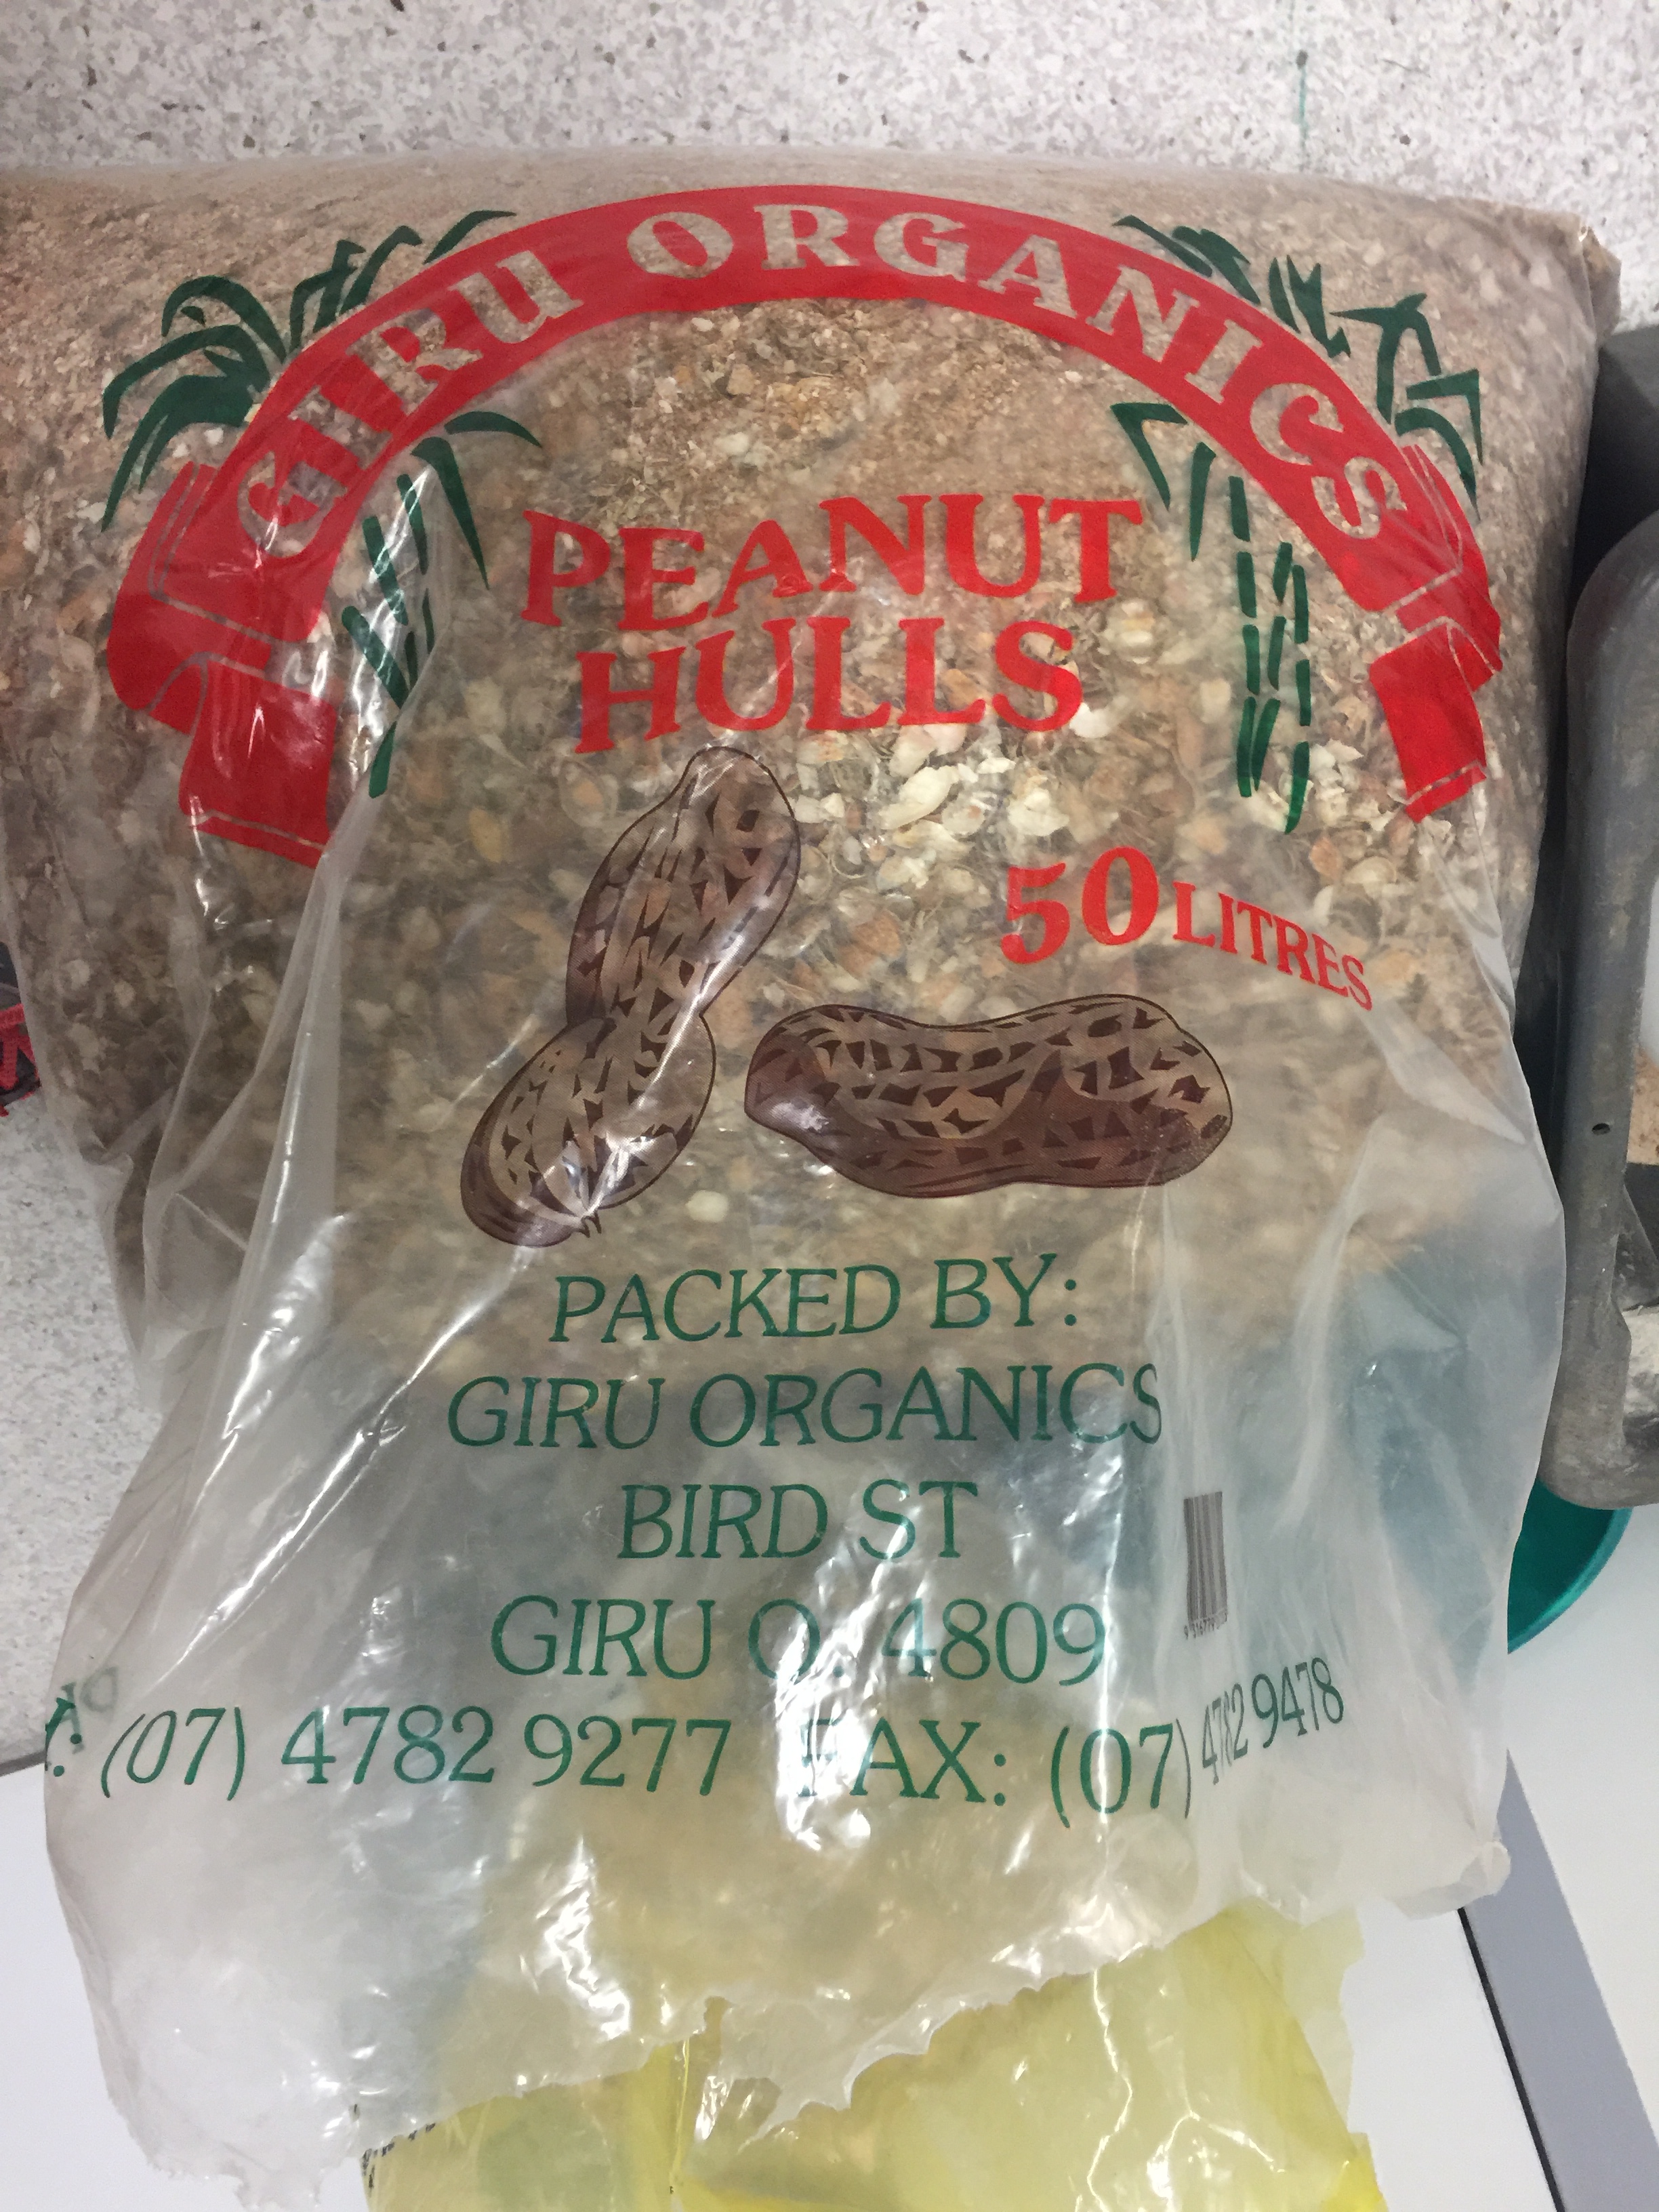 |
| Styrofoam | 7 | 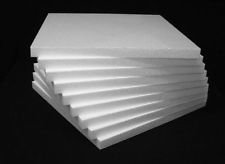 |
| Coarse sand
(The smallest particles) |
1 basket | 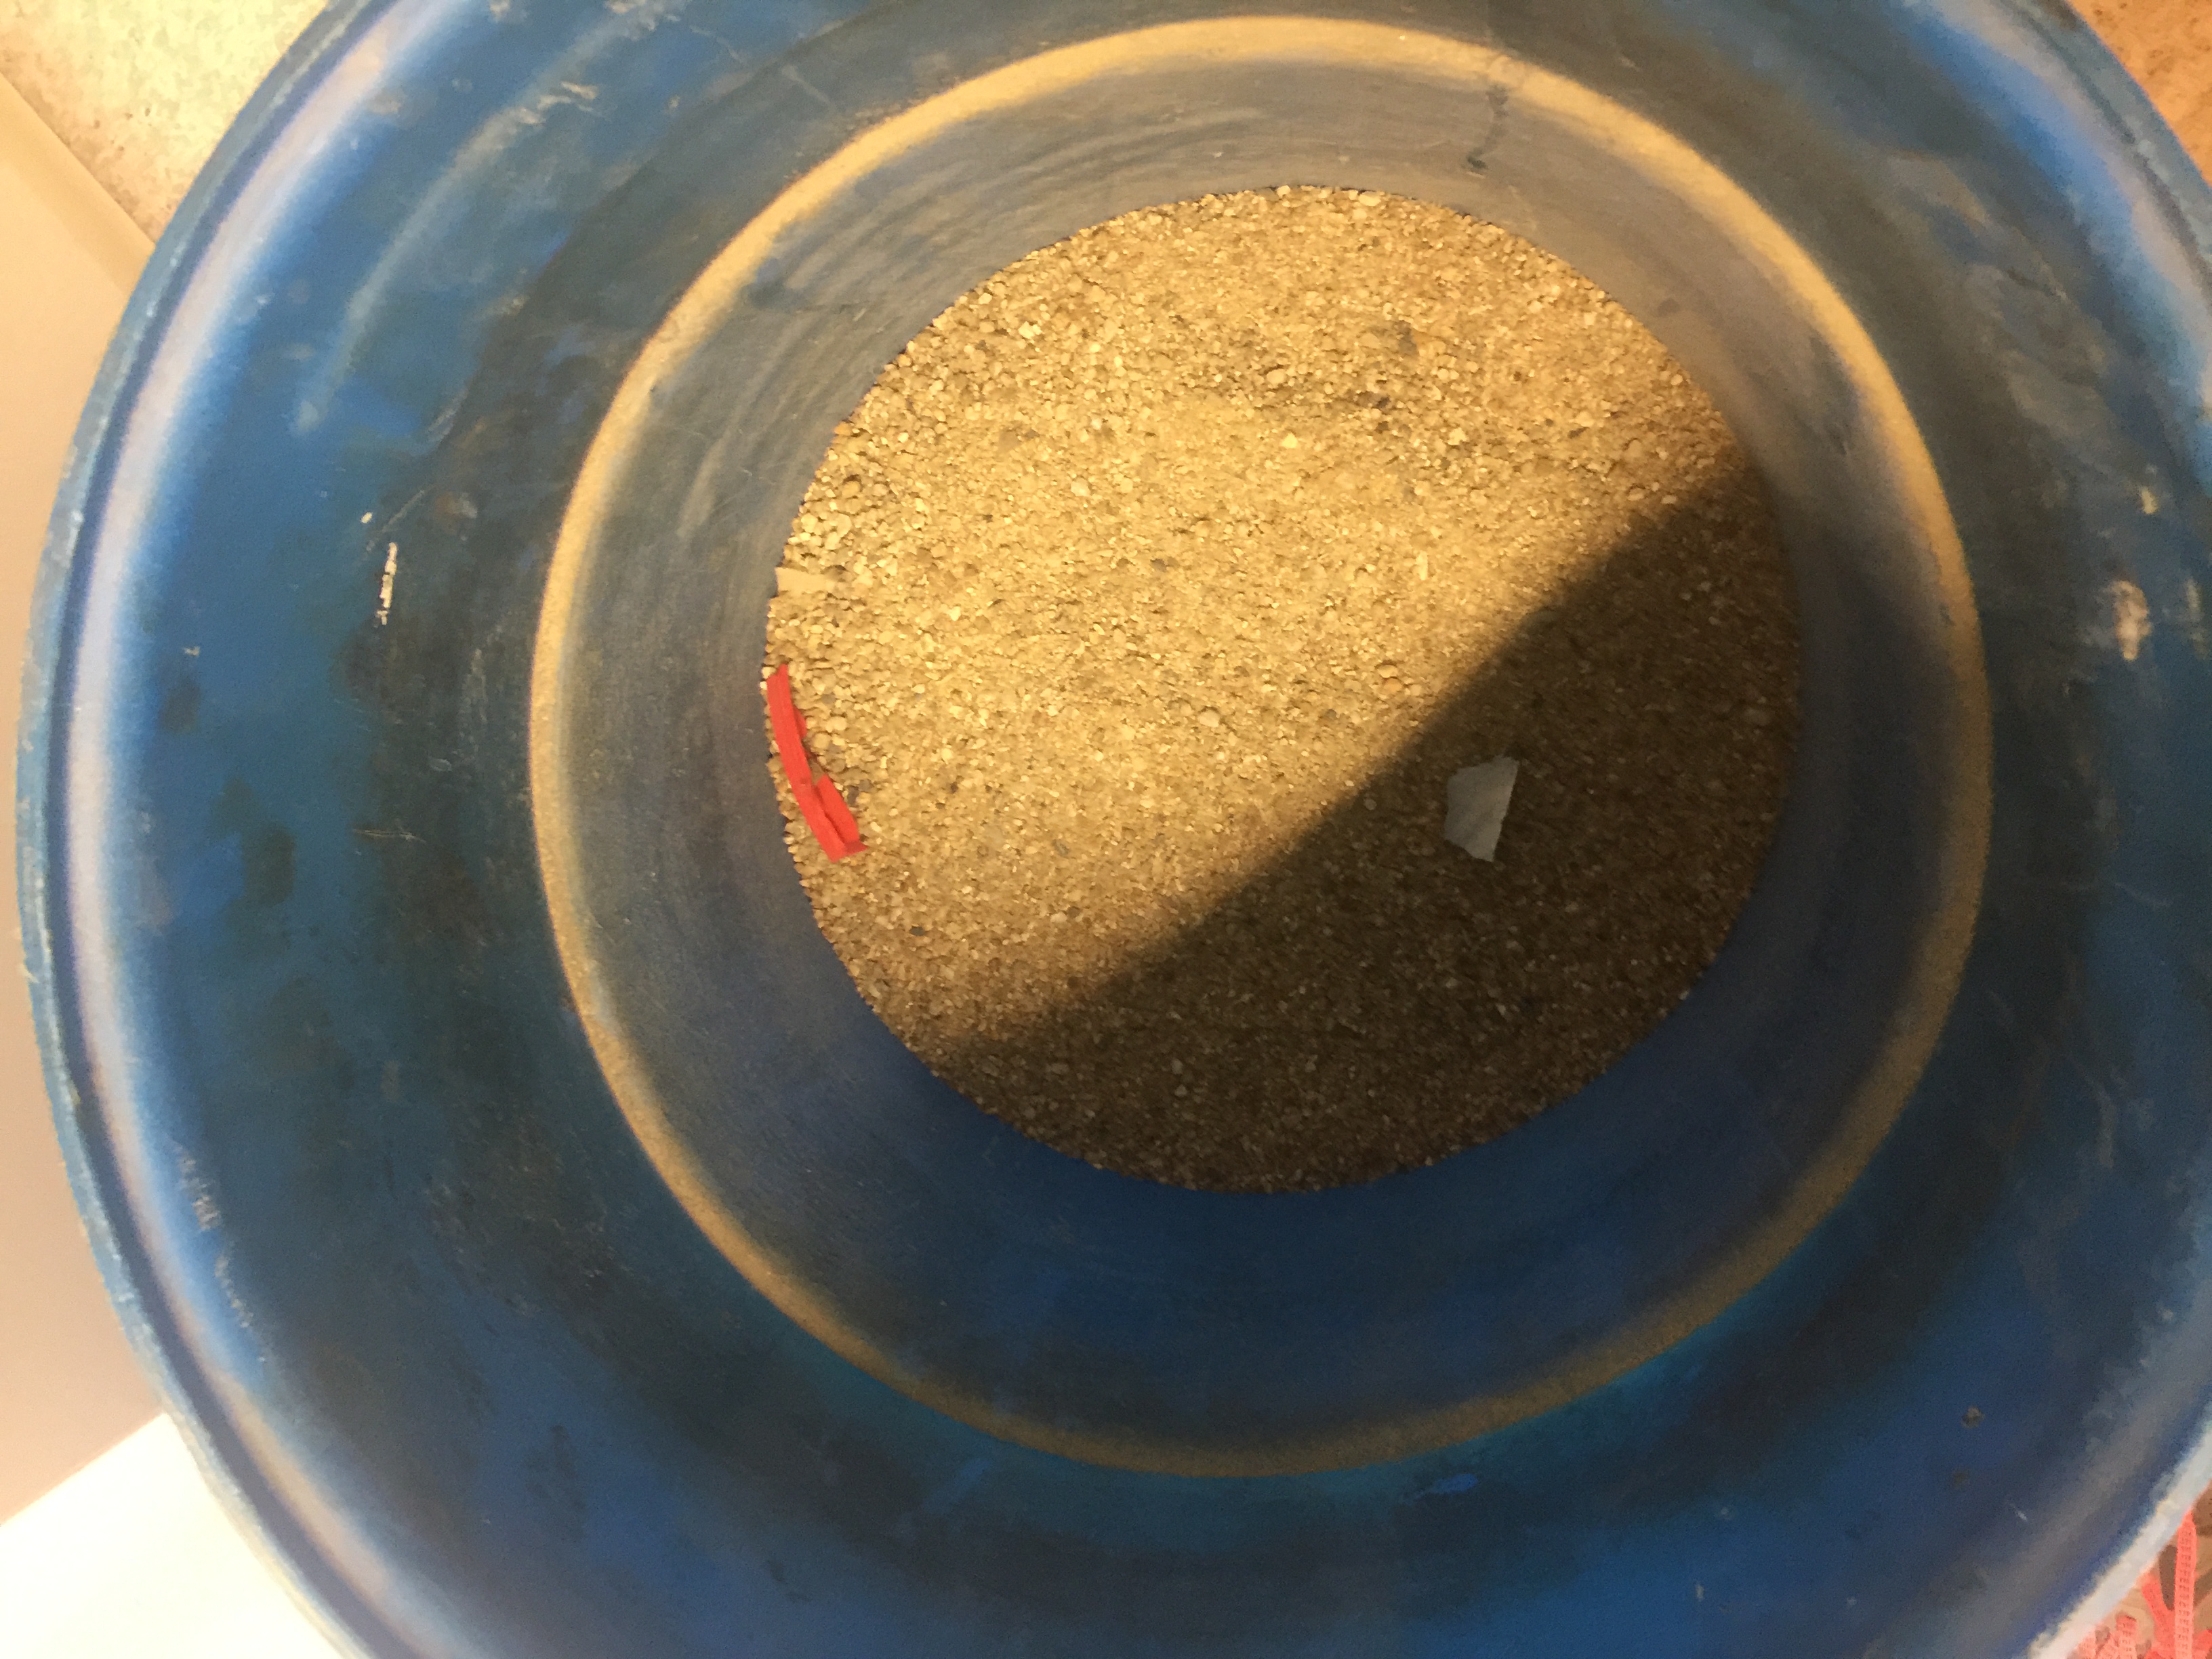 |
| Ruler and whiter | 2 | 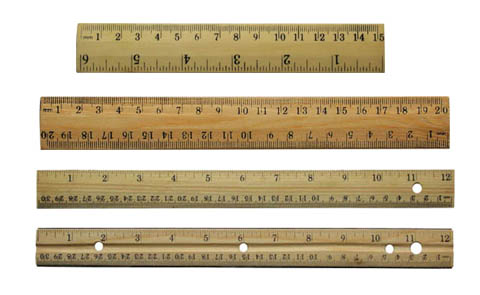 |
| PASCO with USB sport for connecting laptop | 1 | 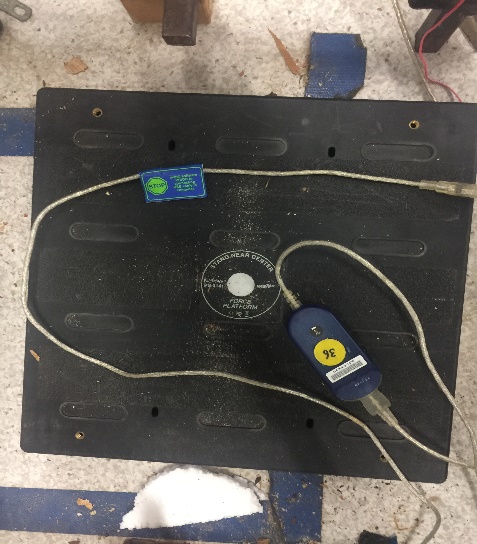 |
5. Procedure
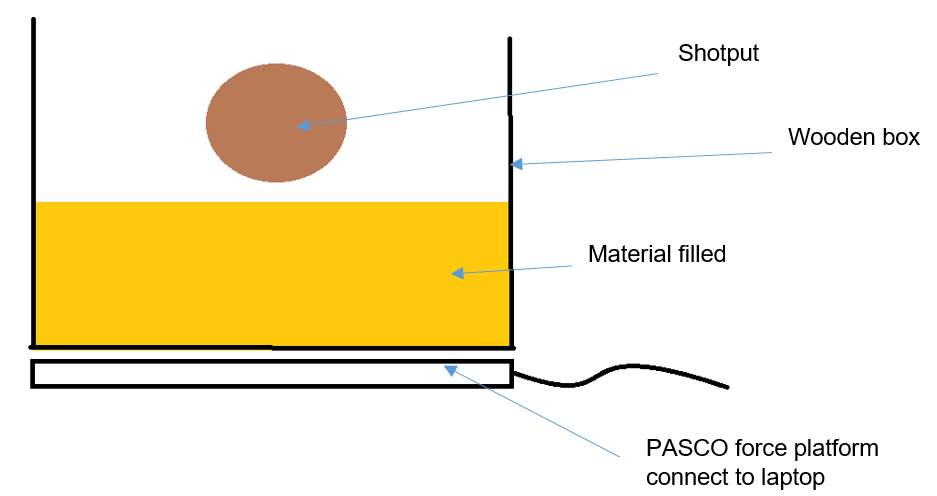
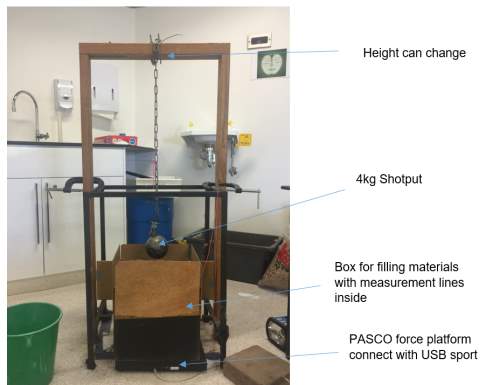
Two figures show the procedure set up in 3D and 2D:
String and releasing hook
Figure 1: 3D procedure set up
Figure 2: 2D procedures setup
Procedure A – Force Absorption Capacity of Wood chip (with multiple drops)
- PASCO was opened and sat up for data collection.
- The frequency of the force platform was changed from 50Hz to 1000Hz.
- A wooden box was displayed on top of the platform.
- Put 4cm of woodchip into the box. One hand started the PASCO, the other one put the string to release the shot put. For each trial, need to shuffle it.
- After 4 trials, another 4cm layer was putted on top.
- PACSO was started ad relevant visual displays.
- Steps 3 –6 were repeated for 4 -20cm trials.
- 6 cm woodchip layer selected to do the multiple drops.
Procedure B – Force Absorption Capacity of Peanut shell (with multiple drops)
- PASCO was opened and sat up for data collection.
- The frequency of the force platform was changed from 50Hz to 1000Hz.
- A wooden box displayed on top of the platform.
- Put 4cm of peanut shell into the box. One hand started the PASCO, the other one put the string to release the shot put. For each trial, need to shuffle it.
- After 4 trials, another 4cm layer was putted on top.
- PACSO was started ad relevant visual displays.
- Steps 3 –6 were repeated for 4 -20cm trials.
- 8 cm peanut shell layer selected to do the multiple drops.
Procedure C– Force Absorption Capacity of coarse sand (with multiple drops)
- PASCO was opened and sat up for data collection.
- The frequency of the force platform was changed from 50Hz to 1000Hz.
- A wooden box displayed on top of the platform.
- Put 4cm of coarse sandinto the box. One hand started the PASCO, the other one put the string to release the shot put. For each trial, need to shuffle it.
- After 4 trials, another 4cm layer was putted on top.
- PACSO was started ad relevant visual displays.
- Steps 3 –6 were repeated for 4 -20cm trials.
- 12 cm and 20 cm layer coarse sandwas selected to do the multiple drops.
Procedure D– Force Absorption Capacity of green foams and styrofoam
- PASCO was opened and sat up for data collection.
- The frequency of the force platform was changed from 50Hz to 1000Hz.
- A wooden box displayed on top of the platform.
- Put 1 layer (5.5cm/layer) of green foam into the box. One hand started the PASCO, the other one put the string to release the shot put.
- After 4 trials, need to add another layer.
- PACSO was started ad relevant visual displays.
- teps 3 –6 were repeated for 3 layers. Then kept repeating for styrofoam (3cm/layer), for 3 layers, 2 trials for each layer.
6. Results and Analysis
Height of drop: Measuring Instrument: Meter Ruler.
- Typical reading: 46 +/- 0.5cm
- Relative error: 0.5/ 46=0.011= 1%
Mass of Shot put:
- Typical reading: 4 kg+/- 0.0005kg
- Relative error: 0005/ 4=0.000125= 0.0125%
Most of the PACSO probes have very small errors, read the spec sheet inside their plastic pouch.
Wood chip
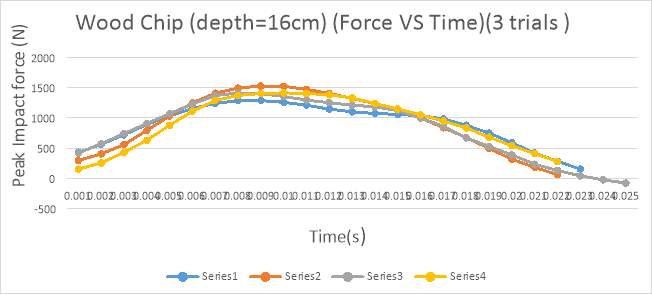
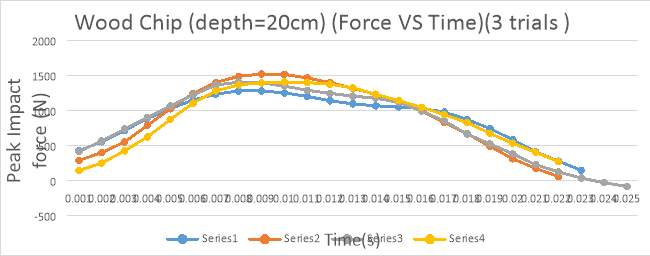
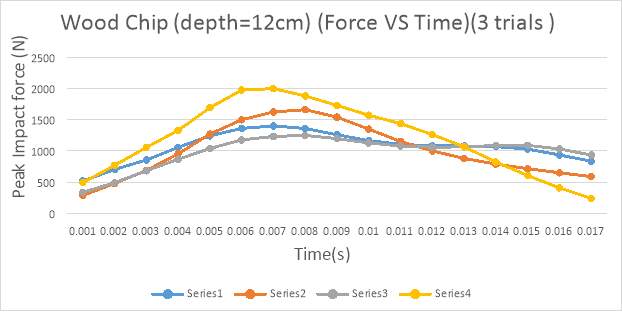
The following graphs shows peak impact force VS time for coefficient depth of wood chip. The graphs show 3-4 trials of each case. There are lines shows the peak impact force for each trial and thus depth is a contributing factor for peak impact force. From 12-20cm trials, graphs are in the Appendix.
Figure 2: The peak impact force of a shot put dropping into a 6cm deep cushioning of wood chip measured in newton graphed against time in seconds. The average peak impact force over the three trials is (insert value), this occurs at 0.011 seconds following impact. All of the impulse graph show similar shapes, indicating constant trails.
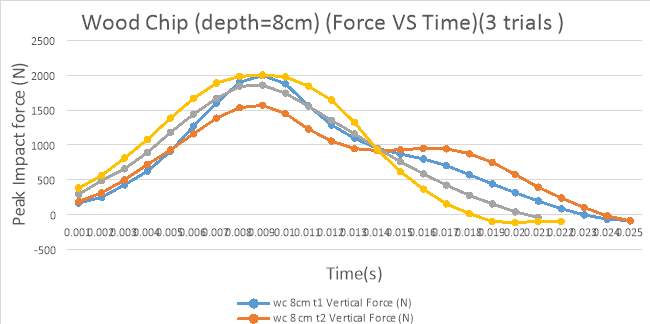
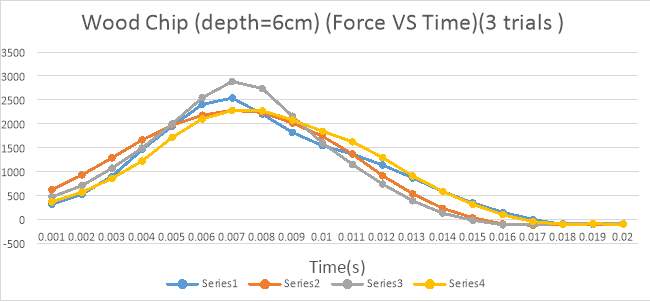
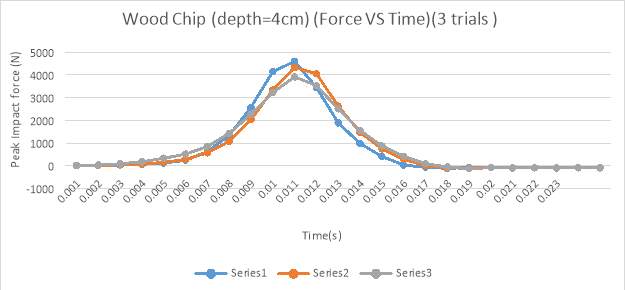
Figure 3: The peak impact force of a shot put dropping into a 4cm deep cushioning of wood chip measured in newton graphed against time in seconds. The average peak impact force over the four trials is (insert value), this occurs at 0.011 seconds following impact. All of the impulse graph show similar shapes, indicating constant trails.
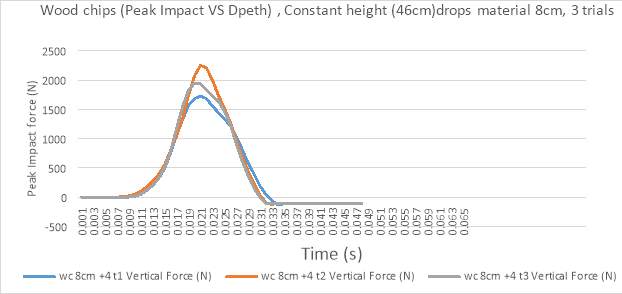
Figure 5: The peak impact force of a shot put dropping into a 8cm deep cushioning of wood chip measured in newton graphed against time in seconds. The average peak impact force over the four trials is (insert value), this occurs at 0.011 seconds following impact. All of the impulse graph show similar shapes, indicating consistent trials.
Peak impact force summary table about wood chip drops:
Table 1: 4 trials of wood chips drops with average and stand deviation
| Wood chip depth (cm) | Trial 1 (N) |
Trial 2 (N) | Trial 3(N) | Trial 4(N) | Average (N) | Stand deviation (N) |
| 4 | 4599 | 4333 | 3917 | 4283 | 281 | |
| 6 | 2538 | 2280 | 2884 | 2270 | 2493 | 250 |
| 8 | 1996 | 1857 | 1568 | 2003 | 1807 | 176 |
| 12 | 1361 | 1663 | 1251 | 2000 | 1569 | 291 |
| 16 | 1286 | 1522 | 1412 | 1414 | 1407 | 84 |
| 20 | 1404 | 1568 | 1553 | 1587 | 1528 | 73 |
By using the table above, two graphs with error bars created. Meaning no extra benefit. For depths of 6 and 8 cm there is large reduction in peak impact force compared to 4cm. at 4cm depth, peak impact force is 4280N, at 6cm, peak impact force is 2490N, and 8cm depth 1810N, representing a percentage reduction of 42% and 58% respectively.
Alternately error calculation
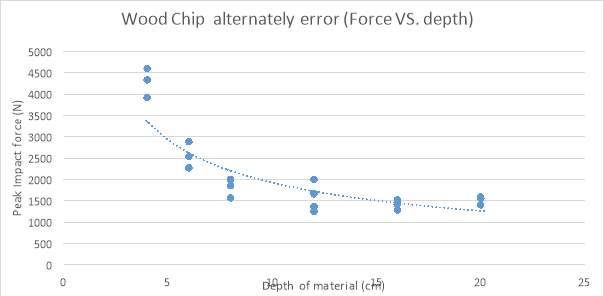
Figure 4:The standard deviation of the trials is often used as the error in the average and for each set of trials can be shown as an error bar on the associated bar. The peak impact force (Newtons) VS depth of wood chips(cm). First four depth trials three results a bit separated. The trend line didn’t match the points perfectly regression analysis
y=7792x-0.61
,where
R2=0.7661
Error Bar in Excel, with average value for each case.
More individual graphs are in Appendix.
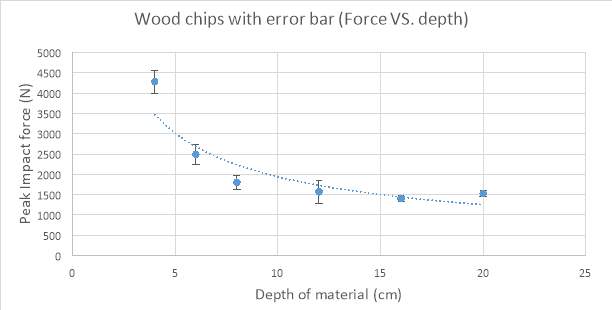
Figure 5: The mean peak impact force has been plotted. The mean of four trials was taken in each case. The standard deviation of the trials is often used as the error in the average and for each set of trials can be shown as an error bar on the associated bar. The peak impact force is predicated by the regression analysis
y=8.340x-0.63
,where
R2=0.8375
The error bars show one standard deviation above and below the mean. The small error bars indicate that the trials are very consistent and validates the experiment. For depths greater than 12 cm, peak impact force remains the same. Trend line didn’t fit with the plot perfectly.
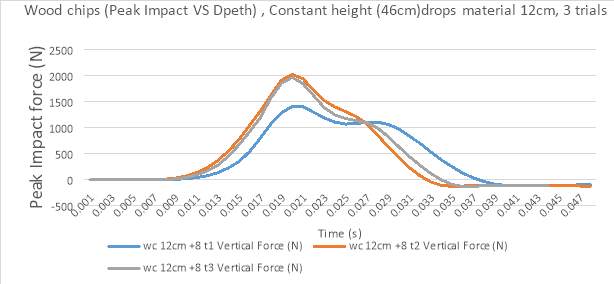
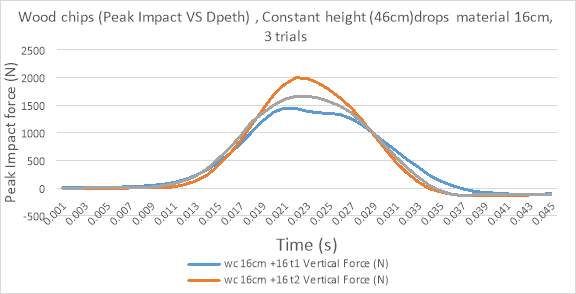
Wood chip constant height dropping (46cm), individual impact graphs show in the Appendix.
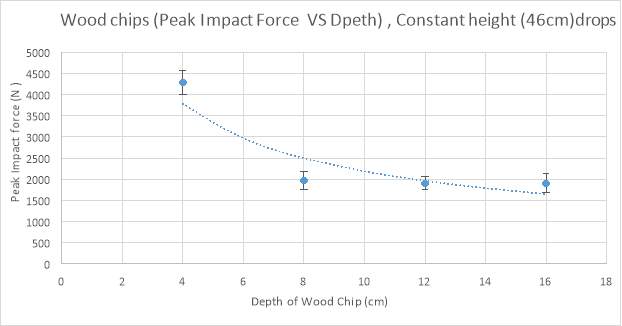
Figure 6: The standard deviation of the trials is often used the average and for each set of trials can be shown as an error bar on the associated bar. When the shot put at constant height above top level of wood chips. When once the testing material increased 4cm, then the shotput is going to raised 4cm. This experiment is testing shot put dropping on wood chips 46cm. Those points on this graph show. For depths greater than 8cm, peak impact force remains the same. The peak impact force is predicated by the regression analysis
y=8648x-0.597
,where
R2=0.8062
.Trend line didn’t fit with the plot perfectly.
Peanut Shell
The following graphs shows peak impact force VS time for coefficient depth of peanut shell. The graphs show 3-4 trials of each case. There are lines shows the peak impact force for each trial and thus depth is a contributing factor for peak impact force. From 12-20cm trials, graphs are in the Appendix.
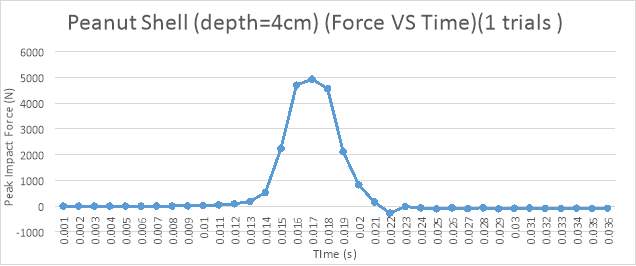
Figure 7:: The peak impact force of a shot put dropping into a 4cm deep cushioning of peanut shell measured in newton graphed against time in seconds. This occurs at 0.011 seconds following impact. This drop reach the maximum of the platform have to stop testing immediately.
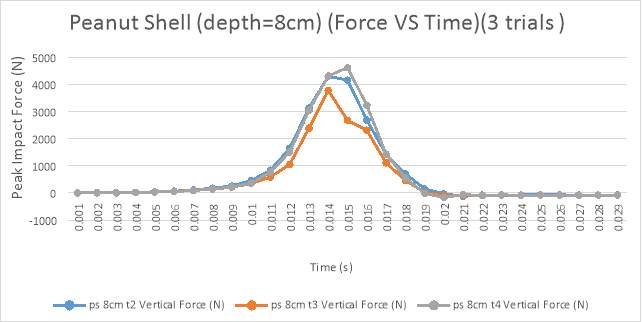
Figure 8: The peak impact force of a shot put dropping into a 8cm deep cushioning of peanut shell measured in newton graphed against time in seconds. The average peak impact force over the three trials is (insert value), this occurs at 0.011 seconds following impact. All of the impulse graph show similar shapes, indicating constant trails.
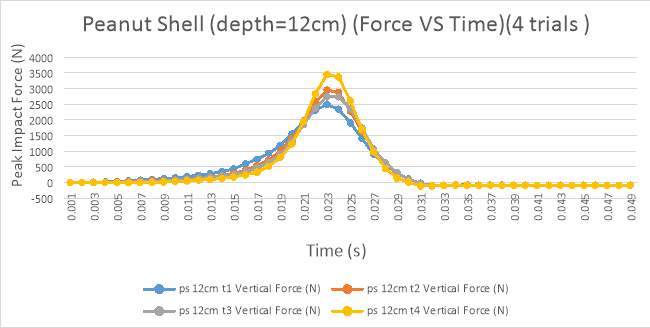
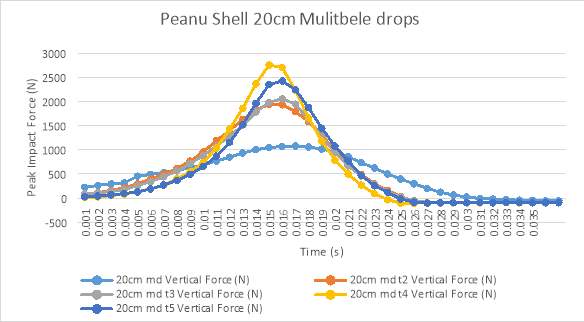
Figure 9: : The peak impact force of a shot put dropping into a 12cm deep cushioning of peanut shell measured in newton graphed against time in seconds. The average peak impact force over the four trials is (insert value), this occurs at 0.011 seconds following impact. All of the impulse graph show similar shapes, indicating constant trails.
Multiple drops: individual drops impact graph are in the Appendix
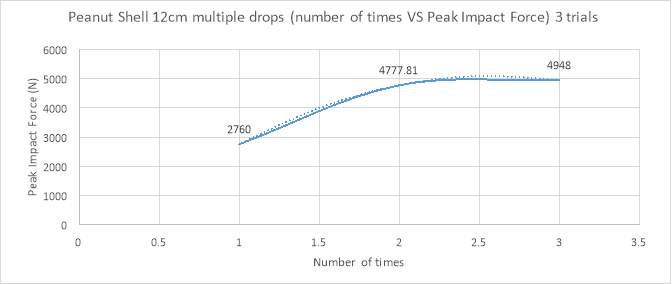
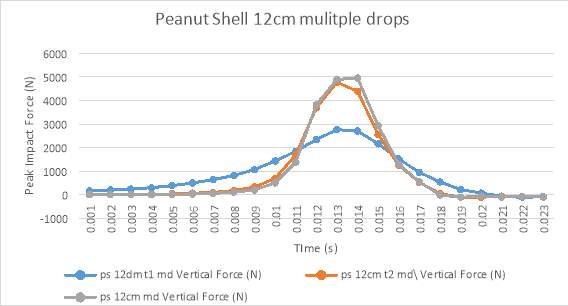
Figure 10: The shotput dropped on the same point each time. The plot in the graph is average of the peak impact force after consecutive trials where peanut shell remained where the shotput before had left them The peak impact force is predicated by the regression analysis
y=-924×2+4789x-1105.4, where
R2=1. Because
R2=1,so, trend line fit with the plot perfectly. Form the second consecutive drop on the same position on the material without re-raking shows, from 2760N peak impact force to 4778N represent and present increased.
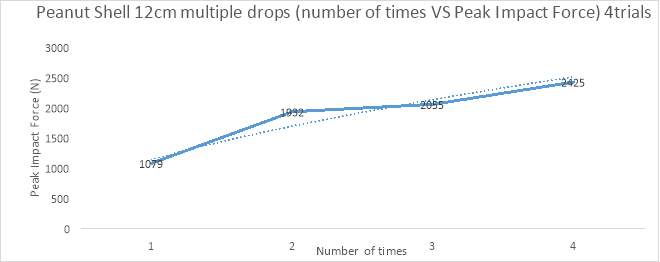
Figure 11: The peak impact force after consecutive trials where the peanut shell remained where the shotput before had left them. The peak impact force is predicated by the regression analysis
y=1143×0.5682
, where
R2=0.9379
Form the second consecutive drop on the same position on the material without re-raking shows, from 1079N peak impact force to 1932N represent and present increased.
Peak impact force summary table about peanut shell drops:
Table 2: 4 trials of peanut shell drops with average and stand deviation.
| Peanut shell depth (cm) | Trial 1 (N) |
Trial 2 (N) | Trial 3(N) | Trial 4(N) | Average (N) | Stand deviation (N) |
| 4 | 4930 | 4930 | 0 | |||
| 8 | 4302 | 3782 | 4623 | 4235.67 | 347 | |
| 12 | 2494 | 2955 | 2741 | 3451 | 2910.25 | 352 |
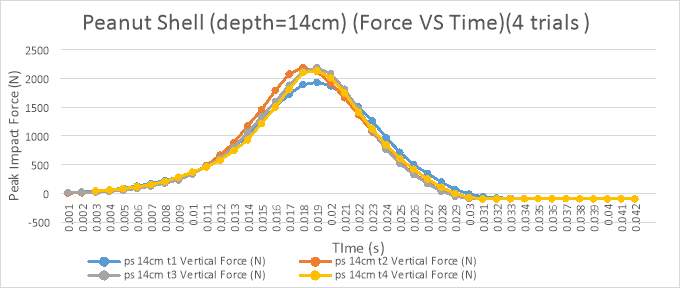
| 14 | 1935 | 2190 | 2186 | 2134 | 2111.25 | 104 |
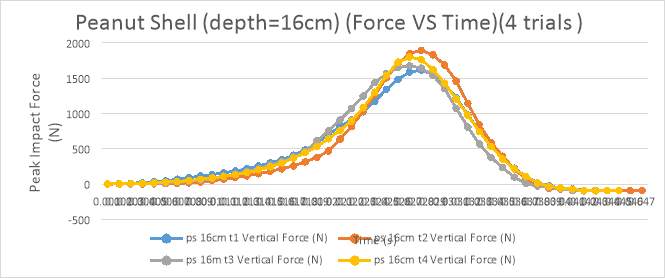
| 16 | 1615 | 1896 | 1677 | 1800 | 1747 | 109 |
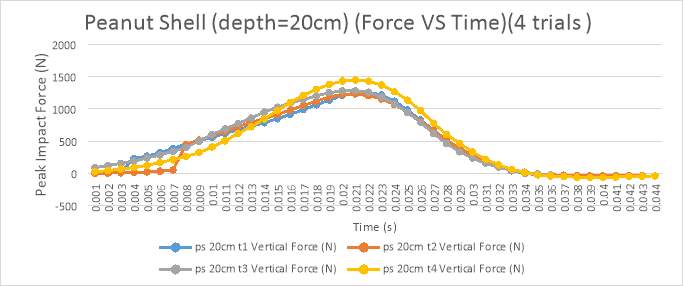
| 20 | 1256 | 1235 | 1284 | 1450 | 1306.25 | 85 |
By using the table above, two graphs with error bars created. Meaning no extra benefit. For depths of 8 and 14 cm there is large reduction in peak impact force compared to 4cm. at 8cm depth, peak impact force is 4240N, at 12cm, peak impact force is 2910N, and 14cm depth 2111N, representing a percentage reduction of 31% and 50% respectively.
Error Bar in Excel, with average value for each case
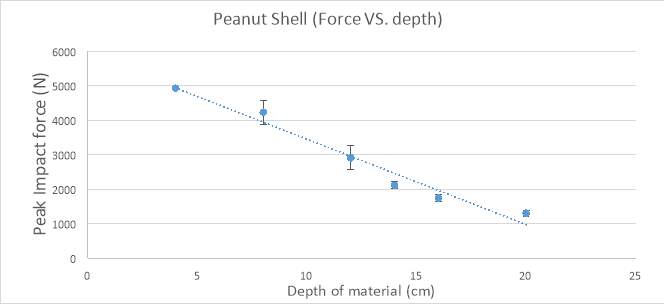
Figure 12: The mean peak impact force has been plotted. The mean of four trials was taken in each case. The standard deviation of the trials is often used as the error in the average and for each set of trials can be shown as an error bar on the associated bar. The peak impact force is predicated by the regression analysis
y=-250x+5930,where
R2=0.9650. The error bars show one standard deviation above and below the mean. The small error bars indicate that the trials are very consistent and validates the experiment. For depths greater than 12 cm, peak impact force remains the same. Trend line didn’t fit with the plot perfectly.
Coarse sand
The following graphs shows peak impact force VS time for coefficient depth of coarse sand. The graphs show 3-4 trials of each case. There are lines shows the peak impact force for each trial and thus depth is a contributing factor for peak impact force. From 12-20cm trials, graphs are in the Appendix.
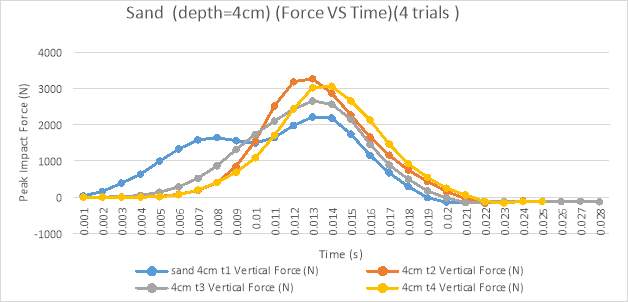
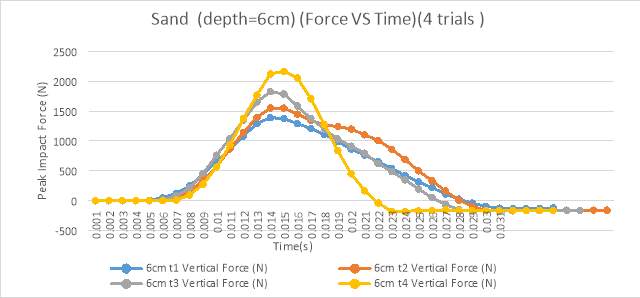
Figure 13: The peak impact force of a shot put dropping into a 4cm deep cushioning of sand measured in newton graphed against time in seconds. The average peak impact force over the four trials is (insert value), this occurs at 0.011 seconds following impact. All of the impulse graph show similar shapes, indicating constant trails.
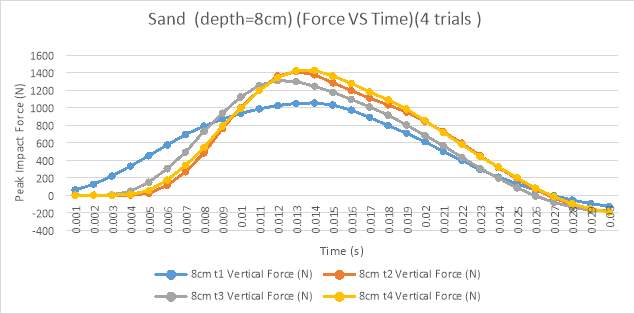
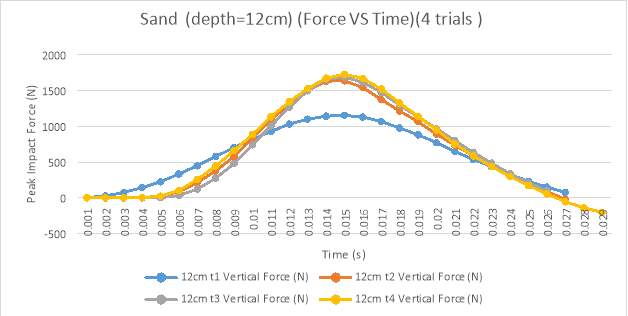
Figure 14: The peak impact force of a shot put dropping into a 8cm deep cushioning of sand measured in newton graphed against time in seconds. The average peak impact force over the four trials is (insert value), this occurs at 0.011 seconds following impact. All of the impulse graph show similar shapes, indicating constant trails.
Multiple drops: individual drops impact graph are in the Appendix
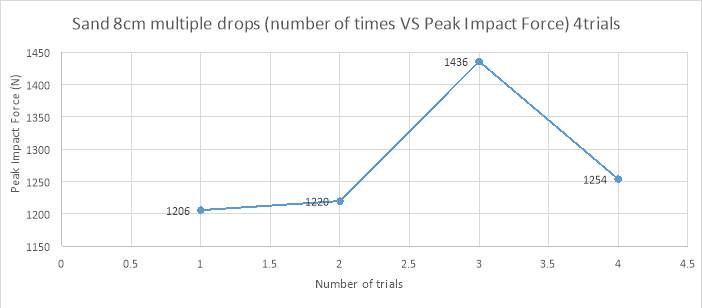
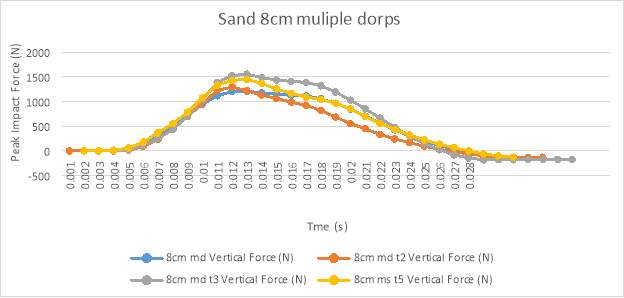
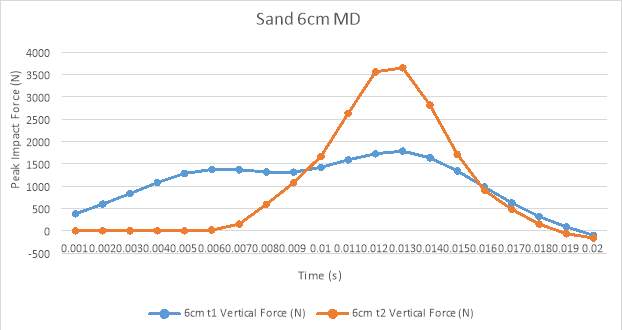
Figure 15: The peak impact force after consecutive trials where the sand remained where the shotput before had left them. Form the third consecutive drop on the same position on the material without re-raking shows, from 1220N peak impact force to 1436N represent and present increased. From the first, second and fourth points, the results looks similar.
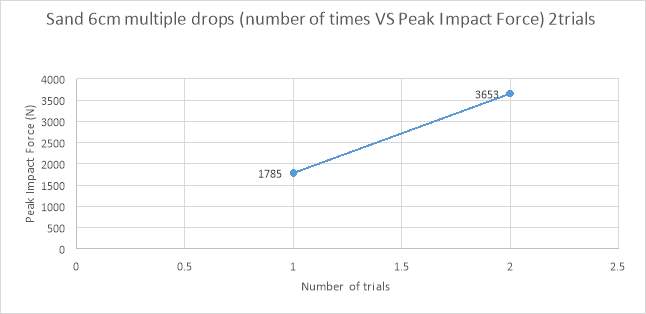
Figure 16: The peak impact force after consecutive trials where the sand remained where the shotput before had left them. Form the third consecutive drop on the same position on the material without re-raking shows, from 1790 N peak impact force to 3650N represent and present increased. On the second drop, the peak impact force is almost doubled.
Peak impact force summary table about sand drops:
Table 3: 4 trials oft sand with average and stand deviation
| Sand depth (cm) | Trial 1 (N) |
Trial 2 (N) | Trial 3(N) | Trial 4(N) | Average (N) | Stand deviation (N) |
| 4 | 2212 | 3265 | 2651 | 3017 | 2786 | 397 |
| 6 | 1392 | 1554 | 1827 | 2124 | 1724 | 278 |
| 8 | 1054 | 1375 | 1244 | 1425 | 1275 | 143 |
| 12 | 1153 | 1636 | 1690 | 1726 | 1551 | 232 |
By using the table above, two graphs with error bars created. Meaning no extra benefit. For depths of 4 and 8 cm there is large reduction in peak impact force compared to 4cm. at 4cm depth, peak impact force is 2790N, at 6cm, peak impact force is 1725N, and 8cm depth 1275N, representing a percentage reduction of 38% and 54% respectively.
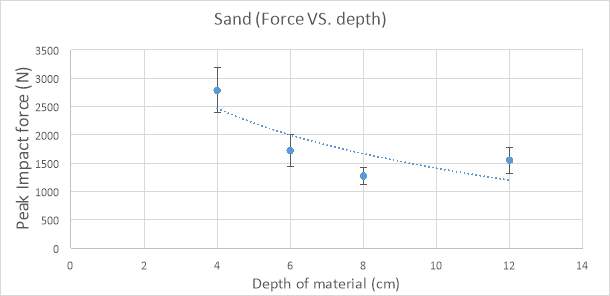
Figure 17: The mean peak impact force has been plotted. The mean of four trials was taken in each case. The standard deviation of the trials is often used as the error in the average and for each set of trials can be shown as an error bar on the associated bar. The peak impact force is predicated by the regression analysis
y=-1151 Inx+4065
,where
R2=0.6527
. The error bars show one standard deviation above and below the mean. The big error bars indicate that the trials are very consistent and validates the experiment. For depths greater than 8 cm, peak impact force remains the same. Trend line didn’t fit with the plot perfectly.
Green soft Foam
The following graphs shows peak impact force VS time for coefficient depth of coarse sand. The graphs show 3-4 trials of each case. There are lines shows the peak impact force for each trial and thus depth is a contributing factor for peak impact force. From 16.5cm trials, graphs are in the Appendix.
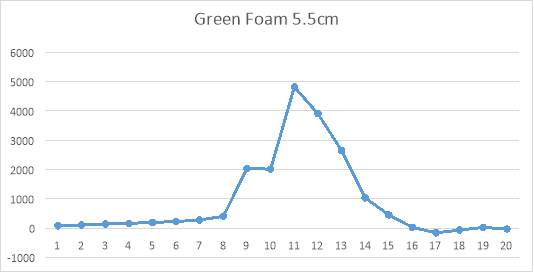
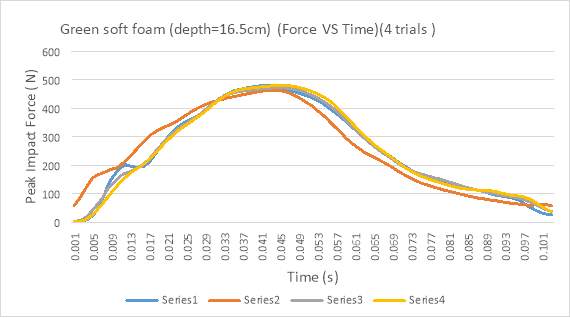
Figure 18: The peak impact force of a shot put dropping into a 5.5cm deep cushioning of green soft foams measured in newton graphed against time in seconds. This occurs at 0.011 seconds following impact. This drop reach the maximum of the platform have to stop testing immediately.
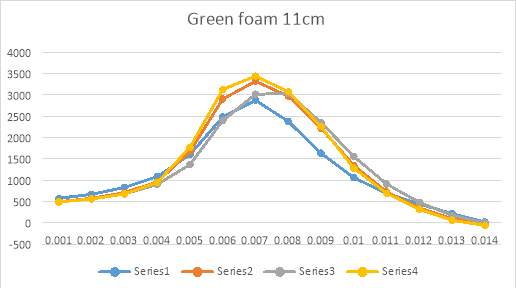
Figure 19: The peak impact force of a shot put dropping into a 6cm deep cushioning of green soft foam measured in newton graphed against time in seconds. The average peak impact force over the three trials is (insert value), this occurs at 0.011 seconds following impact. All of the impulse graph show similar shapes, indicating constant trails.
Table 4: : 4 trials of green soft foam drops with average and stand deviation
| Green soft foam depth (cm) | Trial | Trial 2 (N) | Trial 3(N) | Trial 4(N) | Average (N) | Stand deviation (N) |
| 1 (N) | ||||||
| 5.5 | 4818 | 4818 | 0 | |||
| 11 | 2872 | 3319 | 3016 | 3441 | 3162 | 227.98 |
| 16.5 | 480 | 464 | 470 | 467 | 470.25 | 6.02 |
By using the table above, two graphs with error bars created. Meaning no extra benefit. For depths of 5.5 and 16.5 cm there is large reduction in peak impact force compared to 5.5cm. at 5.5cm depth, peak impact force is 4820N, at 11cm, peak impact force is 3160N, and 16.5cm depth 470N, representing a percentage reduction of 34% and 90% respectively.
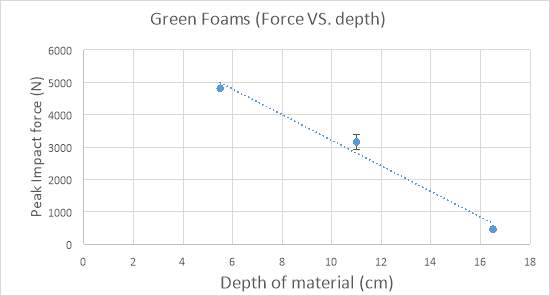
Figure 20: The mean peak impact force has been plotted. The mean of four trials was taken in each case. The standard deviation of the trials is often used as the error in the average and for each set of trials can be shown as an error bar on the associated bar. The peak impact force is predicated by the regression analysis
y=-395x+7165
,where
R2=0.9814
. Because
R2
is very close to 1, so it is nearly perfectly fit the points. The error bars show one standard deviation above and below the mean. The small error bars indicate that the trials are very consistent and validates the experiment. Trend line fit with the plot almost perfectly.
Styrofoam
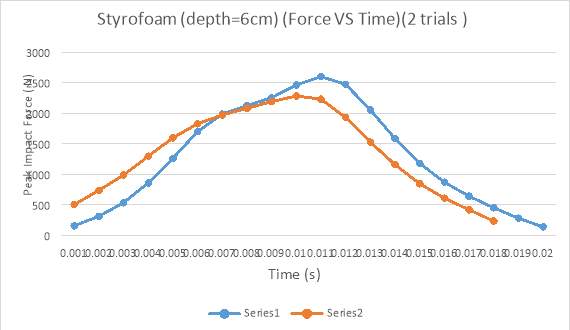
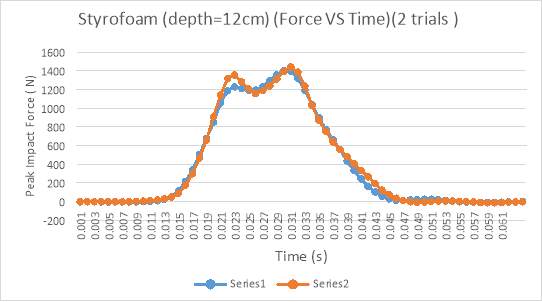
The following graphs shows peak impact force VS time for coefficient depth of coarse sand. The graphs show 2 trials of each case. There are lines shows the peak impact force for each trial and thus depth is a contributing factor for peak impact force. From 6cm and 12cm trials, graphs are in the Appendix.
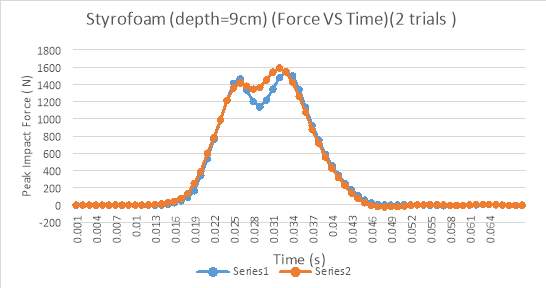
Figure 21: The peak impact force of a shot put dropping into a 9cm deep cushioning of Styrofoam measured in newton graphed against time in seconds. The average peak impact force over the two trials is (insert value), this occurs at 0.011 seconds following impact. All of the impulse graph show similar shapes, indicating constant trails. It clearly shows these a rebound after each trial.
| Styrofoam depth (cm) | Trial 1 (N) | Trial 2 (N) | Average (N) | Stand deviation (N) |
| 6 | 2600 | 2284 | 2442 | 158 |
| 9 | 1550 | 1592 | 1571 | 21 |
| 12 | 1405 | 1442 | 1423.5 | 18.5 |
By using the table above, two graphs with error bars created. Meaning no extra benefit. For depths of 5.5 and 16.5 cm there is large reduction in peak impact force compared to 5.5cm. at 5.5cm depth, peak impact force is 4820N, at 11cm, peak impact force is 3160N, and 16.5cm depth 470N, representing a percentage reduction of 34% and 90% respectively.
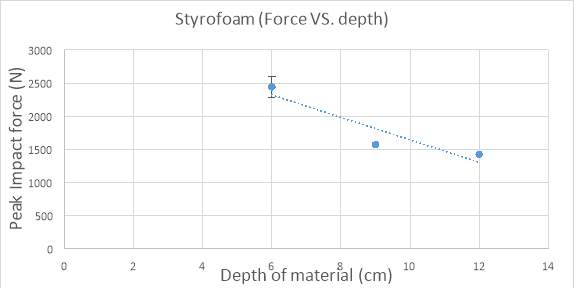
Figure 22: The mean peak impact force has been plotted. The mean of three trials was taken in each case. The standard deviation of the trials is often used as the error in the average and for each set of trials can be shown as an error bar on the associated bar. The peak impact force is predicated by the regression analysis
y=-170x+3340
,where
R2=0.860
. The error bars show one standard deviation above and below the mean. The medium error bars indicate that the trials are very consistent and validates the experiment. For depths greater than 8 cm, peak impact force remains the same. Trend line didn’t fit with the plot perfectly.
7. Difficulties Encountered and Errors
During this experiment, many difficult issues were overcome. The dropping mechanism releases the shotput with difficulty; the eye on the shot put is too big for the metal hook on the chain, which means that the hook has to be pulled manually with great force. The large shot put eye makes the chain swing unnecessarily, which causes inaccuracies in the landing position over multiple drops. This defect causes varied results and inconsistencies that mean the readings are not 100% accurate.
To create better results, the dropping mechanism should not be in contact with the technician when the shotput is releasing. Replacing the small hook with a larger hook would mean that the shotput would not roll on top of the landing material when dropped. Sometimes, the powerful drop made the unsecured box move and jolt on the platform. When the box moved the results were inconsistent and the tests had to be redone. To solve this issue the box should be secured in some way, for example, tying the box to the test frame.
About the testing material, the thickness of foams cannot be easily changed. The foam only adds up layer by layer and because there is not enough Styrofoam available, it limits the amount of testing trials. As for the woodchips, they are chunky and irregular, which creates difficulty measuring exactly 4cm depth.
The chain links are 4cm in length, the chain heights were adjusted by 4cm increments each time, thus making the change in height easy to maintain.
Calculation of error: Impulse force for 46cm shotput on to 20cm wood chips depth.
- Height of drops: Measuring Instrument: Meter Ruler.
- Typical reading: 46cm +/- 0.5cm
RE Relative error= 0.546=0.011=1%
- Mass of Shot put:
- Typical reading: 4 kg+/- 0.0005kg
RE Relative error= 0.0054=0.000125=0.01%
- Force measuring instrument: Force platform
- Typical reading: 1569N+/- 0.5N
RE Relative error= 0.51569=0.0003186=0.03%
- Depth material measuring
- Typical reading: 20cm +/- 0.5cm
RE Relative error= 0.520=0.025=2.5%
Table 5: exhibits the error margin of variability of 4 trials
| Wood chip depth (cm) | trial (N) 1 |
2 (N) | 3 (N) | 4 (N) | Average (N) |
| 20 | 1404 | 1568 | 1553 | 1587 | 1528 |
| Absolute difference | 124 | 40 | 25 | 59 | 62 |
As the table above shows, there is an average variability within trials of 248N. Therefore,
Average force=1528N+/- 62N
RE=0.1623=4.0%
Velocity
Shot put Mass=4.0kg Fshotput=4×9.8=39.2N
Height=46.5cm=0.47m
Acceleration=gravity=9.8m.s-2
v2= u2+2as
v2=2as
v= 2as
v= 2×9.8×0.47
v=3.04 m.s-1
Theoretical
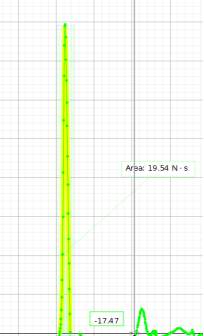
Using trial 4 depth 20cm of woodchips,
Figure 23: This graph shows the are under the peak impact force of dropping. By using area and rebound, an experiment value for impact can be found. Area showing initial impulse =20N
Experimental
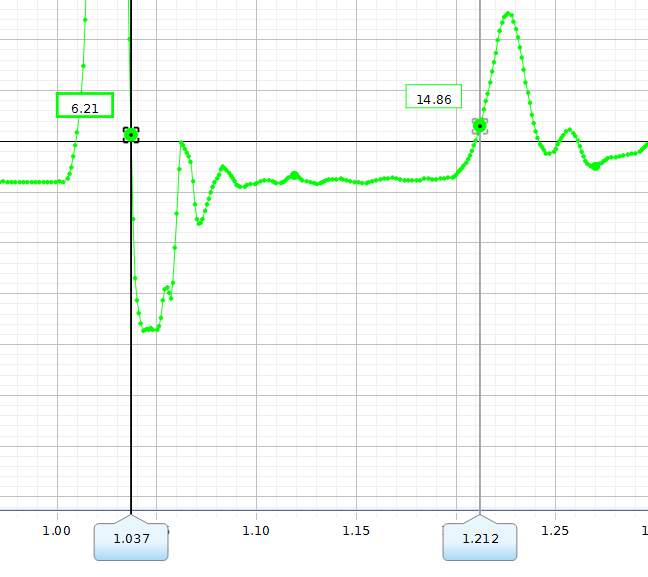
∆t=1.212-1.037=0.175s
12∆t=120.175s=0.088s
v=u+at
v=0.088 ×9.8=0.86-m.s-1
∆v=v1-v2
∆v=3.04+0.86
∆v=3.9m.s-1
∆P=m∆v
∆P=4×3.9
∆P=15.6 kg . m. s-1
The theoretical impulse is 15.6N.
The experimental impulse is 19.54N
% error= theoretical-experimentalTheoretical×100%
% error=15.6-19.5415.6×100%
% error=25%
As calculation above, the percentage error is quite high. It was considered a fair and accurate test, the results determining which playground surface is the best in force absorption. The error in this experiment inaccuracies the depth of all those materials and height of the shotput. The relative area was calculated it can use for comparing with the theoretical measurement and calculating the error. The percentage error can see that this test was fair and the variables were maintains throughout.
Kinetic Energy
KE= 12mv2
KE= 12×4×3.042
KE=18 J
The kinetic energy produced will be approximately 18J.
Gravitational Potential Energy
GPE=mgh
GPE=4 ×9.8 ×0.46
GPE=18J
The Gravitational potential energy produced will be approximately 18J.
It is clearly shows that the maximum energy produced is 18J. Kinetic Energy is same as the gravitational potential energy when the velocity is constant.
8. Discussion, Evaluation and Recommendation
The results from this experiment show trends of the peak impact force of different materials, which are common materials for playground surfaces. Placed under testing they presented a number of results. With repetitive trials and techniques, the most effective playground surface was determined.
By using a weight that was large and spherical, this could be compared to human parts landing on the surface and therefore meaning of reducing force on the object would be vital. Most playground surfaces currently use coarse sand, for safety measures in the event of an accident. The practical research showed that mulch is ideally more efficient and effective in the event of an accident happening.
In Table 1, it shows data for the peak impact force of the shotput released at different depths of material from 4cm to 20cm. From 4cm to 6cm, the peak impact force was doubled, only 2cm made a big difference. For depths of 6 and 8 cm there was large reduction in peak impact force compared to 4cm, this accounts for the mulch being the preferred playground surface depth. In the error graph (Figure 4), the same experiment was conducted under the same conditions with a change in the depth, and a trend line inverse relationship was modelled (
y=8.340x-0.63
). This test has the smallest error, according to the error bar graph. The shape of woodchips, the woodchips are too sharp for a children’s playground.
The investigation also tested the relationship between impact force and peanut shells under compacted conditions. From Table 2, the first trial reached the maximum of the force platform. From 8cm to 14cm it increased almost 50%. As can be seen, the depth of the material evidently affects the peak impact force, in addition, for 12cm multiple drops. The second consecutive drop on the same position on the material without re-raking showed the peanut shell is not the perfect material for a playground surface. The data was doubled from the first drop to the second because the material had not been shuffled after heavy drops, then force absorption will decrease. As the two pictures show below, for 20cm trials the shotput landed deeply in the material. For the second picture, it shows how deep the shotput landed.
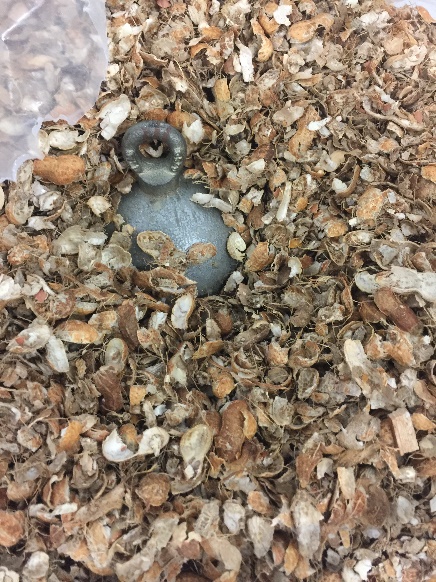
Figure 24: Shotput drop on Peanut shell depth 20cm
The most popular material for the playground surface, sand, was the most constant. In this case, Figure 12 highlights the linear function for peak impact force VS depth of material. It was observed that the compact sand absorbed less of the peak impact force and depth of sand.
For easy cleaning and environmental problems, Styrofoam and soft foams are not the best for the purpose. The soft green foams are easy to get dirty; dust will stuck in the holes of the low density foams. Styrofoam can only be used once, after each drop, there is a big difference in each layer. Thus, you have to replace it each time; it is not going to be cost effective and will waste nature’s resources. However, the soft foams are very constant in absorbing the force from dropping the shotput.
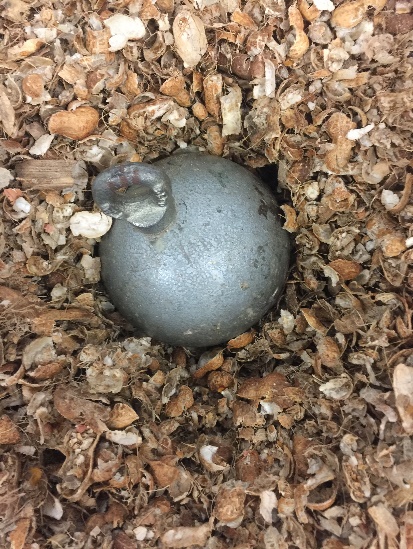
Figure 25: Shotput drop on peanut shell 12cm
On the multiple dropping test, it tested the effect of repeated force on the same surface. The results showed an increase in the peak impact force for sand after multiple drops. For peanut shells, there was a general trend of increase in peak impact force as the number of drops increased.
At the beginning of each trial, the force absorption capacity was significantly less than the continuous impact results, suggesting that loosening the surface was a factor in reducing the force.
Looking back to the aim and hypothesis at the beginning, the first hypothesis was tested and verified. The peak impact force was decreased when the depth of the material increased. By increasing the depth of different materials, the peak impact force exerted on the materials by an impacting object will decrease. The greater the depth of material, the more effectively it will absorb force. However, the second hypothesis is different to what is actually presented. The materials with the larger pieces will absorb more force. There are a range of particle sizes, the last one is coarse sand but in the actual test, sand is the best at absorbing force. The results for Peanut shells were about what was expected at the beginning.
Table 6:This table shows the different between the hypothesis and actual testing.
| Peak Impact force (8cm)(N) | Particles size rank ray
(largest to smallest) |
Peak Impact force absorption (best to poorest) | |
| Green soft foam (11cm) | 3162 | 1 | 3 |
| Wood chips | 1807 | 2 | 2 |
| Peanut shells | 4236 | 3 | 4 |
| Coarse sand | 1275 | 4 | 1 |
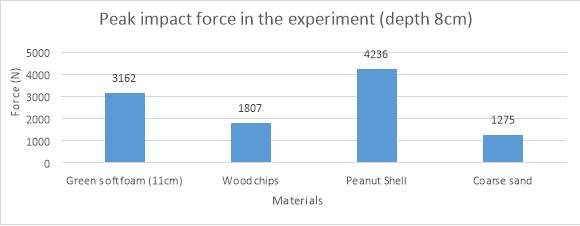
Figure 26: This figure shows the actual peak impact force effect on 8cm material. It can see on the bar chat, the coarse sand absorbed most of the force.
The aim of this experiment is to test which material is the best for a children’s playground surface. These results represented the different impact conditions and the effectiveness of materials and it is easy to see that loose fill materials are superior at absorbing force. This experiment included analysing of different common materials for playground surfaces and the correlation between their effectiveness at impeding collisions. The design of the force platform could be improved in several ways, as previously discussed in the Difficulties Encountered section, which would greatly improve the accuracy of the results. The platform was however reasonably accurate and could deliver effective data.
In reality, it is recommended that the whole surface be made flat and soft at all times, noting this; as sand absorbs the most force, it is the best material for the playground surface.
9. Conclusion
In summary, the dropping of a 4kg shot put was used to mimic the action and weight of a child falling on the playground. The impact reduction capacity of five types of materials were assessed by measuring the peak impact force of a shot put which was dropped from a fixed height.
The results showed that the measurement of different heights, depth, mass and force were factors in this experiment and in the end the superior surface material was ‘sand’ due to its high force absorption capacity. The aim of the investigation was achieved in that a suitable playground surface material was established. What was unanticipated was that the hypothesised larger particle materials were not in fact the best at absorbing force, the best material was sand which has small particles. The percentage of error in this experiment was approximately 25% due to inconsistencies in the design of the force platform as previously discussed.
Further research could be pursued to increase the accuracy of these findings and corroborate them if the design function of the force platform was improved to have nil inaccuracies.
10. References
Collisions – Impulse and Momentum. (n.d.). Retrieved from https://www.utsa.edu/physics/resources/lab-1611&1951/CollisionImpulseMomentum.pdf.
FACTS ABOUT INJURIES TO CHILDREN ON PLAYGROUNDS. (n.d.). Retrieved from https://www.naturalplaygrounds.com/documents/Playground%20Injury%20Statistics.pdf.
How to select Playground Surfacing. (n.d.). Retrieved from http://www.davidwilliamsassociates.com/node/303.
How to select Playground Surfacing. (n.d.). Retrieved from https://www.naturalplaygrounds.com/documents/Playground%20Injury%20Statistics.pdf.
How to Set Up Your Swing Set Safety Zone to Keep Your Kids Safe. (n.d.). Retrieved from http://outdoorfunkids.com/how-to-set-up-your-swing-set-safety-zone-to-keep-your-kids-safe/.
Impulse of Force. (n.d.). Retrieved from http://hyperphysics.phy-astr.gsu.edu/hbase/impulse.html.
Mechanics: Momentum and Collisions. (n.d.). Retrieved from http://www.physicsclassroom.com/calcpad/momentum.
Momentum and Impulse Connection. (n.d.). Retrieved from http://www.physicsclassroom.com/class/momentum/Lesson-1/Momentum-and-Impulse-Connection.
Newton’s Second Law. (n.d.). Retrieved from http://www.physicsclassroom.com/class/newtlaws/Lesson-3/Newton-s-Second-Law.
Playground Surfacing. (n.d.). Retrieved from http://www.kidsafesa.com.au/__files/d/12705/PlaygroundSurfacing2015.pdf.
What is kinetic energy? (n.d.). Retrieved from https://www.khanacademy.org/science/physics/work-and-energy/work-and-energy-tutorial/a/what-is-kinetic-energy.
What is the best soft-fall surface? (n.d.). Retrieved from http://www.moduplay.com.au/blog/school-playgrounds/what-is-the-best-soft-fall-surface/.
What is the best soft-fall surface? (n.d.). Retrieved from http://www.moduplay.com.au/blog/school-playgrounds/what-is-the-best-soft-fall-surface/.
Wind – Energy of Motion. (n.d.). Retrieved from http://science.jrank.org/kids/pages/271/Wind-Energy-Motion.html.
11. Acknowledgements
The following members crucially helped and supported of various individuals was to this investigation.
- Mr Brain Springell
- Ms heather Law
- Lilia Walsh
12. Appendix
Wood chips: 12cm to 20 cm drops:
Height changing trials: Error bars
Peanut shell multiple drop:
Coarse sand multiple drop:
Styrofoam
13. Logbook
Physics Logbook.
| Date | |
| 19/07/2017 | Got idea from Basset Street Park. The park has low fine sand surface. The surface of whole playground bit hard, if a child fall down, will definitely hurt and might cause damage of his brain. |
| 23/07/2017 | Today, I went to do research about how serious is problem and which material might be the best.
http://www.kidsafesa.com.au/__files/d/12705/PlaygroundSurfacing2015.pdf
http://www.moduplay.com.au/blog/school-playgrounds/what-is-the-best-soft-fall-surface/ Those resource show the softness and cost, design opportunities and ease of Maintenance. After researching the topic, it brought better understand and knowledge how the experiment will take place. |
| 26/07/2017 | I went to Bunning to buy a bag of
Wood chips and peanut shells have completely different density and softness. By using graphs force vs depth, peak impact force and other that may of be significance. The test will give out graphs and data can show a superior material which is used for playground surface. |
| 29/07/2017 | I set up the box and measured level of depth from the bottom with Mr Springgell’s help. I used whiter draw a line from 4cm, 6cm 8cm, 16cm and 20cm. Also double-checked all the measurement. In addition, select shotput with the sturdiest hook on top. The dropping strip is bit hard to pull need to hold hook to make it stable first. |
| 02/08/2017 | Today is going to start the experiment. Everything was ready from last week. After each trial need to loosen the wood chips. I am planning to finish Wood Chip testing. By adding up the level of height from 4cm to 20 cm, increased 4cm each time. Need to mind the shotput have to be the same level. All results about impact force are very straightforward. |
| 04/08/2017 | The testing from this week from 4cm to 8cm. the impact force has been decreased half. It might be better to do another 4 trials for 6cm deep of woodchip. The data collected was already showing goods and conclusive results which means the testing of wood chip is working and it is a fair test. |
| 07/08/2017 | Today, I finished all trials with peanut shells. From 4cm to 20 cm. The 4cm drops is already going on the impact force platform, so only did one trial. From 12cm to 16cm, the average impact force decreased half, so I did another 4trials of 14cm. In addition, I did twice multiple drops 12cm and 20cm. After did 3 trials of 12cm multiple drops the impact force up to the maximum the platform. All testing can be done this week. |
| 16/08/2017 | Done all the sand trials. From 4cm to 12cm. The results were constant after 12cm, so the results recording were stopped after 12cm. |
| 17/08/2017 | Done all the foams trials. Styrofoam foams and green sponge foams. Also, did height-changing drops. When 4cm wood chips added, then the shotput will be put upwards 4cm. |
| 20/08/2017 | Graphing all impact graphs had been done. |
| 21/08/2017 | All error bar graphs had been done. |
Cite This Work
To export a reference to this article please select a referencing stye below:
Related Services
View all


Related Content
All TagsContent relating to: "Mechanics"
Mechanics is the area that focuses on motion, and how different forces can produce motion. When an object has forced applied to it, the original position of the object will change.
Related Articles

DMCA / Removal Request
If you are the original writer of this dissertation and no longer wish to have your work published on the UKDiss.com website then please: