Ring Road Design and Development in Rajkot in the Indian state of Gujarat
Info: 12961 words (52 pages) Dissertation
Published: 25th Aug 2021
Tagged: Civil Engineering
- INTRODUCTION
- GENERAL
Under section 22 of Gujarat town and urban planning act, Rajkot Urban Development Authority- RUDA was constituted. Total are covered for this development was four hundred eighty-three square kilometers. This covered 39 villages including the municipal corporation area which was 70 square kilometers. Rajkot is located in middle of a region called Saurashtra in state of Gujarat of India. Rajkot is located in the center of a region in Gujarat state called Saurashtra. Rajkot is one from the most populated city of Gujarat due to its connection with Saurashtra and kutch region and other major parts of Gujarat throught state and national highways, airline and railways.
Rajkot Urban Development Authority (RUDA) has done many successful projects in the periphery of the Rajkot. It has done major part of development of Rajkot. Area under RUDA are well developed and well maintained. The major development of Rajkot City since few years had been done in the area under RUDA.
The important functions of the authorities provided in section 23 of the Gujarat Town Planning & Urban Development Act are:
- Perform surveys in the urban development area of the state to prepare development plans of the area.
- This development plans are managed under the provisions of this act.
- Perform related actions for water supply, sewerage disposal and other services and amenities.
- prepare town planning schemes if directed by Gujarat Government.
- Control and monitor development activities of the development plan
- Lead the local authority in development area for planning, development and use of land.
- Sign contracts or arrangements with authorities, person or organization which might be necessary for urban development.
- Fetch and manage the dispose of property, big or small.
- Perform development works in the urban development which might be assigned by Gujarat government under time bases
Road projects are generally undertaken to improve the economic and social welfareof those using the road or served by it. Increased road capacity and improved pavements can reduce travel times and lower the costs of vehicle use. Benefits include increased access to markets, jobs, education and health services, and reduced transport costs for both freight and passengers.
For all the positive aspects of road development project, there may be negative impacts on nearby communities and the natural environment. People and properties may be in the direct path of road works are affected in a major way. People may also be indirectly affected by the project, through the disruption of livelihood, and community linkages, increases in noise levels and pollution, and more road accidents. Disturbances to the natural environment mayinclude soil erosion, changes to streams / rivers and ground water, and interference with plant and animal life.
With the increasing pace of all round developmental activities in Rajkot, the intensity of traffic on State Highways (SH) connecting the city and on the internal roads has increased many folds, thereby leading to increased volume of traffic on all major roads. This situation is further aggravated by traffic jam and delaying in travel time.
To cope up with this challenge the Rajkot Urban Development Authority (RUDA) has prepared its revised development plan proposal for its area considering the needs of the city upto the year 2011 AD. The revised development plan states a proposal for ‘Ring Road’ in Rajkot connecting three State Highways (SHs) which are Jamnagar State Highway, Kalawad State Highway and Gondal State Highway.
A notification of the Government, the villages viz. Raiya, Nanamava and Mavdi were merged into the Rajkot Municipal Corporation area. Accordingly, the construction works on these villages were carried out by the RMC. The rest of the portion of this ring road falling in the villages viz. Madhapar and Vavdi which area under the jurisdiction of RUDA. The connecting road of these villages is called Ring Road No. 1.
Kalavad State Highway and Gondal State Highway was there. A very quick development is noticed on the Kalavad Road of Rajkot. Almost all educational institutions are on this road. The Saurashtra University is in the vicinity of this road.
Similarly, the Metoda Industrial Estate has come up and many are in progress. This has resulted in heavy traffic from inside and outside the city. Further a huge amount of land has become made useful for non-agricultural purposes like residential, educational and other purposes.
So there is requirement of another Ring Road around Ring Road No. 1 and this road is called Ring Road No. 2.
This Ring Road No. 2 will greatly help outside people, particularly from Jamnagar to have easy access to Kalavad Road. People can have access to this road without entering into the main city.
Rajkot Urban Development Authority (RUDA) has decided to construct Second Outer Ring Road in the periphery of Rajkot City. The total length of the road is 8.956 Km. RUDA has prepared the revised development plan for the city, considering its future needs.
1.2 PRESENT PROBLEMS
RUDA feels that fast development is taking place on the Kalavad Road “ i.e.” Ring Road NO. 1 because of operation of almost all the major education institutions, industrial development, residence development and commercial development.
Since there is no provision of the road outside the city connecting Kalavad Road, the traffic originating from neighbor city like Jamanagar and other satellite villages has to cross the city area and reach to the Kalavad Road. This has resulted in heavy traffic in the city area and causes discomfort to the citizen of Rajkot City. The traffic crossing the city creates pollution by emission of vehicle and noise generated by the vehicles.
- OBJECTIVE OF RUDA
RUDA in gesture to provide healthy living conditions to the citizen of Rajkot, to prosper the city to facilitate the development of the industry located in Kalavad road region, to cut the travel time for the visitors has conceptualized the development of the Ring Road Connecting Jamanagar Road to Kalavad Road. This road shall also provide access to the Town Planning Schemes to be developed in the region and shall create the opportunity for the development of commercial establishments and residential buildings which will suffice the future need of the Rajkot City.
The Rajkot Urban Development Authority (RUDA), since its inception, has been mandated to develop various town planning schemes along with other developmental works. As a part of this development process, provision of improved access to major areas of the city and connecting roads to there SHs is one of RUDA’s agenda since the last few years. The ring road development project is to be implemented through own budgetary resources or through levy of toll as appropriate.
- BENEFITS OF THIS PROJECT
The Project is expected to bring forward positive benefits (while causing some negative social impact, which are proposed to be mitigated fully) for the road users and communities along the ring road. Major economic benefits of the proposed projects consists of the savings in vehicle operating costs, the savings in travel time and improved riding quality. The usage of the improved road facility is likely to benefit enterprises located along the road
- STUDY AREA
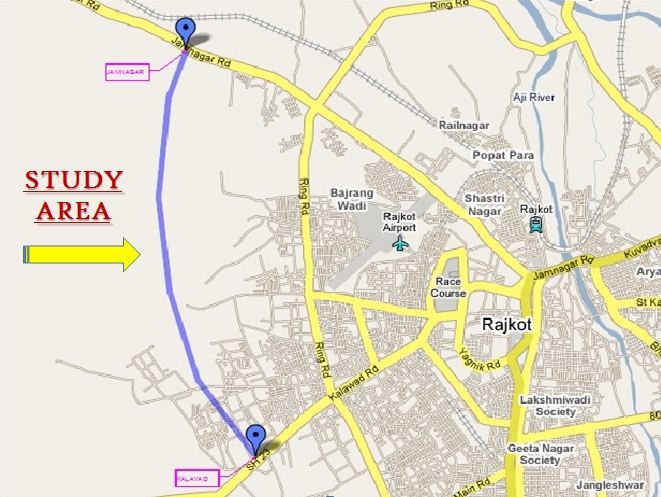
Fig 2.1 Location of Ring Road No-2
- ALIGNMENT FIXING
For any road the alignment is important part of construction of road and economical of the road. The alignment of a road should be so selected that it can handle the traffic most efficiently. A direct alignment usually results in overall economy (construction, maintenance and operation). Economy in initial cost alone is not always the optimal solution, economy in total transportation cost should be aimed at. The alignment should pass along the edge of the properties as far as possible rather than passing through properties.
Rajkot Urban Development Authority (RUDA) has fixed the alignment of Ring Road NO. 2 as economical design, less cost of construction, obstructions, irregularities of the ground and many other aspects. The location of proposed Ring Road is near village GhanteshwarGamtal on Jamnagar State Highway and the road is touching Kalavad Road near Cosmoplex Cinema. Topographical surveys including alignment plans, longitudinal sections, minimum essential cross sections and determining the vertical and horizontal alignment of the ring road establish horizontal control points, bench marks and reference locations with respect to GTS B.M as required for the preliminary engineering and environmental investigations, strip maps and alignment plans showing all details have been prepared. Identification for the locations of river bridges, minor cross drainage structures, interchanges and road over bridges based on the traffic loading is being surveyed by Rajkot Urban Development Authority (RUDA).
The alignment survey, including the transfer of alignment on the ground, exploring different alternative according the topographical features and finalization of the alignment had been completed. The final alignment has been stacked with a 20 cm dia X 60 cm long cement concrete pillars at every 1 km. Intermediate stone survey flats 10 cm X 10 cm X 40 cm long shall be staked at 100 m intervals. The exact location of concrete pillars at every 500 mts.
Similarly, the Metoda Industrial Estate has come up and many are in progress. This has resulted in heavy traffic from inside and outside the city. Further a huge amount of land has become made useful for non-agricultural purposes like residential, educational and other purposes.
So there is requirement of another Ring Road around Ring Road No. 1 and this road is called Ring Road No. 2.
This Ring Road No. 2 will greatly help outside people, particularly from Jamnagar to have easy access to Kalavad Road. People can have access to this road without entering into the main city.
Rajkot Urban Development Authority (RUDA) has decided to construct Second Outer Ring Road in the periphery of Rajkot City. The total length of the road is 8.956 Km. RUDA has prepared the revised development plan for the city , considering its future needs.
- SALIENT FEATURES OF RING ROAD NO. 2
There are many features of the Ring Road No. 2 , some of them are shown below:
- It is around 9 Km in length.
- Configuration of road – Four lane divided.
- Right of way – 45.00 mtrs.
- Bridges – 3 Major and 2 Minor.
- Two main junction on Jamnagar State Highway and Kalavad State Highway
- As this road will pass through the RaiyaRoad , so one junction will be provided there also.
- lane wide pipe culverts – 15 Nos.
The location and length of the major bridges are shown in table 2.1
Table 2.1 The location and length of the major bridges
| Sr. No. | Type of Bridge | Location (Km) | Length(m) |
| 1 | Major | 0.250 | 90 |
| 2 | Major | 2.500 | 190 |
| 3 | Major | 4.050 | 111.60 |
- DATA COLLECTION AND ANALYSIS
For the easy of motorists on the rod, there are two curves considerable for their primary comfort.
- Horizontal curve
- Vertical curve
A horizontal curve is considered while changing the alignment or direction of a road. Horizontal curve are circular curves or circular arcs. There are many types of horizontal curve as Simple Curve, Compound Curve, Reverse Curve and Transition or Spiral Curve.
While considering a change in the slope of the road, a vertical curve can be used but the slope might be or might not be symmetrical. Vertical curves are parabolic. There are two types of vertical curve as Sag Curve and Crest or Summit Curve.
In this project we have decided to design of all the horizontal curves of the Ring Road No. 2 as per the IRC (Indian Roads Congress) IRC – 38 – 1988 rules and regulations.
In a road alignment changes in direction are often necessary due to restrictions imposed by topography, environment and ecological qualities of areas, presence of monuments, place of worship, sites of structures and other considerations such as available land. For convenient, safe and pleasant travel on the road, changes in directions have to be accomplished by introducing horizontal and transition curves in the alignment. There is however some reluctance on the part of field engineers to build transition curves as it involves tedious and laborious calculation.
The main parameters which are important for all types of curve are as follows.
3.1 TERRAIN CLASSIFICATION
Choice of design speed depends on the function of the road as also terrain conditions. Terrain is classified by the general slope of the country across the highway alignment, for which the criteria given in Table 1.1 should be followed. While classifying a terrain short isolated stretches of varying should not be taken into consideration. It is the basic parameter which determines all other geometric design features.
Table 3.1 Terrain Classification
| Sr. No. | Terrain Classification | Per cent cross slope of the country |
| 1 | Plain |
|
| 2 | Rolling | 10 – 25 |
| 3 | Mountainous | 25 – 60 |
| 4 | Steep | Greater than 60 |
As per the per cent cross slope of our country is ranges between 0 – 10 , so the Terrain of our country is Plain Terrain. The other criteria’s of the horizontal curve will be taken as per the Plain terrain.
3.2 ROAD CLASSIFICATION
IRC (Indian Roads Congress) classifies roads in 5 categories :
- Village Roads (VR) : These streets interface the rustic towns with each other and to the closest larger amount street or to the closest town focus. They have bring down plan details and a significant number of them are not by any means medaled.
- State Highway (SH): These are the streets which associate the state cash-flow to different states and to the area central command in the state. They have outline details like those of the National Highway since they convey enough movement.
- Other District Road (ODR): These streets interface the rustic regions town focuses to the real area streets of higher significance. They give the offices to the transportation of the crude materials or the merchandise principally of farming items from the rustic towns to the higher markets and the other way around.
- National Highways (NH): These are the major blood vessel streets traversing in the length and broadness of the nation and associates the Capital to the different State Capitals of the nation or with the neighboring nations. They likewise interface the well known tourism spots of the nation. They are numbered and composed as NH-1, NH-2 and so forth.
- Major District Road (MDR): These streets interface the region home office to the fundamental town focuses in the area, and to the home office of the other locale too. They additionally interface these significant town focuses to the next state roadway of significance. They have bring down outline details when contrasted with the NH and SH
Propose Ring Road No. 2 comes under the category of the Major District Road. Further the design radius and the design speed will be taken according to the Major District Road and Plain Terrain.
3.3 DESIGN SPEEDS
It is preferred that the design speed should be uniform along the highway. An unavoidable change might be noticed with change in terrain. Due to this, the design speed should be changed gradually. This can be done by adding sections suggesting increase or decrease in speed which provides uses a condition to change degree and speed.
Table 3.2 Design Speeds of Road
| Sr. No. | Road Classification | Design Speeds (Km/hr) | ||||||||||
| Plain Terrain | Rolling Terrain | Mountainous Terrain | Steep Terrain | |||||||||
| Ruling Design Speed | Mini. Design Speed | Ruling Design Speed | Mini. Design Speed | Ruling Design Speed | Mini. Design Speed | Ruling Design Speed | Mini. Design Speed | |||||
| 1 | National and State Highway | 100 | 80 | 80 | 65 | 50 | 40 | 40 | 30 | |||
| 2 | Major District Road | 80 | 65 | 65 | 50 | 40 | 30 | 30 | 20 | |||
| 3 | Other District Road | 65 | 50 | 50 | 40 | 30 | 25 | 25 | 20 | |||
| 4 | Village Road | 50 | 40 | 40 | 35 | 25 | 20 | 25 | 20 | |||
Ring Road No. 2 will be as Ruling Design Speed as 80 Km/hr and Minimum Design Speed as 65 Km/hr. In our project as per the guidance we have selected 65 Km/hr as Design speed. Further the design radius will be taken as per this design speed.
3.4 SUPERELEVATION (e)
When a vehicle travels around a curve of constant radius at constant speed, it exerts radially an outward force known as the “Centrifugal Force”
Superelevation is tilting the roadway to help offset centrifugal forces developed as the vehicle goes around a curve along with friction they are what keeps a vehicle from going off the road. The vertical distance between the heights of inner and outer edges of highway pavement on the curve is called SuperElevation.
P=W×v2gR, P=W×v2127R
“where”, P = Centrifugal force in Kg,
W = Weight of the vehicle in Kg,
v = Speed of Vehicle in 1ST equation in m/s and in 2ND equation in Km/hr,
g = acceleration due to gravity (constant) = 9.81 m/s2,
R = Radius of Curve in m.
It acts horizontally at the centre of gravity of the vehicle and its load. The forces on the vehicle are
- Centrifugal force acting radially outwards,
- The weight of the vehicle acting vertically downwards,
- The upward reaction of the road on the vehicle.
For equilibrium the centrifugal force must be counteracted. This force can be counteracted by three methods as follows:
- lateral friction developed between the tyre and the road surface alone,
- inward tilt of the road surface known as super elevation alone,
- partially by friction and partially by super elevation
When the surface is level laterally, ”i.e.” when there is no camber or superelevation, the centrifugal force has to be resisted by the friction between the tyres and the road surface. There will be unequal distribution of pressure on the wheels, the outer wheel taking more as shown in fig.(1). When superelevation is exactly equal to the centrifugal force, there will be equal distribution of pressure between the wheels, as shown in fig.(2) and no friction would be developed between tyres and the road surface. When the centrifugal force is counteracted partially by superelevation and partially by friction, the pressure on the wheel will be intermediate between those mentioned above.
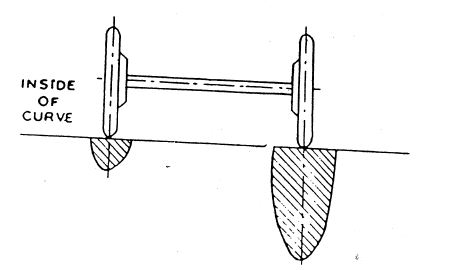
Fig.3.1 Pressure on wheel when no superelevation is provided.
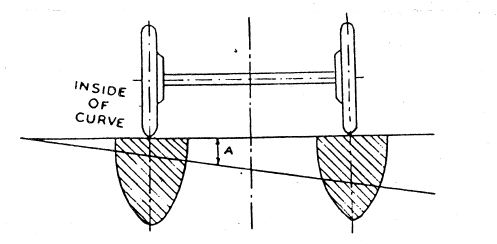
Fig.3.2 Pressure on wheel when superelevation is provided.
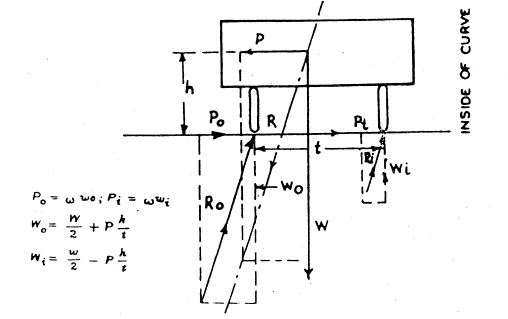
Fig.3.3 Curve with No Superelevation
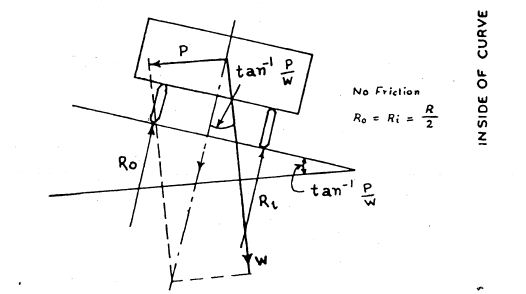
Fig.3.4 Curve where the centrifugal force is fully counteracted by Superelevation
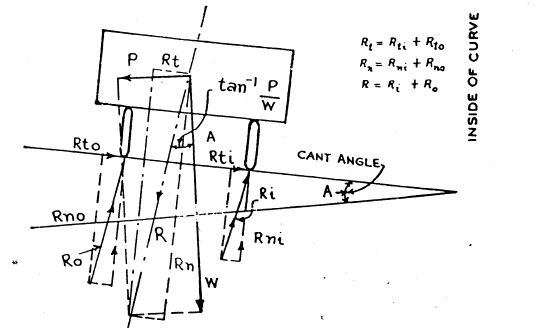
Fig.3.5 Curve where centrifugal force is counteracted partly by friction and partly by superelevation.
It can be mathematically shown that the centrifugal ratio
B=PW=V2127R=tanA+∅=tanA+tan∅=e+f
From equation (2) and (3) it is seen that the factors to be taken into account in determining the speed of the curve are the allowable friction, the maximum allowable superelevation and the maximum permissible centrifugal ratio.
e=V2225R
“where” e = superelevation,
V = Design Speed, Km/hr,
R = Curve Radius, m
In India, for a long time to come, the slow-moving bullock carts would continue to use the roads. Often these carry light bulky commodities with its centre of gravity very high. It has been observed that a transverse slope of more than 7 per cent is inconvenient to the slow- moving vehicle. If superelevation exceeds 7 percent for plain and rolling terrain then 7 percebt is taken as design superelevation. In hilly areas, since such carts are not prevalent and the number of curves are more, a higher superelevation is permitted. A value of 10 per cent is recommanded for design in hilly areas not effected by snow, if it is affected by snow maximum 7 per cent is allowed. So that maximum allowable superelevation on curves is taken as 7 per cent.
- FRICTION BETWEEN TYRE AND ROAD SURFACE
The value of the coefficient of lateral friction is a function of speed of the vehicle, the type and condition of the road surface, the condition of the tyres, the weather conditions at the time of contact between tyre and the road, the temperature of the road, etc. tests indicate that the coefficient of lateral friction is as low as 0.2 when the pavement is covered with mud. Allowing a factor of safety of 1.33, the safe value of friction for design of curves is taken as 0.15.
- MINIMUM CURVE RADIUS
One of the most important boundary values which should be taken into account while designing horizontal alignment is minimum curve radius. Curves combined the different directions of the alignment is critical section of the road.
The minimum curve radius is governed by two factors: 1) the design speed and allowable super elevation and friction, 2) the minimum turning radius of design vehicle.
The maximum allowable values of super elevation and friction, “i.e.” e=0.07 to 0.1, and f=0.15, limit the centrifugal ratio to 0.22 to 0.25. Therefore,
V2127R
for the sharpest permissible curvature equals to 0.22 to 0.25. Therefore absolute minimum radius for any design speed equals to
V2(0.22 to 0.25)×127=0.0358V2 to 0.0315V2
.
For V= 65 Km/hr, Minimum Curve Radius is equals to 151.25m to 133.08.
Table 3.3 Minimum Curve Radius of horizontal Curve.
| Design Speed (Km/hr) | Plain & Rolling Terrain (meters) | Mountainous and Steep Terrain (meters) | |
| Snow Bound Area | Non snow Bound Area | ||
| 20 | 15* | 15* | 14* |
| 25 | 23* | 23* | 20* |
| 30 | 33 | 33 | 30 |
| 35 | 45 | 45 | 40 |
| 40 | 60 | 60 | 50 |
| 50 | 90 | 90 | 80 |
| 65 | 155 | Speeds not applicable | |
| 80 | 230 | ||
| 100 | 360 | ||
*where trucks also ply on a road, a minimum 26m radius should be provided to accommodate them.
Table 3.3 shows the minimum radius of horizontal curves for different Terrain Conditions for Minimum Design Speeds.
Minimum turning radius of a vehicle is also important factor. Turning circles of public service vehicle have swept diameters no greater than 19.812m for vehicles not exceeding 8.23m in length; 21.641m for vehicle exceeding 8.23m but not exceeding 10.973m in length; and 23.774m for vehicles longer than 10.973m. For commercial vehicles it ranges 9 to 26m diameter.
For designing of horizontal curves of Ring Road No. 2 Design Radius is taken as 160m.
- WIDENING OF PAVEMENTS ON CURVES
When vehicles negotiate a curve, the rear wheels generally do not follow the same track as that of the front wheels. When the curve is not superelevated the rear wheels track inside front wheels. On superelevated curves, the relative position of the wheel tracks depends upon the speed and consequently upon the amount of friction developed for equilibrium. The greater the speed the rear wheels assume a position farther out. So with excessive speeds the rear wheels may track outside the front wheels. Therefore widening of the pavement is necessary to provide for this change in the overall track width required for travel at various speeds. There are two types of amount of widening should be provided as follows:
- Mechanical Widening: Fig.(5) shows diagrammatically the extra width required when a vehicle negotiates a curve. If “ l ” is the wheel base and R the radius of the curve, the extra width occupied by the vehicle, ”i.e.” AB in fig.(5) is equal to
l22Rfor large of R compared to l. This extra width of pavement required for the vehicle to traverse the curve is called Mechanical Widening.
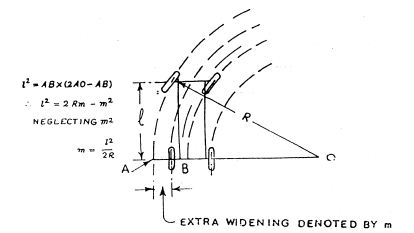
Fig 3.6 Extra Widening On Curve.
- Psychological Widening: When vehicles pass or overtake on curve clearances more than those when they negotiate a straight line are required to provide for the curves traced by the overhand and psychological reasons. This is a function of the speed and is determined by the empirical formula
9.5×VR. This may be called the psychological widening, thus making provision for the mechanical widening required because of the rigid body of the vehicle and psychological widening, the formula for extra width on curves is given by :
We=l22R+V9.5R5
Horizontal curves on a single/two lanes roads has an extra width of carriageway which is given in table.7. The wide pavement area for multi lane roads are calculated by adding half width of pavement with two lanes of each lane.
Table 3.4 Widening of pavement at horizontal curve.
| Lane Distribution | Radius of Curve (m) | ||||
| Up to 20 | 21 to 40 | 41 to 60 | 61 to 100 | 101 to 300 | |
| Single Lane | 0.9 | 0.6 | 0.6 | Nil | Nil |
| Double Lane | 1.5 | 1.5 | 1.2 | 0.9 | 0.6 |
For Ring Road No. 2 amount of extra widening should be provided on horizontal curve is 0.6m.
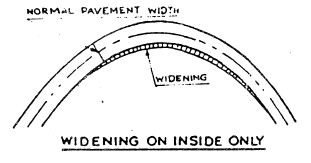
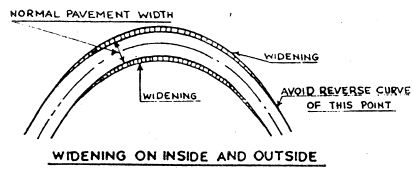
Fig. 3.7 Method of providing widening on curve.
- CAMBER
It is one of the geometric features of a pavement. It is defines as transverse slope with respect to the horizon. Camber is considered to be a very important safety factor. Cross slope is provided for drainage gradientso that water will run off the surface to a drainage system. The cross section of payment is highest in center and drains on both of its sides while considering straight sections. The cross section is left blank to reduce steering effort and lateral force in horizontal curves. Fig.(6) shows the camber on the road pavement on both side. As per IRC-38-1988 allowable camber for various type of pavement surface is given below.
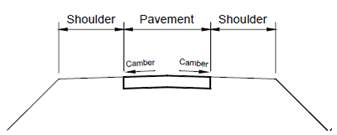
Fig.3.8Camber On Road Pavement
Table 3.5 Camber/Cross Fall values for different road surface types
| Sr. No. | Surface Type | Camber/Cross Fall |
| 1 | High type bituminous surfacing Or Cement Concrete | 1.7 – 2.0 per cent |
| 2 | Thin bituminous surfacing | 2.0 – 2.5 per cent |
| 3 | Water bound macadam, gravel | 2.5 – 3.0 per cent |
| 4 | Earth | 3.0 – 4.0 per cent |
- DESIGN OF HORIZONTAL CURVE
- INTRODUCTION
There are mainly three types of horizontal curves:
- Circular Curve
- Transition Curve
- Circular with transition curve
4.2 DESIGN OF CIRCULAR CURVE
Circular curves are the most common type of horizontal curve used to connect intersecting tangent (or straight) sections of highways. Their motivation is to divert a client’s vehicle going along one of the straights securely and serenely through an avoidance edge θ or Δ to empower it to proceed with its trip along the other straight. Roundabout bends, bends of steady range. Progress bends, bends of fluctuating range. Design of horizontal curve with Circular curve possesses following parameters.
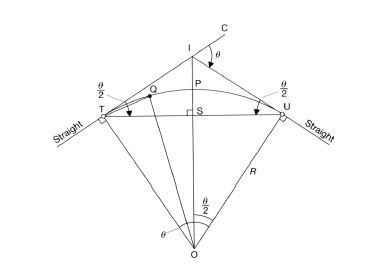
Fig.4.1 Design Parameters of Circular Curve
- Length of tangent (TI): It is the distance from T to I. From triangle IUO,
R×tanθ2=IUIO=IUR Hence, IU=IT=R×tanθ2
- External Distance (IP): It is the distance from I to the midpoint P of the curve. From same triangle IUO
cosθ2=RIOIO=Rcosθ2=Rsecθ2
But, PI=OI-OP=OI-R=R(1-secθ2)
- Middle Ordinate (PS): distance between midpoints ofcurve P and chord S. From triangle TSO,
OS=OTcosθ2=Rcosθ2But, PS=OP-OS=R-Rcosθ2=R(1-cosθ2)
- Length of long chord (TS): It is the distance from T to S. From triangle USO,
US=Rsinθ2But, TU=US+TS, and US=TS,TU=2Rsinθ2
- Length of curve (Lc): Length of curve from T to U is the road distance between ends of the simple curve. For a curve of radius R,
Lc=Rθ metres
For a D° degree curve:
Lc=100θD metres
- Degree of curve (θ): The degree of curve is the central angle subtended by an arc or chord of one station.
- Chainage at U:Chainage at U is the sum of chainage at T and the length of curve Lc.
Chainage at U=Chainage at T+Length of curve Lc
Steps of Designing Circular Curve for deflection angle of θ are as follows:
- Find the length of tangent TI.
- Find the external distance IP.
- Find the middle ordinate PS.
- Find the length of long chord TS.
- Find the length of curveLc.
- Find the chainage at T.
- Find the chainage at U.
In our project in the Ring Road No. 2 there are 7 horizontal curves. Out of 7 curves 2 curves are designed as Circular with Transition Curve and other 5 curves are designed as Circular Curve. We have prepared the Excel Sheet of both Circular curve and Circular with Transition Curve.The common part of the all the curve is the input data except from the deviation angle θ of different curves. The common input data for all curves are as follows:
- Terrain Classification
- Road Classification
- Design Speed
- Minimum Radius of Horizontal Curve
- Road Surface Type
- Camber
- Superelevation
- Lane Distribution
- Widening on Curve
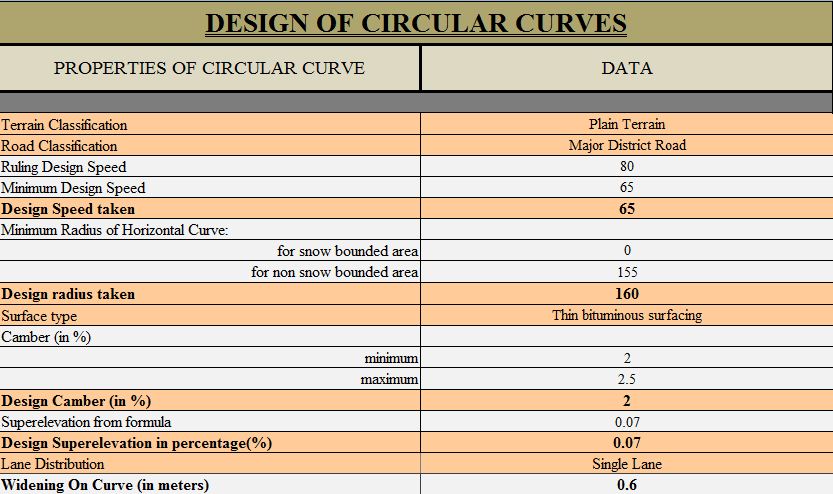
Fig. 4.2 Common Data for all Curves from Excel Sheet.
In Ring Road No. 2 there are 7 horizontal curves which has deviation angle as follows:
- 22°57’9”=22.9525°
- 40°13’33”=40.2258°
- 9°9’6”=9.15°
- 18°23’52”=18.398°
- 45°27’21”=45.4558°
- 10°56’15”=10.9375°
- 16°16’20”=16.2722°
For deviation angle 40.2258° and 45.4558° design of horizontal curve is Circular with Transition curve and all other except horizontal curves are design as Circular Curve. The design of circular with transition will be done in the 3.11 and circular curve will design in this section.
Design of Circular curve and its implementation drawing on site is shown below. Its implementation is done by taking offset from actual boundary line and curve line.
Horizontal Curve – 1: Circular Curve

Fig.4.3 Design of Horizontal Curve 1- Circular Curve.
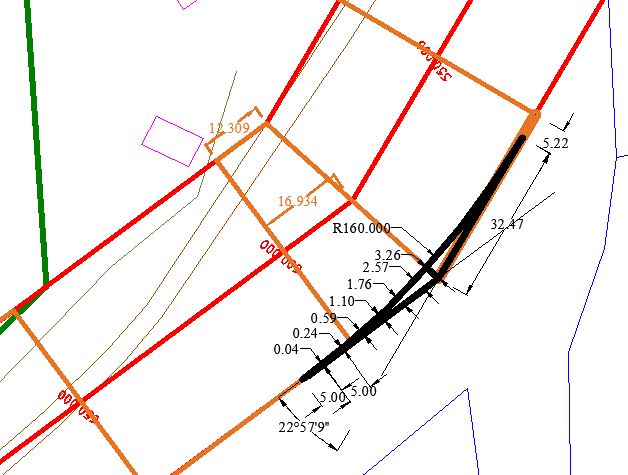
Fig. 4.4 Offset of curve from boundary of road for Curve 1:Circular Curve
Horizontal Curve –3: Circular Curve

Fig.4.5 Design of Horizontal Curve-3:Circular Curve.
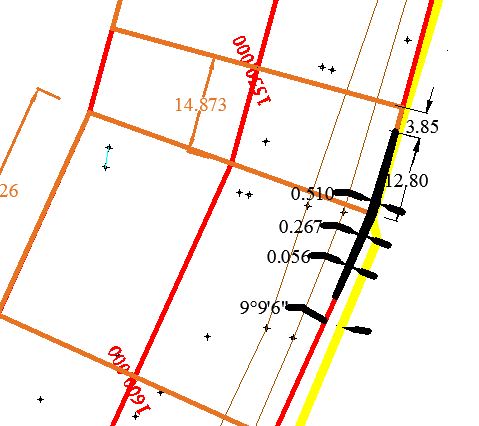
Fig. 4.6 Offset of curve from boundary of road for Horizontal Curve-3:Circular Curve.
Horizontal Curve–4:Circular Curve

Fig.4.7 Design of Horizontal Curve-4:Circular Curve.
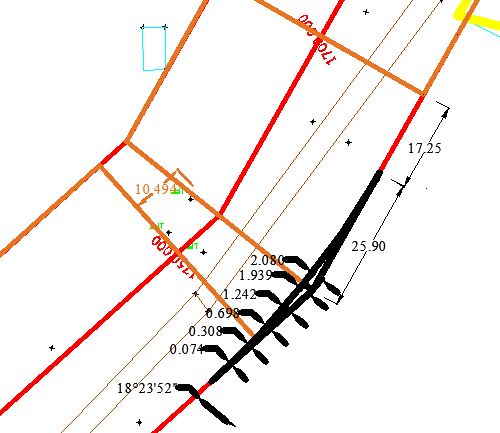
Fig. 4.8 Offset of curve from boundary of road for Horizontal Curve-4:Circular Curve
Horizontal Curve–6:Circular Curve

Fig.4.9 Design of Horizontal Curve-6:Circular Curve.
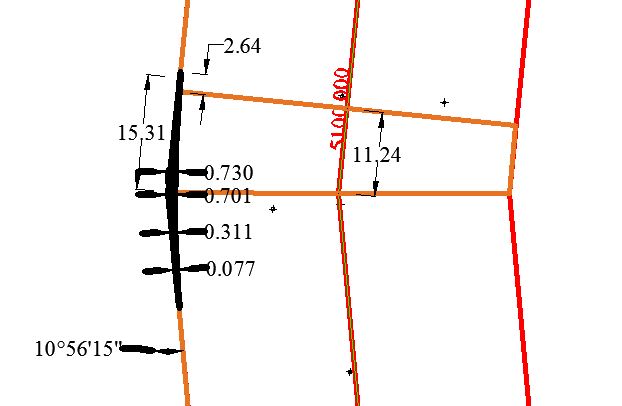
Fig. 4.10 Offset of curve from boundary of road for Horizontal Curve-6:Circular Curve.
Horizontal Curve–7:Circular Curve

Fig.4.11 Design of Horizontal Curve-7:Circular Curve.
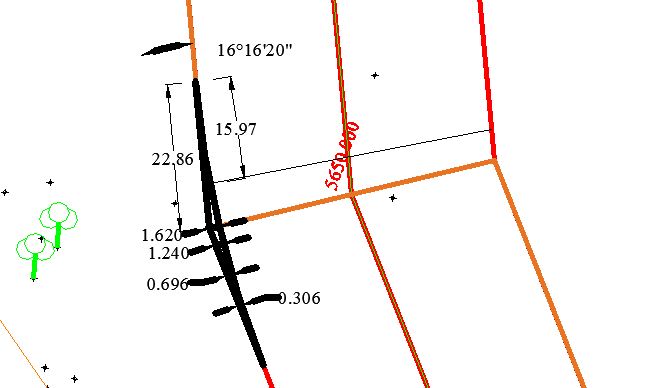
Fig. 4.12 Offset of curve from boundary of road for Horizontal Curve-7:Circular Curve
4.3 DESIGN OF CIRCULAR WITH TRANSITION CURVE
In designing a road alignment, the angle of deviation in the alignment is known. The classification of the highway in which the curve is to be located is also known. If the terrain is one where there are no features which will restrict, the alignment it is desirable that the maximum possible radius be selected. If two transitions of equal lengths are adopted on both sides of the central circular arc, the angle consumed by the circular curve is equal to
∆-2×θ.
The features of circular with transition curve are as follows:
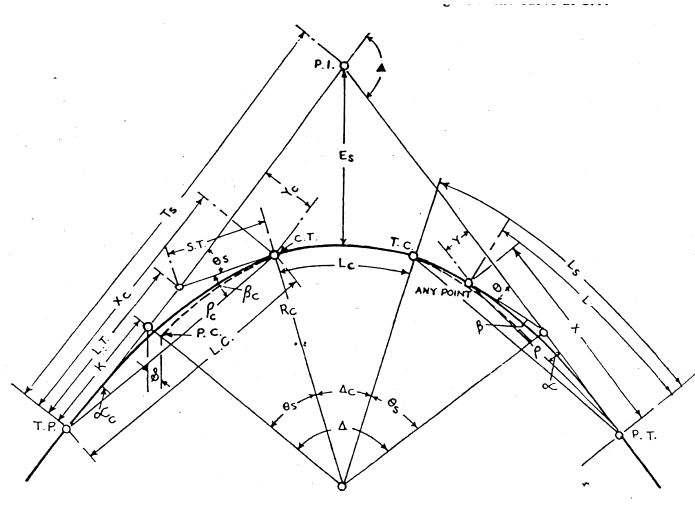
Fig.4.13 Design Parameters of Circular With Transition Curve.
Table 4.1 Definitions of all parameters of Circular with Transition Curve
| TERM | DEFINITION |
| P.I. | The point of intersection of two straights connected by curve |
| Es | The shortest distance from the apex of the curve. |
| Rc | The minimum radius of the centre line of the curve. |
| L.C. | The length of polar ray from beginning to end of transition. |
| L.T. | The distance along the straight from T.P.to the intersection of tangent to the curve at C.T. |
| S.T. | The length of tangent to curve at C.T. from C.T. to the straight. |
| Ts | The length of straight between P.I. and tangent of the curve. |
| Δ | The external angle at intersection between tangents at end of curve. |
| Ls | The full length of transition curve connecting a straight length of a road with curve which may be circular or transitional. |
| C.T. and T.C. | The nearer and farther points on the curve where the transition changes to circular arc. |
| K | The distance along the straight from T.P. to P.C. |
| L | The length of transition from T.P. to any point on transition |
| Lc | The lenth of circular arc from C.T. to T.C. |
| P.C. | The point on the circular curve produced nearest to the straight. |
| X and Y | Co-ordinates to any points on transition with T.P. as origin, the straight T.P.-P.T. as X axis and Y axis at right angles to T.P.-P.I. at T.P. |
| Α | Plar deflection angle at T.P. from straight to any point on transition |
| Αc | Polar deflection angle between the long tangent and long chord. |
| Β | The angle between polar ray to any point on transition and tangent to the curve at that point. |
| Βc | The angle between polar ray to C.T. and tangent to the curve at that point. |
| Θs | The tangent deflection angle for end of transition curve. |
| Δc | Deviation angle of the circular part of a curve with a transition at either end. |
- Minimum length of Transition (Ls): It is based on consideration of driver comfort and shifts in the lateral position of vehicles. Length of transition should be the greater of the two values derived from considerations of
- Rate of change of centrifugal acceleration
- Rate of change of superelevation
The length of transition curve is given by:
Ls=0.0215×V3CR
“where”,
R= radius of circular curve in metres,
Ls= length of transition in metres,
C=
8075+V
,(subject to a maximum of 0.8 and minimum of 0.5)
V= speed in Km/hr,
Table 9 IS-38-1988 gives the minimum transition lengths, Ls for different speeds and radii. Having selected the radius, suitable length for the transitions are chosen from Table 9 IS-98-1988.
If two transitions of equal lengths are adopted on both sides of the central circular arc, the angle consumed by the circular curve is equal to
(∆-2×θs)
. The functions of spiral for various values of tangent deviation angle in steps of 0.1 degree up to 50° and 70° and in steps of one degree from 70° to 135° are given in Table 12 (Appendix 5) IS-38-1988. The functions given are for unit length of the transition. Having known the θs and the length of the transition the values of the various functions are easily got by multiplying the appropriate values given in Table 11 (Appendix 3) with the length of the transition.
Steps of Designing Circular with transition Curve for deflection angle of Δ are as follows:
- Check if there is restriction on the field which can restrict the curve within the limits.
- Take design speed and design radius.
- Calculate the minimum transition length required for curve Ls.
- Calculate θs in degrees from the following formula:
θs=Ls2×Reradians=Ls2×Re×180πdegrees
- Calculate the Shift for unit length of transition curve from Table 12 (Appendix 5) and calculate Shift for length of transition curve as follows:
Shift for length of transition curve(s)=Shift for unit length ×Ls
- Calculate K for the unit length of transition curve from Table 12 (Appendix 5) and calculate K for length of transition curve as follows:
K for length of transition curve =K for unit length×Ls
- Calculate Ts from the following formula:
Ts=(Re+s)×tan∆2×K
- Calculate Es from the following formula:
Es=(Re+s)cos∆2-Re
- Calculate L.T. for unit length of transition curve from Table 12 (Appendix 5) and calculate L.T.for length of transition curve as follows:
L.T.for length of transition curve=L.T.for unit length ×Ls
- Calculate S.T. for unit length of transition curve from Table 12 (Appendix 5) and calculate S.T. for length of transition curve as follows:
S.T.for length of transition curve=S.T. for unit length ×Ls
- Calculate L.C. for unit length of transition curve from Table 12 (Appendix 5) and calculate L.C. for length of transition curve as follows:
L.C.for length of transition curve=L.C. for unit length ×Ls
From these all data of components of transition curve, now plot these data in AutoCad Software and get the transition curve.
In our project at the site of Ring Road No. 2 there is no restrictions in field. So the design radius is taken as 160m. Now the remaining two horizontal curves are designe as Circular with Transition Curve as follows
Horizontal Curve–2:Circular With Transition Curve
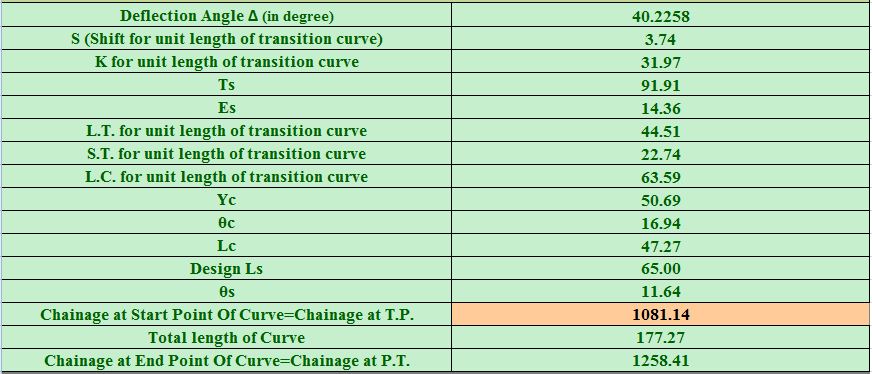
Fig.4.14 Design of Horizontal Curve-2: Circular With Transition Curve.
Horizontal Curve–2:Circular With Transition Curve
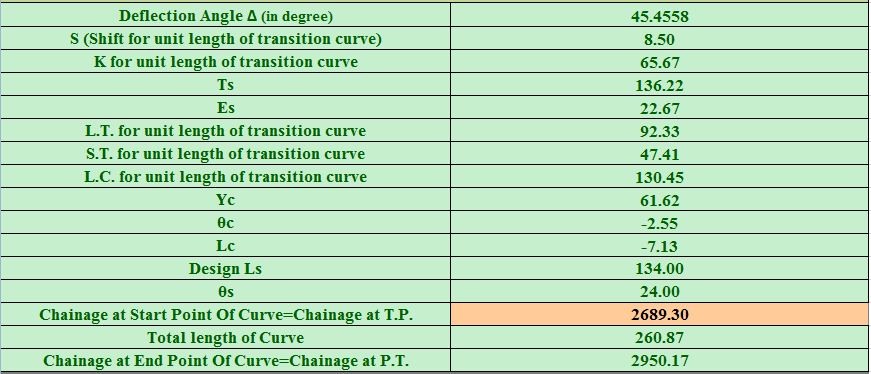
Fig.4.15 Design of Horizontal Curve-5: Circular With Transition Curve.
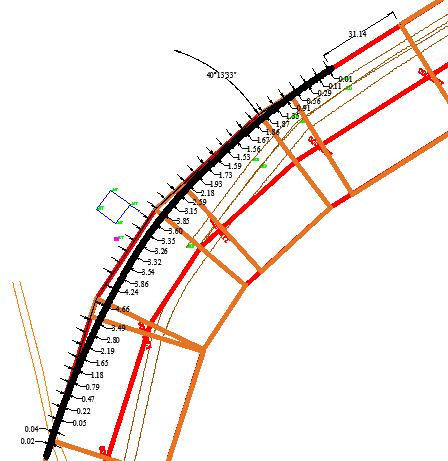
Fig. 4.16 Offset of curve from boundary of road for Horizontal Curve-2: Circular with transition Curve
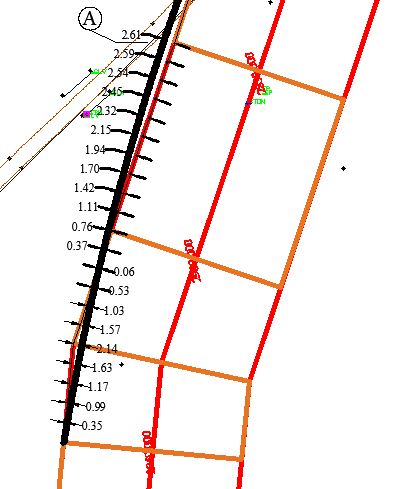
Fig. 4.17 Offset of curve from boundary of road for Horizontal Curve-5: Circular with transition Curve part -1
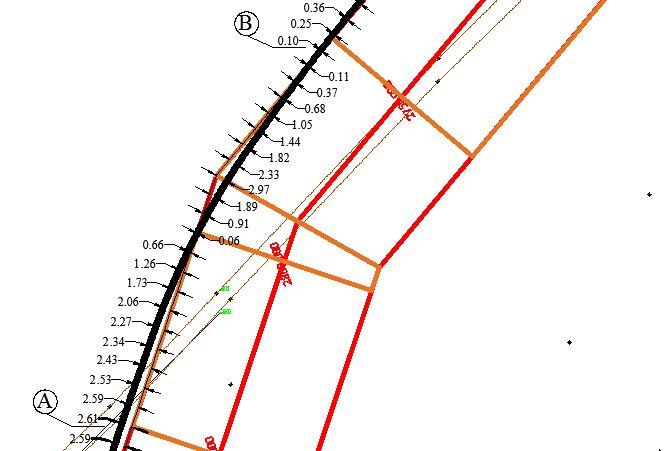
Fig. 4.18 Offset of curve from boundary of road for Horizontal Curve-5: Circular with transition Curve part -2
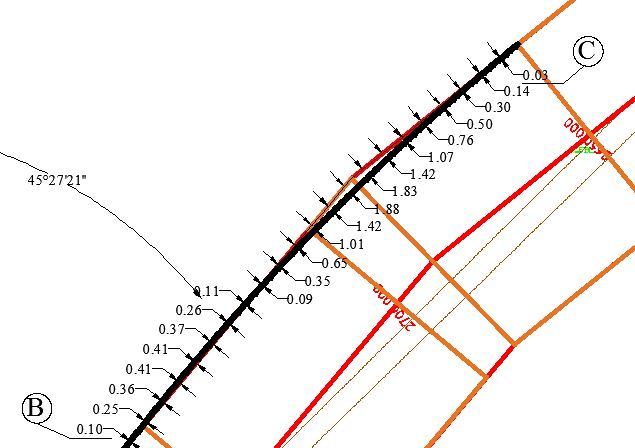
Fig. 4.19 Offset of curve from boundary of road for Horizontal Curve-5: Circular with transition Curve part -3
- PAVEMENT DESIGN
5.1 PAVEMENT
A durable material used for surface on a specific are which is intended to be used for walking or driving for people such as a walkway or driveway or road is called as pavement. Before pavements, granite stones and cobblestiones were very popular for this purpose.
Two types of pavements are :
- Flexible pavement
- Rigid pavement
5.2 Flexible pavement
A flexible payment has low flexural strength and are flexible with structure under load. The deformation of lower layers are reflected on top layers if flexible pavements are used.
A Flexible pavement consists of four components:
- surface course
- base course
- sub base course
- soil sub grade
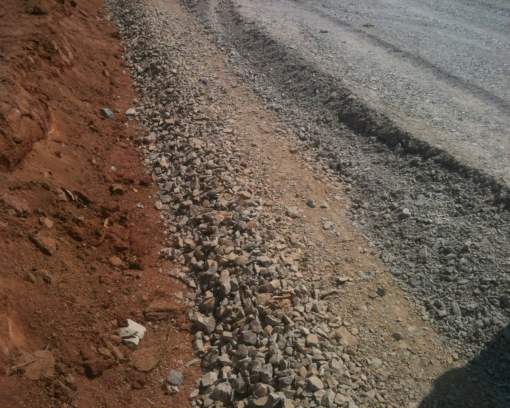
Fig 5.1: A view of Flexible pavement components
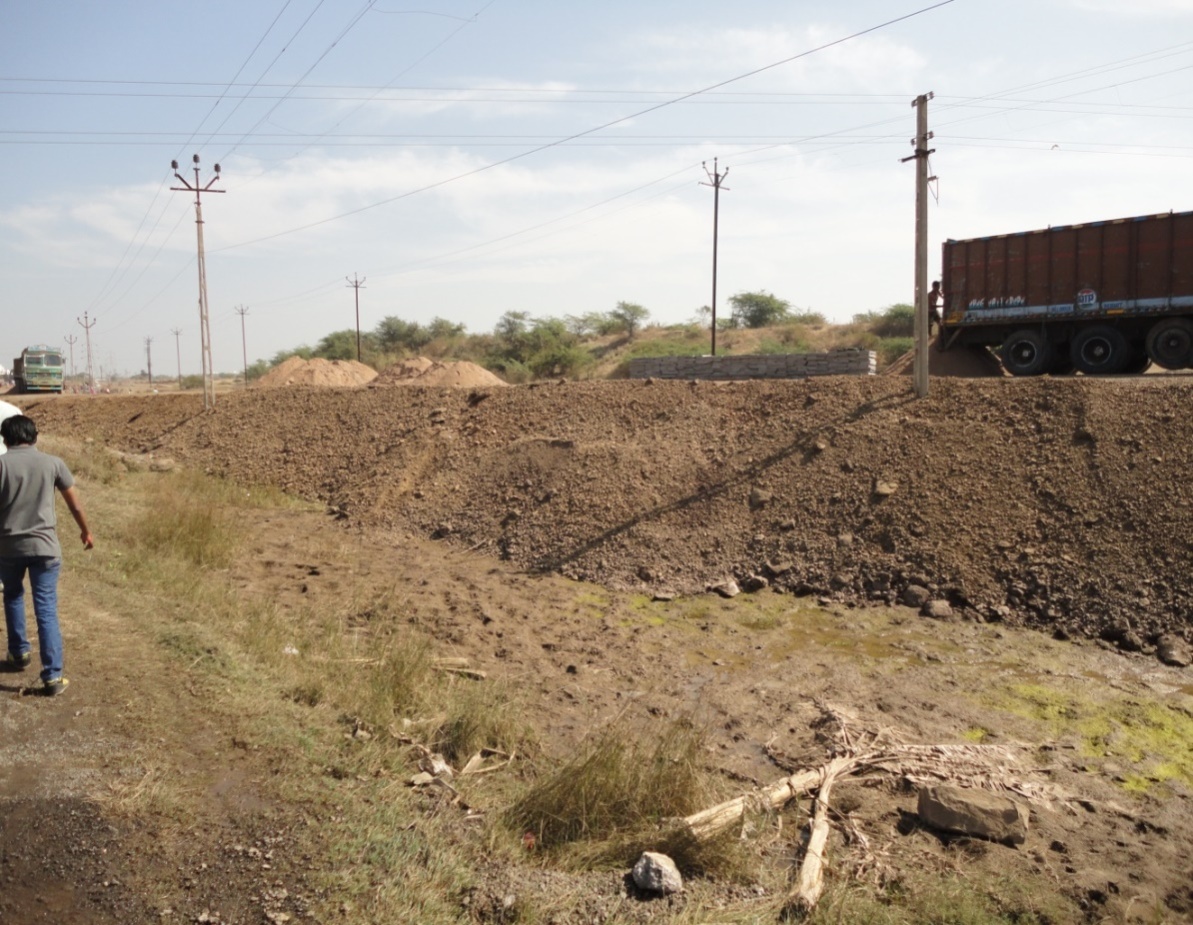
Fig 5.2: A view of Flexible pavement components at actual site
5.3 Rigid Pavement
A rigid pavement have a flexural strength. Unline flexible pavements, rigid pavements do not transfer stress from grain to the lower layers. Portland cement concrete-either plain, reinforced or prestressed concrete are used to prepare rigid pavements. Cement concrete takes upto 40 kg/cm2 of flexural stress
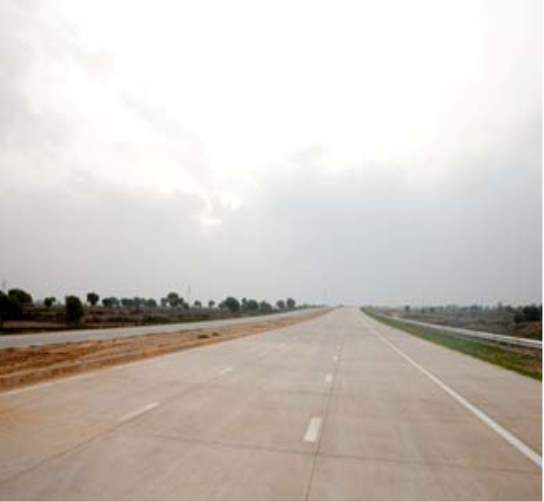
Fig 5.3: A view of rigid pavement
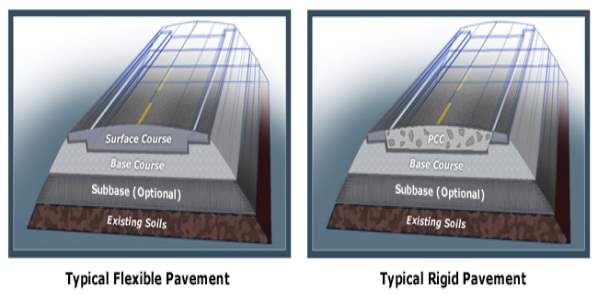
Fig 5.4: The difference between flexible and rigid pavement
5.4 Pavement Components Functions
- Soil Subgrade
- Wearing Course
- Sub-Base and Base Course
5.4.1 Soil Subgrade
The dirt subgrade is a layer of characteristic soil arranged to get the layers of asphalt materials set over it. The heap on the asphalt is at last gotten by the dirt subgrade for scattering to the earth mass. It is basic that at no time, the dirt subgrade is overemphasized. It implies that the weight transmitted on the highest point of the subgrade is inside as far as possible, not to cause intemperate pressure condition or to misshape the same past as far as possible. It is important to assess the quality properties of a dirt subgrade. This serves to architect to receive the appropriate estimations of the quality parameters for configuration reason and in the event that this supporting layer does not cum up to the desires, the same is dealt with or settled to suit the prerequisites.
5.4.2 Sub-base and Base Course
These layers are made of broken stones, bound or unbound total. A few times in sub-base course a layer of settled soil or chose granular soil is likewise utilized. In a few spots rocks stones or blocks are likewise utilized as sun-base or soling course. At the point when the subgrade comprises of the grained soils and when the asphalt conveys substantial wheel loads, there is an inclination for these rocks stones or blocks to enter into the wet soil, bringing about the arrangement of undulation and uneven asphalt surface in adaptable asphalt.
5.4.3 Wearing course
The motivation behind wearing course is to give a smooth riding surface that is thick. It opposes weight applied by tires and takes up wear and tear because of the movement. Wearing course additionally offers a water tight layer against the surface water penetration.
- LABORATORY TESTS
- Grain Size Analysis (GSA)
- Dry density and moisture content
- California Bearing Ratio Test (CBR Test)
6.1 Grain Size Analysis (GSA)
Purpose:
This test is performed to determine the percentage of different grain sizes contained within a soil. The mechanical or sieve analysis is performed to determine the distribution of the coarser, larger-sized particles, and the hydrometer method is used to determine the distribution of the finer particles.
Significance:
The distribution of different grain sizes affects the engineering properties of soil. Grain size analysis provides the grain size distribution, and it is required in classifying the soil.
Equipment:
Balance, Set of sieves, Cleaning brush, Sieve shaker, Mixer (blender), 152H Hydrometer, Sedimentation cylinder, Control cylinder, Thermometer, Beaker, Timing device.
Test Procedure:
Sieve Analysis:
- Write down the weight of each sieve as well as the bottom pan to be used in the analysis.
- Record the weight of the given dry soil sample.
- Make sure that all the sieves are clean, and assemble them in the ascending order of sieve numbers (#4 sieve at top and #200 sieve at bottom). Place the pan below #200 sieve. Carefully pour the soil sample into the top sieve and place the cap over it.
- Place the sieve stack in the mechanical shaker and shake for 10 minutes.
- Remove the stack from the shaker and carefully weigh and record the weight of each sieve with its retained soil. In addition, remember to weigh and record the weight of the bottom pan with its retained fine soil.
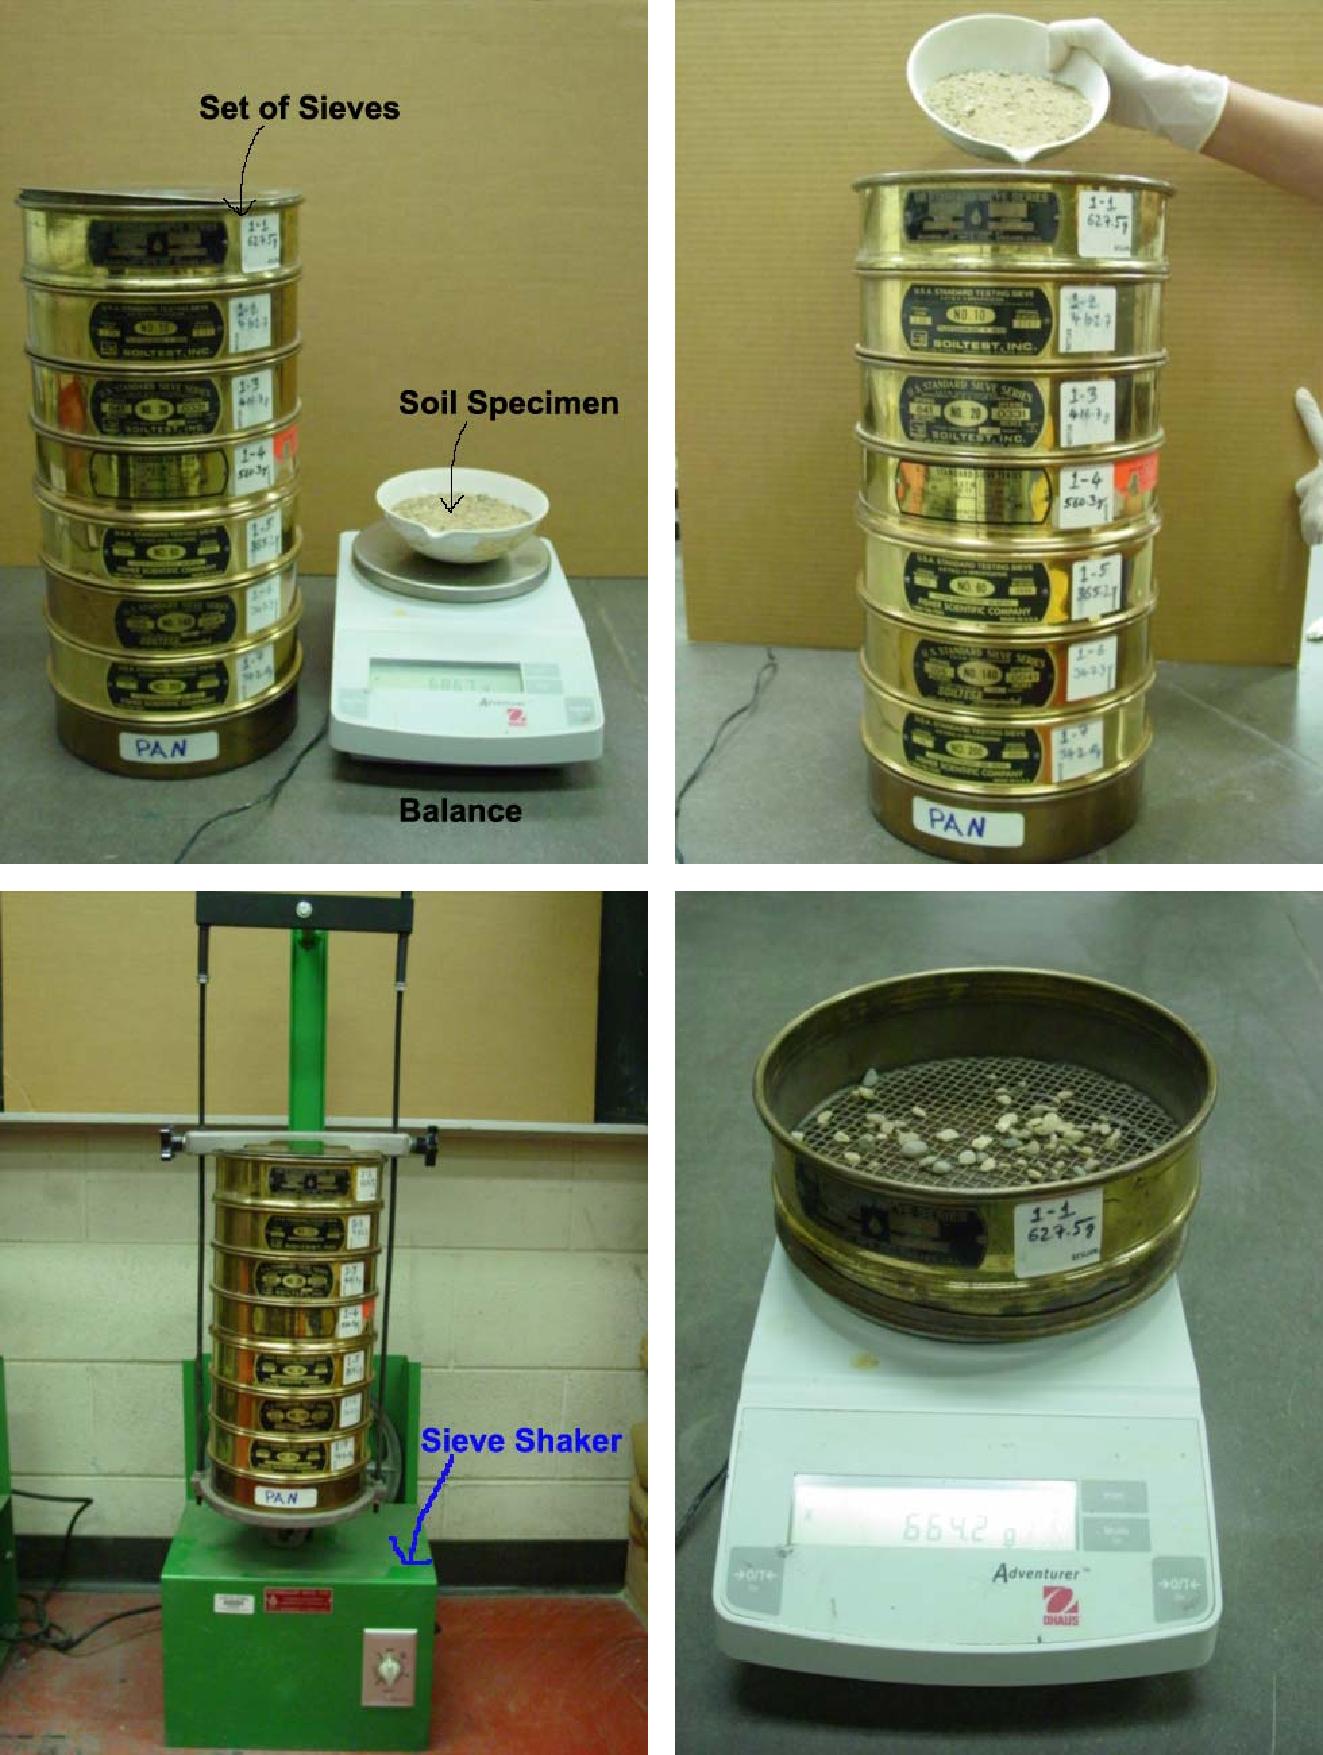
Fig 6.1 Equipment of Grain size analysis teat
Data Analysis:
Sieve Analysis:
- Obtain the mass of soil retained on each sieve by subtracting the weight of the empty sieve from the mass of the sieve + retained soil, and record this mass as the weight retained on the data sheet. The sum of these retained masses should be approximately equals the initial mass of the soil sample. A loss of more than two percent is unsatisfactory.
- Calculate the percent retained on each sieve by dividing the weight retained on each sieve by the original sample mass.
- Calculate the percent passing (or percent finer) by starting with 100 percent and subtracting the percent retained on each sieve as a cumulative procedure.
For example: Total mass = 500 g
Mass retained on No. 4 sieve = 9.7 g
Mass retained on No. 10 sieve = 39.5 g
For the No.4 sieve:
Quantity passing = Total mass – Mass retained = 500 – 9.7 = 490.3 g
The percent retained is calculated as;
- retained = Mass retained/Total mass
- (9.7/500) X 100 = 1.9 %
From this, the % passing = 100 – 1.9 = 98.1 %
For the No. 10 sieve:
Quantity passing = Mass arriving – Mass retained
- 490.3 – 39.5 = 450.8 g
- Retained = (39.5/500) X 100 = 7.9 %
- Passing = 100 – 1.9 – 7.9 = 90.2 %
(Alternatively, use % passing = % Arriving – % Retained For No. 10 sieve = 98.1 – 7.9 = 90.2 %)
- Make a semi logarithmic plot of grain size vs. percent finer.
- Compute Cc and Cu for the soil.
6.2 Dry density and moisture content
Purpose:
This laboratory test is performed to determine the relationship between the moisture content and the dry density of a soil for a specified compactive effort. The compactive effort is the amount of mechanical energy that is applied to the soil mass. Several different methods are used to compact soil in the field, and some examples include tamping, kneading, vibration, and static load compaction. This laboratory will employ the tamping or impact compaction method using the type of equipment and methodology developed by R. R. Proctor in 1933, therefore, the test is also known as the Proctor test.
Significance:
Mechanical compaction is one of the most common and cost effective means of stabilizing soils. An extremely important task of geotechnical engineers is the performance and analysis of field control tests to assure that compacted fills are meeting the prescribed design specifications. Design specifications usually state the required density (as a percentage of the “maximum” density measured in a standard laboratory test), and the water content. In general, most engineering properties, such as the strength, stiffness, resistance to shrinkage, and imperviousness of the soil, will improve by increasing the soil density.
The optimum water content is the water content that results in the greatest density for a specified compactive effort. Compacting at water contents higher than (wet of ) the optimum water content results in a relatively dispersed soil structure (parallel particle orientations) that is weaker, more ductile, less pervious, softer, more susceptible to shrinking, and less susceptible to swelling than soil compacted dry of optimum to the same density. The soil compacted lower than (dry of) the optimum water content typically results in a flocculated soil structure (random particle orientations) that has the opposite characteristics of the soil compacted wet of the optimum water content to the same density.
Equipment:
Molds, Manual rammer, Extruder, Balance, Drying oven, Mixing pan, Trowel, #4 sieve, Moisture cans, Graduated cylinder, Straight Edge.
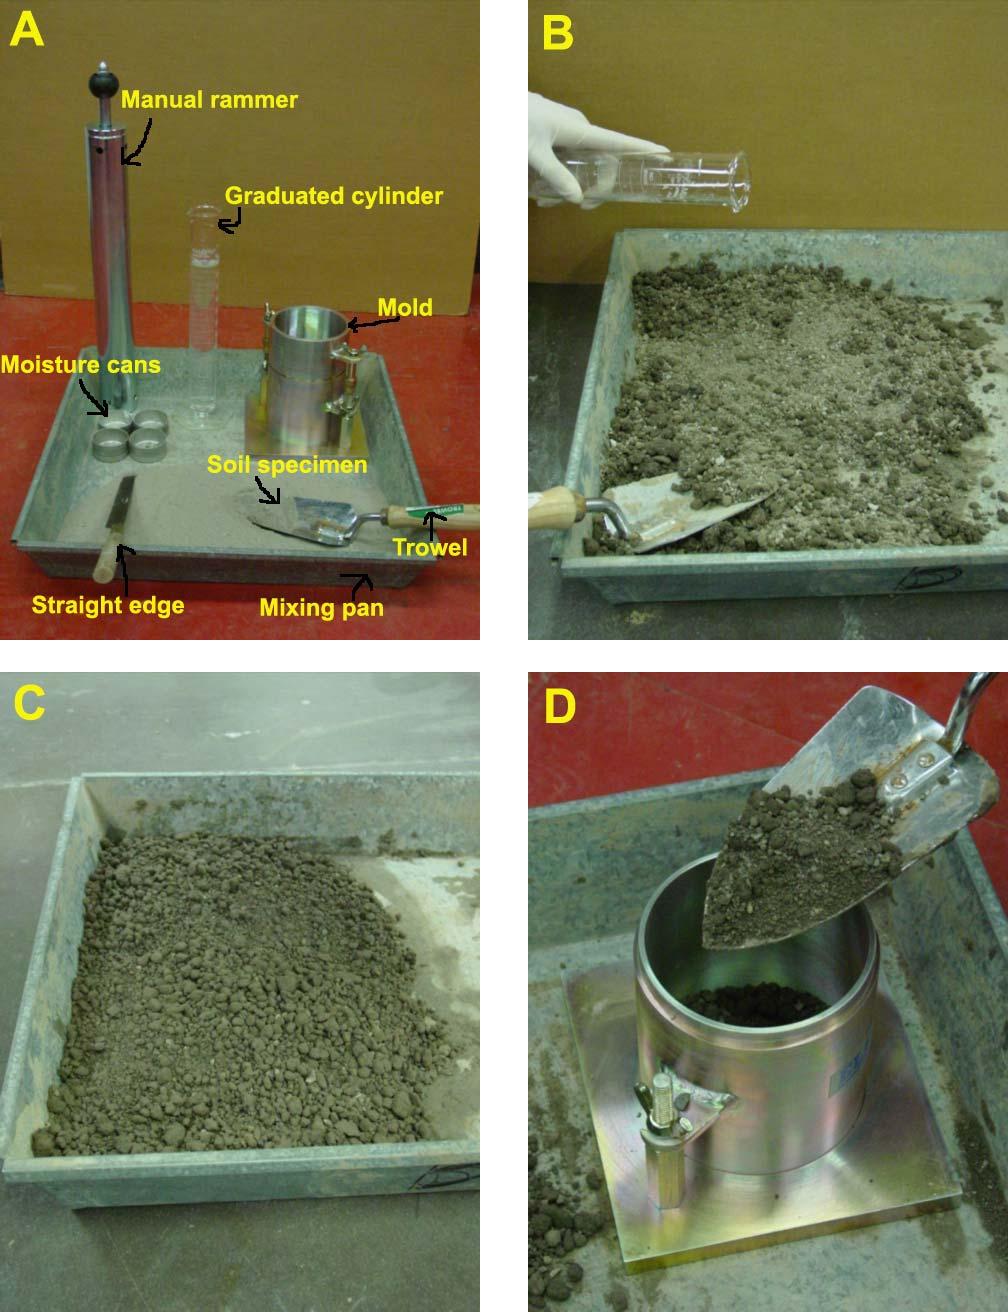 Fig 6.2 Equipment of Dry density and moisture content test
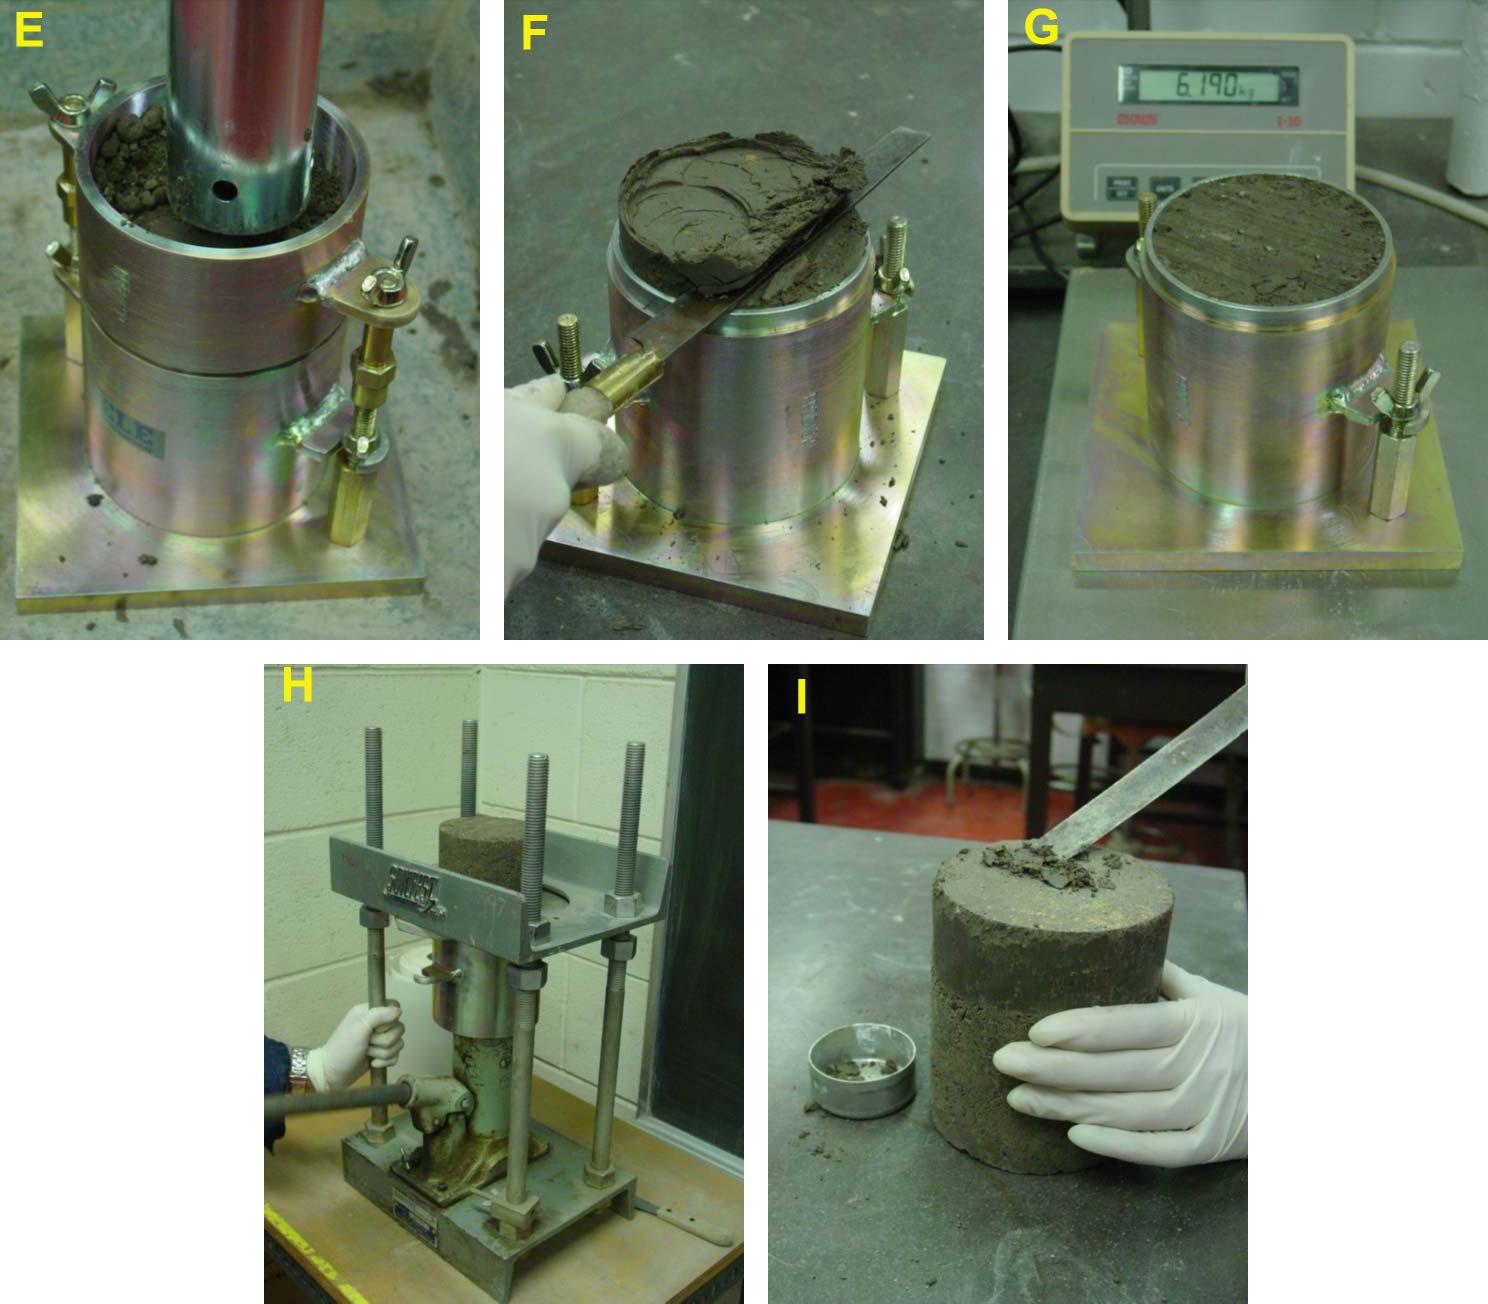 Fig 6.3 Equipment of Dry density and moisture content test
Test Procedure:
- Depending on the type of mold you are using obtain a sufficient quantity of air-dried soil in large mixing pan. For the 4-inch mold take approximately 10 lbs, and for the 6-inch mold take roughly 15 lbs. Pulverize the soil and run it through the # 4 sieve.
- Determine the weight of the soil sample as well as the weight of the compaction mold with its base (without the collar) by using the balance and record the weights.
- Compute the amount of initial water to add by the following method:
- Assume water content for the first test to be 8 percent.
- Compute water to add from the following equation:
 water to add (in ml)=(soil massin grams)8
100
Where “water to add” and the “soil mass” are in grams. Remember that a gram of water is equal to approximately one milliliter of water.
- Measure out the water, add it to the soil, and then mix it thoroughly into the soil using the trowel until the soil gets a uniform color (See Photos B and C).
- Assemble the compaction mold to the base, place some soil in the mold and compact the soil in the number of equal layers specified by the type of compaction method employed (See Photos D and E). The number of drops of the rammer per layer is also dependent upon the type of mold used (See Table 1). The drops should be applied at a uniform rate not exceeding around 1.5 seconds per drop, and the rammer should provide uniform coverage of the specimen surface. Try to avoid rebound of the rammer from the top of the guide sleeve.
- The soil should completely fill the cylinder and the last compacted layer must extend slightly above the collar joint. If the soil is below the collar joint at the completion of the drops, the test point must be repeated. (Note: For the last layer, watch carefully, and add more soil after about 10 drops if it appears that the soil will be compacted below the collar joint.)
- Carefully remove the collar and trim off the compacted soil so that it is completely even with the top of the mold using the trowel. Replace small bits of soil that may fall out during the trimming process (See Photo F).
- Weigh the compacted soil while it’s in the mold and to the base, and record the mass (See Photo G). Determine the wet mass of the soil by subtracting the weight of the mold and base.
- Remove the soil from the mold using a mechanical extruder (See Photo H) and take soil moisture content samples from the top and bottom of the specimen (See Photo I). Fill the moisture cans with soil and determine the water content.
- Place the soil specimen in the large tray and break up the soil until it appears visually as if it will pass through the # 4 sieve, add 2 percent more water based on the original sample mass, and re-mix as in step 4. Repeat steps 5 through 9 until, based on wet mass, a peak value is reached followed by two slightly lesser compacted soil masses.
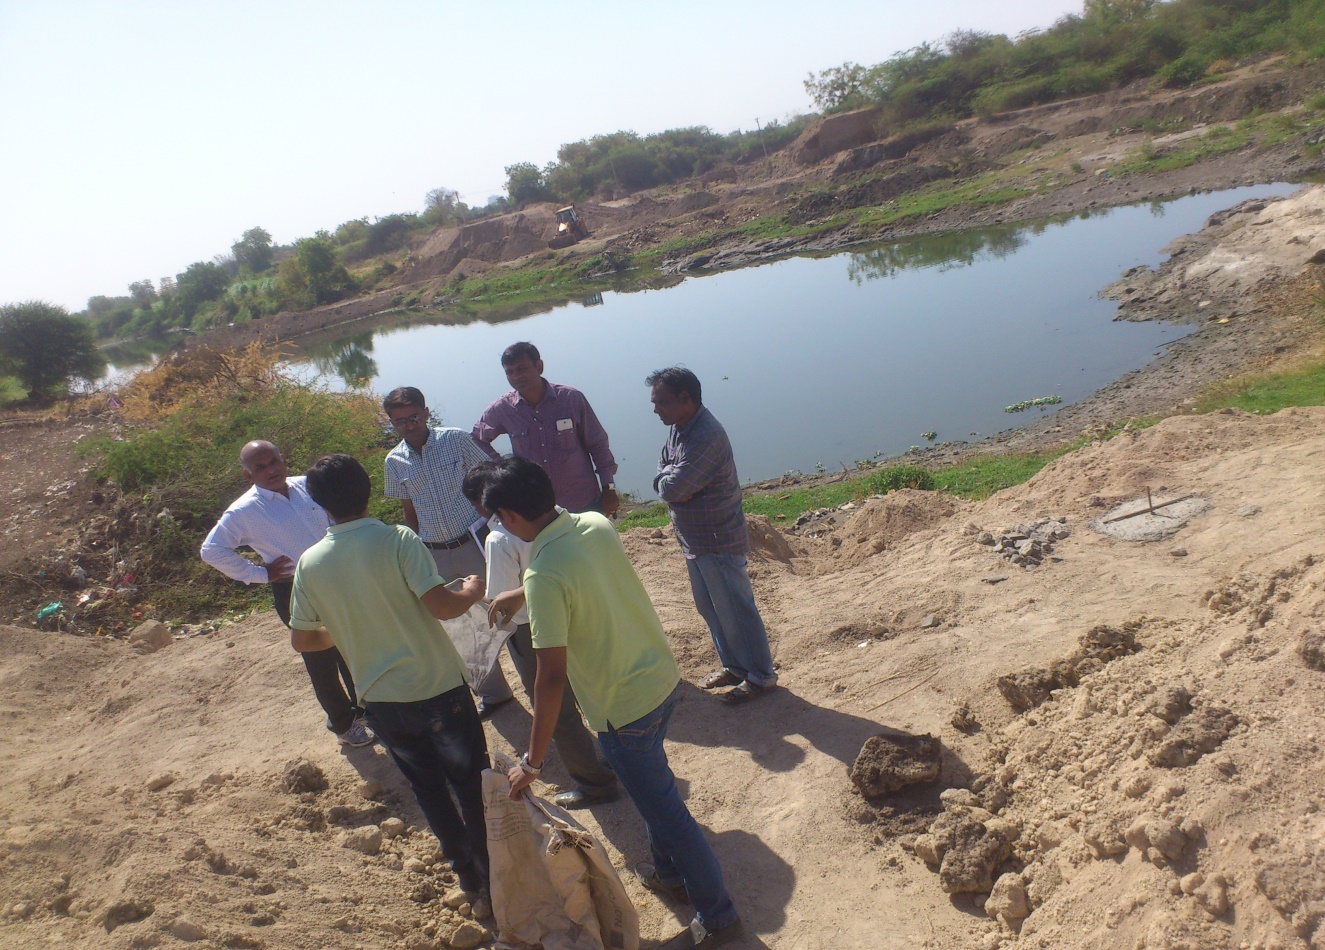
Fig 6.4 Soil taken from site
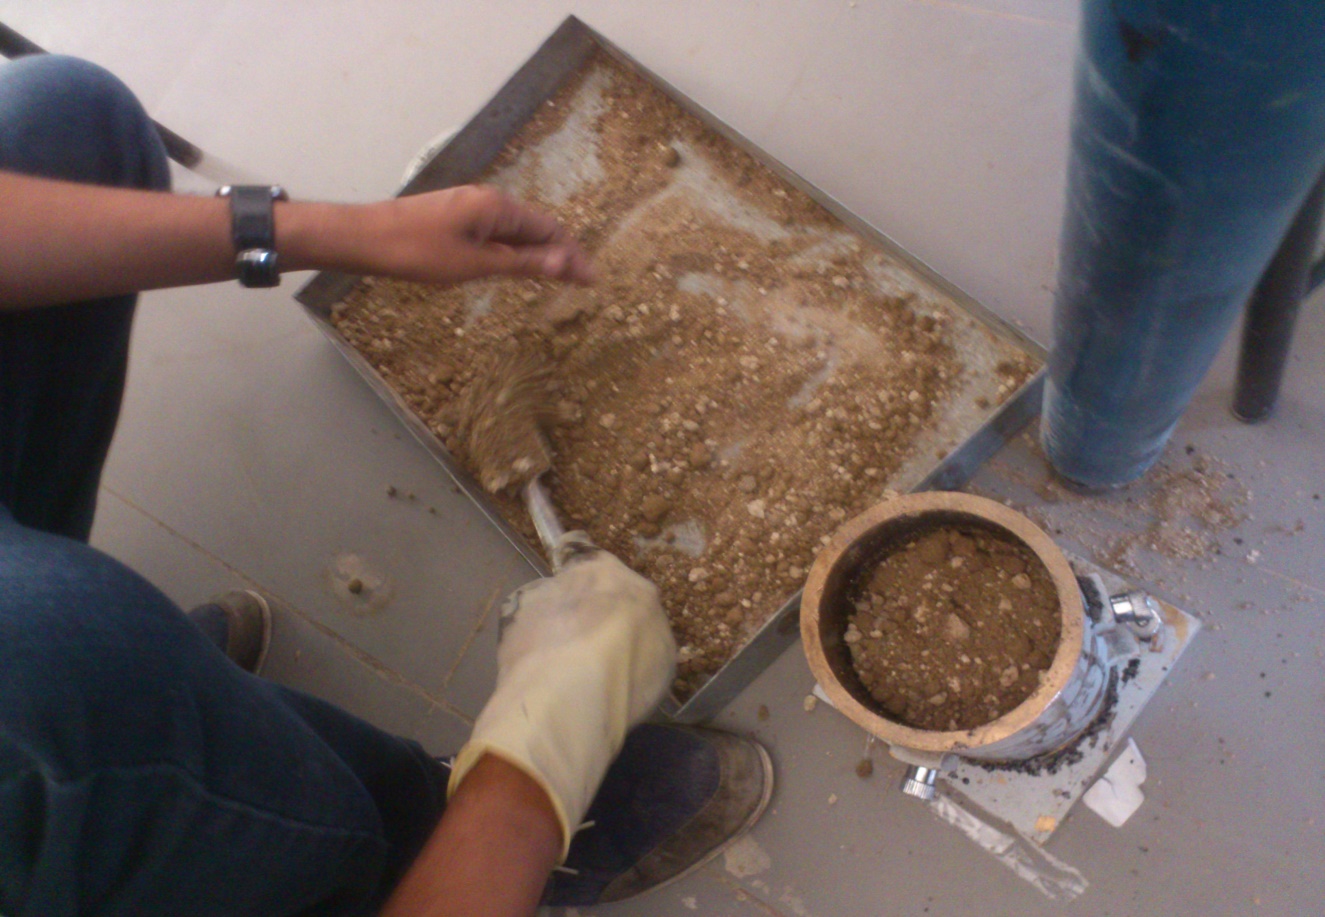
Fig 6.5 Mold filling procedure
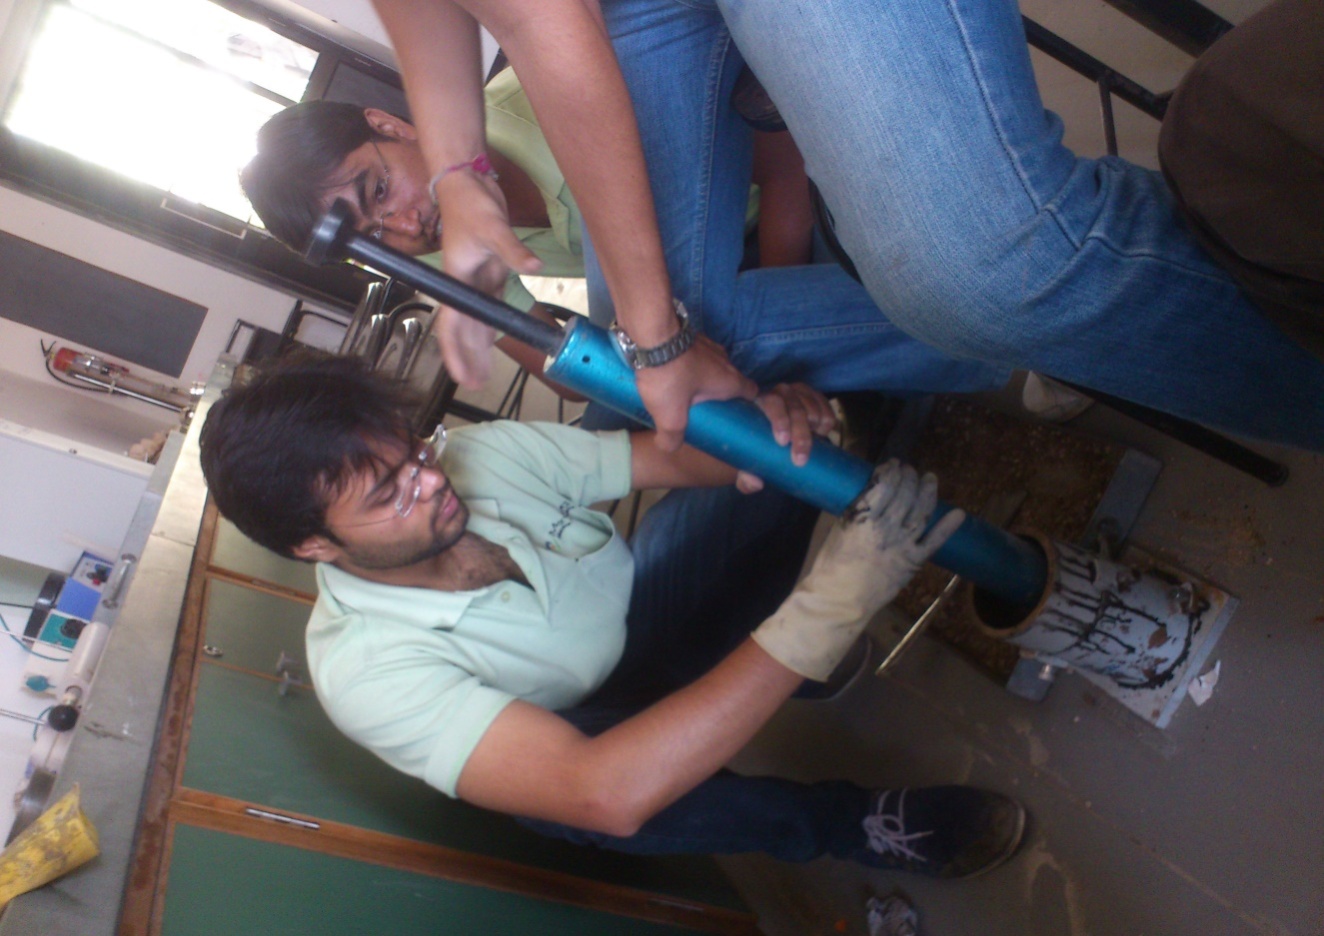
Fig 6.6 Compaction of soil by hammer
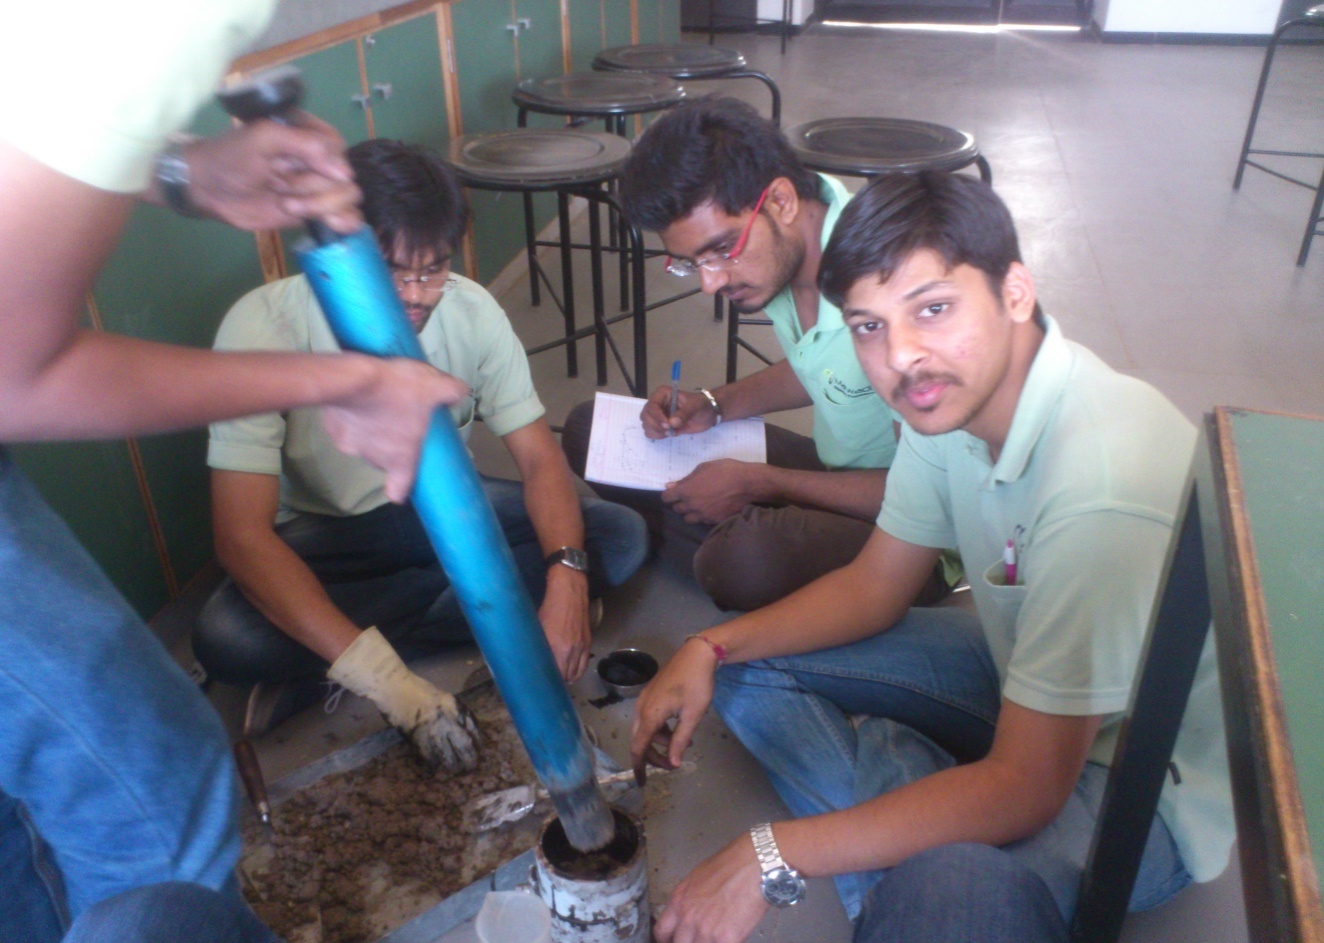
Fig 6.7 Compaction of soil by hammer
Data Analysis:
- Calculate the moisture content of each compacted soil specimen by using the average of the two water contents.
- Compute the wet density in grams per cm3 of the compacted soil sample by dividing the wet mass by the volume of the mold used.
- Compute the dry density using the wet density and the water content determined in step 1. Use the following formula:
ρd=ρ1+w
where: w = moisture content in percent divided by 100, and ρ = wet density in grams per cm3.
- Plot the dry density values on the y-axis and the moisture contents on the x-axis. Draw a smooth curve connecting the plotted points.
- On the same graph draw a curve of complete saturation or “zero air voids curve”. The values of dry density and corresponding moisture contents for plotting the curve can be computed from the following equation:
Wsat=ρwρd-1Gs*100
ρd=ρwW100-1Gs
6.3 California Bearing Ratio Test (CBR Test)
AIM:
TO FIND THE BEARING CAPACITY OF A MATERIAL WITH THAT OF A WELL-GRADED CRUSHED STONE.
APPARATUS:
Mould
Steel Cutting collar
Spacer Disc
Surcharge weight
Dial gauges
IS Sieves
Penetration Plunger
Loading Machine
Miscellaneous Apparatus
PROCEDURE:
- Normally 3 specimens each of about 7 kg must be compacted so that their compacted densities range from 95% to 100% generally with 10, 30 and 65 blows.
- Weigh of empty mould
- Add water to the first specimen (compact it in five layer by giving 10 blows per layer)
- After compaction, remove the collar and level the surface.
- Take sample for determination of moisture content.
- Weight of mould + compacted specimen.
- Place the mold in the soaking tank for four days (ignore this step in case of unsoaked CBR.
- Take other samples and apply different blows and repeat the whole process.
- After four days, measure the swell reading and find %age swell.
- Remove the mould from the tank and allow water to drain.
- Then place the specimen under the penetration piston and place surcharge load of 10lb.
- Apply the load and note the penetration load values.
- Draw the graphs between the penetration (in) and penetration load (in) and find the value of CBR.
- Draw the graph between the %age CBR and Dry Density, and find CBR at required degree of compaction.
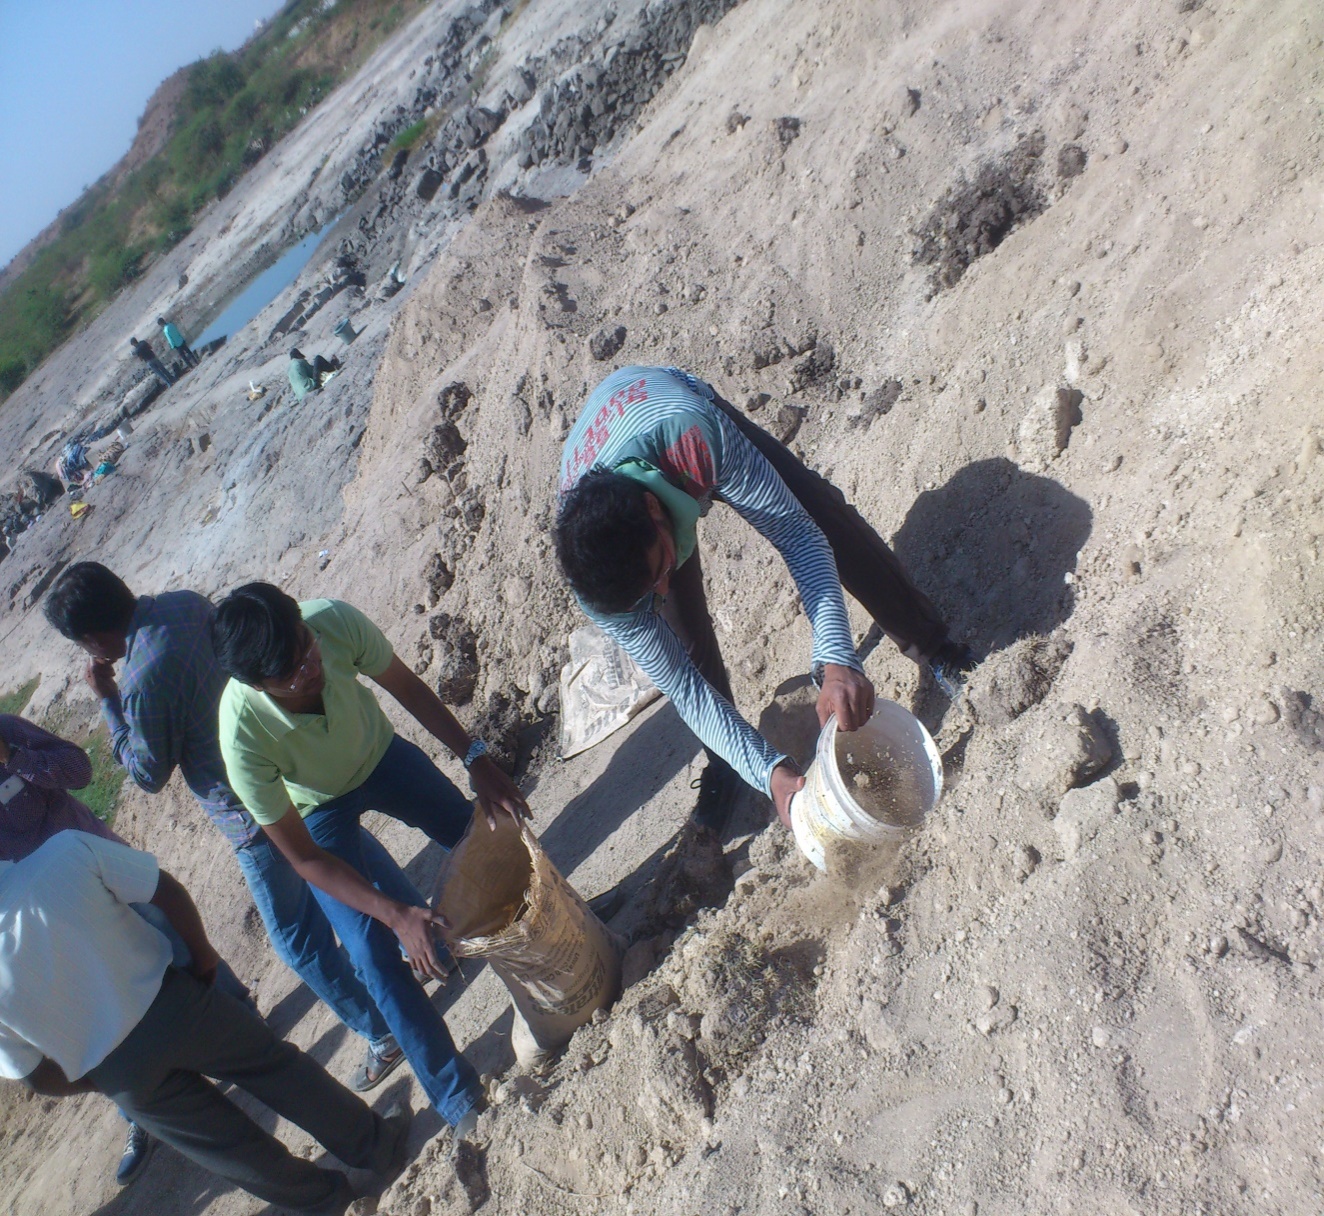
Fig 6.8 Soil taken from site
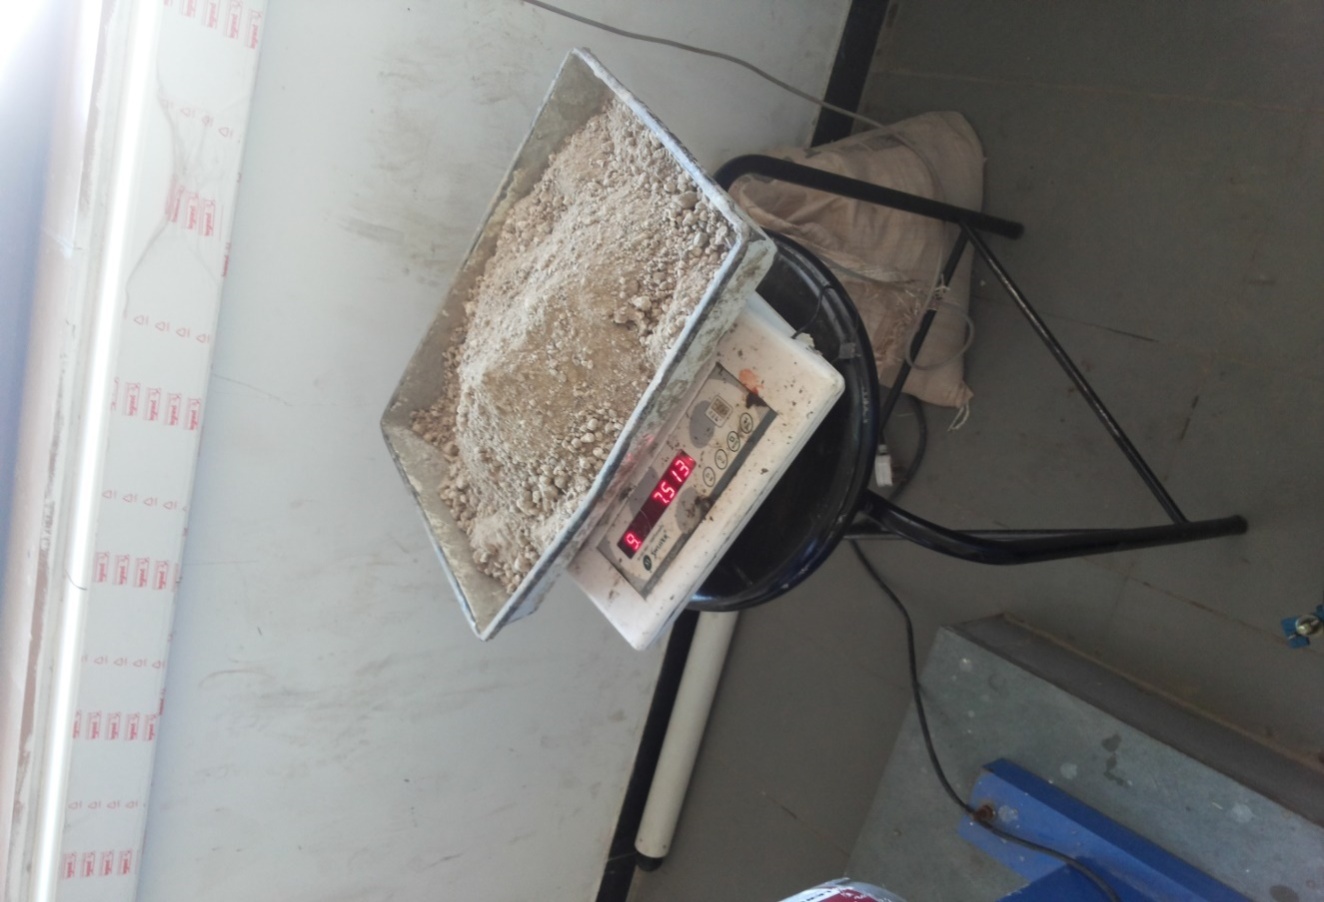
Fig 6.9 Weight of soil

Fig 6.10 Prepare a mould before Test
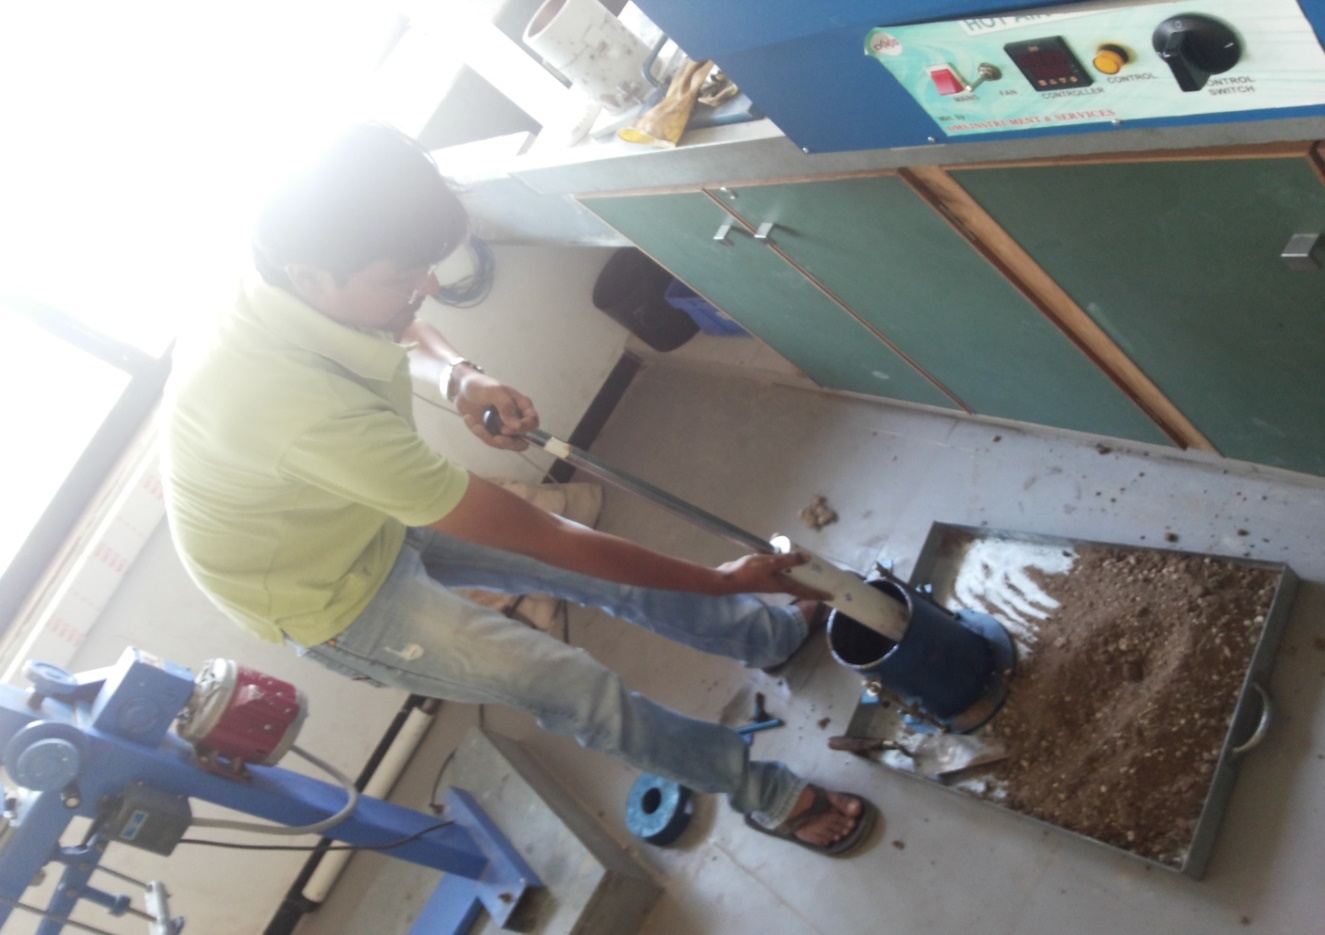
Fig 6.11 Compaction of Soil For C.B.R test
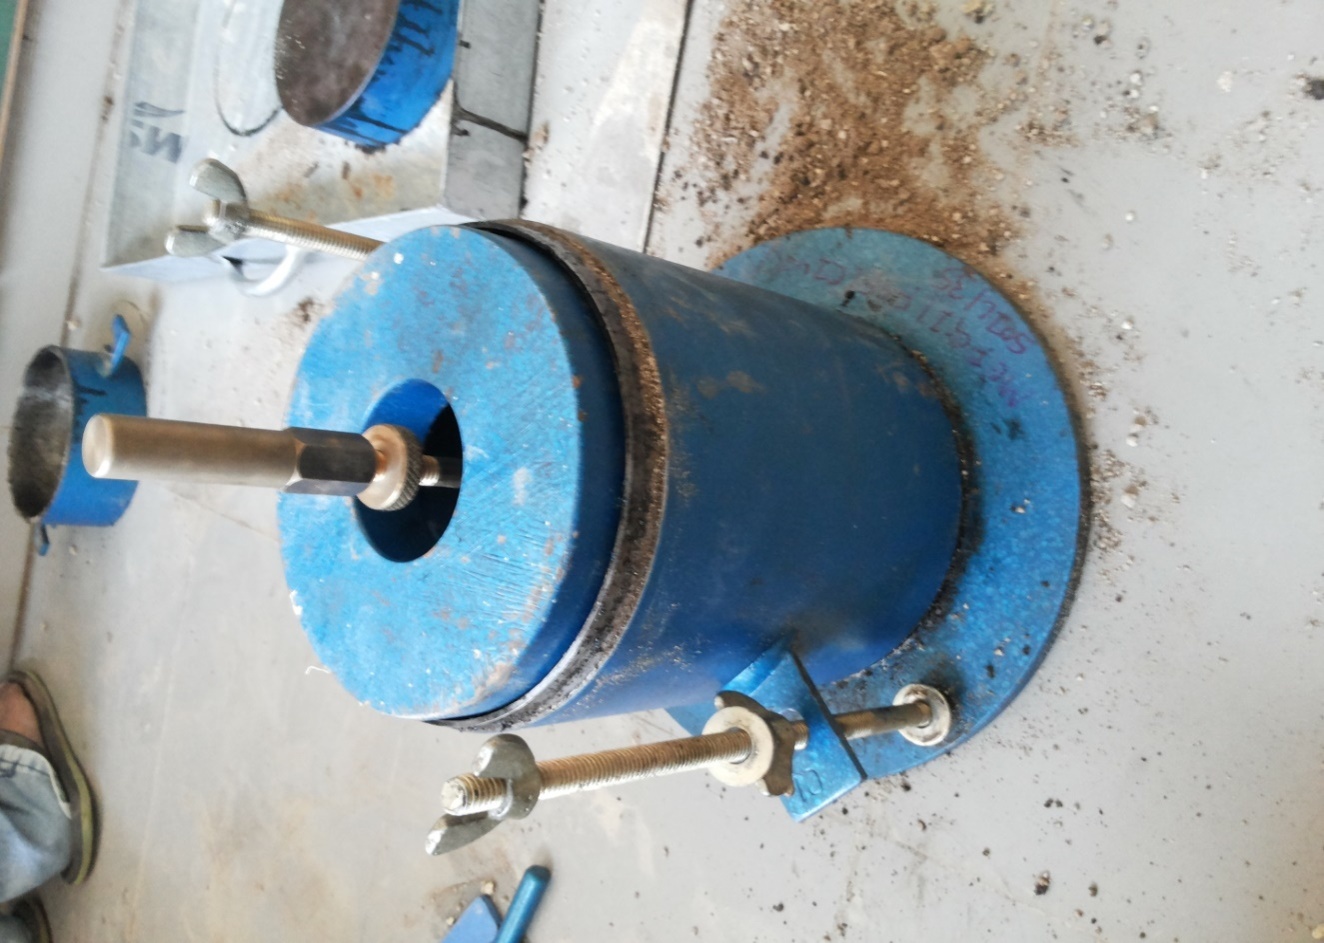
Fig 6.12 Mould of C.B.R mould
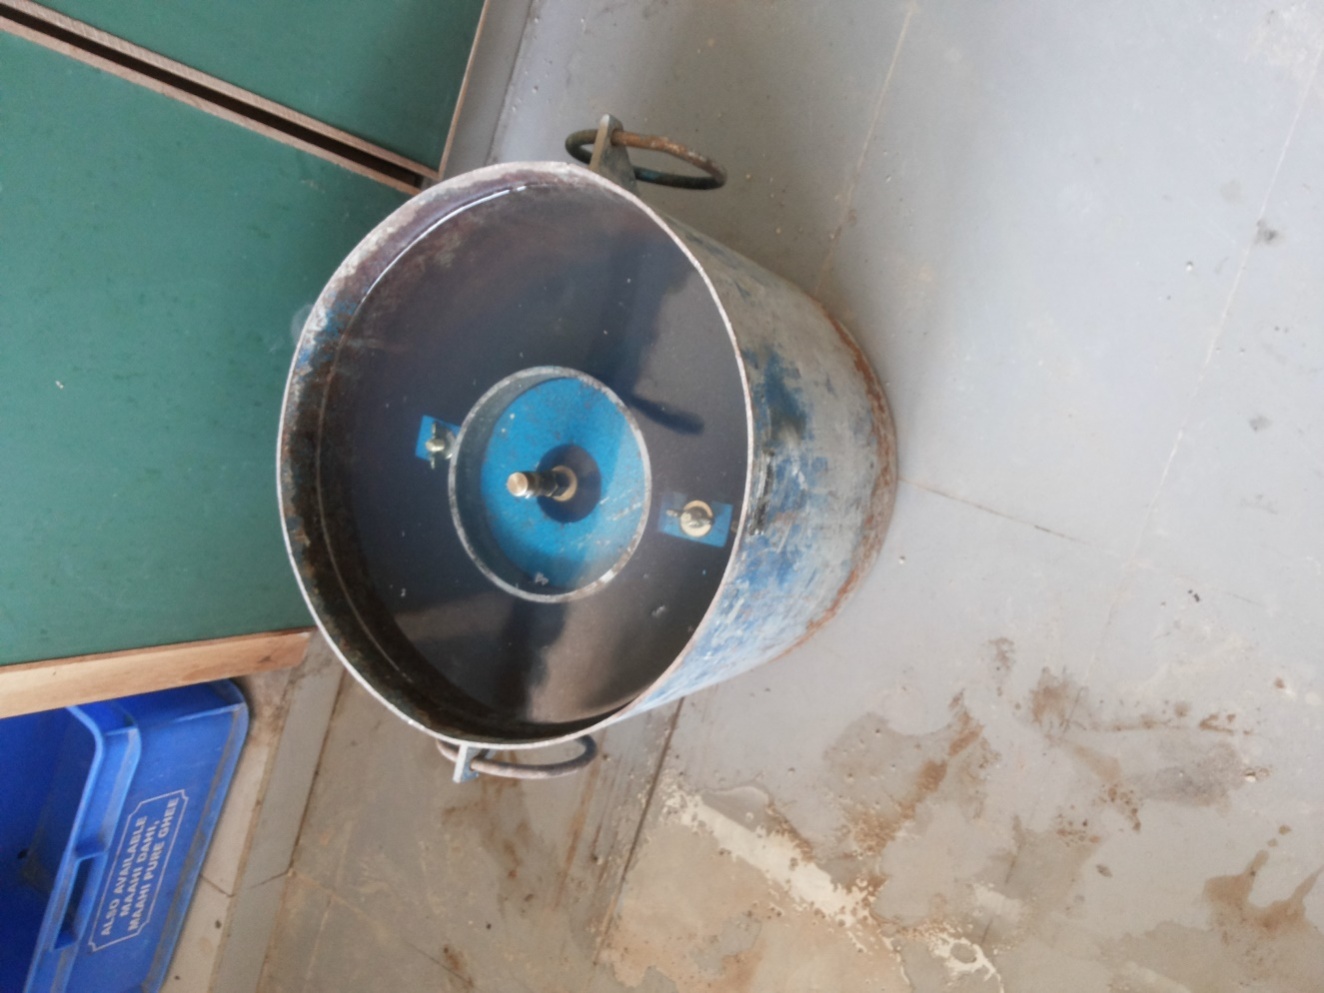
Fig 6.13 Mould in shock condition
- DESIGN OF PAVEMENT
7.1 GENERAL
The pavement design given in the previous edition IRC:37-1948 were application to design traffic upto 30million standard axles. With the increasing traffic and incidence of overloading, arterial roads need to be designed for traffic far greater than 30msa. As empirical method have limitations regarding their applicability and extrapolation, the analytical method of design has been used to reanalyse the existing design and devlop a new set of design traffic upto 150 msa making use of the results of pavement research work done in the country and experience gained over the years on the performance of the existing designs.
7.2 Traffic
7.2.1 INTRODUCTION
Traffic surveys are essential tool for assessing the characteristics of the traffic and travel
Behaviour in a given influence region in terms of average daily traffic, hourly and daily
Variation, traffic composition, trip distributions, travel pattern, road network speed,
vehicle damage factor and user response towards the toll projects.
According to scope of work, following traffic surveys were carried out:
• Traffic volume count survey for 7 days at three locations.
• Origin – Destination survey for 24 hours at two locations.
• Willingness to Pay Survey.
- TRAFFIC COUNTS
Table 7.1 Classification and category of vehicles
| CLASSIFICATION | CATEGORY OF VEHICLE |
| Passenger Cars | Private Cars |
| Utility Vehicles | Jeeps, Vans etc. |
| 3-Wheelers | Auto Rickshaws |
| Buses | Buses, Mini buses |
| Goods Vehicles | LCV
Trucks with 2 axles Trucks with 3 axles Trailers / Containers |
| Other | Tractors/Bullock Carts/Hand Carts |
7.2.3 Results and Analysis
Traffic Volume Survey at Rajkot – Jamnagar:
The daily traffic intensity in PCU was observed to vary between 9991 PCU/day and
9182 PCU/day and the total number of vehicles per day ranged between 6349 and 6060.
There was no appreciable change in the number of vehicles counted over the week,
though on Sunday, the volume in terms of vehicles was observed to be the least.
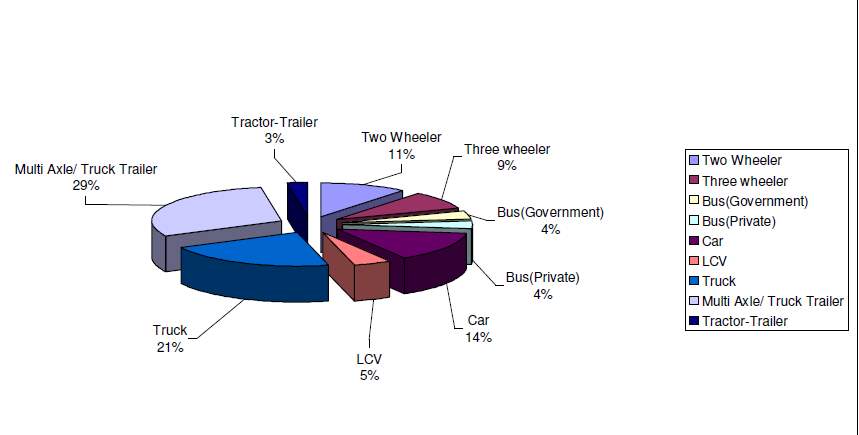
Fig 7.1 Pie chart of traffic survey of Rajkot-Jamnagar
Peak hour traffic composition shown in Figure 9.1 indicates that the Multi axle/truck had a maximum share in the traffic composition of 50%. Passenger cars/Jeeps/Vans/Two
Wheelers/Auto rickshaws constitute 34% of the total. LCV’s and Bus( Private and
public) amount to 13% of the total composition. Remaining 3% had tractor trailor.
Cycle rickshaws as local modes of transport consisted of 9% of the total traffic plying on
the project corridor.
Traffic Volume Survey at Rajkot-Kalawad:
The second seven day survey count post was located at Rajkot Kalawad road. The
number of vehicles observed during the weekly count ranged between 8053 vehicles/day
and 7637 vehicles/day. The daily PCU values observed are between 8135 PCU/day and
7533 PCU/day.
Traffic composition of this location observed that trucks traffic 12%, bus traffic 5%.
Three wheelers like auto rickshaw 18%, two wheelers 23%, car 23%, LCV 4%, Multi
axle/ Truck Trailer 6%, Tractor trailer 9%. The overall traffic composition at shown in
the Figure 7.2.
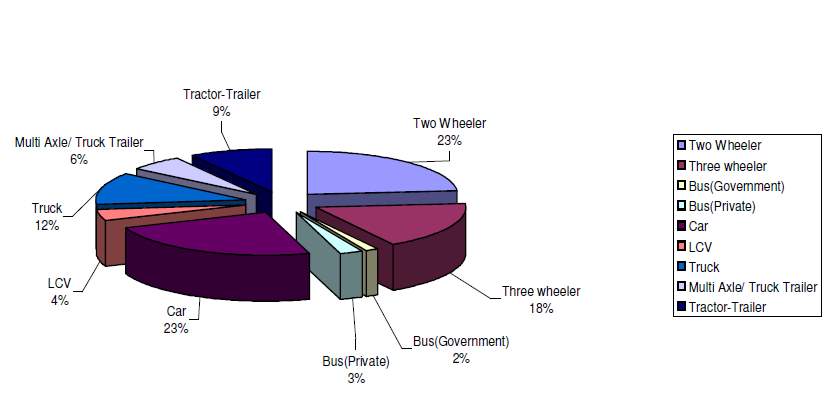
Fig 7.2 Pie chart of traffic survey of Rajkot-Kalavad
7.2.4 Peak hour factor
The peak hour traffic volume at Jamnagar road was observed to be 24.45% while that at
Kalawad road it was 26.56%. The average peak hour factor for the project road was
taken as 25.50%.
7.2.5 Average Daily Traffic (ADT)
The volume count at the two locations does not vary considerably and as such, At
Rajkot- Jamnagar corridor average 9585 PCU estimated of both side. At Rajkot Kalawad
corridor average 7834 PCU estimated of both side.
7.2.6 Average Annual Daily Traffic (AADT)
The state PWD collects traffic data twice every year (one in April and other around
October). This data is collected and preserved yearly in a particular format. As this data
collected gives variation for pre-monsoon and post-monsoon periods only, it cannot be
used for calculation of seasonal factors which has to be calculated on monthly basis The
AADT was arrived at by multiplying these factors with ADT obtained from the traffic
volume count. The survey was conducted in July where the factor of conversion is
observed to be 1. Hence the AADT for the corridor is estimated as 17240 PCUs.
7.3 TRAFFIC GROWTH RATE
7.3.1 Background
Adopting the linear regression based on past trend based on IRC 108-1996, the traffic forecast for the project road has been carried out. Efforts have been made to build timeseries past traffic data for the project road from the available data. Similar time seriespast data on population, state income (NSDP) and per capita income for the Study State’s has been developed. Motor vehicle registration data for Rajkot city has also been collected.
As suggested by the Indian Roads Congress (IRC: 108-1996), Motor vehicle registration data has been used which resulted in a good-fit. Recent trend in traffic/vehicle registration growth, over their long-term growth for which elasticity was worked out, is considered in moderating the elasticity values for future periods.Considering the projected elasticity values, economic development indicators for the State’s within the project influence area and the traffic distribution between them as arrived from traffic surveys, vehicle type wise growth rates were worked out for different time periods. The projected growth rates worked out major vehicle groups such as car; bus, two wheelers and trucks were further moderated to detailed vehicle categories, considering the likely future shift among the vehicle categories. The probable structural shift and modal choice of vehicle ownership from 2 axle trucks to MAV’s and 2/3 wheeler market to car have been taken in to account while moderating the elasticity values. This is considered necessary because as the purchasing power increases there will be a shift from low cost vehicle to high speed/power and more comfortable vehicles. Further, with the road improvement and realization of economics of scale, goods operators will tend to transfer from 2 axle trucks to Multi-Axle vehicles. These market driven forces have been realistically considered in the traffic forecast.
“If adequate data is not available, it is the recommended that an average annual growth rate of 7.5 per cent may be adopted.”
7.4 Design Period:
A 15-year design period (2009 – 2029) is assumed for the design of flexible pavement.
7.5 Vehicle Damage Factor:
Vehicle damage factor (VDF) is a multiplier to convert the number of commercial vehicles of different axle loads and axle configuration to the number of standard axle load repetitions. It is defined as equivalent number of standard axles per commercial vehicle. The VDF varies with the vehicle axle configuration, axle loading, terrain, type of road and from region to region. Vehicle damage factors are tabulated in table 3 as shown below.
Table 7.2 for Terrain Classification
| Initial traffic volume in terms of number of commercial vehicles per day | Terrain | |
| Rolling/Plain | Hilly | |
| 0-150 | 1.5 | 0.5 |
| 150-1500 | 3.5 | 1.5 |
| More than 1500 | 4.5 | 2.5 |
7.6 Computation of design traffic
The design traffic is considered in terms of the cumulative number of standard axles to be carried during the design life of the road. This can be computed using the following equation:
N=365×[1+rn-1]r×A×D×F
“Where”,
N=The Cumulative number of standerd axles to be catered for in the design in
Terms of msa.
A=Initial traffic in the year of completion of construction in terms of number of commercial vehicles per day.
D=Lane distribution factor
F=Vehicle damage factor
n=Design life in year
r=Annual growth rate of commercial vehicle
The traffic in the year of completion is estimated using the following formula:
A=P(1+r)x
Where,
P=Number of Commercial vehicles as per last count
X=Number of years between the last count and the year of completion of
Construction.
In our project the data for Ring Road No. 2 are as follows,
From equation “where”, r=0.075,
n=15 year,
P=39754000 commercial vehicle per day
x=2 years
D=0.75
F=4.5
A=4000(1+0.075)2A=4622.5 4623
P=365×[(1+0.075)15-1]0.075×106×4623×0.75×4.5P=149.032 msa
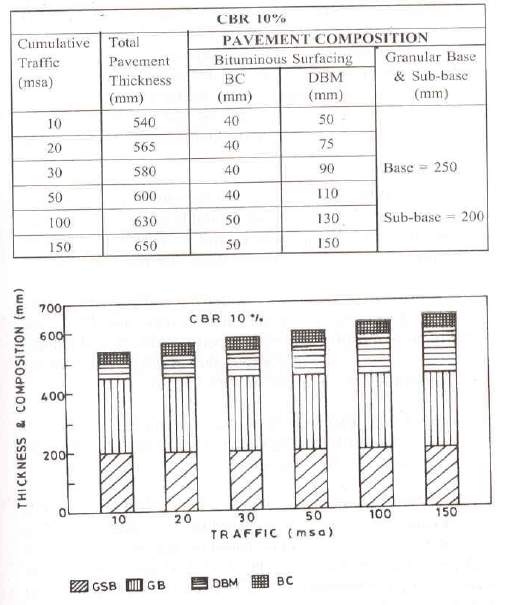
Fig 7.3 C.B.R Value from IS-37-2001 code.
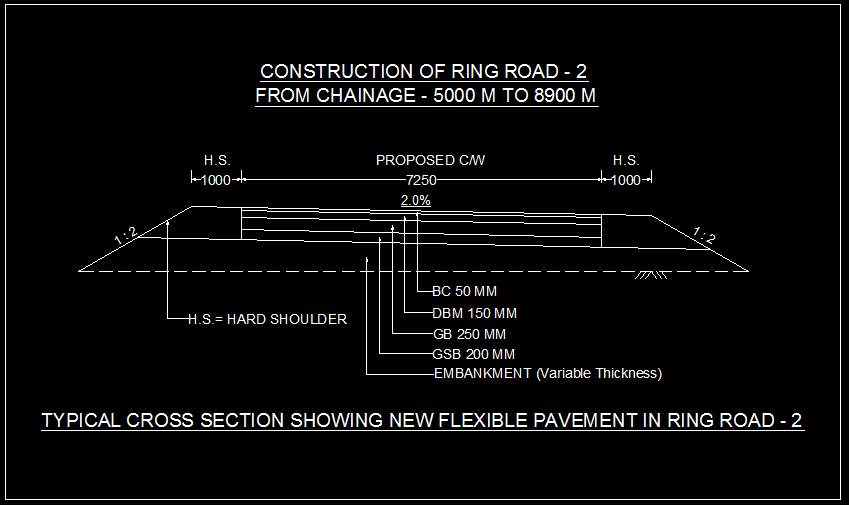
Fig 7.4 Typical Cross Section Showing New Flexible Pavement In Ring Road No.-2
Cite This Work
To export a reference to this article please select a referencing stye below:
Related Services
View allRelated Content
All TagsContent relating to: "Civil Engineering"
Civil Engineering is a branch of engineering that focuses on public works and facilities such as roads, bridges, dams, harbours etc. including their design, construction, and maintenance.
Related Articles
DMCA / Removal Request
If you are the original writer of this dissertation and no longer wish to have your work published on the UKDiss.com website then please:


