Resistance Genes on Large Self-transmissible Plasmids
Info: 11624 words (46 pages) Dissertation
Published: 9th Dec 2019
Tagged: Environmental StudiesFarming
Abstract
Antimicrobial resistance (AMR) continues to be a growing global issue. Modern farming practices require the use of antibiotics, biocides and metals such as copper to ensure low disease occurrence and high production output (1,2,3). AMR genes are often located on mobile genetic elements such as plasmids, transposons and integrons therefore allowing horizontal exchange between bacteria. The aim of this work was to examine the acquisition of resistance genes on large self-transmissible plasmids (4,5). Surveillance of a 3 million litre slurry tank from a UK dairy farm with specific focus on Escherichia coli, identified isolates that displayed resistance to all major classes of antibiotics used in agricultural, and human medicine. Sequence analysis of whole genome and plasmid sequences for isolates E. coli BCC2, BS7, BCE3, and A2.5 revealed several large transmissible plasmids encoding novel traits, virulence factors and resistance genes including extended-spectrum beta-lactamases, metal resistances, toxin systems capable of acting as addiction modules, and transfer genes. This detailed analysis of the sequence data has given insight into the complexity of mobile elements and horizontally transferred genes present in E. coli found within a single slurry tank.Antibiotics used in veterinary treatment, conjugates of the antibiotics, or breakdown products, are eliminated within faeces, urine, or mastitic milk which cannot enter the food chain (6, 7). Antimicrobial metals, disinfectants, detergents and other antimicrobials are also disposed in slurry tanks. These antimicrobial compounds are diluted in the large volumes of slurry in the tanks, and stored for months. The low levels of antibiotics, disinfectants or metals may select for transmission and incorporation of resistance genes onto large mobile genetic elements (4, 8). Even at low levels (previously thought insignificant) antibiotic resistance can be selected for (9). The use of antibiotics, metals and biocides and spreading of slurry containing these antimicrobials is widespread in farming practice. Therefore it is vitally important to gain a greater understanding of how mobile genetic elements such as plasmids, transposons and integrons are exchanged and maintained within the environment, the selective pressures driving them and the anthropogenic activities influencing them.
1. Introduction
- Materials and Methods
- Media
All media was prepared as per manufacturer’s instructions unless states otherwise and sterilised by autoclaving at 121°C and 10 psi pressure for 15 minutes.
- Luria-Bertani Lennox Broth (LBB)
LBB (Sigma-Aldrich, Cat no. L3022) with a composition of 10 g tryptone, 5 g yeast extract and 5 g sodium chloride, was prepared within Duran glassware by dissolving 20 g of LBB powder in 1 litre of reverse osmosis (RO) water. Media was autoclaved and cooled to room temperature prior to use.
- Luria-Bertani Lennox Agar (LAA)
LBA (Sigma-Aldrich, Cat no. L2897) with a composition of 10 g/L tryptone, 5 g/L yeast extract, 5 g/L sodium chloride and 15 g/L agar, was prepared within Duran glassware by dissolving 32 g of LBA powder in 1 L of RO water. Media was autoclaved, cooled to room temperature and antibiotics added if required, prior to pouring.
- Mueller Hinton Broth (MHB)
MHB (Sigma-Aldrich, Cat no. 70192) with a composition of 2 g/L beef infusion solids, 17.5 g/L casein hydrolysate and 1.5 g/L starch, was prepared within Duran glassware by dissolving 21 g of MHB powder in 1 L of RO water. Media was autoclaved and cooled to room temperature prior to use.
- Mueller Hinton Agar (MHA)
MHA (Sigma-Aldrich, Cat no. 70191) with a composition of 2 g/L beef infusion solids, 17.5 g/L casein hydrolysate and 1.5 g/L starch and 17.0 g/L agar, was prepared within Duran glassware by dissolving 38 g of MHA powder in 1 L of RO water. Media was autoclaved and cooled to room temperature prior to pouring.
- Tryptone Bile X-Glucuronide agar (TBX)
TBX (Sigma-Aldrich, Cat no. 92435) with a composition of 1.5 g/L bile salts, 0.075 g/L X-β-D-glucuronide, 20 g/L peptone and 15 g/L agar, was prepared within Duran glassware by dissolving 36.6 g of TBX powder in 1 L of RO water. Media was autoclaved and cooled to room temperature prior to pouring.
TBX is a chromogenic medium that allows for selection of E. coli from a sample such as faeces containing a mixed community of bacteria. This is due to the selective actions of bile salts contained within the media, which select only for Gram-negative species. TBX is advantageous to use as it has the addition of X-glucuronide, which allows for detection of β-glucuronidase (GUS) activity, an enzyme produced by E. coli. This allows for most Escherichia spp. to be differentially recognised from other faecal bacteria commonly found in cow and pig faeces. TBX works via the chromogenic agent 5-bromo-4-chloro-3-indolyl-β-D-glucuronide (X-Gluc) acting as a substrate for GUS. Following cleavage by GUS, X-Gluc yields a dark blue insoluble product. This blue colour precipitates within the cell resulting in distinctive blue colonies on the agar plates (Restaino et al., 1990).
- CHROMagar ESBL
>Use the CHROMagar supplementary Data
Del’s Thesis>>This medium (CHROMagar, France. Product code ES372) was composed of 2 components: A) CHROMagar Orientation (agar 15 g; peptone and yeast extract 17 g; Chromogenic mix 1 g) and B) CHROMagar ESBL supplement which is a proprietary selective supplement used at a rate of 0.57 g per litre of medium. CHROMagar Orientation medium (33 g) was suspended in 1L of RO water, the mixture was brought to boiling (100ÅãC) while swirling or stirring regularly and when dissolved was aliquoted into appropriate containers and autoclaved. The ESBL supplement powder (570 mg) was rehydrated in 10 ml of sterile purified water, and added to 1 L of the sterilised CHROMagar Orientation media when it had cooled to ≤50°C. Volumes (20 ml) of the supplemented medium were then poured into 90 mm petri dishes. E. coli ESBL should appear as dark pink to reddish colonies, Klebsiella, Enterobacter, and Citrobacter should appear as metallic blue colonies, and Proteus as brown with a brown halo.<<
- Maximum Recovery Diluent (MRD)
MRD (Oxoid, Cat No. CM0733) with a composition of 1 g of peptone and 8.5 g of sodium chloride, was prepared within Duran glassware by dissolving 9.5 g of MRD powder in 1 L of RO water. Media was autoclaved and cooled to room temperature prior to use.
- Super Broth (SB)
SB with a composition of 35 g/L tryptone (Sigma Cat no. T7293), 20 g/L yeast extract (Sigma Cat no. Y1625), 5 g/L NaCl (VWR Cat no. 443824T) and 5 ml/L 1M Sodium hydroxide (Alfa Aesar, Cat no. A16037) was prepared within Duran glassware followed by autoclaving. Media was cooled to room temperature prior to use.
- Buffers and Solutions
All buffers were prepared using sterile RO water with pH adjusted using either concentrated hydrochloric acid (HCl) (Honeywell, Cat no. 258148) or 1 M sodium hydroxide (NaOH) (section 2.2.6).
- 1 M Tris-HCl
A 1 M solution of Tris-HCl was prepared by dissolving 121.1 g of Trizma base (Sigma Cat no. T1503) in 800 ml of RO water, in a beaker containing a magnetic stirring flea. The pH was carefully adjusted to the desired pH through the addition of concentrated HCl (approximately 42 ml for pH 8.0, 60 ml for pH 7.6 and 70 ml for pH 7.4) and monitored via a pH metre. The solution was brought to final volume of 1 L with RO water and sterilised via autoclaving.
- 0.5 M Ethylenediaminetetraacetic acid (EDTA)
A 0.5 M solution of EDTA was prepared by dissolving 186.1 g of EDTA (Fisher Scientific, Cat no. 10011123) in 800 ml of RO water, in a beaker containing a magnetic stirring flea. The pH was carefully adjusted to pH 8.0 through the addition of NaOH and monitored via a pH metre. The solution was brought to final volume of 1 L with RO water and sterilised via autoclaving.
- TE Buffer
A working stock of 1X TE Buffer (pH 7.4) was prepared through the addition of 10 ml 1M Tris-HCl (pH 7.4) to 2 ml of 0.5 M EDTA (pH 8.0) and brought to a final volume of 1 L with RO water.
- TAE Buffer
A 50X concentrated stock of TAE buffer was prepared by dissolving 242 g of Trizma base in 750 ml RO water. 57.1 ml of glacial acetic acid (Honeywell, Cat no. 695092) was then carefully added along with 100 ml of 0.5 M EDTA (pH 8.0). The final volume was adjusted to 1 L. For a working concentration of 1X the stock was diluted with RO water.
- 1M NaOH
A 1M solution of NaOH (Alfa Aesar, Cat no. A16037) was prepared by dissolving 40 g of NaOH pellets in 650 ml of RO water whilst being stirred by a magnetic flea within a beaker placed into a container of ice. Once completely dissolved the final volume was adjusted to 1 litre.
- 10% SDS
A stock of 10% SDS stock was prepared by dissolving 10 g of SDS dust free pellets (Sigma, Cat no. 75746) in 80 ml of RO water and brought to a final volume of 100 ml with RO water. Templiphi Reagents
- 3 M Potassium Acetate (KOAc)
A 100 ml 3 M stock of KOAc was prepared by dissolving 29.4 g of KOAc powder (Sigma-Aldrich, Cat no. P1190) in 80 ml RO water. The pH was adjusted to pH 5.5 through the addition of 11.4 ml glacial acetic acid. The solution was brought to a final volume of 100 ml with RO water and stored at 4°C
- 1 M Glucose
A 1 M stock solution of glucose was prepared by dissolving 180.16 g of D(+)-Glucose Anhydrous (Fisher Scientific, Cat no. 10539380) in 800 ml Ro water. The solution was brought to a final volume of 1 L with RO water. Working concentrations were prepared by diluting the stock with RO water.
- RNase A-TEG Buffer
A working stock of RNase A-TEG buffer was prepared through the addition of 50 mM glucose, 25 mM Tris-HCl (pH 8.0) and 10 mM EDTA to 50 ml RO water. 50 μl of 10 mg/ml RNase (Qiagen, Cat no. 19101) was then added and aliquots of 1.5 ml were stored at 4°C.
- Lysis Solution
Lysis solution was prepared through the addition of 2 ml 1 M NaOH to 7 ml RO water, followed by the addition of 1 ml 10% SDS.
- Large Construct Kit Reagents
- ATP (0.1 M)
A 0.1 M ATP stock was made by dissolving 600 mg of ATP disodium salt (Sigma-Aldrich, Cat no. A3377) in 8 ml RO water. The pH was then adjusted to pH 7.0 with 0.1 M NaOH and the final volume adjusted to 10 ml with RO water. The solution was dispensed into 1 ml aliquots and stored at -20°C.
- Cloning Reagents
- 10% Glycerol
A 10% glycerol solution was prepared by mixing 1 ml of glycerol with 100 ml RO water.
- 20% Glucose
A 20% glucose solution was prepared by dissolving 2 ml of glucose in 100 ml RO water.
- Samples
Samples were collected in person from a UK dairy farm and from University experimental pigs. Other samples (previously isolated from a UK dairy farm and characterised by Delveen Ibrahim) were kindly supplied by my supervisors Jon Hobman and Christine Dodd.
- Strain confirmation
Prior to beginning work with Delveen’s samples, isolates revived from frozen stocks were subject to biochemical tests to confirm species type as E. coli.
- Oxidase
Oxidase strips (Sigma-Aldrich, Cat no. 40560) were used to test for aerobic activity through the production of cytochrome c oxidase. Fresh colonies were applied to the oxidase strip and results were recorded after 5 seconds. A positive result was confirmed through the development of a dark blue pigment on the strip with a negative result indicated as no change in colour. E. coli should show a negative result.
- Indole
Rapid spot indole tests (Remel, Cat no. R8309002) were used to detect conversion of tryptophan to indole. A single spot of indole was applied to filter discs and using an inoculation loop, fresh colonies smeared onto the spots of indole. A positive result was confirmed through the development of a blue to blue-green pigment with a negative result resulting in the development of a pink pigment. E. coli should show a positive result.
- Catalase
Catalase was used to detect the release of oxygen from hydrogen peroxide (H2O2). Fresh colonies were immersed into 1-2 ml of H2O2. A positive result was confirmed through the presence of immediate bubbling with a negative result showing no change. E. coli should show a positive result.
- Strain Storage
Frozen stocks were prepared from colonies of freshly grown cultures and stored using the Microbank preservation system (Pro-Lab Diagnostics, Cat no. PL.170/M).
- Strain Denotation
Table – My Cow and Pig Isolates and Delveen’s Isolates.
| Strains Isolated By Charlotte Litten – February 2016 on TBX + 100 ug/ml Ampicillin Media | ||||
| Cow Slurry Isolates | Pig Faecal Isolates | |||
| Isolate IDs | Isolate IDs | |||
| CWSR102 | PGFR102 | PGFR117 | ||
| CWSR103 | PGFR106 | PGFR119 | ||
| CWSR104 | PGFR107 | PGFR120 | ||
| CWSR105 | PGFR109 | PGFR121 | ||
| CWSR106 | PGFR112 | PGFR125 | ||
| CWSR107 | PGFR113 | |||
| CWSR113 | PGFR114 | |||
| CWSR114 | PGFR115 | |||
| Cow Strains isolated by Delveen Ibrahim | |||
| Isolate ID | Isolated From | Date of Isolation | Media Isolated on |
| A2.5 | Liquid Slurry | 2012 | TBX |
| BCE1 | Cow Barn | 2014 | CHROMagar ESBL |
| BCE2 | Cow Barn | 2014 | CHROMagar ESBL |
| BCE3 | Cow Barn | 2014 | CHROMagar ESBL |
| BCC2 | Cow Barn | 2014 | CHROMagar ESBL |
| BS7 | Solid Slurry | 2014 | TBX |
- Antibiotic Disc Diffusion Assays
According to CLSI…
| Table – List of discs tested including concentration, class and MIC values | ||||||
| Antibiotic Class | Antibiotic Name | Abbrv | Disc Concn (μg) | MIC Values | ||
| Resistant | Intermediate | Susceptible | ||||
| Penicillin | Ampicillin | AMP | 10 | >17 | 14-16 | <13 |
| β-Lactam/ase Inhibitor Combination | Amoxicillin/ Clavulanic Acid | AMC | 20/10 | >18 | 14-17 | <13 |
| 2nd Generation Cephalosporin | Cefoxitin | FOX | 30 | >18 | 15-17 | <14 |
| 3rd Generation Cephalosporin | Ceftazidime | CAZ | 30 | >21 | 18-20 | <17 |
| 3rd Generation Cephalosporin | Cefotaxime | CTX | 30 | >26 | 23-25 | <22 |
| 3rd Generation Cephalosporin | Ceftior | EFT | 30 | >23 | 22-20 | <19 |
| 3rd Generation Cephalosporin | Cefpodoxime | CPD | 10 | >21 | 18-20 | <17 |
| 4th Generation Cephalosporin | Cefquinome | CFQ | 30 | >23 | 22-20 | <19 |
| Monobactam | Aztreonam | ATM | 30 | >21 | 18-20 | <17 |
| Carbapenem | Imipenem | IPM | 10 | >23 | 20-22 | <19 |
| Aminoglycosides | Streptomycin | S10 | 10 | >15 | 12-14 | <11 |
| Tetracyclines | Oxytetracycline | OT | 30 | >15 | 12-14 | <11 |
| Fluoro-quinolones | Ciprofloxacin | CIP | 5 | >21 | 16-20 | <15 |
| Fluoro-quinolones | Enrofloxacin | ENR | 5 | >26 | 25-19 | <18 |
| Quinolones | Nalidixic Acid | NA | 30 | >19 | 14-18 | <13 |
| Folate Pathway Inhibitors | Sulphonamides | S3 | 300 | >17 | 13-16 | <12 |
| Folate Pathway Inhibitors | Trimethoprim-Sulfamethoxazole | SXT | 1.25/23.75 | >16 | 11-15 | <10 |
| Phenicols | Chloramphenicol | C | 30 | >18 | 13-17 | <12 |
| Nitrofurans | Nitrofurantoin | F | 300 | >17 | 13-16 | <12 |
| Polymyxin | Colistin | CT | 10 | >16 | 11-15 | <10 |
| Table – Quality control strains *(int) denotes intermediate resistance | |||
| E. coli Strain ID | Description | Resistances Conferred | Source |
| Negative Control | |||
| ATCC25922 | Negative control for disc diffusion assays | None | Cosmos Biomedical Ltd, UK (CLSI), 2015) |
| Disc Diffusion Positive Controls | |||
| NCTC13353 | CTX-M-15 ESBL Producer. | AMP, AMC, CAZ, CTX, EFT, CPD, CFQ, ATM, OT, CIP, ENR, NA, S3, SXT | Public Health England (PHE), UK (Woodford et al., 2004) |
| NCTC13846 | Colistin resistance MCR-1 positive strain | AMP, FOX, S10 (int), OT, CIP, ENR, NA, S3, C, CT | PHE, UK (Doumith et al., 2016) |
| NCTC13476 | Imipenem resistant | AMP, AMC, FOX, CAZ, CTX, EFT, CPD, CFQ (int), IPM, OT, CIP, ENR, NA, S3, SXT, C | PHE, UK (Giske et al., 2013) |
| BCC2 | Sequenced cow isolate | AMP, AMC (int), CTX, EFT, CPD, CFQ, ATM, S10, OT, CIP, ENR, NA, S3, SXT, C | University of Nottingham (Ibrahim et al., 2016) |
| Other Controls | |||
| J53 pMG101 | Positive control for mercury resistance and conjugation assays. | Mercury, Silver, Tellurite, AMP, C, OT, S10 | |
- Genetic Analysis
- Crude DNA Extraction
DNA for most simple PCR reactions such as gene detection (unless stated otherwise) was extracted from bacterial cultures based on the crude DNA extraction method described by Alexopoulou et al., (2006). A single colony from an overnight LBA culture was inoculated into 100 μl sterile RO water and then heated to 100°C within a heating clock for 30 minutes followed by centrifugation at 13,000 xg for 15 minutes. The supernatant was transferred to a clean 1.5 ml eppendorf for use in reactions. If extracted DNA was to be stored for use at a later date TE buffer was used as opposed to RO water, with supernatant stored at -20°C.
- Sequence Quality Genomic DNA Extraction
To extract sequence quality genomic DNA, a GenElute™ Bacterial Genomic DNA Kit (Sigma-Aldrich, Cat no. NA2110) was used.
- Polymerase Chain Reaction (PCR)
Unless stated otherwise all PCR reactions were carried in a C100™ Thermal cycler (Bio-Rad, UK) using DreamTaq Green mastermix (ThermoFisher Scientific, Cat no. K1081) containing DreamTaq DNA polymerase, 2X DreamTaq Green buffer, 0.4 mM of each dNTPs (dATP,
dCTP, dGTP and dTTP) and 4 mM MgCl2. PCRs were carried out as 25 μl reactions consisting of 12.5 μl of DreamTaq Green mastermix, 8.5 μl nuclease free water, 1 μl of the forward primer, 1 μl of the reverse primer and 2 μl of DNA. Primers were synthesised by Eurofins Genomics, Germany at a concentration of 100 pmol/μl (diluted to a working concentration of 10 pmol/μl with HPLC grade water (Fisher Scientific, Cat no. 10449380). All primers and expected product sizes relating to this section are listed in Table ?.
| Gene of Interest | Forward Primer | Reverse Primer | Expected Product Size (bp) |
| merA | ACC ATC GGC ACC TGC GT | ACC ATC GTC AGG TAG GGG AAC AA | 1694 |
| merC | CAT CGG GCT GGG CTT CTT GAG | CAT CGT TCC TTA TTC GTG TGG | 422 |
| merR | ATC CGB TTC TAT CAG CGC AAG | ACG TCC TTN RGC TTG TGC TCG | 434 |
| intI1 | CCT CCC GCA CGA TGA TC | TCC ACG CAT CGT CAG GC | 280 |
| mcr-1 | ATG ATG CAG CAT ACT TCT GTG | TCA GCG GAT GAA TGC GGT G | 1626 |
- Agarose Gel Electrophoresis
Molecular grade agarose powder (GelPilot. LE Agarose, Qiagen) was used for all gel electrophoresis analysis. Agarose powder was dissolved in 1X TAE to a desired final percent weight/volume (%w/v) of between 0.8-2 %. The solution was then melted within a microwave and cooled before ethidium bromide to a final concentration of 0.4 μg ml-1 was added. The melted agarose was then poured into a plastic casting tray containing a comb and left to set at room temperature. The comb was removed once the gel had been allowed to completely set. Gels were run with appropriate size ladders (noted in each specific section) which included a Quick-Load® Purple 100 bp DNA Ladder (NEB, Cat no. N0551S), Quick-Load® Purple 1 kb DNA Ladder (NEB, Cat no. N0552S) and a Quick-Load® 1 kb extend DNA Ladder (NEB, Cat no. N3239S).
- Mercury and Type I Integron PCR and Phenotype Assay
Only suspected transconjugants and the associated parent strains, were tested for the presence of the mercury genes merA, merC and merR along with the type I integron gene intI1. PCR conditions consisted of an initial denaturation of 95°C for 5 minutes followed by 30 cycles of 94°C for 1 minute, 64°C for 1 minute and 72°C for 2 minutes with a final extension of 72°C for 10 minutes. PCR products were run on a 1.5% agarose gel at 85V for 1 hour 20 minutes with a 100 bp ladder. Isolates confirmed as carrying the mercury genes were also subject to mercury phenotype assays. Isolates were plating on LBA containing increasing concentrations of mercury at 0 ug/ml, 10 ug/ml, 25 ug/ml and 50 ug/ml.
- Colistin Resistance Gene mcr-1 PCR
Isolates that demonstrated resistance to colistin within the disc diffusion assay were screened for the presence of the colistin resistance gene mcr-1 by adapting the protocol described by Liu et al., (2016). PCR conditions consisted of an initial denaturation of 94°C for 15 minutes followed by 25 cycles of 94°C for 30 seconds, 58°C for 1.5 minutes and 72°C for 1 minute with a final extension of 72°C for 10 minutes. PCR products were run on a 1.5% agarose gel at 80V for 35 minutes with a 1 kb ladder.
- Plasmid Incompatibility (Inc) Groups – PUT IN RESEARCH PLANNER
- Conjugation Assays
Conjugation assays were performed using mating within a liquid media and also on a solid media. Protocols for solid and liquid mating were constructed and adapted from several sources including: (Binh et al., 2008; Heuer et al., 2002; Kyselková et al., 2016; Lampkowska et al., 2008; Moura et al., 2012, 2014; Smalla et al., 2000). Recipients and donors were revived from frozen stocks and grown on non-selective LBA for a maximum of 20 hours before being used in conjugation assays. Rifampicin was used as the recipient selective agent for CV601 with various antibiotics used for donors within each assay noted in the table ?
| Donor | Donor Selective Agent and Assay no. and whether liquid or solid mating in Brackets | Recipient and Selective Agent |
| BCC2 | CTX (1 L+S), C (2 L), S10 (3 S) | CV601 + Rif |
| BCE3 | CTX (1 L+S), Hg (2 L) | CV601 + Rif |
| CWSR105 | AMP (1 L) | CV601 + Rif |
| PGFR109 | AMP (1 L) | CV601 + Rif |
| PGFR113 | AMP (1 L) | CV601 + Rif |
| PGFR114 | AMP (1 L) | CV601 + Rif |
| PGFR115 | AMP (1 L) | CV601 + Rif |
| PGFR117 | AMP (1 L) | CV601 + Rif |
| PGFR119 | AMP (1 L) | CV601 + Rif |
| PGFR120 | AMP (1 L) | CV601 + Rif |
Both solid and liquid conjugation assays were begun in the same way. Differences are noted in each individual solid and liquid section.
Liquid cultures in 10 ml LBB were prepared with appropriate antibiotics for recipient and donors separately and grown overnight at 30°C and 180 RPM. OD600 readings were taken the following morning and a 1 in 100 dilution was made in LBB with appropriate antibiotics and grown for between 2-3 hours. Readings were taken every half an hour until OD600 0.5 was achieved.
- Recipient CV601 GFP+
The recipient E. coli CV601 GFP+ conferring resistance to both kanamycin and rifampicin was obtained from Prof. Kornelia Smalla. Visualisation of the GFP within CV601 was made via wet mount under 100X oil immersion. For the conjugation assays it was decided to utilise the rifampicin resistance within CV601, as many isolates to be tested already conferred aminoglycoside resistance. Confirmation of any potential transconjugants was by colony PCR to ascertain if the chromosomally encoded gfp gene of 714 bp was present, using the GFP primers GFP-F (ATA TAG CAT GCG TAA AGG AGA AGA ACT TTT CA) and GFP-F (CTC TCA AGC TTA TTT GTA TAG TTC ATC CAT GC). PCR conditions consisted an initial denaturation of 95°C for 5 minutes followed by 30 cycles of 94°C for 1 minute, 54°C for 2 minutes and 72°C for 1 minute with a final extension at 72°C for 10 minutes. PCR products were run on a 1% agarose gel at 85V for 1 hour with a 100 bp ladder.
- Solid
(RESULTS SECTION)>The donor started an hour later than the recipient due to faster growth< A mix of 500 μl of donor and 500 μl of recipient was spreadplate onto non-selective LBA followed by overnight growth at 30°C. Solid mating plates were flooded with 5 ml MRD and mixed with a scraper, before 1 ml was extracted off and serial dilutions ranging from 100-10-5 made in MRD. Serial dilutions were then plated onto double selective LBA plates, denoted as transfer rate plates. Transfer mutation rate plates were also prepared by spread plating the diluted conjugation mix ranging from 10-2-10-4 on both recipient only selective LBA plates and donor only selective LBA plates. All plates were grown at 30°C for 48 hours with counts made following incubation.
- Liquid
A mix of 500 μl of donor and 500 μl was made within a 1.5 ml eppendorf before being centrifuged at 6,000 xg for 5 minutes. The supernatant was discarded and the pellet resuspended in 10 ml of non-selective LBB. The conjugation mix was incubated statically overnight at 30°C. The conjugation mix was centrifuged at 6,000 xg for 5 minutes and cells washed once in MRD. Serial dilutions ranging from 100-10-5 were then prepared in MRD and plated onto double selective LBA plates, denoted as transfer rate plates. Transfer mutation rate plates were also prepared by spread plating the diluted conjugation mix ranging from 10-2-10-4 on both recipient only selective LBA plates and donor only selective LBA plates. All plates were grown at 30°C for 48 hours with counts made following incubation.
- Plate Counts
A plate count for both recipient and donors was prepared from the LBB 2-3 hour culture at OD600 0.5. Serial dilutions made in LBB ranging from 10-4-10-7 were plated onto respective selective LBA plates. Plate count mutation rates were also prepared from the 2-3 hour LBB culture by plating recipient and donor onto LBA plates containing both the recipient and donor selective agent together. All plates were incubated overnight at 37°C with plate counts conducted the following day.
- Transconjugant Processing
Colonies present on the transfer plates were subject to colony PCR and patch plating. The initial round of conjugations utilising CTX as the donor selective agent were checked via PCR for the presence of the CTX gene and for presence of GFP via wet mount 100X oil immersion. Later conjugation assays utilised the GFP gene in colony PCRs as specified in section 2.8.1. Transconjugants were also subject to comparative disc assays using the method set out within section 2.6 by running parent strains alongside the transconjugants to ascertain which resistances had been carried over. All suspected transconjugants were named and stored at -80°C using the Microbank preservation system.
- New Recipient J53 AziR Mel Construction
An additional recipient strain E. coli J53 AziR was chosen to be modified, into a new recipient strain denoted as J53 AziR Mel. J53 AziR has previously been widely used within conjugation type experiments as a recipient strain. It contains a point mutation within the secA gene resulting in the resistance to sodium azide and in addition to this, it is auxotrophic for methionine (Oliver et al., 1990; Yi et al., 2012).
- pLoxGentrcmelA Expression Vector
A plasmid denoted as pLoxGentrcmelA (Figure ?) encoding the melanin gene melA under the control of the trc promoter was obtained from Sabido et al., (2013). The plasmid was received on filter paper and was prepared by applying 50 μl of sterile RO water to the filter paper. This was followed by measuring of the plasmid DNA concentration via a Nanodrop® ND-1000 Spectrophotometer (ThermoFisher, UK). Quality controlling was then carrier out by transformation of the plasmid into E. coli MG1655 competent cells followed by overnight growth at 37°C on LBA plates supplemented with 10 μg/ml gentamicin. Plates were subbed the following day into 10 ml LBB supplemented with 10 μg/ml gentamicin and grown overnight at 37 with agitation at 180 RPM.
To check for melA induction a sub of 100 μl of the LBB overnight culture was spread onto LBA plates supplemented with 10 μg/ml gentamicin and 0.04% tyrosine with the addition of 0.1mM IPTG for melA induction.
To prepare plasmid DNA, a plasmid prep was conducted using 3 ml of the LBB overnight culture with a NEB Monarch® Plasmid Miniprep Kit (NEB, Cat no. T1010). Five tubes were prepared and DNA concentration measured via a Nanodrop®.
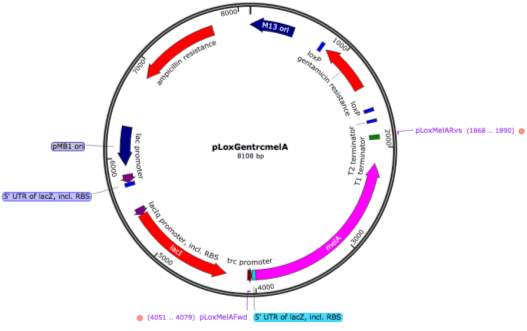
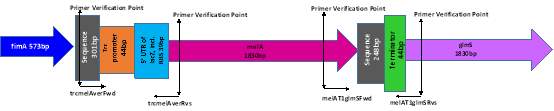
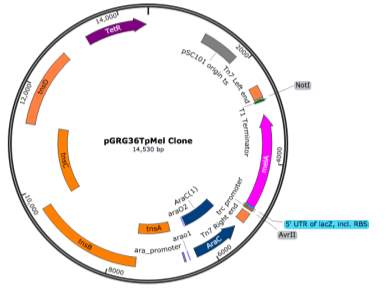
- melA Fragment PCR and Cloning
A 2,212 bp fragment denoted as pMel (Figure ?) which included the trc promoter, 5’ UTR of lacZ, melA and the T1 terminator, was isolated via PCR using the primers pLoxMelAFwd (GCT GCT CCT AGA AAT GAG CTG TTG ACA ATT AAT CAT CCG GCT C) and pLoxMelARvs (GCT GCT GCG GCC GCA CAA CAG ATA AAA CGA AAG GCC C) which are also annotated on the plasmid map in Figure ?. The restriction sites AvrII and NotI were also incorporated into the fragment to be utilised for sticky end cloning. The PCR reaction was carried with both 2X DreamTaq Green mastermix and Q5® Hot Start High-Fidelity 2X Master Mix (New England Biolabs (NEB), Cat no. M0494S). Conditions for the DreamTaq PCR consisted of an initial denaturation of 95°C for 5 minutes followed by 30 cycles of 94°C for 1 minute, 62°C for 1.5 minutes and 72°C for 2 minutes with a final extension at 72°C for 10 minutes. Conditions for the Q5 PCR consisted of an initial denaturation of 98°C for 30 seconds followed by 30 cycles of 98°C for 10 seconds, 62°C for 30 seconds and 72°C for 1 minutes 15 seconds with a final extension of 72°C for 2 minutes. PCR products were run on a 1.5% gel at 100V for 30 minutes with a 1 kb ladder.
PCR products amplified using the DreamTaq method were to be utilised for sticky end cloning with two restriction sites incorporated on either end of the fragment. Products amplified using the Q5 method were to be used for blunt ended cloning utilising the SmaI site present on the cloning vector pGRG36T (Section 2.9.1.2.)

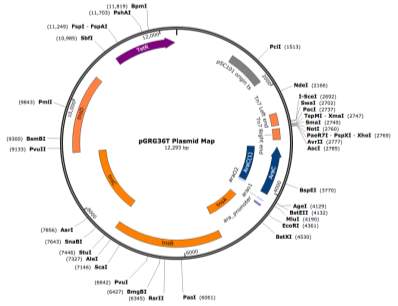
- Cloning Vector pGRG36T
The cloning vector pGRG36T (Figure ?) kindly supplied by Dr Phil Hill, was utilised as the transport mechanism for fragment Tn7 transduction to the chromosome of the target strain J53 AziR at the glmS gene, using the method previously described by McKenzie et al., (2006).
- Plasmid Preparation
pGRG36T was revived from frozen stocks on LBA supplemented with 10 μg/ml tetracycline and grown for 36 hours at 30°C. A LBB culture was prepared from the LBA plates by inoculating 2 colonies into 100 ml LBB supplemented with 10 μg/ml tetracycline followed by growth for 20 hours at 30°C and 180 RPM. Plasmid DNA was extracted using a NEB Monarch® Plasmid Miniprep Kit but with the following alterations. Aliquots of 10 x 10 ml of LBB overnight pGRG36T culture were pelleted at 4,700 RPM for 5 minutes. The supernatant was discarded and the pellet resuspended in plasmid resuspension buffer B1. The volumes of each buffer B1, B2 and B3 were doubled to accommodate the larger starting volume of culture. All other steps within the protocol supplied with the kit remained unchanged. The DNA was eluted from the column within 30 μl of prewarmed elution buffer and DNA concentration measured using a Nanodrop®.
- SmaI Digestion for Blunt Ended Cloning
Blunt ended cloning of the pMel fragment into pGRG36T was carried out by digesting pGRG36T with the restriction enzyme SmaI (NEB, Cat no. R0141S). A reaction volume of 50 μl was set up, containing 5 μl 10X CutSmart Buffer (NEB, Cat no. B7204S), ½ μl SmaI restriction enzyme, 20 μl pGRG36T plasmid DNA and 24 ½ μl HPLC grade water. The reaction was incubated statically at 25°C for 2 hours followed by a clean-up using a NEB Monarch® PCR & DNA Cleanup Kit (NEB, Cat no. T1030). A 2:1 buffer to reaction ratio was used and 20 μl was eluted through the column with prewarmed elution buffer, followed by measuring of DNA concentration via a Nanodrop®.
- Ligation
A ligation reaction was set up at a 5:1 insert: vector ratio, within a reaction volume of 20 μl containing 2 μl 10X T4 DNA Ligase Reaction Buffer (NEB, Cat no. B0202S), 1 μl T4 Ligase Enzyme (NEB, Cat no. M0202S), 2 μl pGRG36T plasmid DNA, 10 μl pMel insert and 5 μl HPLC grade water. The ligation mix was incubated statically overnight at 16°C followed by inactivation of the enzyme via incubation at 65°C for 20 minutes.
2.9.1.2.4. J53 AziR Electrocompetent Cells
Electrocompetent cells were prepared by inoculating a single colony from a fresh LBA J53 AziR overnight culture into 10 ml of LBB followed by growth overnight at 37°C and 180 RPM. A 1:100 dilution of the overnight culture into 5 ml was made using SB, followed by incubation for ~3 hours to achieve an OD600 of around 0.2 – 0.6. The culture was placed on ice for ~10 minutes before being pelleted at 16,000 xg for 30 seconds at 4°C and resuspended in 1 ml ice cold 10% glycerol. This step was repeated once with a final centrifuge and resuspension in 40 μl of ice cold 10% glycerol. Cells were placed on ice until required.
1 μl of ligation mix was added to 40 μl of competent cells within 2 mm electroporation cuvette (Flowgen Bioscience, SLS, Cat no. FBR-202) pre-chilled to -20°C. This was then electroporated within an Eppendorf Electroporator 2510 at 2.5 V, 200 Ω and 25 μF followed by immediate addition of 0.5 ml LBB (pre-warmed to 37°C) to the electroporation cuvette. The transformation mix was then incubated for 1 hour at 37°C and 180 RPM followed by plating on LBA supplemented with 10 μg/ml tetracycline in volumes of 10 μl, 50 μl, 100 μl and 300 μl. Plates were incubated for 48 hours at 30°C and resulting colonies streaked out onto LBA supplemented with 10 μg/ml tetracycline followed by growth at 30°C for 24-48 hours. A 10 ml LBB culture supplemented with 10 μg/ml tetracycline was also prepared from each streak and was incubated at 30°C and 180 RPM.
2.9.1.2.5. Tn7 Transduction to the glmS Gene.
Following the protocol of McKenzie et al., (2006), serial dilutions ranging from 100-10-6 were prepared from the streak plates from the previous section with 100 μl plated onto non-selective LBA with growth overnight at 42°C. This step was required to induce transduction of the pMel fragment to the chromosome at glmS gene by curing the plasmid pGRG36T. Plates were restreaked once followed by growth at 42°C to ensure loss of the plasmid. Colony PCR was then carried out using two the sets of primers pLoxMelAFwd (GCT GCT CCT AGA AAT GAG CTG TTG ACA ATT AAT CAT CCG GCT C) and pLoxMelARvs (GCT GCT GCG GCC GCA CAA CAG ATA AAA CGA AAG GCC C) that bind short segments at either end of the fragment as shown in figure ?.
A PCR mix was set up as a 25 μl reaction consisting of 12.5 μl of DreamTaq Green mastermix, 10.5 μl of HPLC grade water and 1 μl of each primer. Bacteria DNA was added to the mastermix by touching a single colony from the streak plates with an inoculation loop, which was first spread onto an LBA plate to produce a patchplate followed by immersion into the PCR mix. PCR conditions consisted of an initial denaturation of 95°C for 1 minute followed by 30 cycles of 95°C for 30 seconds, 58°C for 30 seconds and 72°C for 30 seconds with a final extension of 72°C for 5 minutes. The PCR products were visualised by gel electrophoresis using a 2% gel run at 100 V for 1 hour with a NEB Quick-Load® Purple 100 bp ladder (NEB, Cat no. N0551S). Bands visualised on the gel at the correct size where cross-matched to the patchplate and frozen down using the Microbank preservation system and named as J53 AziR Mel (with the addition of the number from the patchplate).
A final confirmation of successful transformation to test melanin production, was made by streaking from the patchplate onto LBA supplemented with 0.04% tyrosine with the addition of 0.1mM IPTG for melA induction with growth overnight at 30°C.
- Plasmid Analysis
Two isolates BCE1T and BCE2T identified as transconjugants from successful conjugation assays conducted by Delveen Ibrahim and kindly donated by Jon Hobman and Christine Dodd, were subject to further detailed analysis. Analysis included plasmid DNA isolation, accurate plasmid sizing via pulsed field gel electrophoresis (PFGE) and sequencing.
- Plasmid DNA Isolation
Plasmid DNA was isolated from the transconjugant BCE2T using a Qiagen Large Construct Kit (Qiagen, Cat no. 12462). A 5 ml starter culture of LBB containing 2 ug/ml CTX (the antibiotic used within the conjugation assay as the donor selective agent), was inoculated with a single BCE2T colony from a fresh LBA plate and incubated for 8 hours at 37°C and 200 RPM. A subculture of 1 ml was made into 500 ml LBB with selection within a 2 L Erlenmeyer flask, grown at 37°C for ~16 hours. Cells were harvested the following day within 500 ml Beckman centrifuge tubes at 6,000 xg for 15 minutes at 4°C within a Beckman J2-21 centrifuge and a JA-10 Beckman rotor. The Qiagen protocol was then followed until DNA elution at point 19. The 30 ml centrifuge tube was left horizontal with 200 μl TE buffer overnight at room temperature. The DNA concentration was then measured using a Nanodrop® and stored at -20°C.
- PCR Confirmation for ctx Gene
To confirm the DNA extracted from BCE2T by the large construct kit was the plasmid of interest, the DNA was subject to a PCR to check for the presence of the 592 bp ctx gene using the primers CTX-M-F (ATG TGC AGY ACC AGT AAR GTK ATG GC) and CTX-M-R (TGG GTR AAR TAR GTS ACC AGA AYS AGC GG). PCR conditions consisted of an initial denaturation of 94°C for 5 minutes followed by 30 cycles of 94°C for 30 seconds, 55°C for seconds and 72°C for 1 minutes with a final extension of 72°C for 7 minutes. PCR products were run on a 1% gel at 85V for 1 hour with a 1 kb DNA Ladder.
- PFGE
Pulse field gel electrophoresis (PFGE) was used to determine accurate plasmid sizes by utilising a NEB Lambda PFG ladder (NEB, Cat no. N0341S). The PFGE protocol was adapted from Hooton et al., (2011). PFGE plugs were prepared by mixing equal volumes of fresh overnight culture with molten 1.2% PFGE grade agarose (Biorad, USA) to a final volume of 120 μl. An additional plug was also prepared using plasmid DNA isolated from BEC2T using the large construct kit from section 2.10.1. The mixture was transferred to a casting tray and left to solidify for ~20 – 30 minutes. The set plugs were then transferred to 1 ml lysis buffer consisting of 100 μg/mL proteinase K, 50 mM Tris–HCl at pH 8, 50 mM EDTA and 1% N-lauroyl sarcosine and incubated for 2 hours at 55°C. Plugs were washed 4 times in TE buffer consisting of 20 mM Tris–HCl at pH 8 and 50 mM EDTA at 50°C for 15 minutes. Prior to preparing PFGE gel, plugs were placed at 4°C for 5 minutes for plug stability. A 1% PFGE agarose gel was prepared with 1X TAE buffer, poured into a casting tray and left to set. Each plug was prepared by taking a 3 mm slice before loading onto the gel. A Lambda PFG ladder was also loaded onto the gel before each lane was sealed using 1% molten agarose. The gel was run over 17 hours at 6 V/cm with 2 L pre-chilled 1X TAE buffer circulated at 14°C using a CHEF-DR II system. The PFGE gel was first stained with ethidium bromide before being visualised using a Biorad Image Capture (Biorad, USA). Plasmid sizes were estimated by comparison with the markers of the Lambda ladder present on the gel picture.
- Capsule Analysis
Isolates suspected of encoding a capsule were subject to further analysis including capsule staining and string tests conducted over several days.
- Capsule Staining
Capsule staining was carried out by negative staining using congo red and crystal violet dyes. A drop of 10 μl of congo red dye was placed on a microscope slide, a single colony was smeared into the dye and a second slide spread over the mixture to produce a thin film on the slide. The slide was then left to air dry before being flooded with crystal violet dye. The slide was left at a 45 degree angle to air dry and allow the excess crystal violet to run off. Once the slide was dry it was visualised microscopically under oil immersion at 100X.
- String Test
The string test was carried out on strains suspected of being encapsulated, which included two confirmed transconjugants, BCE1T and BCE2T and the respective parent strains BCE1 and BCE2. Another strain BCC2, confirmed as being encapsulated from sequence data analysis was also tested. A positive string test results from the ability of a single colony to be stretch >5 mm when touched with an inoculation loop (Shon et al., 2013). String tests were carried out from fresh overnight cultures on LBA grown at 37°C. Plates were stored at 4°C and string tests were repeated daily for 3 days and then again following over weekend storage at 4°C. Cell morphology was also noted each day.
- Sequence Analysis
Sequence analysis was carried out on isolates where sequence data was available. Extensive sequence analysis was carried out on isolates BCC2, BCE3 and BS7, to isolate possible plasmid sequences, resistance genes and virulence factors.
- Artemis and NCBI
Artemis was the principal program used to analyses sequence data with genes individually annotated using the NCBI database BLAST software.
- Plasmid Spades
- Capsule serotyping
- E. coli isolation, Gene Screening and Storage
- Introduction
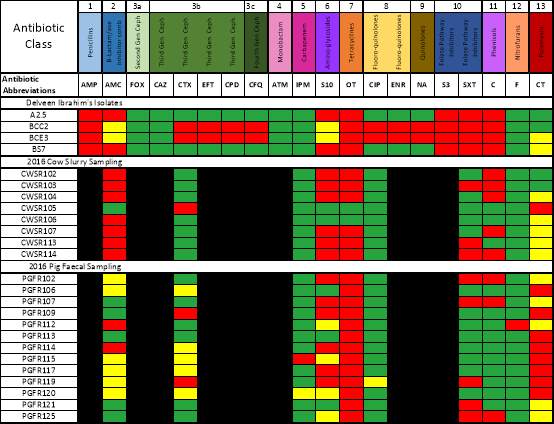
The spreading of animal manure onto agricultural land is a common practice within UK farming allowing up to 70% of the undigested nutrient minerals to be utilised as a fertiliser (Martinez et al., 2009). Manure management is variable dependent upon the livestock but often animals kept within high production facilities sometimes referred to as ‘mega-farms’ (Schmalzried et al., 2010) such as those housing dairy herds, have barn floors mechanically cleaned via a scraping system that separates liquids from solids (Leach et al., 2015). The liquid slurry is stored within large slurry tanks or lagoons in readiness to be spread onto land. Waste management of other substances produced from animal husbandry, which includes not only manure but also mastitic milk and antimicrobial footbath contents, may also be disposed of within slurry tanks. Antibiotic residues enter the slurry tank system in a number of ways, which are dependent upon administration of the drug to the animal. Within dairy cattle the principle cause of infection is due to bovine mastitis with antibiotics administered directly into the udder (Brunton et al., 2012; Call et al., 2013). Milk produced from mastitic cows treated with antibiotics, is classed as unfit for human consumption and is subsequently disposed of, often without pre-treatment such as fermentation (Brunton et al., 2012). Pigs in comparison are often treated orally with antibiotics, with post-weaning diarrhoea being a common cause (Burow et al., 2014; Fairbrother et al., 2005). It has been shown that antibiotics are commonly excreted within faeces due to poor absorption within the animal gut (Boxall et al., 2004). Both of these examples demonstrate a possible route for antibiotics and potentially pathogenic bacteria into the slurry tank system. The E. coli isolates previously characterised by Ibrahim et al., (2016) were isolated from different areas of a UK dairy farm and where found to be carrying a number of resistances that included extended spectrum beta lactamases (ESBL). In 2016, 26 cow liquid slurry isolates and 26 solid faecal pig isolates were sampled and subjected to disc diffusion assays and screening for mercury and type I integron genes. A very brief analysis was made against these isolates with only 10 antibiotics used for this screening, which resulted in 8 cow slurry isolates and 13 pig faecal isolates being frozen down. Future analysis to determine if cephalosporin resistance is still present will be conducted at a later date. Due to the availability of sequence data, experimental work has been focussed on the isolates sampled by Ibrahim et al., (2016) A2.5, BCC2, BCE3 and BS7.
- Results
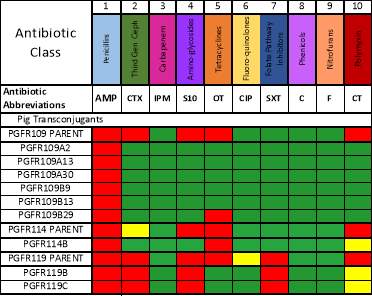
- Resistance profiles
The colour coded figure ? details the disc diffusion results for isolates A2.5, BCC2, BCE3 and BS7 sampled by Ibrahim et al., (2016) and also the cow slurry and pig faecal isolates sampled in 2016 with each antibiotic detailed on the top row. Red denotes resistance, yellow intermediate resistance and green susceptible. Any columns in black, denote antibiotics that were not tested against that particular isolate. When making a comparison of the isolates A2.5, BCC2, BCE3 and BS7 with the more recent cow slurry 2016 samplings, it should be noted that a block of resistance appears to still be present which includes S10, OT and AMC. Resistance to CTX however is almost entirely absent. Antibiotic regimes employed can have an effect on the occurrence of ESBLs. A study by Snow et al., (2012) revealed that use of 3rd and 4th generation cephalosporins, even within the last 12 months could increase the presence of ESBL E. coli by 4 times within a dairy farm.
The pig samples all show resistance to tetracycline, a commonly administered antibiotic used to treat pigs with post-weaning diarrhoeal disease (Casewell et al., 2003).
- Discussion
Regular contact with the UK dairy farm where sampling was taken, allows this study to incorporate fluctuations in resistance with antibiotic usage on the farm. Regular samplings have been taken and future work will look to make comparables with usage and antibiotic resistance fluctuation.
- Conjugation Assays
- Introduction
- Results
- BCC2 and BCE3
Conjugation assays initially attempted with E. coli isolates BCC2 and BCE3 using the donor selective agent CTX and the recipient CV601 with rifampicin, produced 9 transconjugants for BCE3 and 2 for BCC2. Visualisation of the GFP for each of the transconjugants via wet mount using 100X oil immersion was unsuccessful. But other analysis such as CTX, mercury and intI1 PCR gave positive results for all transconjugants. Comparative disc assays also gave results that would indicate all resistances from the parent strains had been carried over into the transconjugants. However, upon receipt of the GFP primers detailed in section 2.8.1. all suspected transconjugants were subject to PCR analysis. The results revealed that all the suspected BCC2 and BCE3 transconjugants were in fact not true transconjugants as the gfp was absent.
Further assays attempted with BCC2 and BCE3 following sequence analysis to try to isolate areas of sequence identified as being potential plasmids (as detailed in section 6) also resulted in false transconjugants identified as mutated donors due to the absence of the gfp gene.
- Pig Isolates and Cow Isolates from 2016 Sampling
Transconjugants resulting from conjugation assays using the cow isolate CWSR105 and pig isolates PGFR109, PGFR113, PGFR114, PGFR115, PGFR117, PGFR119 and PGFR120 were patchplate and confirmed via colony PCR for the presence of the gfp gene. The figures ?, ?, ? and ? detail the positive gel results. Patchplate numbers for the PGFR109 transconjugants were incorporated into the transconjugant names listed in Table ?
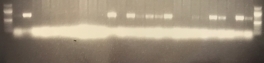
Figure ? GFP PCR for PGFR109 Transconjugants. Lane 1 100 bp ladder, Lanes 2 -27 patchplate numbers A1 –A26, lane 28 100 bp ladder. |
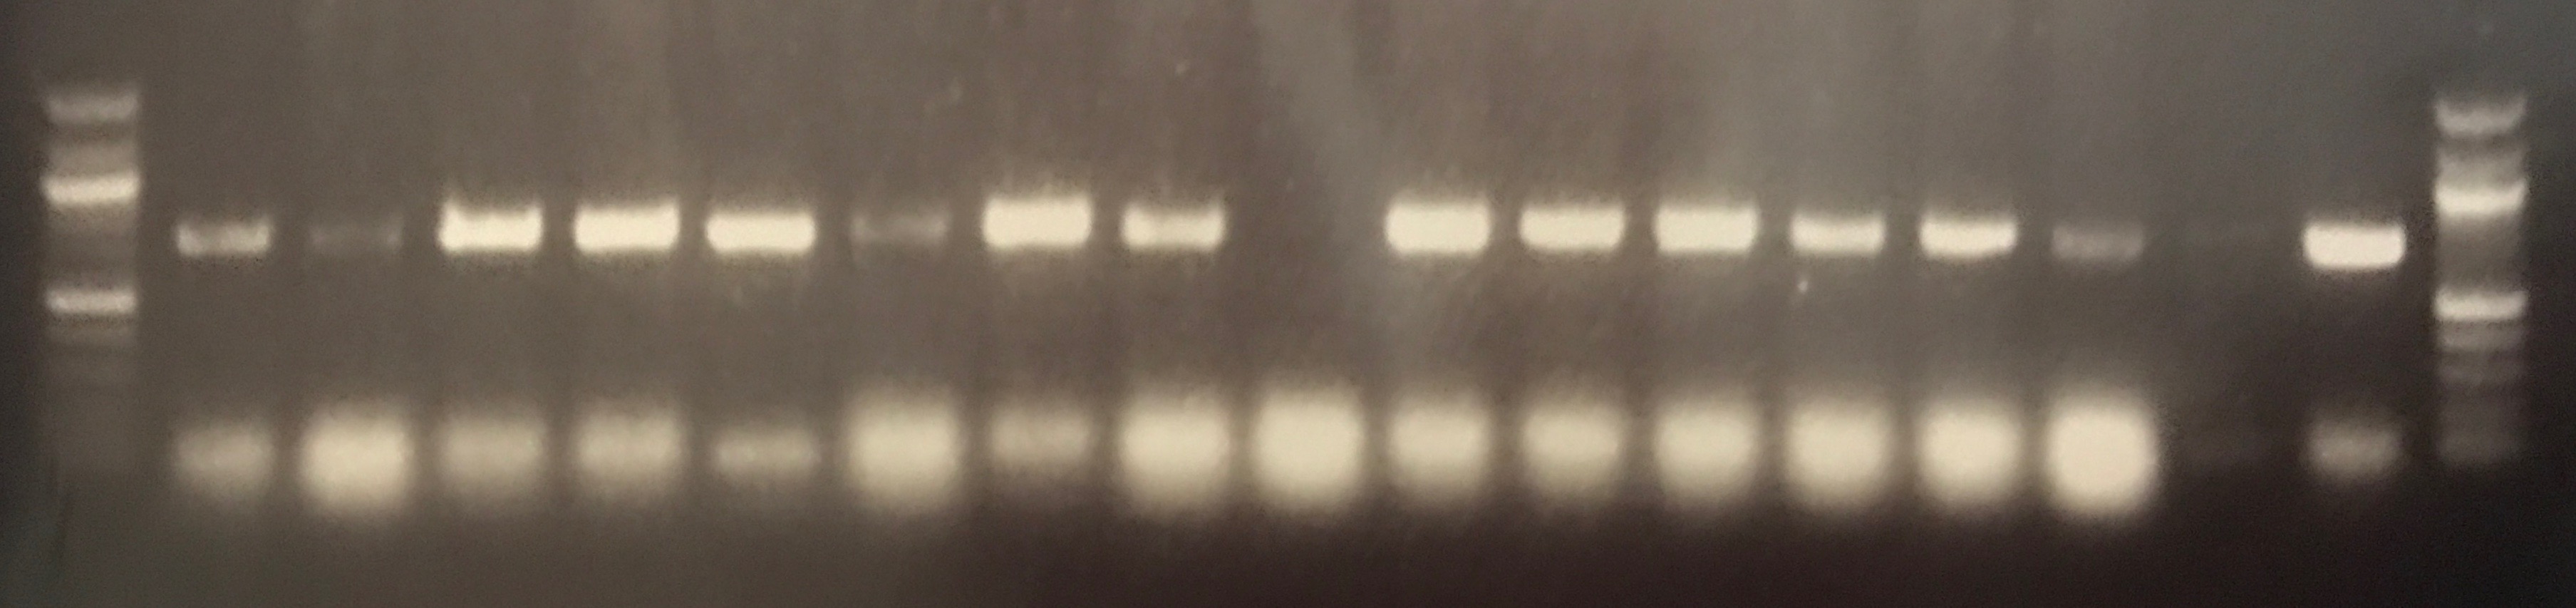
Figure ? GFP PCR for PGFR109 Transconjugants. Lane 1 100 bp ladder, lanes 2 – 8 patchplate numbers A27 – A33 lanes 9 – 16 patchplate number B27 – B34, lane 17 H2O –ve control, lane 18 CV601 +ve control, lane 19 100 bp ladder. |
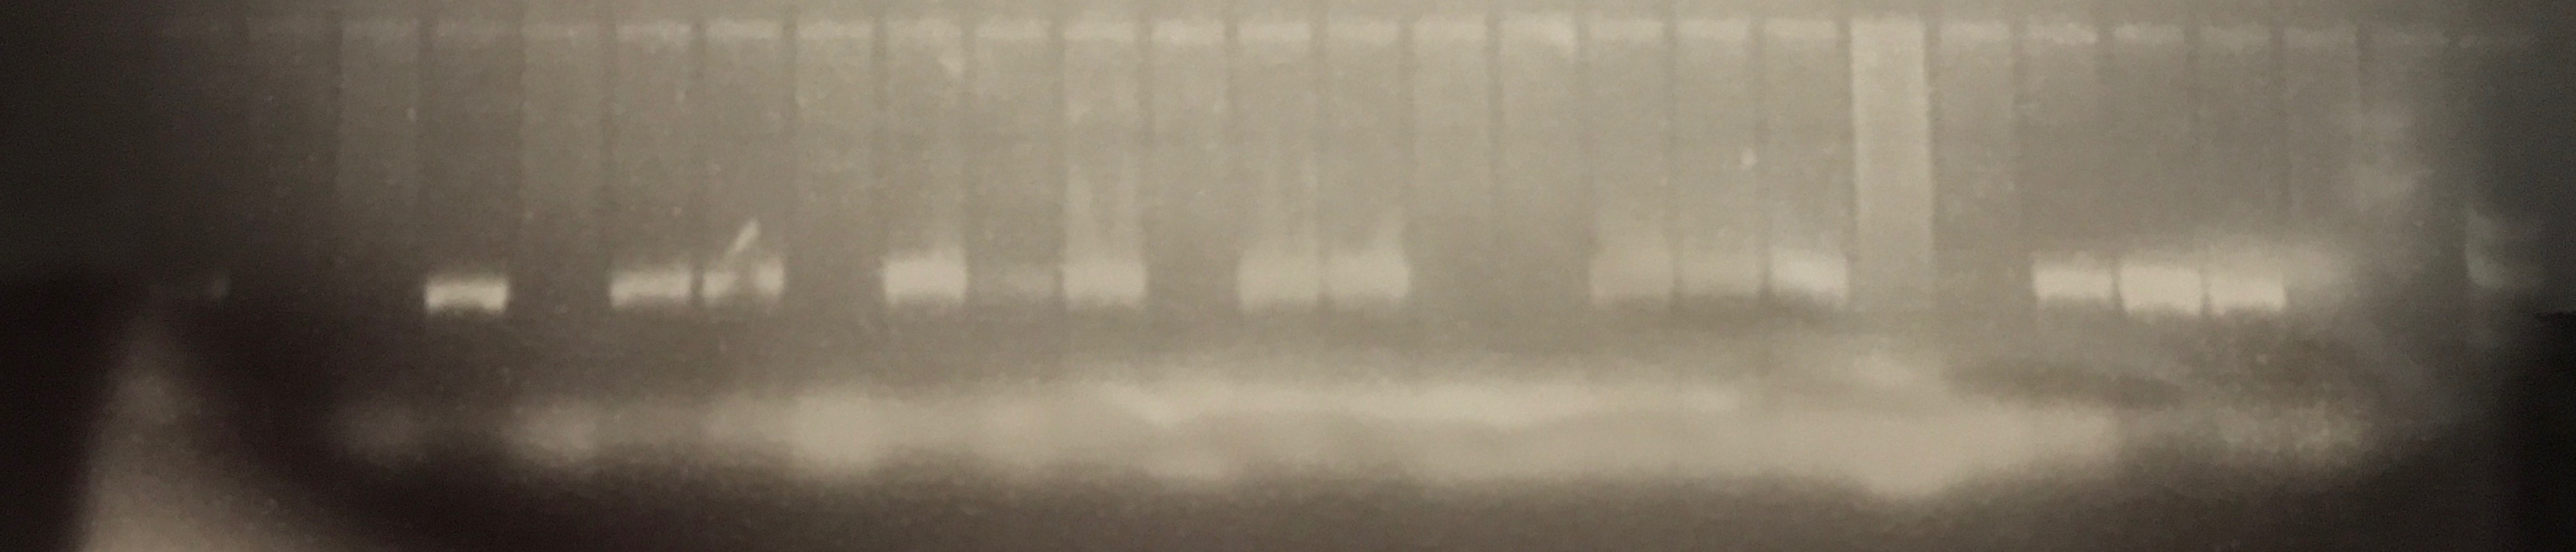
Figure ? GFP PCR for PGFR109 Transconjugants. Lane 1 100 bp ladder, Lanes 2 – 27 patchplate numbers B1 – B26, lane 28 100 bp ladder. |
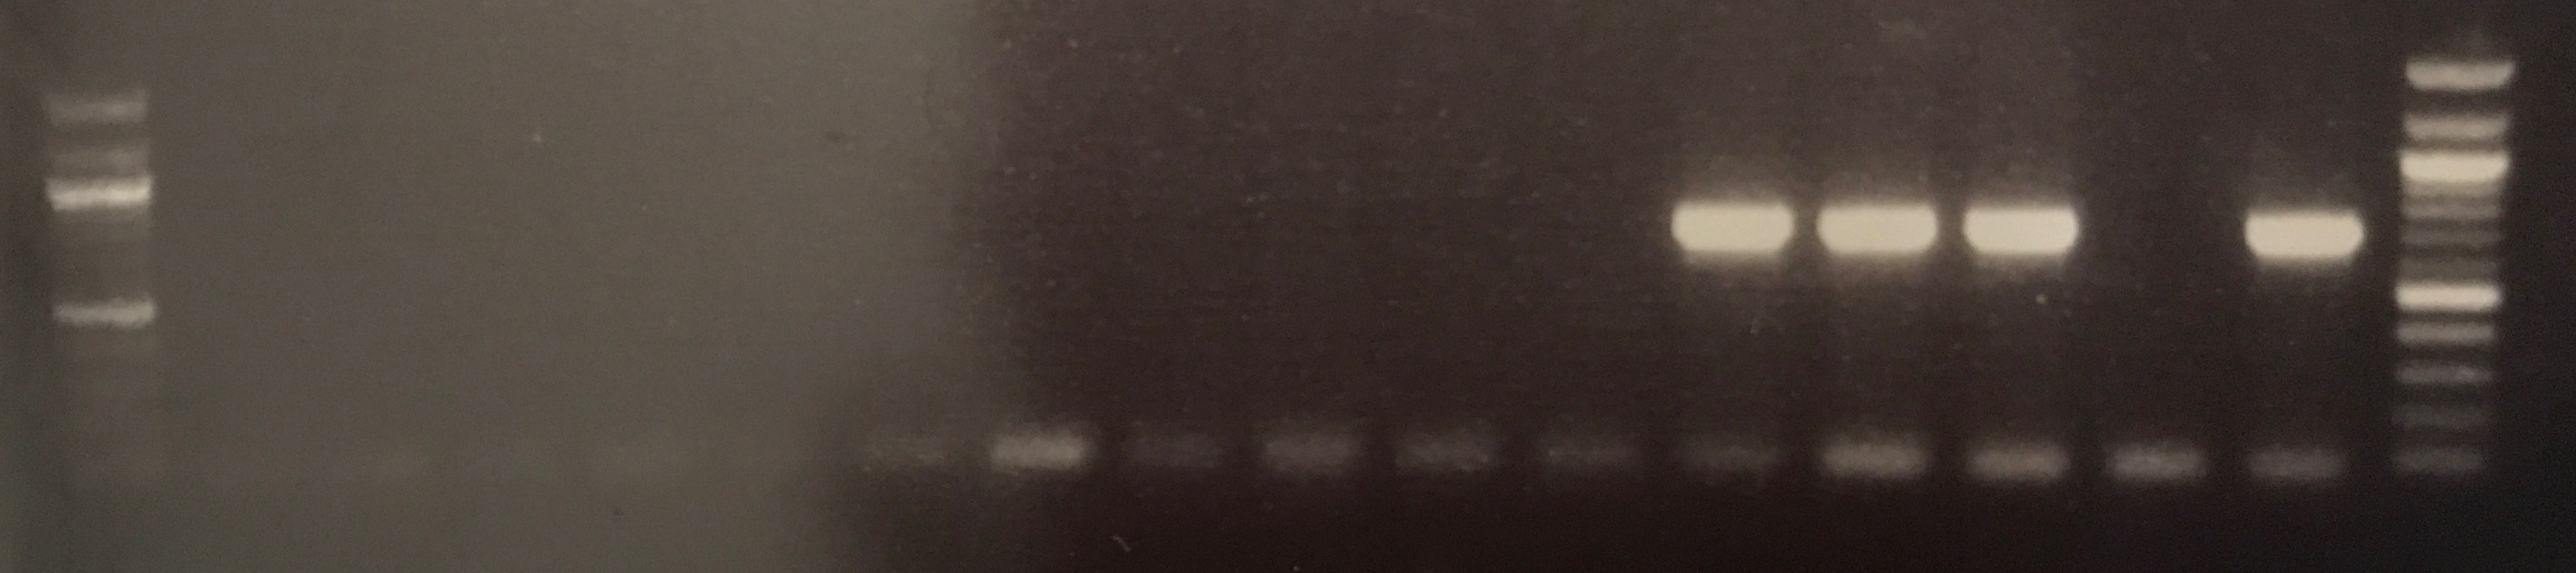
Figure ? GFP PCR for BCE3, BCC2, PGFR114 and PGFR119 transconjugants. Lane 1 100 bp ladder, lanes 2 – 10 BCE3 transconjugants, lanes 11 – 12 BCC2 transconjugants, lane 13 PGFR114B, lane 14 PGRF119B, lane 15 PGFR119C, lane 16 H2O –ve control, lane 17 CV601 +ve control, lane 19 100 bp ladder. |
| Parent Strain | Transconjugant | Gel Figure and Gel Lane |
| PGFR109 | PGFR109A2 | Figure ? Lane 3 |
| PGFR109 | PGFR109A13 | Figure ? Lane 14 |
| PGFR109 | PGFR109A30 | Figure ? Lane 5 |
| PGFR109 | PGFR109B9 | Figure ? Lane 10 |
| PGFR109 | PGFR109B13 | Figure ? Lane 14 |
| PGFR109 | PGFR109B29 | Figure ? Lane 11 |
| PGFR114 | PGFR114B | Figure ? Lane 13 |
| PGFR119 | PGFR119B | Figure ? Lane 14 |
| PGFR119 | PGFR119C | Figure ? Lane 15 |
Comparable disc assays were also performed for each transconjugant seen in figure ?.
The disc assay results detailed in figure ? show that AMP has been transferred within all the PGFR109 transconjugants with PGFR109B29 and PGFR114B also transferring both AMP and OT. These similarities within resistance transfer could indicate similar plasmids within these transconjugants. PGFR119B and PGFR119C showed different resistance transfer pictures as they also transferred AMP but in addition to CTX, S10 and SXT, possibly signifying a different plasmid. No further analysis has been undertaken with these transconjugants. However, they have been included within this analysis, as these transconjugants were the only successful results from the conjugation assays. These results therefore, give an indication of assay effectiveness and show the recipient CV601 was working correctly.
- Recipients
- CV601 GFP+
CV601 was chosen as a recipient as several studies have given an indication of its effectiveness as a recipient by utilising both the rifampicin and GFP markers encoded by it. Initial quality control tests following the protocol set out by <REF> however failed to visualise the GFP via a UV handy lamp. The only visualisation method that was positive was a wet mount slide under 100X oil immersion. Receipt of the GFP primers did give another method for checking transconjugants, however this method was time consuming and very challenging when a large number of transconjugants were present. Another potential problem arose when it was discovered that the plasmid within BCC2 encoded the toxin system PemKI, a type II toxin-antitoxin (TA) system that is involved in post-segregational killing through the actions of the endoribonuclease toxin PemK. PemI a homologue of the chromosomally encoded MazE acts a suppressor of the toxin PemK preventing cell death (Masuda et al., 1993; Zhang et al., 2004). Rifampicin has been shown to induce MazF mediated cell death by inhibiting expression of the antitoxin MazE (Kolodkin-Gal et al., 2008; Sat et al., 2001). PemK toxin induction via rifampicin however has not been proven experimentally, but this could be another factor that is featuring in conjugation failure. It was therefore decided to find another method for transconjugant identification due to the many problems associated with CV601.
- New Recipient Build J53 AziR Mel
It was decided that a visual identification tool was needed to accurately isolate true transconjugants from mutated donors from a transfer plate of mixed colonies. A colour indicator was suggested and the plasmid denoted as pLoxGentrcmelA containing the melA gene that results in brown colonies, was decided as a good mechanism to use within a new recipient strain. Brown colonies resulting from melanin induction could easily be visually identified from colonies without pigment.
The 2,212 bp fragment denoted as pMel was successfully extracted from the pLoxGentrcmelA plasmid via PCR using both DreamTaq Green and Q5 master mixes. The gel electrophoresis results are shown in figures ? and ? detail bands a the correct height.
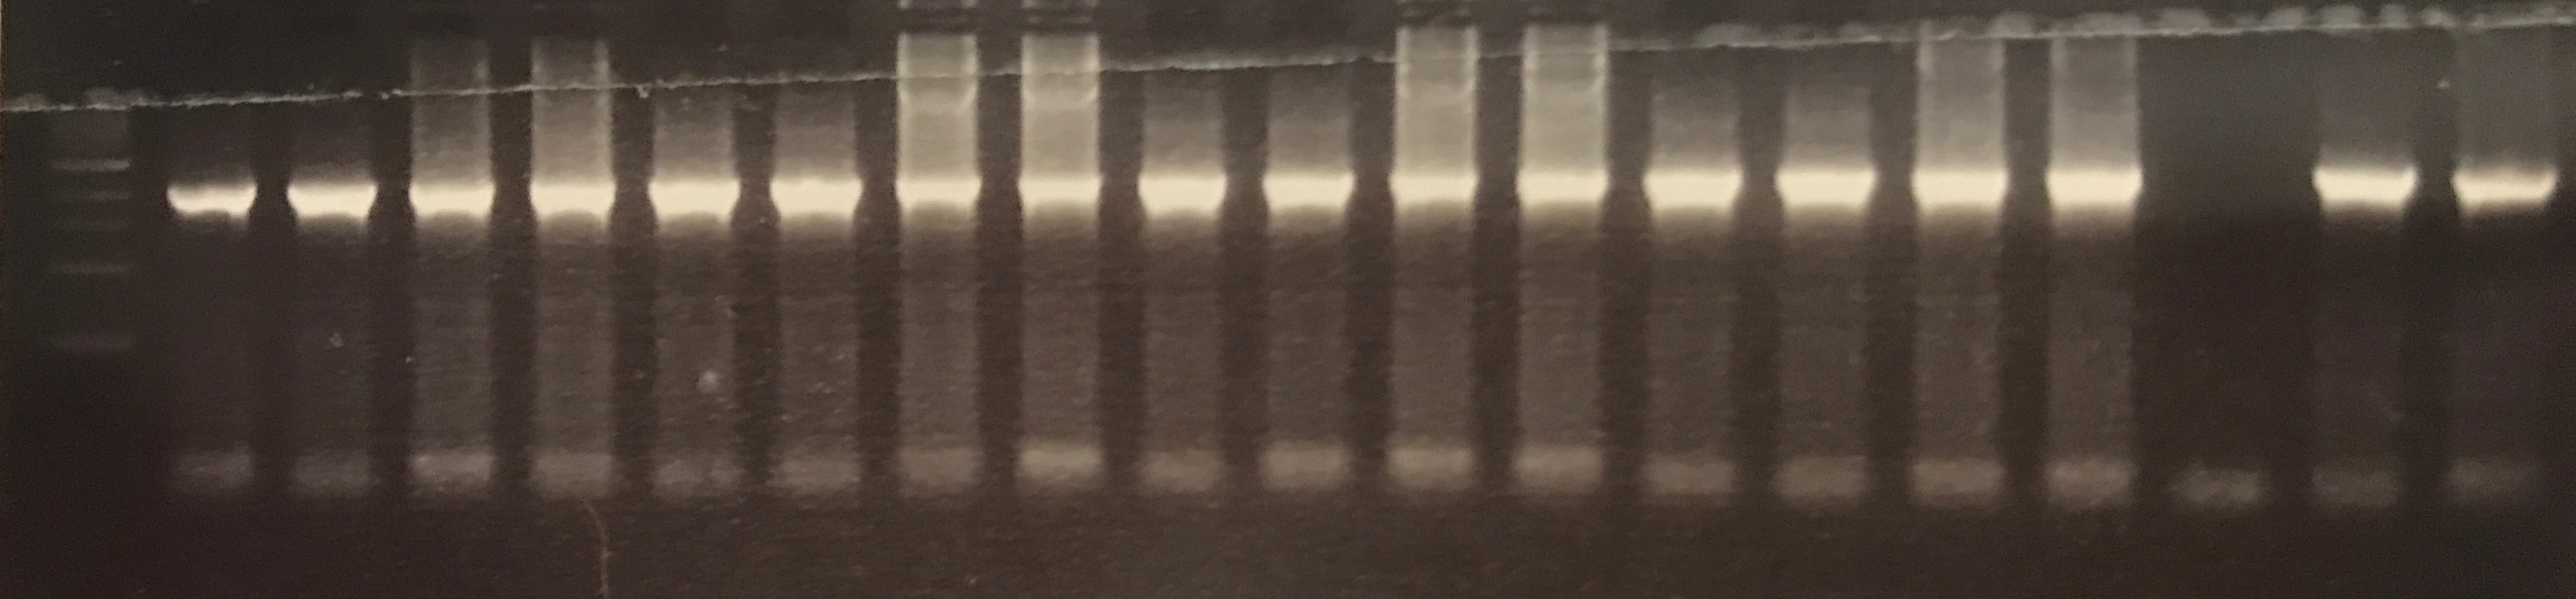
Figure ? DreamTaq Green amplification of the 2, 212 bp pMel fragments.
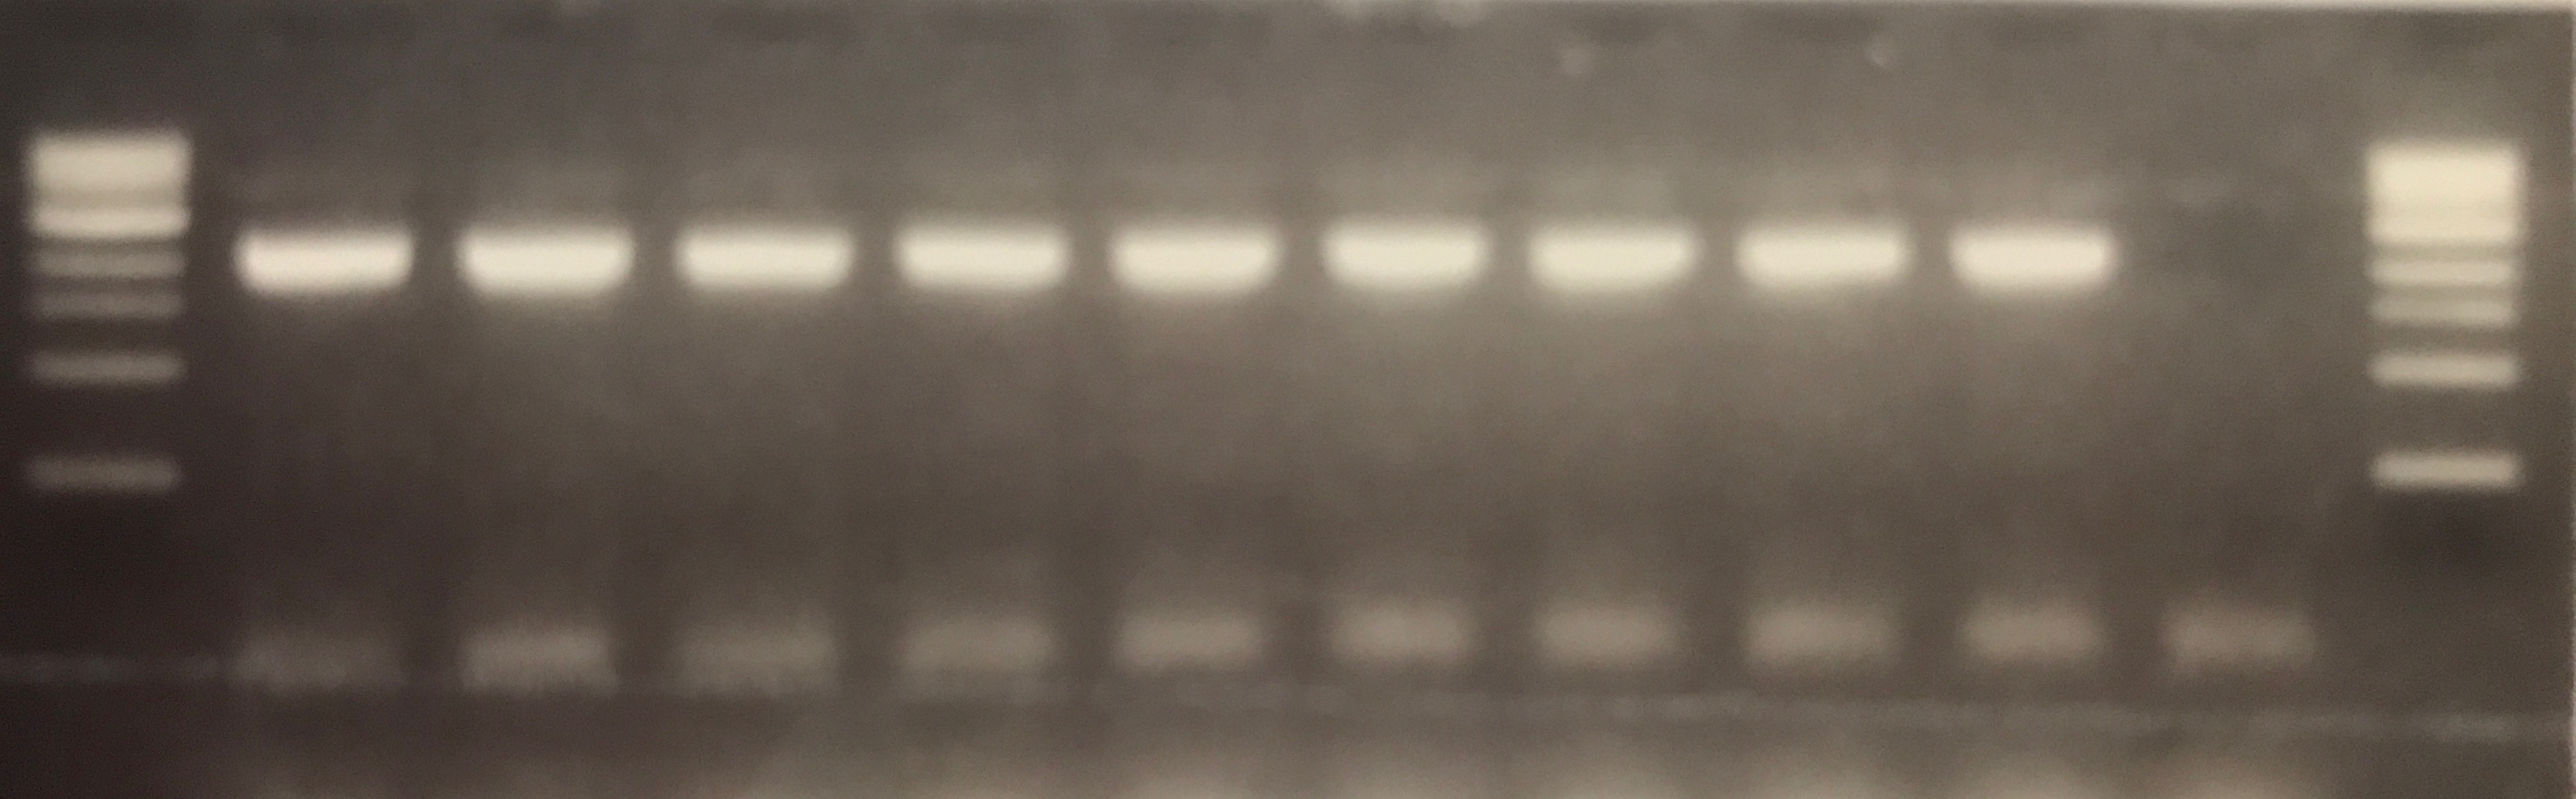
Figure ? Q5 amplification of the 2, 212 bp pMel fragments.
pGRG36T was successfully digested with the restriction enzyme SmaI and the pMel fragment was ligated into the vector as shown in the representation in figure ?.
A representation of the ligated fragment within pGRG36T can be seen in Figure ?
Following transformation into J53 AziR competent cells, growth at 37°C and then subculturing at 42°C the plasmid was cured from the strain and the fragment delivered to the glmS via Tn7 transduction. Initial PCR checking of fragment direction and correct placement as detailed in section 2.9.1.2.5. and the figure ? produced an unclear gel picture and this will need to be conducted again. The melA induction will also need to be analysed by growing the new recipient strain on LBA containing IPTG. It is hoped that using this new recipient will allow quicker identification of true transconjugants, which will allow a greater number of isolates to be used in conjugation assays due to time saved.
- Plasmid Detailed Analysis
Transconjugants BCE1T and BCE2T from conjugation assays conducted by Delveen Ibrahim were subject to further analysis to ascertain relative size and to isolate sequence quality DNA.
- Isolation of Large Low copy Number Plasmids
Plasmid DNA for transconjugant BCE2T was successfully extracted and concentration was measured at 21.9 ng/ul, the extraction of BCE1T was unsuccessfully as the initial 500 ml culture failed to grow. The gel electrophoresis picture in figure ? shows the CTX gene is present in both lanes containing BCE2T DNA. This would suggest the DNA yielded by the large construct kit is the plasmid DNA of interest, as CTX was used in the initial conjugation assay to isolate the plasmid.
- Accurate Sizing of Plasmids using PFGE
The PFGE gel shown in figure ?, shows a positive result within the lane containing BCE2T DNA. As this product was circular DNA, this would only give an estimated size of around 48 kb. S1 nuclease linearization followed by subsequent PFGE would give a more accurate result, as the product would be linear. The other lanes on the PFGE containing the overnight cultures failed to give a result. From this initial gel it would appear isolating plasmid DNA prior to loading into a PFGE plug might give a better result over using culture and in well lysis.

339.5 291.0 242.5 194.0 145.5 97.0 48.5 |
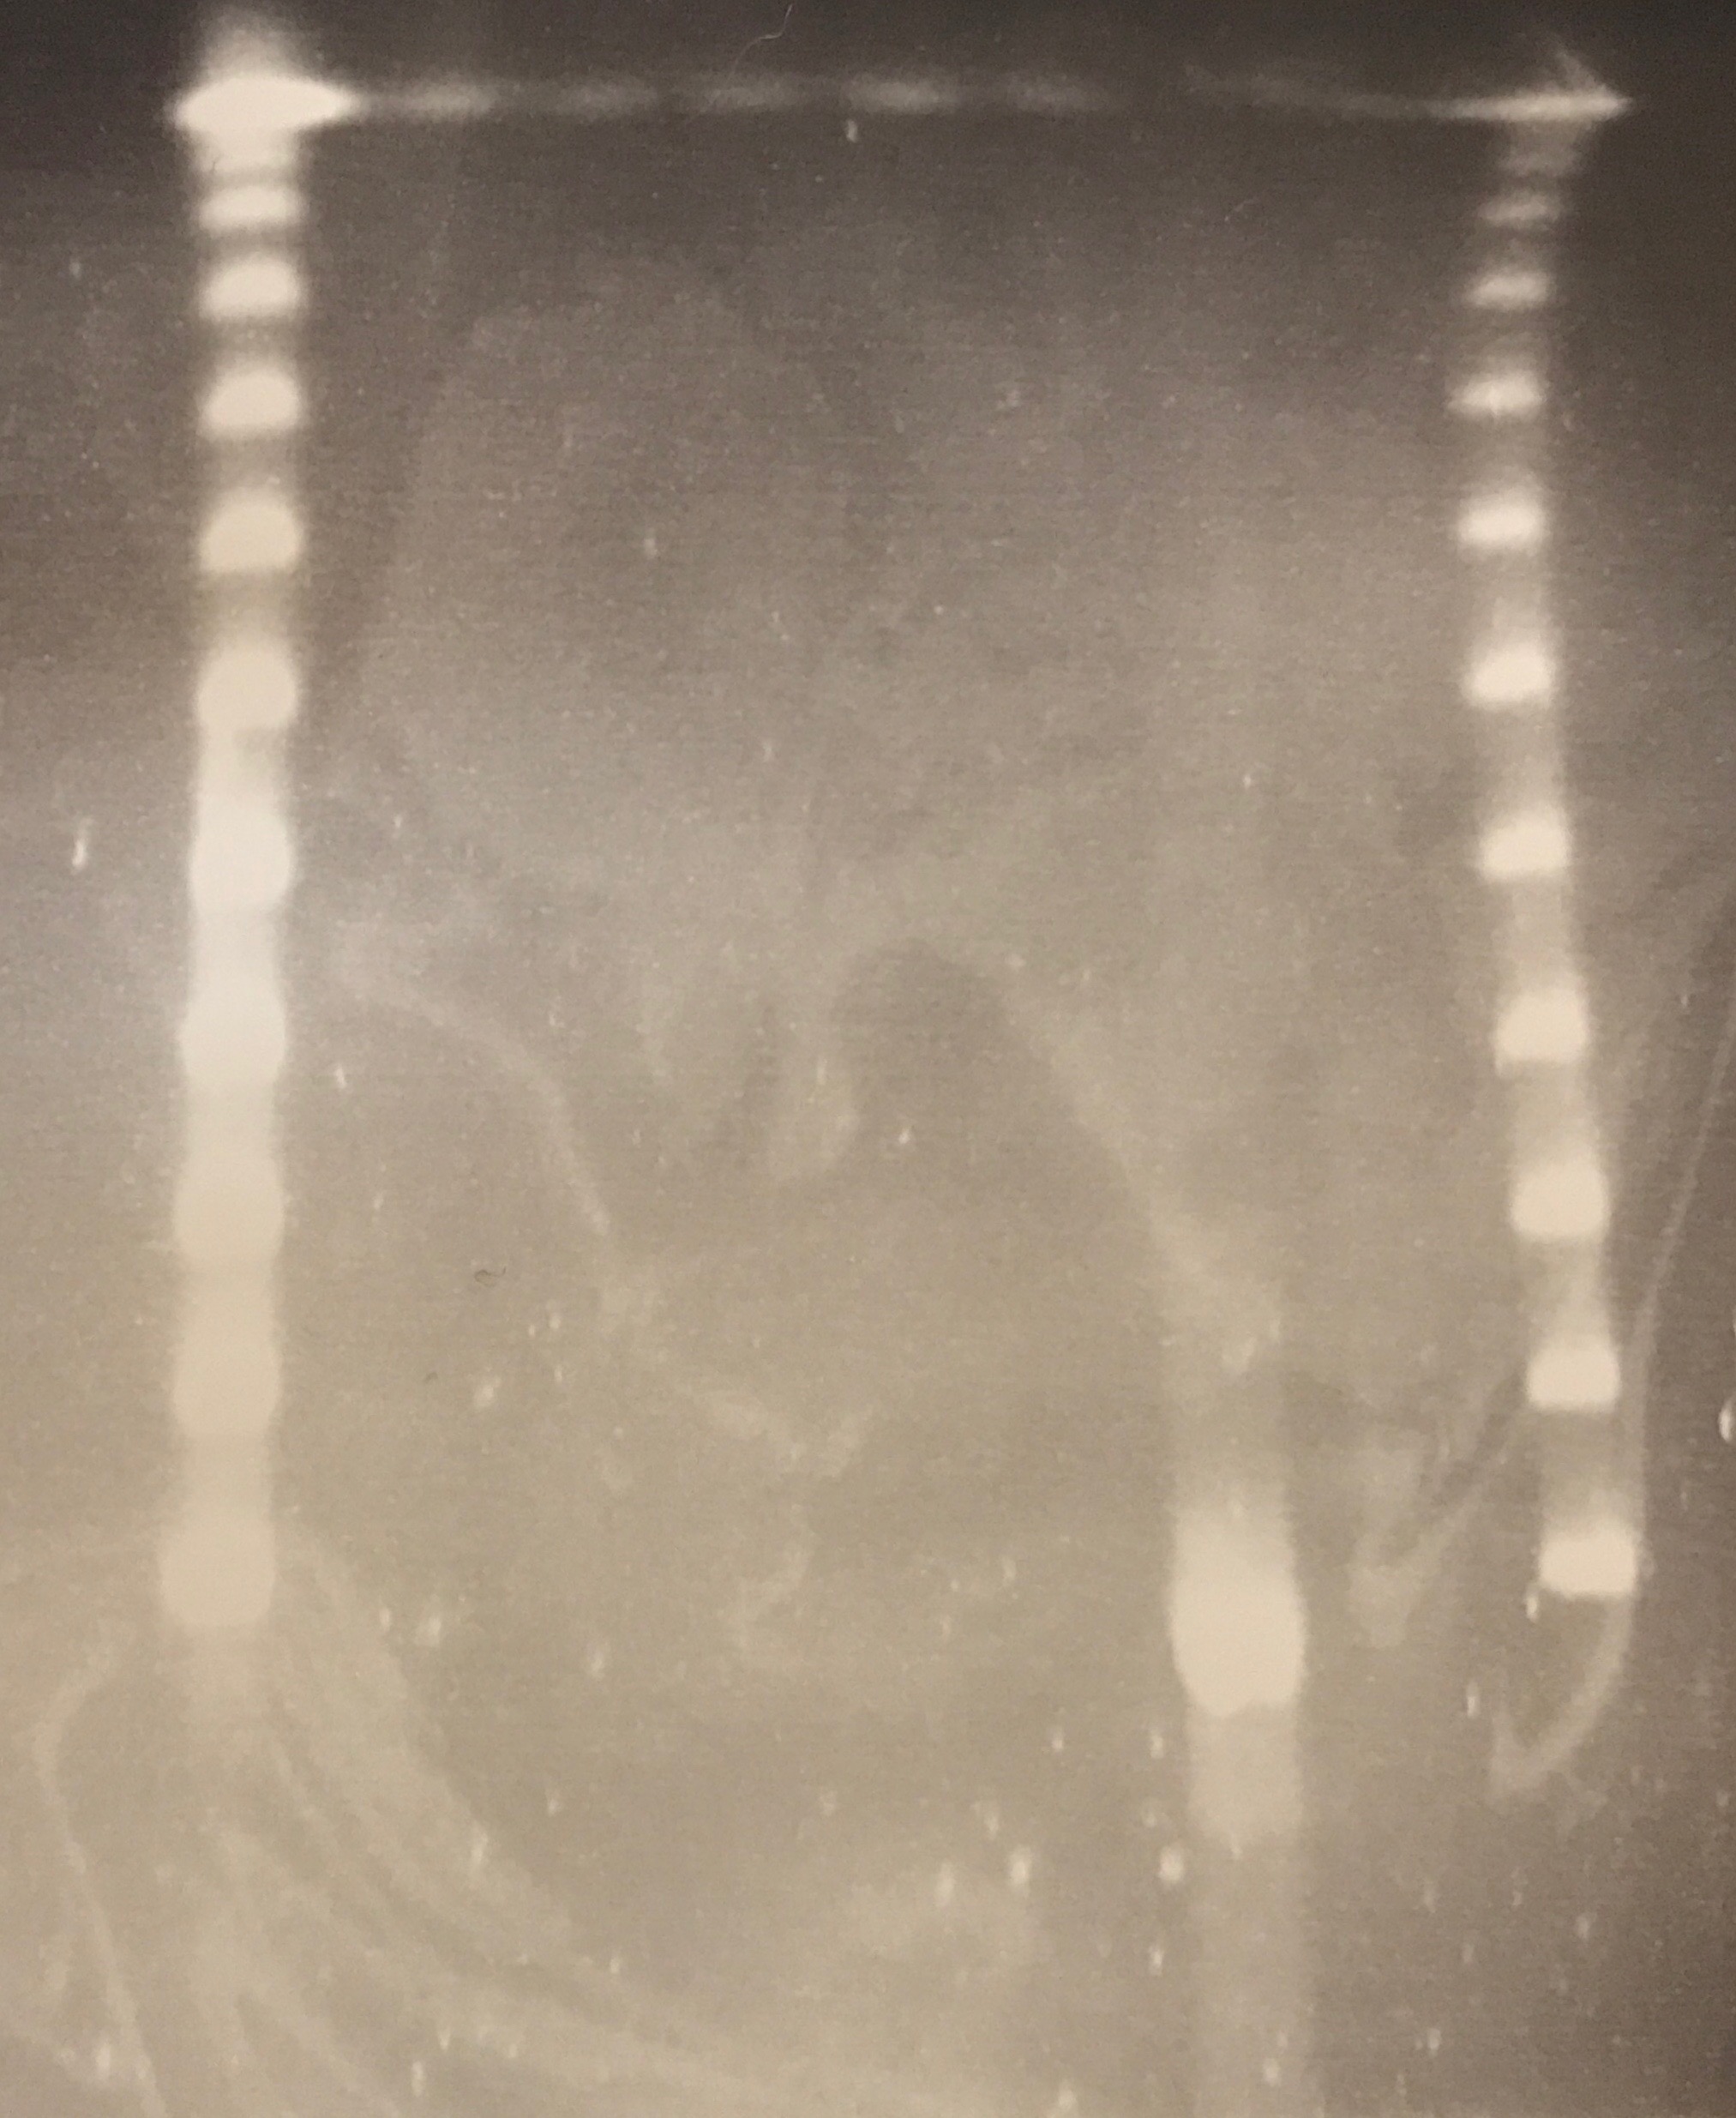 |
| Figure ? PFGE gel with relative sizes of the Lambda PFG ladder detailed down the left hand side. Lane 1 Lambda PFG ladder, Lane 2 BCE1, Lane 3 BCE1T, Lane 4 BCE2, Lane 5 BCE2T, Lane 6 pMG101, Lane 7 BCE2T, Lane 8 BCC2 and Lane 9 Lambda PFG ladder. | |
- Sequence Analysis
Sequence analysis using Artemis has heavily focussed on the isolate BCC2 but initial work has also been carried out on the sequences A2.5, BCE3 and BS7. Work carried out by Delveen Ibrahim identified antimicrobial resistance genes including those conferring resistance to metals and other genes of interest such as efflux pumps and outer membrane proteins. Further analysis within this report focussed on finding areas within the BCC2 sequence that could be identified as being of plasmid, transposon or integron origin. Other genes of interest that were identified included genes encoding capsular polysaccharides, iron acquisition systems, virulence factors and genes that could be advantageous to survival within a competitive environment such as the slurry tank system.
- BCC2
The sequence for E. coli isolate BCC2 was obtained from a CLC assembly that produced 75 contigs ranging from 1 kb to >500,000 kb representing a total DNA sequence of 5,220,032 bp of sequence. As much of the sequence annotation in relation to resistance genes, was completed by Delveen Ibrahim, this report will focus more on the detailed analysis of regions suspected to be plasmid related along with virulence factors and other genes of interest. It was evident from initial analysis of the sequence that at least two large plasmids were present, with estimated sizes of around 183 kb and 133.5 kb. However, extracting plasmid related contigs successfully was clearly going to be complicated by a number of factors such as the complexity of transfer regions, multiple plasmids within the same cell and regions of low coverage. In order to successfully extract and assemble reads that were true representation of the 183 kb plasmid DNA sequence additional programs were employed to complete this successfully.
- Plasmid Spades and Rescaf
Plasmid sequences are often difficult to extract from whole genome sequencing (WGS) and other methods employed such as biochemical or manual annotation can be time consuming and difficult. Therefore, many plasmids may go unidentified within sequences, resulting in loss of vital insight into the evolution and epidemiology of virulence and resistance (Antipov et al., 2016). There are databases available that allow comparisons to be made with other known plasmid sequences such as the web tool developed by Carattoli (2014), that allows comparisons with known plasmid sequences. This does however give the limitation of only comparing known plasmids currently present within the database. Therefore constructing plasmid sequences from WGS requires the use of multiple tools to generate clean plasmid sequences. PlasdSPAdes relies on read coverage to identify and distinguish chromosomal from plasmid contigs from an assembly. Chromosomal DNA coverage is dependent upon copy number of the plasmid in that high copy number plasmids will have a higher coverage over low copy number plasmids. Plasmid DNA is therefore filtered from the chromosomal by estimating a median chromosomal coverage (Antipov et al., 2016).
Work was conducted by Steve Hooton to extract suspected plasmid DNA sequences and assemble reads by using PlasmidSPAdes for regeneration of new contigs from raw sequence data. A total of 25 new contigs were generated representing 184,017 bp of sequence. Finally an additional program ReScaf was then utilized to clean up and finalise the assembly which included the deletion of a duplicated contig of 760 bp, resulting in 17 new re-ordered contigs of 183, 257 bp.
- BCC2 183 kb Plasmid Annotation
Manual annotation was conducted using Artemis and the NCBI BLAST database. Each gene within the sequence was analysed individually resulting in <number> of known function with approximate <number> of no known biological function.
In order to extract and assemble reads representing plasmid DNA sequences, PlasmidSPAdes was used to regenerate a new set of contigs from the original raw sequence data. 25 contigs totalling 184,017 bp were generated. The program ReScaf was then used to polish and finish the assembly, with 17 re-ordered contigs representing 183,257 bp (the 760 bp reduction was due to removal of a duplicated contig). Following manual annotation a single IncFII (is it FIIA or FIIB?) replicon was identified and along with read-alignment data spanning contig junctions a large >183 antibiotic/resistance plasmid was generated. We still need to verify the assembly experimentally (PCR over contigs to ensure correct gap closure, PFGE sizing). Interestingly, plasmidSPAdes did not extract or assemble reads relating to another plasmid idnetified during the original CLC assembly (~40 kb tet resistance plasmid) indicating that the program may not be optimal for identifying some plasmids (you should have a quick read about plasmidSPAdes and get an idea as to how it works – dont worry about de Bruijnn graphs and all that, just focus on the reasoning behind the low- high-read coverage approach just incase you get a Q about it). Up to you what you say about the tet plasmid it is located with blaTEM on a ~40Kb contig in the original BCC2 assembly (467,577..507,262) however it is definitely a plasmid.<
- Comparables to Other Plasmids
- BCE1T and BCE2T Transconjugants
Following extraction of whole genome DNA from the transconjugants BCE1 and BCE2T was using the protocol set out in section 2.7.2., both isolates have now been sent for sequencing. It is hope that extracting plasmid sequences from these isolates will be easier than with BCC2 as they are both within a known background of J53 AziR. Future transconjugants should also be able to be processed in a similar way, without the need for complex analysis methods to extract plasmid DNA sequence from a complex background of chromosomal DNA.
Cite This Work
To export a reference to this article please select a referencing stye below:
Related Services
View all


Related Content
All TagsContent relating to: "Farming"
Farming is the business or activity of working on a farm. Farming activities include ground preparations, sowing or planting seeds, tending crops, or activities involved in the raising of animals for meat or milk products.
Related Articles

DMCA / Removal Request
If you are the original writer of this dissertation and no longer wish to have your work published on the UKDiss.com website then please: