Sentimental Analysis on Products Reviews
Info: 8184 words (33 pages) Dissertation
Published: 26th Oct 2021
Abstract
Sentiment analysis or opinion mining is the computational study of people’s emotions, opinions, sentiments by considering their reviews in the form of text. In recent years. This is the most active research area in the field of natural language processing and text mining. Since it is based on the opinions and as all the humans make decisions dependent on other opinions its popularity is increasing day by day. In this paper, our ultimate goal is to tackle the problem of sentiment polarity categorization, which is one of the fundamental problems of sentiment analysis. A complete process for sentiment polarity categorization is proposed with detailed process descriptions. The datasets that are used here comprise of online product reviews collected from Amazon.com. Necessary experiments for both sentence-level categorization and review-level categorization are performed with the promising outcomes. At last, we also give insight into the future scope of sentiment analysis.
Therefore, this project deals with analysis of Products data getting from the UCI Depositories, DataWorld and Jmcauley where we need products reviews and their customers names.
Contents
1 Introduction
2 Analysis
3 Challenges
4 Design
5 Implementation/coding
6 Outputs
7 Applications
8 Conclusions
9 Future enhancements
10 References
1. INTRODUCTION
1.1 MOTIVATION
Opinions of others on a particular product can have influence on our decision. In olden days people used to collect opinions on a product from direct sources like friends, relatives, consumer reports and strangers. Now-a-days we have several ways to have a look at opinions of others (ex: Internet). Internet helps to collect opinions from different people around the world. People look to different e-commerce sites like amazon, eBay, flipkart , snapdeal etc., to know reviews and feedback about a particular product and will buy the product according to the reviews. As social media has a great influence, now-a-days those are also helping to know about a product.
Some Organizations use surveys, opinion polls, social media as the mechanism to obtain feedback on their products. Sentimental analysis deals with the collective study of sentiments, opinions and emotions expressed in the form of text. As there can be thousands of reviews and different feedback on a particular product, one cannot go through all those reviews to make decision so the concept of sentimental analysis arises. Sentimental analysis helps to characterize the reviews into different levels like good, bad, worst, average by considering and analyzing the words present in those reviews.
It helps to:
- Characterize reviews into different types based on the words used to describe the product .
- Outputs a pictographical representation that gives a clear idea about the product.
- It considers thousands of reviews. So, our decision will be correct to maximum extent.
- One can get out of confusion regarding the product.
- The company can know the overall opinion on the product and change according to the reviews
- The customers can also know the quality of the product and will buy the best product
1.2 PROBLEM DEFINITION
In today’s fast developing world, one has different types of products available in the market. It is impossible to go through each review manually to buy a new product so sentimental analysis should help to differentiate good product from other through analysis of the reviews that are submitted by the customers.
1.3 OBJECTIVE OF THE PROJECT
The main objective of this project is to go about an extra mile to provide the users with an output that is the analysis of thousands and thousands of reviews.
To save time by analyzing thousands of reviews in short period and if those reviews were analyzed manually it may take upto decades.
The overall output is achieved by several steps like:
- Step 1: Gathering the raw data from different repositories.
- Step 2: Preprocessing the raw data in a usable format.
- Step 3: Fetching the data set file using R language.
- Step 4: Identifying the sentiment words in the reviews.
- Step 5: Maintaining a count of different type of words.
- Step 6: Data visualization in a bar graph.
Ex:
Fig:1.1
1.4 ORGANISATION OF DOCUMENTATION
In this project documentation, we have initially put the definition and objective of the project as well as the design of the project which is followed by the implementation and testing phases. Finally the project has been concluded successfully and also the future enhancements of the project are specified.
2. ANALYSIS
2.1 INRODUCTION
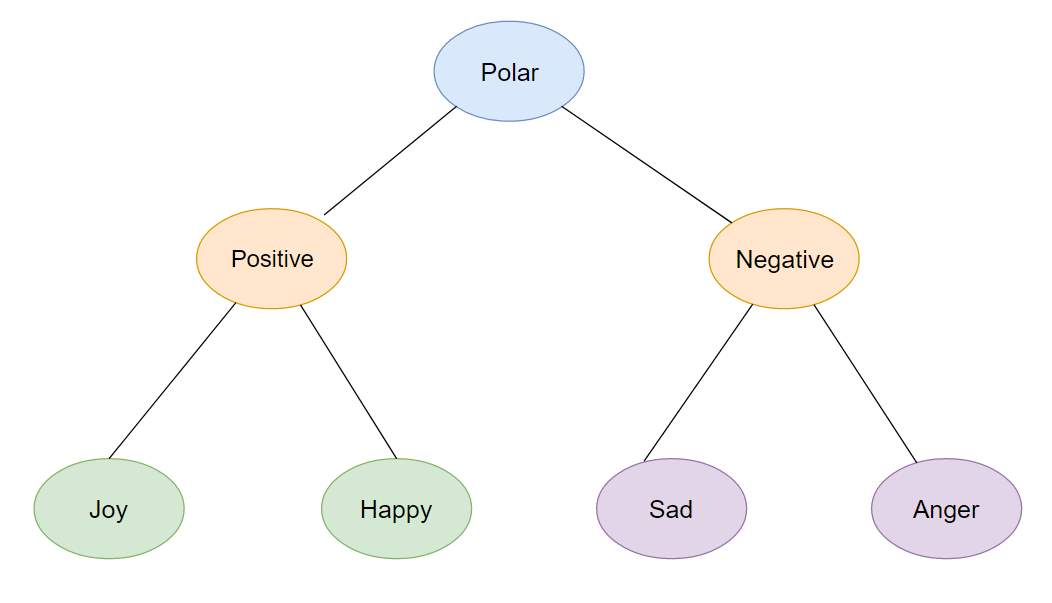
After analyzing the requirements of the task to be performed, the next step is to analyze the problem and understand its context. The first activity in this phase is we consider the reviews and find the frequencies of different adjective words in it. Once the adjective words are found we classify them into positive, negative, neutral. In this phase all the stop words are ignored.
2.1 ASPECT BASED SENTIMENTAL ANALYSIS (ABSA)
ABSA deals with identifying aspects of given target entities and estimating the sentiment polarity for each mentioned aspect. This can be done through two tasks :
- Aspect extraction
- Aspect sentiment classification
Aspect extraction can be thought of some kind of information extraction which deals with recognizing aspects in the entity.
Aspect sentiment classification deals with the opinions and illustrates whether certain opinion on a aspect is positive, negative or neutral.
2.2.1 Aspect Extraction
There are two ways for Aspect Extraction:
- High frequent words or phrases across reviews are to be found and filtered by conditions like “occurs right after sentiment word”.
- To specify all the aspects in advance and find them in the reviews.
In our project,we are displaying word cloud which is the graphical representation of the frequently used words in the dataset.
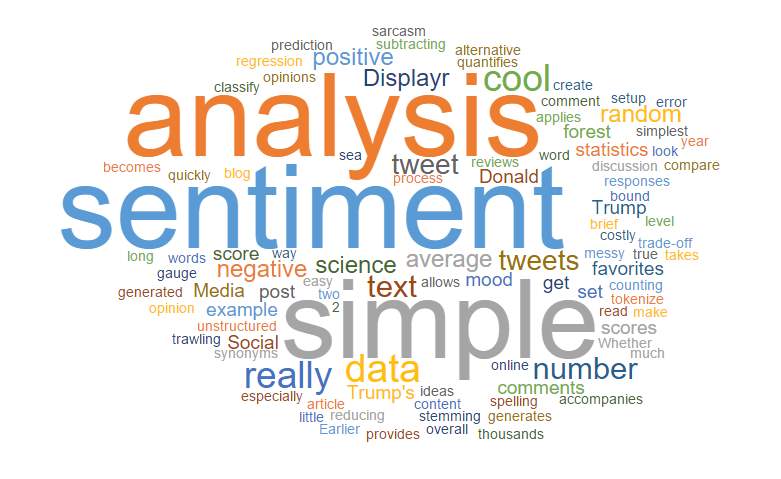
Fig:2.2.1
2.2.2 Aspect Sentiment Classification
Word can be described in many ways like it can be attractive, shock, positive, negative or emotion. To identify the type of word description we need to perform sentimental analysis where we need to understand the classification between the words and refine the sentiments into the certain categories like positive and negative. This can be done using lexicon where lexicon is a collection of hash tables ,dictionaries and wordlist which is used to identify the polarity of words like positive and negative. Using this lexicons we can classify the word sentiment.
3. CHALLENGES
1) Contrasts with Standard Fact-Based Textual Analysis
The increasing interest in opinion mining and sentiment analysis is partly due to its rich potential applications. Equally important are the new intellectual challenges that the field presents to the research community.
Traditionally, text categorization seeks to classify documents by considering topic. There can be many possible categories, the definitions of which might be user or application dependent, and for a given task, we might be dealing with as few as two classes (binary classification) or as many as thousands of classes (example: classifying documents with respect to a complex taxonomy). In contrast, with sentiment classification, we often have relatively few classes (e.g., “positive” or “3 stars”) that generalize across many domains and users. In addition, while the different classes in topic-based categorization can be completely unrelated, the sentiment labels that are widely considered in previous work generally represent opposing (if the task is binary classification) or ordinal/numerical categories (if classification is according to a multi-point scale). The regression-like nature of strength of feeling, degree of positivity, and so on seems rather unique to sentiment categorization (although one could argue that the same phenomenon exists with respect to topic-based relevance).
There are many characteristics answers to the opinion-oriented questions that completely differ from fact-oriented questions. As a result, the approach for opinion-oriented information extraction, to answer opinion-oriented questions, naturally differs from that of traditional information extraction.
2) Factors that make Opinion Mining Difficult
According to survey, when two people were asked to pick up words that they think are good indicators of positive and negative sentiment, the two answers were not same as shown in the figure.
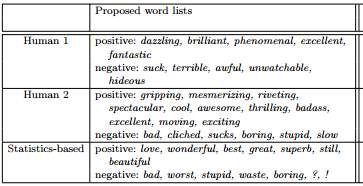
The use of those lists of keywords given by them achieves about 60% accuracy when employed within a straightforward classification policy. In contrast, word lists of the same size but chosen based on examination of the corpus’ statistics achieves almost 70% accuracy.
However, the fact that it may be non-trivial for humans to come up with the best set of keywords does not in itself imply that the problem is harder than topic-based categorization.
And if we even consider the survey, both are humans but each person has a different feeling about different words. So, considering the words and predicting the result may not be accurate in all the cases.
3) Detecting sentiment of the writer, reader and other entities
On the surface, sentiment may seem unambiguous but if we look closer then it is easy to see how sentiment can be associated with any of the following:
1. the speaker (writer)
2. the listener or reader
3. one or more entities mentioned in the utterance.
Generally, large number of researches in sentimental analysis has focused on detecting only the sentiment with respect to speaker, and this is done by analyzing only the utterance. However, there are several instances where it is unclear and confusion whether the sentiment in the utterance is the same as the sentiment of the speaker.
For example, consider:
Thomas: “The super star suffered a fatal overdose of drugs”.
By seeing the sentence we think that it is describing a negative event (death of a person), but it is unclear whether to conclude that James (the speaker) is personally saddened by the event or not. There is a possiblity that James is a news reader and merely communicating information about the event. Developers of sentiment systems have to decide before hand whether they wish to assign a negative or positive or neutral sentiment to the speaker in such cases. More generally, it is the responsibility of developers to decide whether the speaker’s sentiment will be chosen to be neutral in absence of clear signifiers of the speaker’s own sentiment, or whether the speaker’s sentiment will be chosen to be the same as the sentiment of events and topics mentioned in the utterance.
On the other hand, people can react differently or they can have other emotion to the same utterance, for example, people on opposite sides of a debate or rival sports fans. Thus, for modeling listener sentiment it requires modeling listener profiles. This is an area of research that was not much explored by the community.
Similarly, there is no work on modeling sentiment of entities mentioned in the text.
For example,
“Harry could not stop talking about the FLASH episode”.
It will be useful to develop automatic systems that can deduce that Harry liked the new episode of FLASH.
4. DESIGN
After a comprehensive analysis of all the aspects of the data and the related information we started with the design of our system.
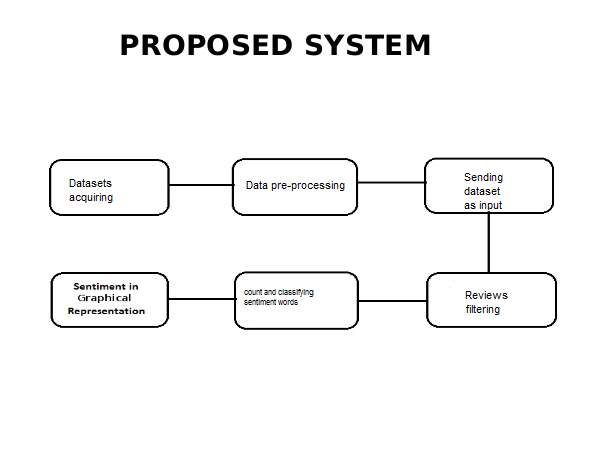
Fig:4.1
Below are the steps to find sentiment analysis:
Datasets acquiring :
We acquire datasets from several repositories.
Data pre-processing:
To pre-process the raw data to convert into usable format.
Dataset as input:
Taking input as our dataset through the R code.
Reviews filtering:
Filtering the reviews to remove stop words and get adjectives.
Classifying the data:
Classifying the data depending on the sentiment present in them.
Output graph:
Displaying output as a graph.
4.1 UML DIAGRAMS
Unified Modelling Language (UML) is a standardized general-purpose modelling language in the field of software engineering. It is used to specify, visualize, modify, construct and document the artefacts of an object-oriented software intensive system under development. UML combines best techniques from data modelling (entity relationship diagrams), business modelling (work flows), object modelling, and component modelling. It can be used with all processes, throughout the software development life cycle, and across different implementation technologies.
4.1.2 Use Case Diagram
A Use case diagram in the Unified Modelling Language (UML) is a type of
behavioural diagram defined by and created from a Use-case analysis. Its purpose is to present a graphical overview of the functionality provided by a system in terms of actors, their goals (represented as use cases), and any dependencies between those use cases.
The main purpose of a use case diagram is to show what system functions are performed for which actor. Roles of the actors in the system can be depicted.
4.1.3 Sequence Diagram
A sequence diagram in Unified Modelling Language (UML) is a kind of interaction diagram that shows how processes operate with one another and in what order. It is a construct of a Message Sequence Chart.
A sequence diagram shows, as parallel vertical lines (lifelines), different processes or objects that live simultaneously, and, as horizontal arrows, the messages exchanged between them, in the order in which they occur. This allows the specification of simple runtime scenarios in a graphical manner.
4.1.4 Activity Diagram
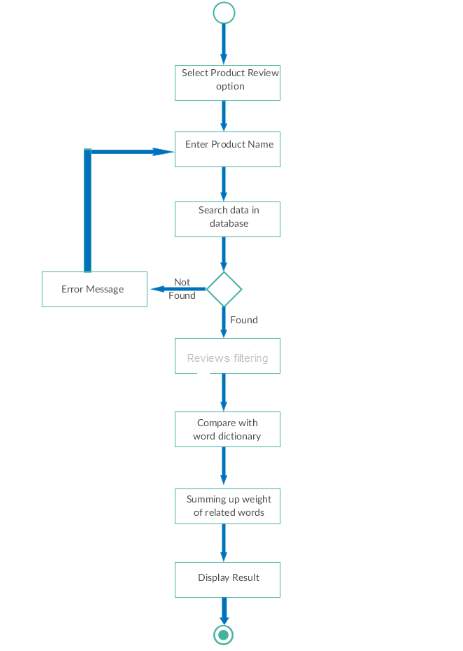
Fig:4.1.4
5. IMPLEMENTATION
5.1 INTRODUCTION
The implementation part is the most important phase of the project. In this phase, we code the entire project in the chosen software according to the design laid during the previous phase. The code has to be in such a way that the user requirements are satisfied and also not complicated for the user i.e., the user interface or GUI has to be easy to navigate. The code should be efficient in all terms like space, easy to update, etc. In this manner, we can complete the coding part of the project and later it can be sent for testing before being delivered to the customer.
5.2 Implementation(code)
The implementation of our system requires certain R packages. We have imported the necessary packages and have loaded in the code. We used RStudio as our platform for implementation. The package we used extensively is the caret package(short for Classification And Regression training). This package provides wide range of machine learning algorithms for both classification and regression, it also hosts a variety of feature selection techniques. We used ggplot2 for data visualization as it is helpful to display the result in bar graph.
Steps in our implementation process:
- Acquiring the data sets.
- Pre-processing the dataset.
- Filtering the reviews.
- Finding the count of each type of sentiment words.
- Output as a bar graph
- Naïve Bayes.
1) Acquiring the datasets:
An informational index is an accumulation of information that depicts quality qualities (factors) of various true protests (units). With information that are in fact amend, we comprehend an informational index where each esteem
1. can be straightforwardly perceived as having a place with a specific variable;
2. is put away in an information sort that speaks to the esteem space of this present reality variable.
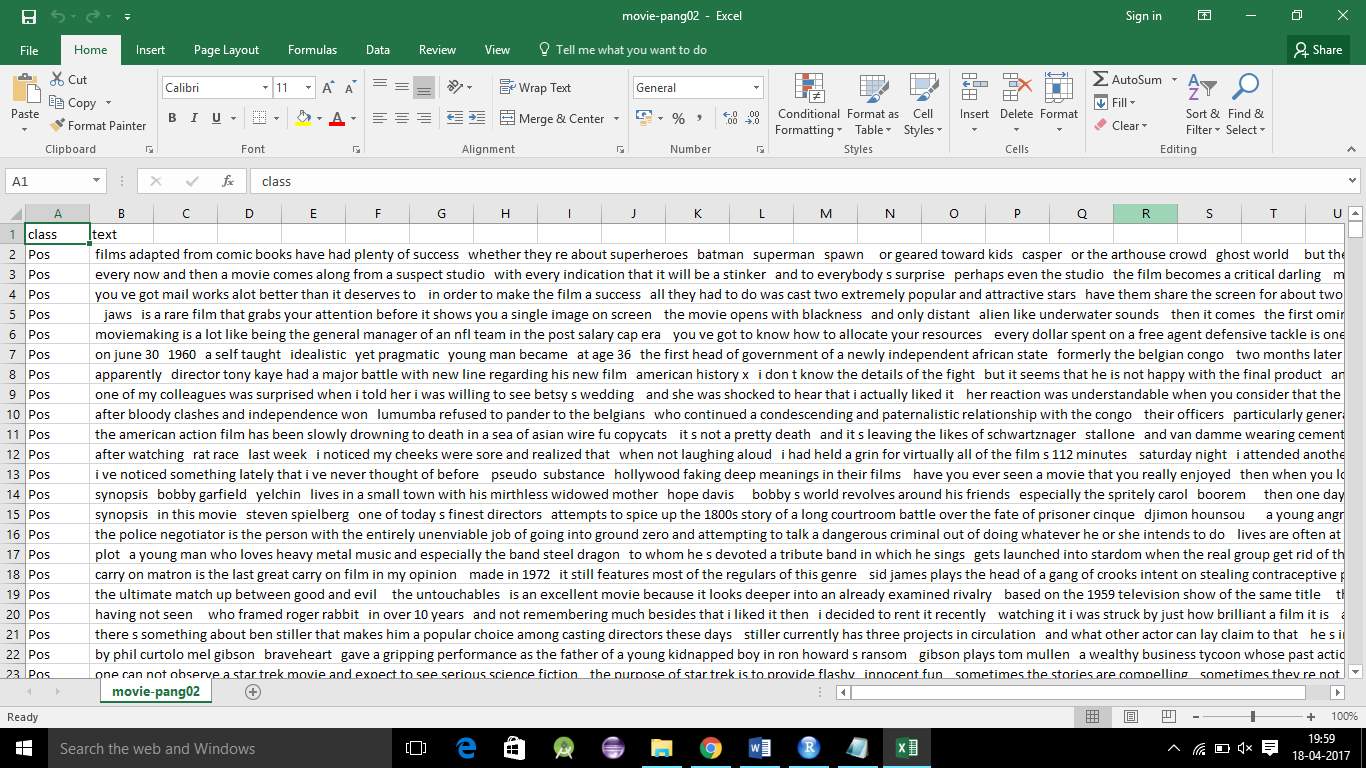
First, we got several datasets from the UCI depositories, Dataworld and Jmcauley Websites. The dataset contains reviews about the Cell phone and Musical Products of the Websites. The dataset contains about 50,000 to 90,000 of reviews but in our project we have taken only 2000 of reviews and made analysis on it. We can take more number of reviews for analysis but if we do that then while finding the accuracy since we use machine learning next, it takes much time to analyze more reviews. We got Dataset in variety of extension like JSON, XML, CSV, EXCEL Later we converted the files into one extension i.e.. CSV file. Csv file is Comma Separated File where data is separated by comma and saved in dot csv .The data we got is presented in irregular way so to convert the date in the structured manner we need Preprocessing technique.
In the real world applications we work on thousands and thousands of line of data so it may take even days to analyze.
This is the Dataset that we got:
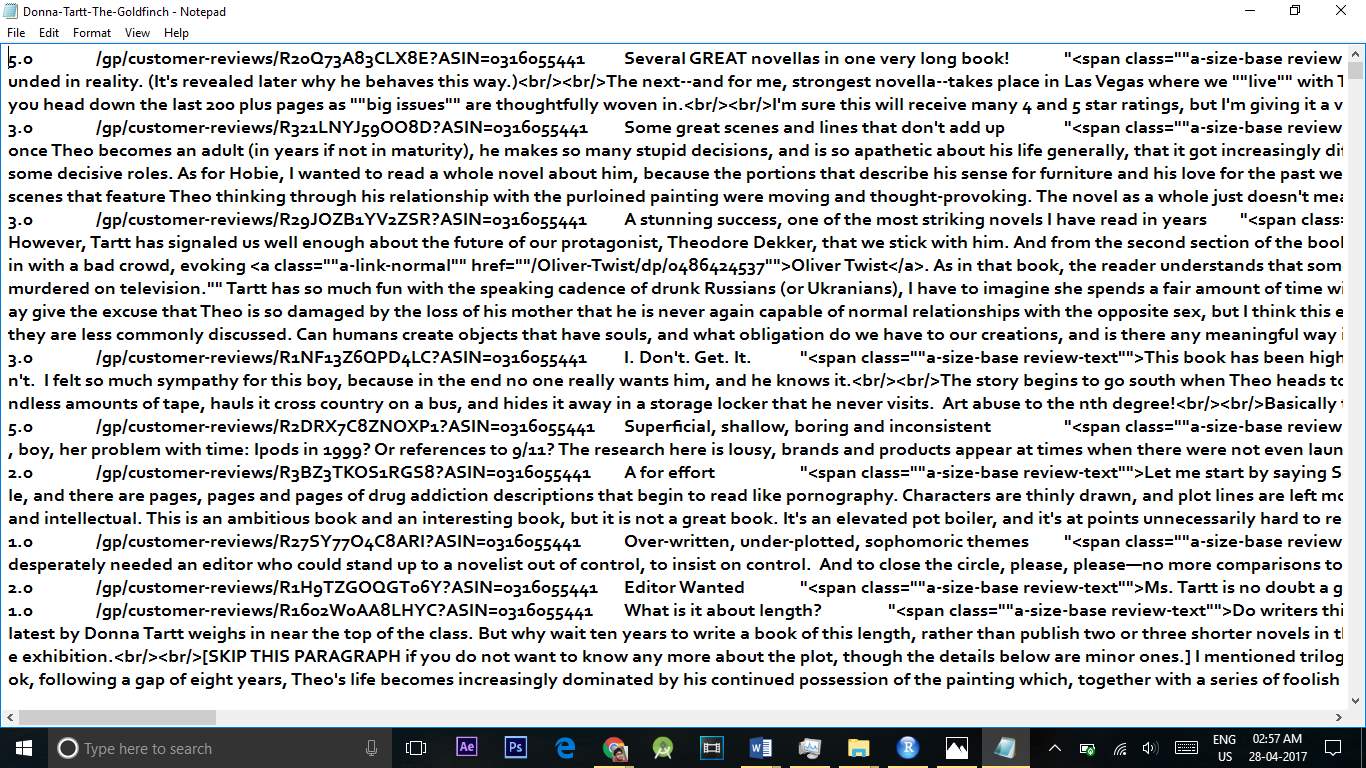
In these dataset we have raw data which contains unnecessary data and noisy data.
The unnecessary data is like having
1) html tags.
2) null values.
3) more number of commas
4) Having inconsistency etc.,
2) Pre-Processing the dataset:
Data Preprocessing is a data mining technique that involves transforming raw data into an understandable format. Real-world data is often incomplete, inconsistent, and/or lacking in certain behaviours or trends, and is likely to contain many errors. Data Preprocessing is a proven method of resolving such issues. Data Preprocessing prepares raw data for further processing.
In our dataset, the data has unstructured manner like in the data we have html tags and NULL characters by using Preprocessing technique we removed the tags and converted into a structured manner and in place of NA we have filled a constant value 9999 and filtered it. At last we have converted the data into a well formed table and saved in a csv file
This is the dataset which is converted into a Structural Format:
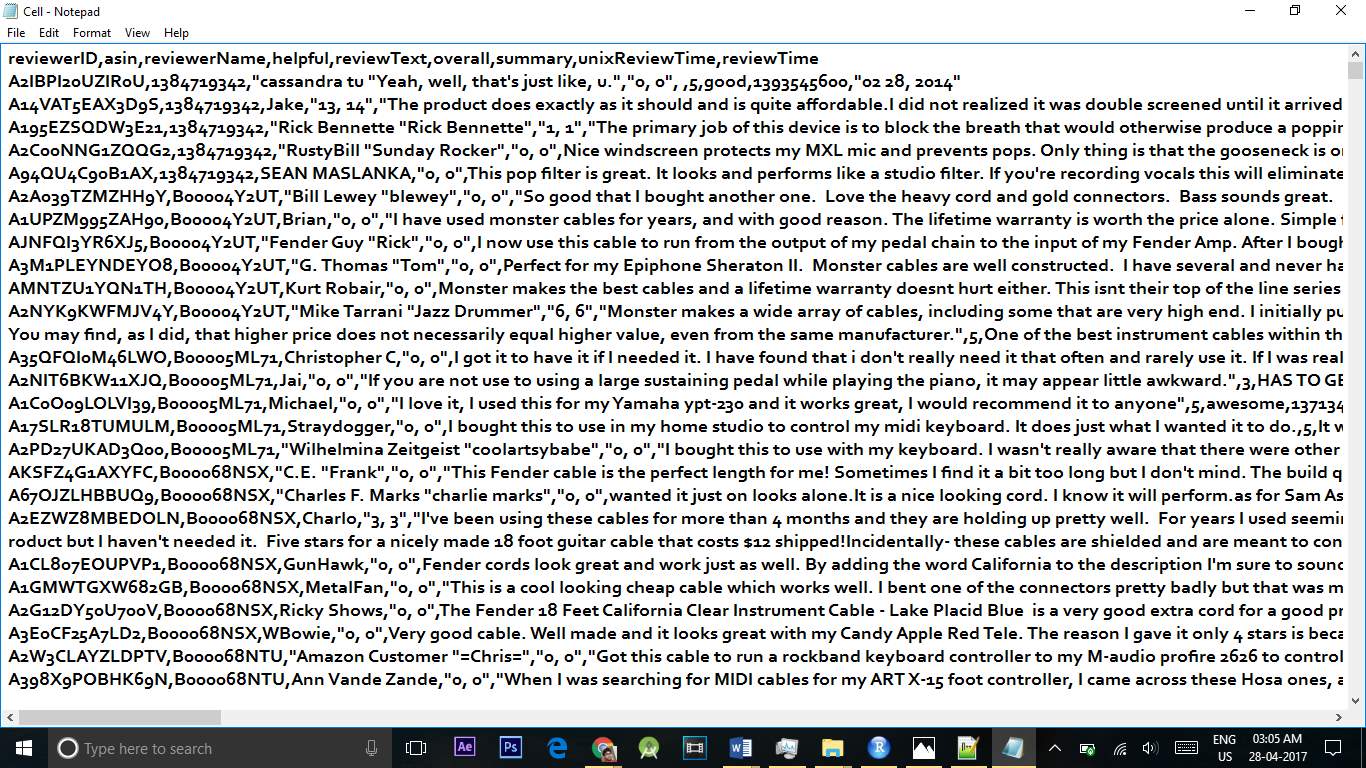
After converting into processed data:
3) Filtering the reviews:
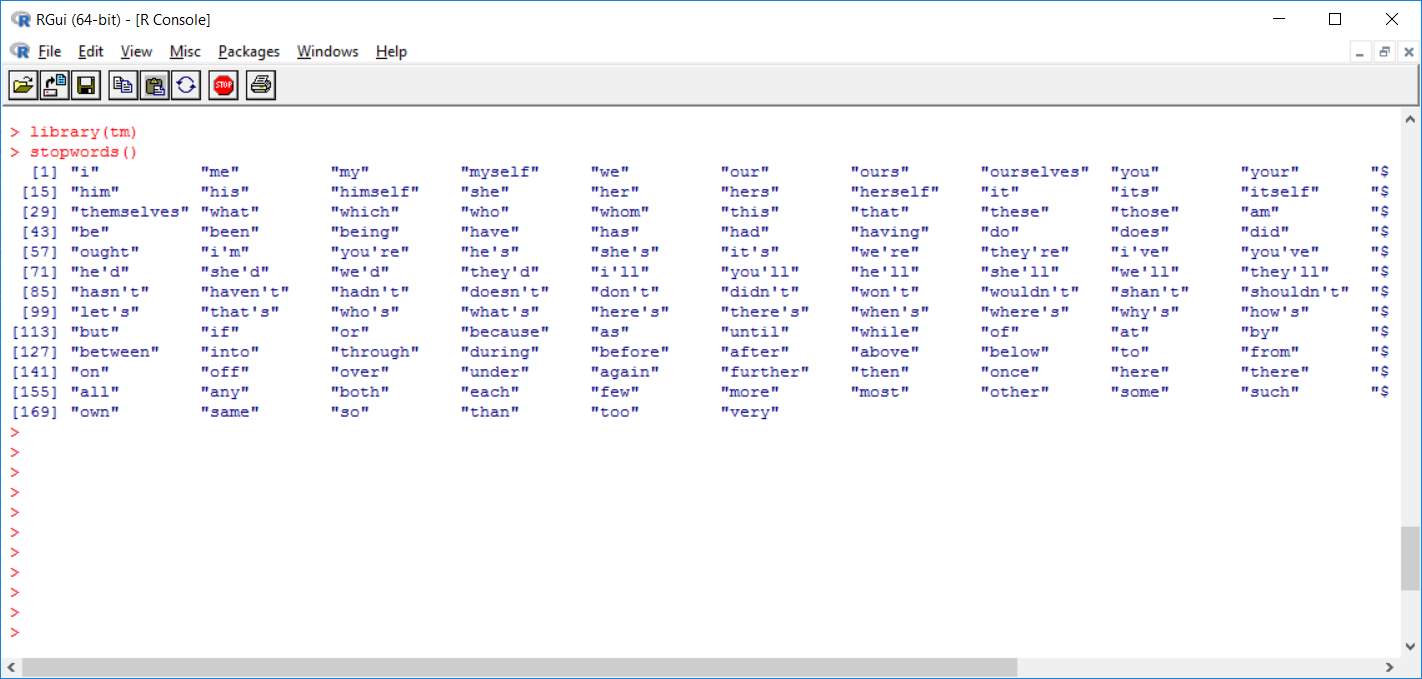
There are many number of reviews given for a particular product so in that reviews we need only the adjective words and the remaining nouns and pronouns are to be ignored So to ignore those words we use Stop words. Stop words is a variable consists of all the noun and pronoun words. By removing stop words from the reviews, we get only the adjective words from filtering. The remaining words are taken by having spaces between them. Later we need only v1(Verb 1) form of adjective so to do that we need remove the suffix from the adjective word and change it into the v1 form.
We used R code to do this.
To transform Uppercase to Lowercase letters:
tm_map(content_transformer(tolower)) %>%
To remove punctuations:
tm_map(removePunctuation) %>%
To remove numbers:
tm_map(removeNumbers) %>%
To remove stopwords:
tm_map(removeWords, stopwords(kind=”en”)) %>%
To ignore white spaces:
tm_map(stripWhitespace)
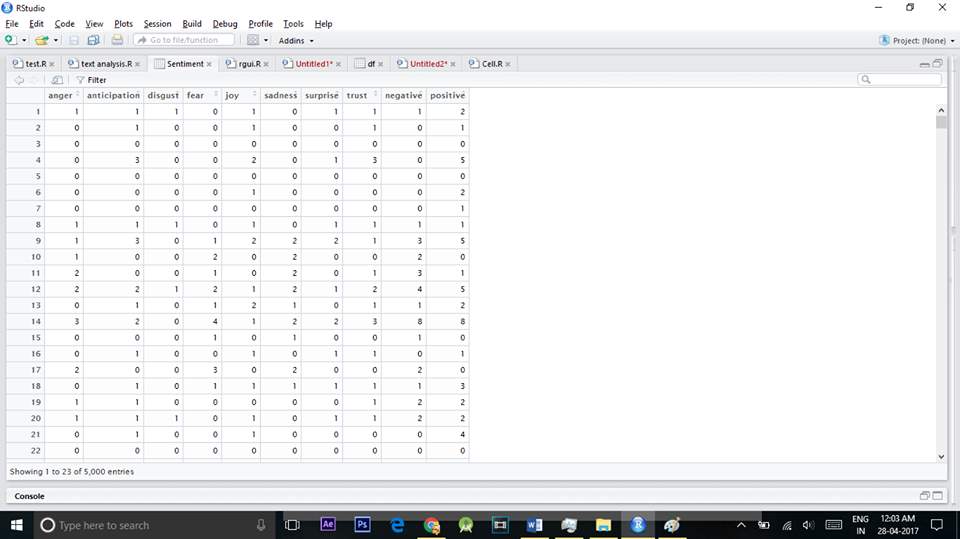
4) Finding the count of sentiment words:
As our output is a bar-graph that outputs the emotions of customers based on the words used in their reviews, our first task is to find out count of those words. We used several packages to help with the count. In the previous step we removed all stop words and reviews are filtered so that can be used in this step. Once we get all the necessary words that are adjectives from the previous step we classify them into positive and negative and then in those positive and negative classes we further divide them into good, best, anger, bad and other categories depending on the customer emotions that are specified by his words. We even got the number of sentiment words in each line.
5) Output as bar-graph:
Output can be of many graphical representations and in our project we choose to have a bar-graph representation. After getting the count of the sentiment or emotional words from the previous step we showed it in a bar-graph. We took different types of sentiment on X-axis and the count of the words that specify those sentiment on the Y-axis. We used a package called ggplot2 that is the package available in the R language.
Sample code:
ggplot(data = totalsentiment,aes(x=sentiment ,y=count))+
geom_bar(aes(fill=sentiment),stat=”identity”) + theme(legend.position = “none”) +
xlab(“sentiment”) + ylab(“Total Count”) + ggtitle(“Total Sentimental Score”)
BAR-graphs example:
5.3 CODE
library(tm)
library(RTextTools)
library(e1071)
library(dplyr)
library(caret)
library(wordcloud)
library(RTextTools)
library(e1071)
library(dplyr)
library(caret)
library(doMC)
library(ggplot2)
library(dplyr)
library(plyr)
library(sentimentr)
library(sentiment)
library(stringr)
library(tm)
library(RColorBrewer)
library(SnowballC)
library(rjson)
library(syuzhet)
df
abc
glimpse(df)
set.seed(1)
df
df
glimpse(df)
df$class
corpus
corpus
inspect(corpus[1:3])
corpus.clean %
tm_map(content_transformer(tolower)) %>%
tm_map(removePunctuation) %>%
tm_map(removeNumbers) %>%
tm_map(removeWords, stopwords(kind=”en”)) %>%
tm_map(stripWhitespace)
Sentiment
abc
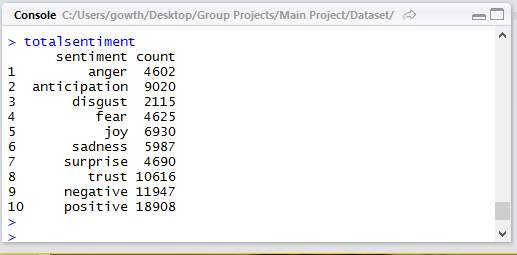
totalsentiment
names(totalsentiment)
totalsentiment
rownames(totalsentiment)
ggplot(data = totalsentiment,aes(x=sentiment ,y=count))+
geom_bar(aes(fill=sentiment),stat=”identity”) + theme(legend.position = “none”) +
xlab(“sentiment”) + ylab(“Total Count”) + ggtitle(“Total Sentimental Score”)
dtm
inspect(dtm[40:50, 10:15])
df.train
df.test
dtm.train
dtm.test
corpus.clean.train
corpus.clean.test
dim(dtm.train)
fivefreq
length((fivefreq))
dtm.train.nb
dtm.test.nb
dim(dtm.train.nb)
convert_count
y 0, 1,0)
y
y
}
trainNB
testNB
system.time( classifier
system.time( pred
table(“Predictions”= pred, “Actual” = df.test$class )
conf.mat
conf.mat
conf.mat$byClass
conf.mat$overall
conf.mat$overall[‘Accuracy’]
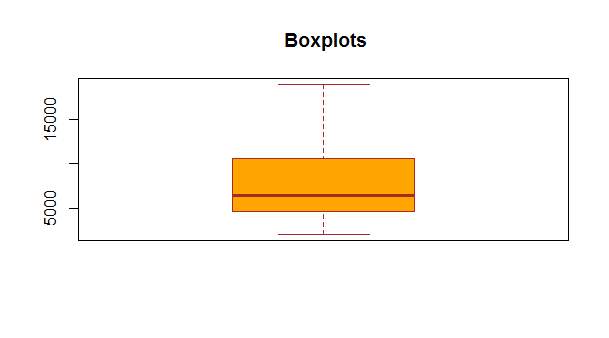
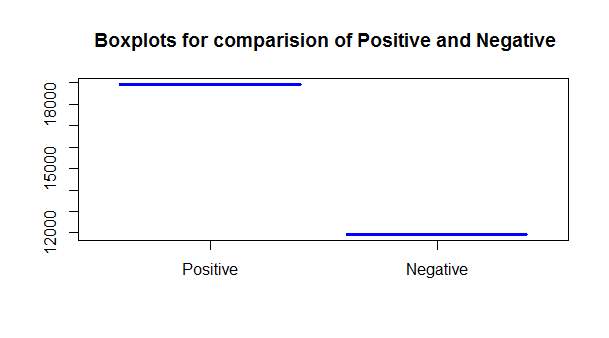
#Box-Plot Representation:
boxplot(totalsentiment$count[10],totalsentiment$count[9],border=”blue”,main = ” Boxplots comparision of Positive and Negative”,names = c(“Positive”,”Negative”),col = c(“orange”,”red”))
boxplot(totalsentiment$count,main = ” Boxplots”, col=”orange”,
border=”brown”)
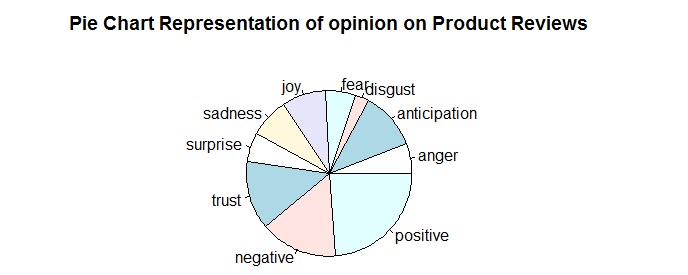
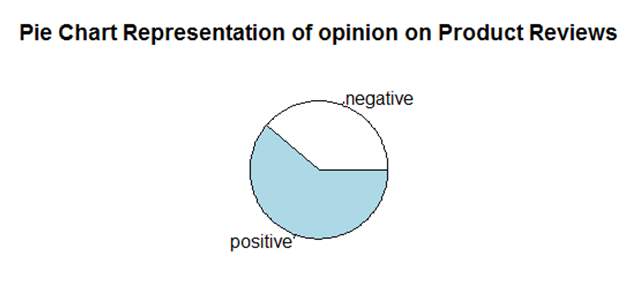
#pie chart representation
pie(totalsentiment$count,totalsentiment$sentiment,main = “Pie Chart Representation of opinion on Product Reviews”)
NAIVE BAYES
Naïve Bayes is one of the most commonly used algorithm in machine learning. This is based on the collection of classification algorithms based on Bayes Theorem. Naive Bayes is not just a one algorithm but it is the mix of algorithms that all share a common principle, that every feature being classified is independent of the value of the any other feature. Let us take an example of a watermelon, watermelon has features like it is green in colour, diameter of about 6”, oval in shape. If we consider a Naïve Bayes classifier to identify this fruit then this Naïve Bayes classifier will treat each of these features to contribute independently to the probability that the fruit is a watermelon, regardless of any correlation between the features. Since features are not always independent this is the shortcoming of Naïve Bayes algorithm and so it is labelled as “naive”.
Although it is a simple idea, Naïve Bayes can work more efficiently than other sophisticated algorithms and so it is used in many real world applications now-a-days. For spam detection and document classification also this can be used.
Advantages and Disadvantages:
Advantages:
- It is fast when compared to other algorithms.
- Simple to understand.
- Simple to build.
- Not sensitive to other(irrelevant) features.
Disadvantages:
- Since it considers each and every feature as independent, it is not correct in all cases.
How it works?
Generally all the machine learning algorithms should be trained for supervised learning tasks like classification, prediction etc and even for unsupervised learning tasks like clustering.
The word training it specifies that train them on some particular inputs so that we can test them for new inputs for which they may classify or predict based on the learning. This is the technique used by most of the machine learning algorithms.
So in a machine learning project we have to divide our input set into two sets, one is development set which consists of training and development test data and the other set is test set or evaluation set for which we have to make classification or prediction.
The test set need to have the format that is same as training set. And if the use the same test set as training set then the scores will be obviously high which is not correct. Most of the test set should be different from training set, so that we get genuine results.
Simple demonstration:
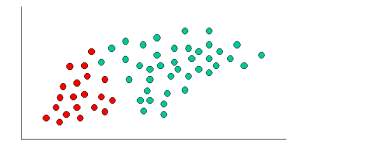
As indicated by the fig the objects can be classified as either red or green. Our aim to classify new cases as they arrive i.e., either they belong to red or they belong to green.
Since there are more green objects than red generally one thinks that the probability of new object is green. This belief is treated as prior probability in Bayesian Theorem. Prior probabilities are based on previous experiences, in this case we consider the percentages of red and green objects present.
Prior probability of green:
Number of green objects/total number of objects.
Prior probability of red:
Number of red objects/total number of objects.
Since there are total number of 60 objects in which red are 20 and green ae 40, our prior probabilities will look like this:
Prior probability of green: 40/60
Prior probability of red: 20/60
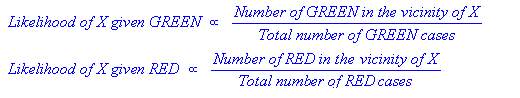
Since we are done with our prior probabilities we can now classify our new input. As it is well clustered, it is reasonable to assume that more green objects are in vicinity of new case, the more likely the new case belongs to that particular colour. To measure this likelihood we draw a circle around X(new case) which encompasses a number of points irrespective of their class labels. Now we find number of labels belonging to each label. From this we calculate the likelihood.
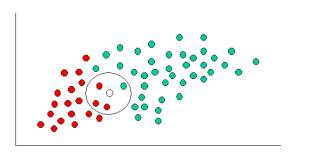
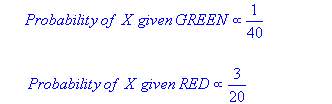
Although the prior probabilities indicate that the X(new case) is green, the likelihood indicates the class membership is red. In the Bayesian analysis, the final result is produced by the combination of both prior and likelihood sources, to form a posterior probability using Baye’s rule.
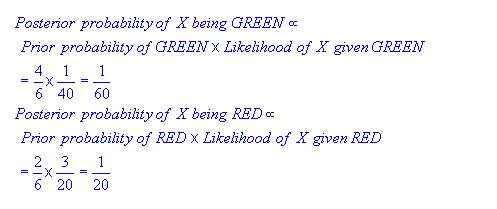
Finally, we classify X as red since its class membership has achieved largest posterior probability.
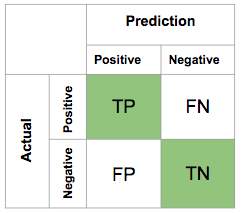
Confusion Matrix:
A confusion matrix is a representation of table which is used to describe the performance of a classification model like naïve bayes classifier on a set of test data for which the true values are known like trained data. The confusion matrix itself is relatively simple to understand, but the related terminology can be confusing.
https://computersciencesource.wordpress.com/2010/01/07/year-2-machine-learning-confusion-matrix/
Naive Bayes code:
In our Project we have taken 1500 records of training dataset and 500 records of testing dataset. First we train the classifier with our training dataset. After classifier is trained it used in testing the dataset.
Sample Code:
dtm
inspect(dtm[40:50, 10:15])
df.train
df.test
dtm.train
dtm.test
corpus.clean.train
corpus.clean.test
dim(dtm.train)
fivefreq
length((fivefreq))
dtm.train.nb
dtm.test.nb
dim(dtm.train.nb)
convert_count
y 0, 1,0)
y
y
}
trainNB
testNB
system.time( classifier
system.time( pred
table(“Predictions”= pred, “Actual” = df.test$class )
conf.mat
conf.mat
conf.mat$byClass
conf.mat$overall
conf.mat$overall[‘Accuracy’]
6. OUTPUTS
6.1 Data Visualization
A primary goal of data visualization is to communicate information clearly and efficiently via statistical graphics, plots and information graphics. Numerical data may be encoded using dots, lines, or bars, to visually communicate a quantitative message.
Effective visualization helps users analyse and reason about data and evidence. It makes complex data more accessible, understandable and usable. Users may have particular analytical tasks, such as making comparisons or understanding causality, and the design principle of the graphic (i.e., showing comparisons or showing causality) follows the task. Tables are generally used where users will look up a specific measurement, while charts of various types are used to show patterns or relationships in the data for one or more variables.
In R we have package name ggplot2 where it can be used to visual the data the different format like bar graph, histograms. In our project we have visualize data in Bar Graphs.
Bar Graph
A structured presentation(bar graph) is a graph that utilizations bars to show examinations between classifications of information. The bars can be either flat or vertical. Visual diagrams with vertical bars are now and then called vertical reference charts. A visual chart will have two axis. One pivot will depict the sorts of classifications being thought about, and the other will have numerical qualities that speak to the estimations of the information. It doesn’t make a difference which pivot is which, however it will figure out what reference chart is appeared. If the descriptions are on the horizontal axis, the bars will be oriented vertically, and if the values are along the horizontal axis, the bars will be oriented horizontally.
Pie Chart
A pie diagram is chart that you can u se to speak to the extent for every classification in the information. Each cut speaks to a class of information and the size is relative to the amount it speaks to. Pie Chart is the circular representation of the graph which is divided into many proportions and describes the percentages of the divided proportion in a certain area. Pie charts are very widely used in the business world and the mass media
EXPLANATION
In our project we took different classes of sentiment on X-axis and the number of words that specify those emotions on the Y-axis.
As we took bar graph, pie char and box plott for data visualization our output can be easily understood by the user.
The bar corresponding to each class shows how much people are satisfied regarding the product.
The pie chart describes how much percentage of the sentiment words are highly used.
The box plot
Total count on the Y-axis species the total count of such emotional words used in the reviews of our data set.
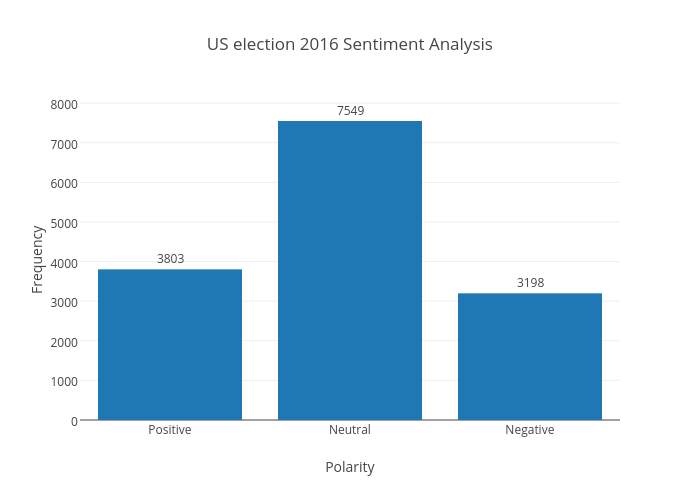
This Is the Final Result of the Sentimental Analysis on Product Reviews
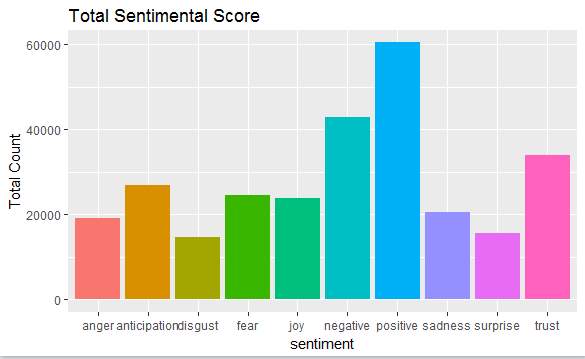
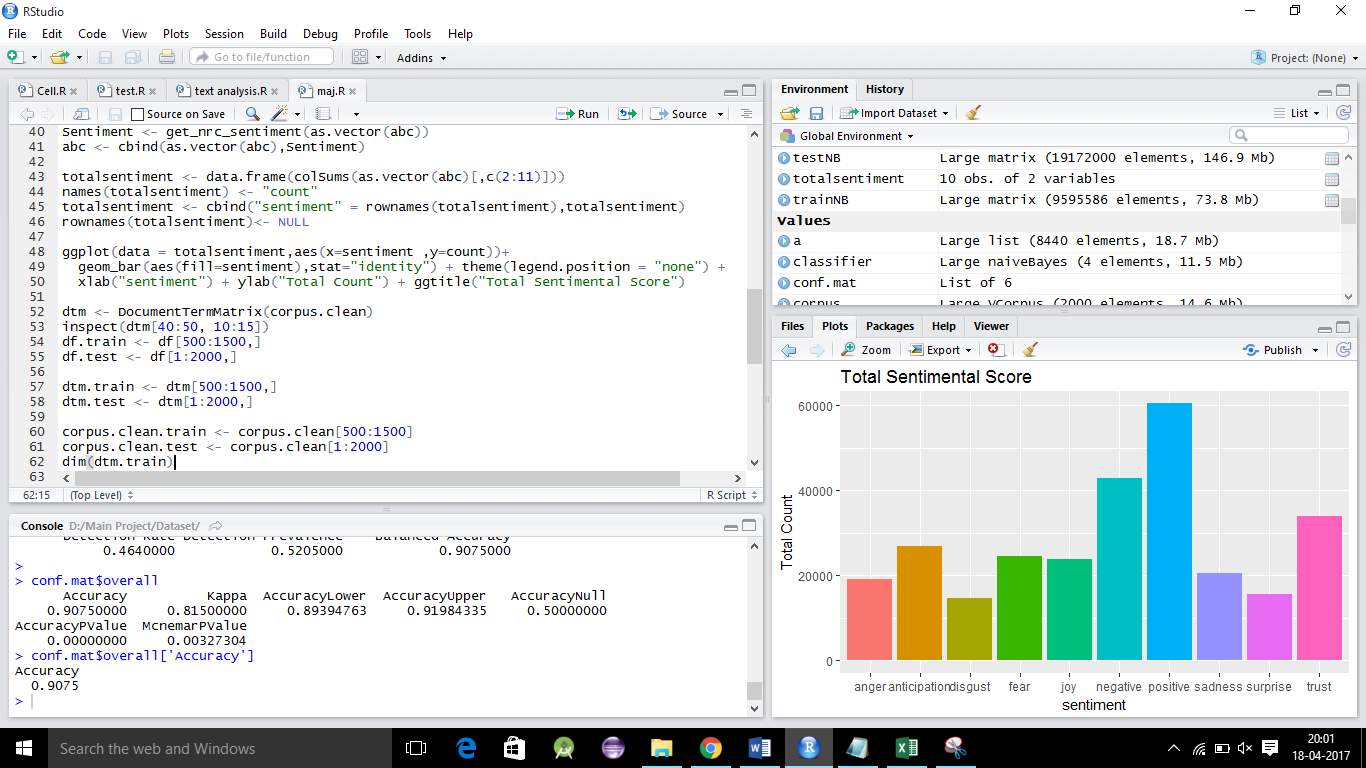
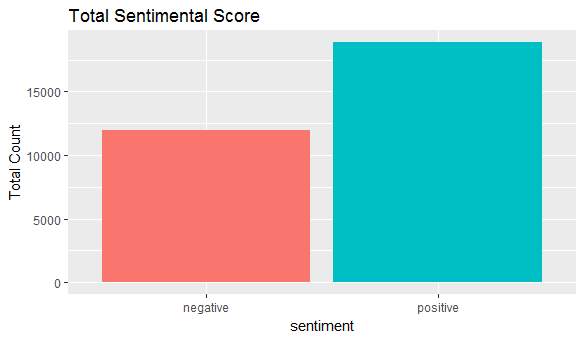
Fig 6.3 Barchat representation of product reviews on comparing positive and negative reviews
7. APPLICATIONS
Since there are a good number of applications based on sentimental analysis and opinion mining, many companies that are large and small scale are using sentimental analysis and opinion mining as part of their mission.
1) To review related websites:
The capabilities that a review-oriented search engine would have could also be used for the creation and automated upkeep of review and opinion aggregation websites. It can be used a s an alternative to sites like Epinions that solicit feedback and reviews. There is no need to restrict topics only to product reviews, but we can include other topics like opinions about candidates running to office, political issues in the office etc.
Summarizing the reviews given by users are is also important. One could think that errors in user ratings are also fixed. There are even some cases where users have given low rating accidentally but have given a positive review.
2) As a Sub-Component technology:
Sentiment-analysis and opinion mining also serve important role in enabling technology for other systems.
One of the possibility is, it can be used as an augmentation to recommendation systems, where it can behave as such a system not to recommend products that receive a lot of negative feedback.
Detection of “flames” (overly heated or antagonistic language) in emails or other types of communication is another possible use of subjectivity detection and classification.
In online systems that display advertisements as sidebars, it is helpful to detect webpages that contain sensitive content inappropriate for ads placement; for more sophisticated systems, it could be helpful to raise item promotions when pertinent positive opinions are identified, and maybe more vitally, nix the advertisements when applicable negative proclamations are found.
3) In Business and Government Intelligence:
Opinion-mining and sentiment analysis are well-suited to various types of intelligence applications. Business intelligence seems to be one of the main reasons behind corporate interest in the field.
Consider, for example, the following scenario. A major computer manufacturer, disappointed with unexpected low sales, finds itself confronted with the question: “Why aren’t consumers buying our laptop?” While concrete data such as the laptop’s weight or price of a competitor’s model are obviously relevant, answering this question requires focusing more on people’s personal views of such objective characteristics. Moreover, subjective judgments regarding intangible qualities — e.g., “the design is tacky” or “customer service was condescending” — or even misperceptions — e.g., “updated device drivers are not available” when such device drivers do in fact exist — must be taken into account as well.
The Sentiment-analysis or Opinion mining technologies for extracting opinions from unstructured human-authored documents would be excellent tools for handling many business-intelligence tasks. Continuing with our example scenario: it would be difficult to try to directly survey laptop purchasers who have not bought the company’s product because there will be thousands of reviews. Rather, we could employ a system that
(a) finds reviews or other expressions and emotions of opinion on the Web — newsgroups, individual blogs, and aggregation sites — and then
(b) Creates the condensed versions of individual reviews or a digest of overall consensus points.
This would save an analyst from having to read potentially dozens or even hundreds, thousands of versions of the same complaints.
Besides reputation management and public relations, one might perhaps hope that by tracking public viewpoints, one could perform the trend prediction in sales or other relevant data.
Government knowledge is another application that has been considered. For instance, it has been recommended that one could screen hotspots for increments in threatening or negative correspondences.
4) Across different domains:
As it is well known that opinions matter a great effect in politics. Some work has focused on understanding what voters are thinking about politics, whereas other projects have as a long term goal the clarification of politicians’ positions, such as what public figures support or oppose, to enhance the quality of information that voters have access to.
Sentiment analysis also helped in several aspects like it has specifically been proposed as a key enabling technology in eRulemaking, that allows the automatic analysis of the opinions that people submit about pending policy or government-regulation proposals.
8. CONCLUSIONS
With the variety of products increasing day by day the decision to opt for a particular product is becoming difficult. So, the need for sentimental analysis is increasing gradually. Although sentimental analysis tasks are challenging due to their natural language processing origins, much progress has been made over the last few years due to the high demand for it. Not only the consumer want to know about the product but also the companies want to know about the condition of their product in the market.
The growing need for product insights – and the technical challenges currently facing the field –will keep sentiment analysis and opinion mining relevant for the foreseeable future. Next-generation opinion mining systems need a deeper bind between complete knowledge bases with reasoning methods inspired by human thought and psychology. This will lead to a better understanding of natural language opinions and will more efficiently bridge the gap between unstructured information in the form of human thoughts and structured data that can be analyzed and processed by a machine.
The intelligent opinion mining systems are capable of handling semantic knowledge, making analogies, continuous learning and detecting emotions that are leading to the highly efficient sentiment analysis.
9. SUSTENANCE
Sentimental analysis does not always give the right solutions, sometimes it may be even wrong. There are several issues related to sentiment analysis that could lead to degrade of the popularity of its technique.
Some of them are:
1)Opinion spam
2)Result measure
3)Lack of complete information
1) Opinion spam:
It can be used by competitors to portray and influence negative image on company. If sentiment analysis gains popularity as a medium to gain popularity and image of a company or organization then that malpractices will become more common that leads to decrease in the popularity of sentiment analysis technique. If a company want to establish a good image for its product then it could use this technique in a wrong way and can earn fame which is not an advantage. So, it can even cause a negative influence even on a good product.
2) Result measure:
Since the outputs of sentiment analysis is based on the emotions, it is just a reactive measure and cannot be used to predict the performance of a company or other metrics. In some cases, sentiment analysis is just a reporting measure after the damage has occurred. It can be considered as a measure of scale rather than a prediction.
3) Lack of complete information:
If analysis is made by taking incomplete sources of information then that will be absolutely incorrect. Since we don’t get the complete information or data in most cases it becomes difficult to make analysis in most of the times. But sources like facebook and twitter can be mined to get complete information whereas from sources like blogs, forums etc we cannot get complete information.
9. FUTURE ENHANCEMENTS
Opinion examination is as of now advancing quickly from an exceptionally straightforward (positive, negative, unbiased) to more granular and profound comprehension. At Revealed Context (the innovation arm of Converseon), we have power and certainty scores, and in addition feeling and that’s only the tip of the iceberg. These new classifier truly dimensionalize the subtleties of human expression in significant ways. There is likewise a move far from report/record level examination of the content towards substance/aspect level – meaning each statement of feeling is caught with the goal that we can truly comprehend the underlying driver drivers of suppositions. This requires machine learning approaches that are superceding more conventional principles based methodologies.
Exhibit Sentiments hold a key to the future occasions. To make it sound somewhat specialized, you can state that the slants speak to the “present estimation of future occasions”. Presently this esteem can have profound social, political and money related criticalness. It can be “Articulation of supposition about an open figure”, “assessments communicated through tweets before races”, or “the buzz before a motion picture discharge”, all these can be extraordinary signals for things to come.
In this way when individuals remark about present news stories, the conclusion examination can really offer a key to foresee the future results or atleast suspect them better!
10. REFERENCES
Sentiment Analysis and Opinion Mining by Bing Liu (http://www.cs.uic.edu/~liub/FBS/SentimentAnalysisand-OpinionMining.html)
Sentiment Analysis by Professor Dan Jurafsky. (https://web.standford.edu/class/cs124/lec/ sentiment.pdf)
S. Blair-Goldensohn, Hannan, McDonald, Neylon, Reis and Reynar 2008 – Building a Sentiment Summarizer for Local Service Review. (http://www. ryanmcd.com/papers/local_service_summ.pdf)
http://en.wikipedia.org/wiki/Bayesian_probability.
http://en.wikipedia.org/wiki/Naive_Bayes_classifier.
http://www.let.rug.nl/~tiedeman/ml05/03_bayesian_handout.pdf.
http://www.statsoft.com/textbook/stnaiveb.html.
http://www.cs.cmu.edu/afs/cs.cmu.edu/project/theo-20/www/mlbook/ch6.pdf.
http://www.scoop.it/t/social-media-monitoring-tools-and-solutions.
http://www.saama.com/sentiment-analytics-the-gold-mine-which-you-didn-t-mine/
http://www.brandwatch.com/2013/12/social-data-gets-the-x-factor/
www.niemanlab.org/2013/01/feelings-nothing-more-than-feelings-the-measured-rise-of-sentiment-analysis-in-journalism/
Cite This Work
To export a reference to this article please select a referencing stye below:
Related Services
View all


Related Content
All TagsContent relating to: "Business Analysis"
Business Analysis is a research discipline that looks to identify business needs and recommend solutions to problems within a business. Providing solutions to identified problems enables change management and may include changes to things such as systems, process, organisational structure etc.
Related Articles

DMCA / Removal Request
If you are the original writer of this dissertation and no longer wish to have your work published on the UKDiss.com website then please: