Solar Flares: Mechanics, Terrestrial Effects, and Engineering Considerations
Info: 9262 words (37 pages) Dissertation
Published: 3rd Feb 2022
Tagged: Engineering
Table of Contents
Click to expand Table of Contents
1. Introduction
2. Background
3. The Sun and Solar Flares
3.1 Structure of the Sun
3.2 Magnetic Properties of the Sun and its Activity
3.3 Sunspots: The Source of Solar Flares
3.4 Formation of Solar Flares
3.5 Stages of a Solar Flare
3.6 Solar Flare Mechanics
3.7 Solar Flare Spectrum Case Study
3.8 Classification of Solar Flares
3.8.1 Optical Solar Flare Classification
3.8.2 X-Ray Classification
4. Effects
5. Observation Methods
6. Solar Flare Energy Capture and Storage
7. Solar Flare Effect Mitigation
8. Conclusion
References
List of Figures
Figure 2.1: Richard Carrington’s sketches of solar spot movement
Figure 2.2: Geomagnetic storm’s effects on the auroral zone
Figure 3.1: The Sun’s layers
Figure 3.2: Magnetic field lines of the Sun
Figure 3.3: Magnetic evolution of an 11 year sunspot cycle
Figure 3.4: Sunspots
Figure 3.5: Solar flare eruption
Figure 3.6: Magnetic reconnection
Figure 3.7: Theoretical solar flare gamma-ray spectrum
Figure 4.1: Diagram of Earth’s magnetosphere
Figure 4.2: Aurora formation
Figure 5.1: Lagrangian Point 1
Figure 5.2: Solar surface radiation measuring instruments
List of Tables
Table 3.1: Optical classification
Table 3.2: X-ray classification
1. Introduction
Several of the Sun’s effects on Earth are well-established and readily observable; the Sun provides heat, light, and a gravitational body around which Earth orbits. In addition to these effects, there also exists a relatively newly discovered solar-terrestrial connection based on the heliomagnetic activity at the Sun’s surface, and its accompanying emissions. These emissions travel through space and intersect with the Earth, affecting atmospheric composition, solar radiation levels experienced at the planet’s surface, and magnetic field behaviour, which can significantly impact life on Earth. This report focuses specifically on solar flares – a phenomenon that are a result of the sudden conversion of magnetic energy into thermal energy, which can result in an explosion charged particles and radioactive products being ejected from the Sun’s surface – and the ways in which they affect the solar-terrestrial relationship.
In addition to the brilliant displays of light in the sky that occur more frequently and in a larger section of the sky when these solar emissions reach uncharacteristically high levels, telecommunications can experience disruption or degradation, power distribution grids can be damaged, and spacecrafts and man-made satellites can be compromised. Along with these negative effects, there also exists the possibility of positive effects; particularly, collecting the energy emitted during solar flares and storing it for redistribution.
Engineering theory can be applied to both mitigating the negative effects of the charged particle and nuclear emissions of the Sun, as well as capitalizing on their positive effects. These present unique challenges that can have an impact on matters ranging from national security, to renewable energy supply and distribution, to advances in space travel, in addition to many others. As such, the various methods of observation and analysis of solar flares is crucial to understanding how to best respond to them.
2. Background
The observation and documentation of solar flares themselves is a relatively recent development, beginning in earnest with Galileo’s development of modern astronomical practices in the 1600s, however, the terrestrial effects of solar events have been documented as far back as the 7th century, during which “unusual rainbows” – apparently auroras – were observed and recorded separately within the same timeframe in China, Japan, and Europe. There are also several instances on record from the 10th to 13th centuries in which astronomers of China’s Song Dynasty describe “peaches” or “eggs” on the sun, which are thought by scientific historians to be the first documented observations of sunspots [1]. Visual indicators such as sunspots and auroras of solar events are the most reliable form of historical confirmation, as other indicators such as telecommunication disruptions were not possible at these points in human history.
One of the most noteworthy examples of a massive solar event following the advent of their direct observation was the Carrington Event, which describes British amateur astronomer Richard Carrington’s documentation of one of the most powerful documented geomagnetic solar storms on record [2]. Occurring on September 1, 1849, the event was pre-empted by the observation of an abnormally high number of sunspots appearing on the Sun’s surface. Following this, a solar flare was observed that became associated with the subsequent coronal mass ejection directed at Earth. This coincided with a geomagnetic storm on September 2, 1849, leading Carrington to believe solar flares had a direct effect on Earth, and making him the first astronomer to posit that a solar-terrestrial link existed with respect to solar flares. These effects manifested themselves in auroras observed around the world, including regions unusually close to the Equator, as well as in the failure of telegraph systems across North America and Europe [2]. Carrington’s solar spot tracking sketches from the time before the event can be seen in Figure 2.1.
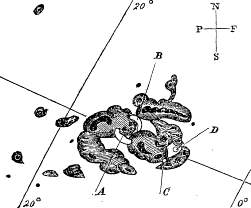
Figure 2.1: Richard Carrington’s sketches of solar spot movement pre-empting the Carrington Event [2]
The May 1921 Geomagnetic Storm serves as one of the first notable examples of disruption to electrical systems, which was localized to major urban centers due to its occurrence before wide-scale electrical grid implementation and interconnectivity. More recent severe geomagnetic events caused by solar activity include the Geomagnetic Storm of 1989, in which an X15-class solar flare caused a nine-hour outage in Hydro-Quebec’s electricity transmission system three days after its occurrence due to system breakers being tripped by increased ground currents [3]. As shown in Figure 2.2, the auroral zone was shifted towards the equator, where auroras could be uncharacteristically observed during the storm.
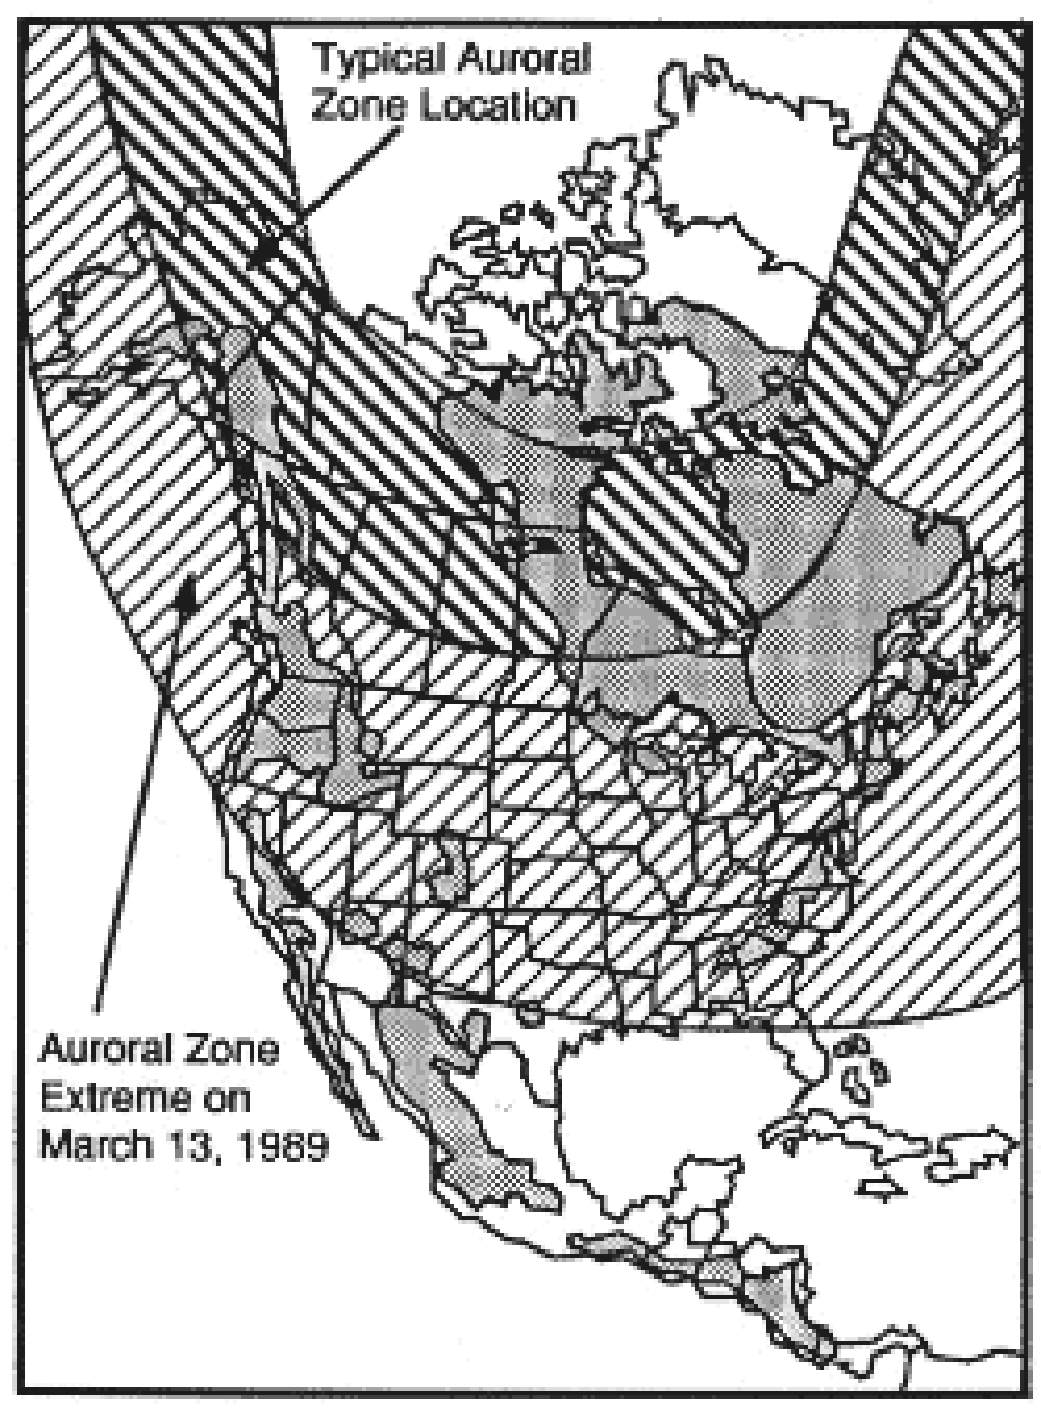
Figure 2.2: Effect of the 1989 geomagnetic storm on the expansion and movement of the auroral zone [4]
The X9.3 flare observed on September 6th, 2017, is the largest flare observed in the last decade, according to the National Oceanic and Atmospheric Administration’s Space Weather Prediction Center, with the last X9-class flare occurring in 2006. The effects of this flare included wide area blackouts and low-frequency navigational communication signals being degraded for approximately one hour [5].
In order to understand fully understand the nature of these phenomena related to solar flares, the Sun and the mechanisms that produce the flares must be understood.
3. The Sun and Solar Flares
3.1 Structure of the Sun
The Sun is approximately 1,390,000 km in diameter [6] and weighs approximately 1.989 x 1030 kg. It is plasma (charged gases) consisting of hot gases; mainly hydrogen, which makes up about 75 % of its mass, and Helium, which makes up about 25 % of its mass [7]. The Sun produces its energy in its core by the thermonuclear fusion of hydrogen atoms to form helium and releases photons. The Sun consists of an inner layer and outer layer. The inner layer is composed of three zones and the outer layer is composed of three regions as seen from Figure 3.1.
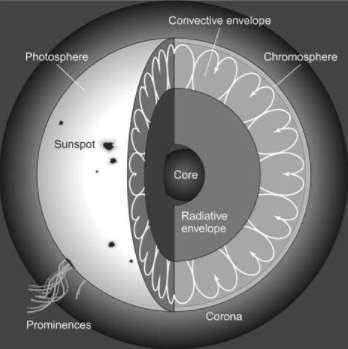
Figure 3.1: The Sun’s layers [1]
The Sun’s innermost interior layer is called the core, where energy is generated by nuclear fusion. Temperatures in the core can reach up to 15 x 106 oC. The next layer is the radiative zone where the energy generated in the sun’s core moves outwards by radiation heat transfer. Next is the convective zone in which energy travels outward from the radiative zone by convection heat transfer through a medium of hot gases [7]. These zones constitute the inner layer of the Sun.
The outer layer of the Sun, which is also called the solar atmosphere, consists of the photosphere, which is the innermost region, from which the bulk of the solar light is emitted. Above the photosphere, the solar atmosphere is transparent which allows light to escape. It is the deepest layer of the Sun that can be observed and constitutes the Sun’s surface. It is about 6500 K at the bottom and 4000 K at the top [8]. Physical features such as sunspots, bright faculae, granules and prominences (as seen in Figure 3.1) can be observed [9].
The next region is the chromosphere, which is about 4000 K to about 8000 K, making it hotter than the photosphere. It is not yet understood why this is the case but one plausible explanation is that there are tiny impulsive heating bursts called nanoflares, which can reach up to 10 million K that occur in this region and are responsible for the heating mechanism [10]. Another explanation is that there are magnetohydrodynamic waves (magnetic field conducted by the Sun’s plasma) that transport heat from below the Sun’s surface and through the chromosphere [11]. The next region is the corona which the Sun’s outer atmosphere and it is about 1 million K, as it is heated by the chromosphere. The corona is visible during solar eclipse. It contains hot gases and plasma [7].
3.2 Magnetic Properties of the Sun and its Activity
It is not known where the magnetic fields of the sun are formed [12], however, it is known that much of the activity of the Sun is directly related to its magnetic field. Physical manifestations such as prominences, sunspots, coronal loops and polar plumes are all results of the magnetic field of the Sun [9]. As seen from Figure 3.2, the Sun has a range of magnetic field lines stretched across its surface.
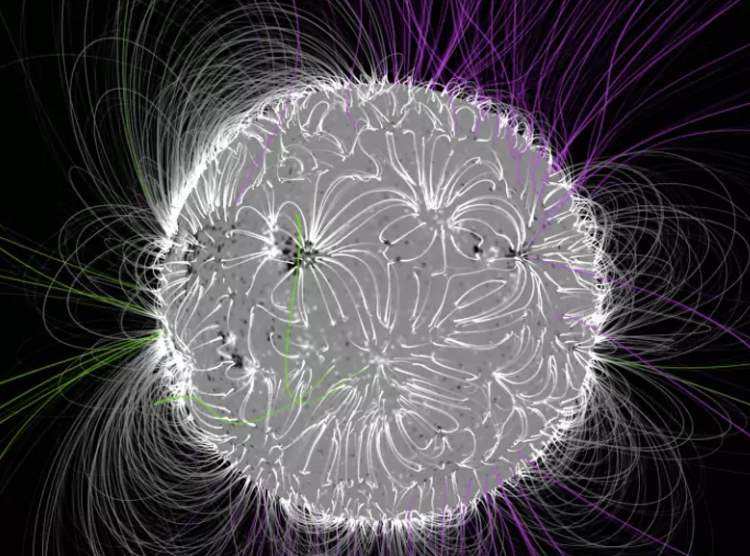
Figure 3.2: Magnetic field lines of the Sun.
Credits: NASA’s Goddard Space Flight Center/Duberstein
Some of these field lines extend out of the surface of the Sun and into space while some loop out and back into the solar surface. The interaction of these field lines cause the explosive activity of the Sun [12].
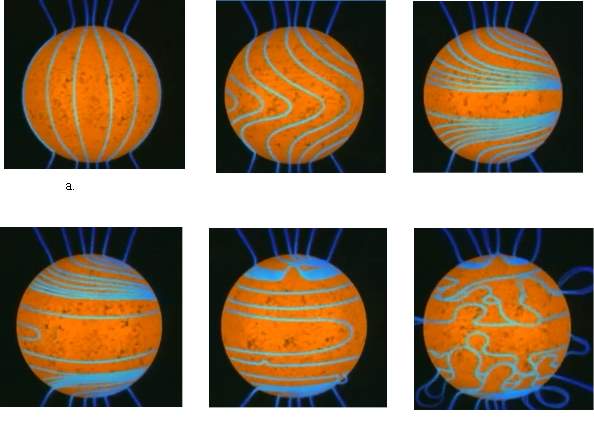
The magnetic field lines are originally smooth and ordered, but as the Sun rotates with differential speeds at its equator and poles, the field lines become tangled and disorderly. Active regions are formed where there is concentration of magnetic field lines and are usually manifested as sunspots. The Sun has a 22 year solar cycle during which the north and south poles interchange positions. The activity of the Sun is also marked with the sunspot cycle which lasts 11 years, exactly half the solar cycle [13]. Figure 3.3 shows an evolution of an 11 year cycle.
Figure 3.3: Magnetic evolution for an 11 year sunspot cycle: a.the magnetic field is aligned b.the rotation of the Sun begins to curve the field lines c.the lines become fully curved spirally d. the lines begin to bunch up e.the rotation begins to further warp the lines f.the rotations eventually causes the field lines to be fully disorderly with emerging active regions [13].
The sunspot cycle is the duration which marks the peaks of the magnetic field entanglement. During the peaks, the energy of the magnetic field is released by explosions commonly known as solar flares and the magnetic fields reset.
3.3 Sunspots: The Source of Solar Flares
Sunspots are temporary disturbed areas in the photosphere that appear darker than the surrounding area because there are cooler, as seen in Figure 3.4.
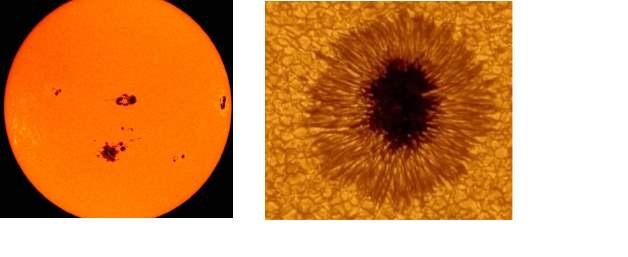
Figure 3.4: Sunspots a.Sunposts on the Sun b.a magnified visual of a Sun spot [14]
Sunspots consist of concentrations of strong magnetic fluxes about a thousand times stronger than the average solar magnetic field. They usually occur in pairs of opposite polarity [15]. Sunspots are cooler than the surrounding areas because the high surrounding magnetic fields produce pressures inside the sunspots that prevent convective flow of hotter gases outwards from the inner layers of the Sun, making it cooler [16]. Sunspots have temperatures of about 4,000 K, which is much cooler than the surrounding temperatures of about 5,800 K. Sunspots can reach about 50,000 km in diameter and can last from days to months.
The number of sunspots varies depending on the sunspot cycle. A peak in the Sun spot cycle is referred to a solar maximum and a period of few sunspots is called a solar minimum. During the solar maximum, the sunspots have so much magnetic field build up that energy is released through solar storms and solar flares.
3.4 Formation of Solar Flares
A solar flare is a solar explosion that occurs when magnetic fields build up around sunspots in the solar atmosphere. When the magnetic fields build up enough energy, the energy is suddenly released with the emission of coronal mass and electromagnetic radiation spanning the whole electromagnetic spectrum [9]. It is seen as a sudden, intense brightening of the region of a Sun as shown in Figure 3.5.
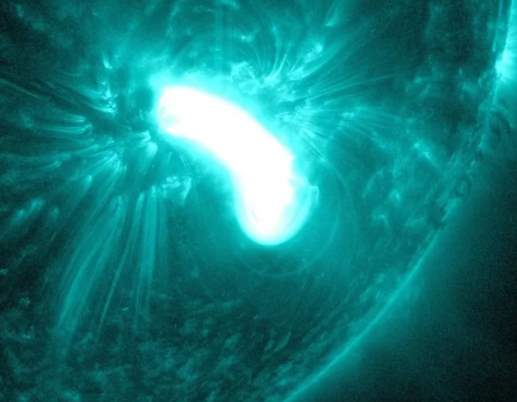
Figure 3.5: Solar flare eruption credits: NASA/SDO
The occurrence of solar flares is directly related to the sunspot cycle. At the solar maximum, there is a peak number of sunspots with built up magnetic fields of opposite polarity. When these sunspots interact with each other, the magnetic fields become more entangled leading to a solar flare as release of energy which can last for several minutes. Solar flares occur on the Sun’s surface and extends out to the corona [15].
3.5 Stages of a Solar Flare
The occurrence of a solar flare is generally broken down into three evolutionary stages namely:
Precursor stage: This is the first stage where the release of the magnetic field is triggered. The magnetic fields of two sunspots of opposite polarity have interacted and the magnetic field lines connect with one another. At this point, some brightening can be observed [17],[18]. Soft x-rays (lower energy x-rays) are emitted in this phase.
Impulsive stage: This is the second stage where the flare occurs and protons and electrons are accelerated to energies of an excess of 1 MeV. Radio waves, hard x-rays and gamma rays are emitted.
Decay stage: This is the last stage where the solar eruption has passed its peak and the slow build up and decay of soft x-rays are detected [18],[19]. The hard x-rays and gamma rays emitted decay faster than the soft x-rays which cause the build up.
The stages of solar flares vary in length with any of the stages occurring from as little as a few seconds to as long as an hour.
3.6 Solar Flare Mechanics
The interaction of the magnetic field lines near sunspots that cause solar flares occur by magnetic reconnection. The magnetic field lines are possessed by plasma; under normal conditions, the magnetic fields do not break or merge with other field lines. However, as sunspots come into close proximity with each other, the magnetic field lines get closer and the entire pattern of the magnetic field changes and realigns into a new configuration. This is called the magnetic reconnection also shown in Figure 3.6. During this interaction, the magnetic energy is converted into thermal energy, mass motions and particle acceleration. [20].
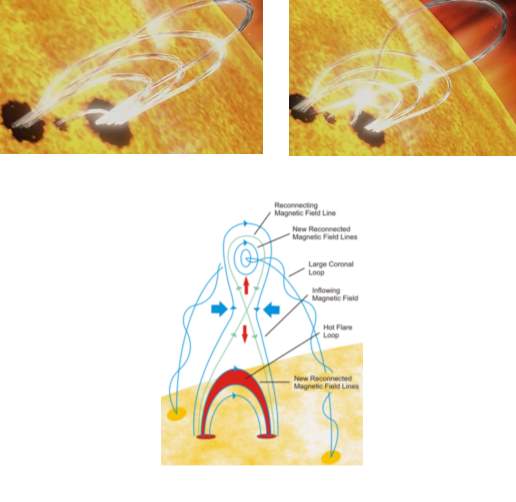
Figure 3.6: Magnetic reconnection (Credits: NASA Goddard) a. A pair of sunspots in close proximity b. Reconnection occurring c. Schmatic of magnetic reconnection
The thermal energy heats up the surrounding plasma to temperatures of at least ten million K, plasma at such high temperatures emit soft x-rays through the interaction of free electrons with the nuclei (mainly the protons) of the plasma. This radiation is called Bremsstrahlung as the radiation is produced as the electrons deflected in the coulomb filed of the ions. When the thermal energy builds up for several minutes, an explosion occurs leading to the ejection into interplanetary space of coronal mass and high-energy particles [18]. The total optical emission continues to increase for some minutes and the whole atmosphere can remain activated subsequently on a decay time scale of about one hour. For a large scale solar flare there is approximately (within factors of 2) 1032 ergs (1 eV = 1.6 x 10⁻¹² ergs) of energy emitted during the explosion, mainly in the kinetic energy of 1036 g of coronal mass ejected at about 1500 km/sec and a large fraction from accelerated particles of ions and electrons and another 1032 ergs are emitted in the decay stage mainly in optical radiation. It is estimated that about 1036 – 1037 electrons in the 10 keV – 0.1 MeV energy range are emitted along side hard x-rays impulsive bursts during the explosive stage. About 1031 – 1033 electrons in the 0.1 – 3 MeV range are accelerated during the decay stage. High-energy nuclei in the range of 0.5 MeV-30 GeV, which are contribute to 1030 ergs of energy are emitted. It is not exactly known at what stage these nuclei are emitted. Low energy electrons in the 10 eV – 1 keV range are also emitted. These lower-energy electrons constitute the bulk of the active electron energy. It is not clear either whether the optical continuum emission in a white light flare is thermal or is due to synchrotron radiation. In the latter case the bulk of the entire active electron energy would reside in electrons in the 200 MeV range [21],[22].
After the sudden explosion and mass ejection, the decay phase commences, energy in this phase is emitted majorly in optical radiation. It is uncertain whether this radiation is due to turbulent heating or to excitation by high-energy particle. However, it is likely that the high-energy electrons and protons are produced in turbulent motions. Using a quantitative theory of the decay of the turbulence by ohmic dissipation in the magnetic field, the decay time can be estimated. The dissipation time due to the skin effect in eddies of diameter D, with turbulent velocities vt, is found to be (4πσD3/c2 vt)1/2 where σ is the conductivity in esu. If vt = 200 km/sec, as observed in the chromosphere, with D = 100 km and σ = 2.1013 esu, the correct decay time approximately one hour is obtained [21].
3.7 Solar Flare Spectrum (Study by Ramaty, R. and Mandzhavidze, N)
In a solar flare, electromagnetic radiations of all wavelengths are emitted but special focus would be placed on gamma ray emissions, the most energetic of them all. The gamma ray emissions result from interactions of the fast particles with an underlying ambient medium. As seen from Figure 3.7, solar flare gamma ray emission exhibits both lines and continuum [22].
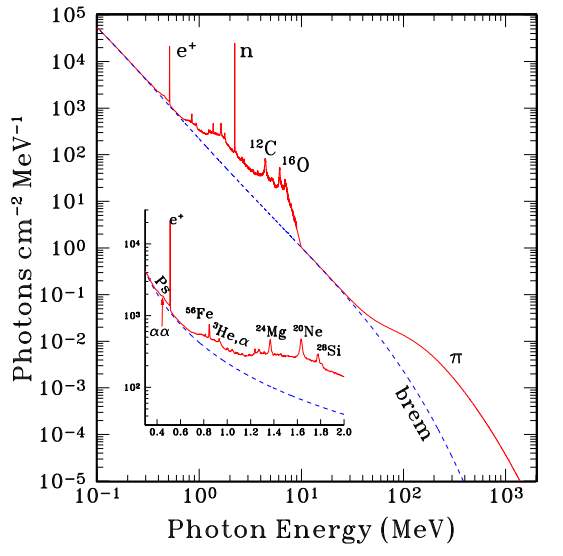
Figure 3.7: Theoretical solar flare gamma-ray spectrum [22].
The lines appear at energies ranging from 0.5 to 8 MeV and the continuum extends up to about 1000 MeV. Up to about 1 MeV, and from about 10 to 50 MeV, the continuum is dominated by bremsstrahlung. The lines result from the deexcitation of nuclei, from neutron capture and from the annihilation of positrons. The broadening of the deexcitation lines is due to Doppler shifting of the monochromatic radiation produced in the rest frame of the excited nuclei. The strong, very narrow line at 2.223 MeV is due to neutron capture. The dominant neutron production mode in solar flares is the breakup of He nuclei, both in the accelerated particles and the ambient medium. The neutrons propagate both upward, away from the Sun, and downward into the photosphere where they are thermalized by elastic collisions with protons and subsequently captured mostly by protons to produce deuterium and essentially monoenergetic photons at 2.223 MeV, the binding energy of deuterium [22].
At 0.511 MeV there is positron annihilation. The positrons result mainly from the decay of various short-lived radioactive nuclei. The positrons subsequently either annihilate directly into 0.511 MeV gamma rays, or form positronium (an atom similar to hydrogen with the nuclear proton replaced by a positron), which also annihilates into gamma rays. Positronium annihilation leads to both line emission at 0.511 MeV and continuum below this energy [22].
Two strong lines result from the interactions of α particles with He. Fast and ambient 4He nuclei fuse into 7Li and 7Be which are created either in their ground states or in their respective excited states at 0.429 and 0.478 MeV. Because of Doppler broadening, the resulting de-excitations produce a relatively broad emission feature centered on 0.45 MeV. The combined feature, generally referred to as the αα line (from the Lyman Series), can be seen in Figure 3.7, superposed on the positronium continuum (denoted by Ps) and Bremsstrahlung continua. Along with the αα line, there are several other lines which can only be excited by accelerated α particles, as well as lines which are excited exclusively by accelerated 3He nuclei. The latter are of interest because of the very large 3He abundances observed in accelerated particles from impulsive flares. The lines in particular are at 1.00, 1.05 and 1.19 MeV, and at 0.937, 1.04 and 1.08 MeV, from α particle and 3He induced reactions, respectively. At high energies the continuum in some flares is dominated by pion decay radiation. Neutral and charged pions are produced mostly in high energy (greater than hundreds of MeV) proton-proton, protonα particle and α-α interactions. Neutral pions decay directly into two photons, while charged pions decay (via muons) into secondary electrons and positrons which produce gamma rays via Bremsstrahlung and annihilation in flight [22].
3.8 Classification of Solar Flares
Solar flares are classified on different scales, namely X-ray and Optical classifications [23].
3.8.1 Optical Solar Flare Classification
This classifies the flares on the basis of area (in degrees of heliocentric latitude) at the time of maximum brightness. A suffix (F, N or B) is added if the brightness (determined by visual estimate) is faint, normal or bright [23]. Table 3.1 below shows this classification. The classes are names starting from S (subflare), at the lower end of the scale, to importance 4, at the higher end of the scale.
Table 3.1: Optical classification [23]
| Class (Importance) | Area (deg2)* |
| Subflare (S) | |
| 1 | 2.1 – 5.1 |
| 2 | 5.2 – 12.4 |
| 3 | 12.5 – 24.7 |
| 4 | >24.7 |
*One square degree is equivalent to 1.214 x 10⁴ km
3.8.2 X-Ray Classification
This is the more commonly used classification. Solar flare X-ray classification divides solar flares according to their strengths. The classes are classes A, B, C, M and X. The classification system is similar to the Richter scale for earth quakes where each letter represents a 10-fold increase in energy output. Table 3.2 below gives the energy range of the classes.
Table 3.2: X-ray classification [24]
| Class | Energy range (W/m2) |
| A | |
| B | >̲10-7 |
| C | >̲10-6 |
| M | >̲10-5 |
| X | >̲10-4 |
Within each class, there is a finer scale from 1 to 9, however, the X-class flares, which are at the upper limit of the scale go beyond a finer scale of 9 with solar flares of about X45 being observed [25]. The C-class and below are too weak to be noticed by earth with the A-class having about the energy of background radiation. These are more common during the solar minimum. The M-class solar flares, sometimes called medium large solar flares, cause small to moderate radio blackouts on the daylight side of the Earth. They could be large enough to cause a CME. The X-class solar flares are the strongest, occurring about 10 times a year majorly during solar maximums. These could cause severe geomagnetic storms on Earth [24].
4. Effects
The means through which solar flares are able to affect the Earth occur via solar wind. Solar wind is the term given to the charged particles and radiation products which are ejected from the Sun’s surface, and travel through space. The impact of solar wind on Earth is predominantly the result of this stream intersecting with the Earth’s magnetosphere and atmosphere.
The magnetosphere is defined as the region of space for which Earth’s magnetic field is the dominant magnetic field, and this serves as one of the Earth’s primary means of protection from solar wind. As the diagram in Figure 4.1 shows, charged particles from the solar wind stream intersect with the magnetosphere, and travel around the Earth.
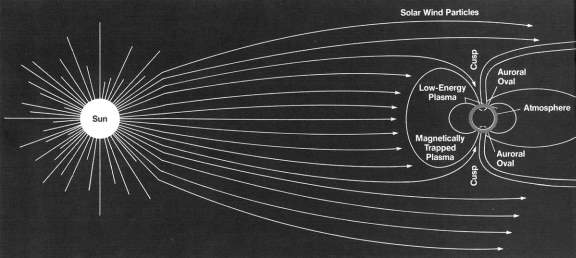
Figure 4.1: Simplified diagram of the Earth’s magnetosphere being impacted by solar wind particles [26]
This intersection causes compression of the magnetosphere and atmosphere on the Earth’s Sun-facing side, while a long tail is formed trailing off the dark side of the Earth. At the planet’s poles, auroral ovals are formed where the magnetic field lines are almost normal to the surface, and electrons and ions are drawn into atmosphere. As these impact the atoms present in the atmosphere, energy is imparted, which result in the emission of photons once the atoms return to their non-excited state. These result in auroras, brilliant displays of light in the sky whose colour depend on the type of atom being excited [27]. This process is shown in Figure 4.2.
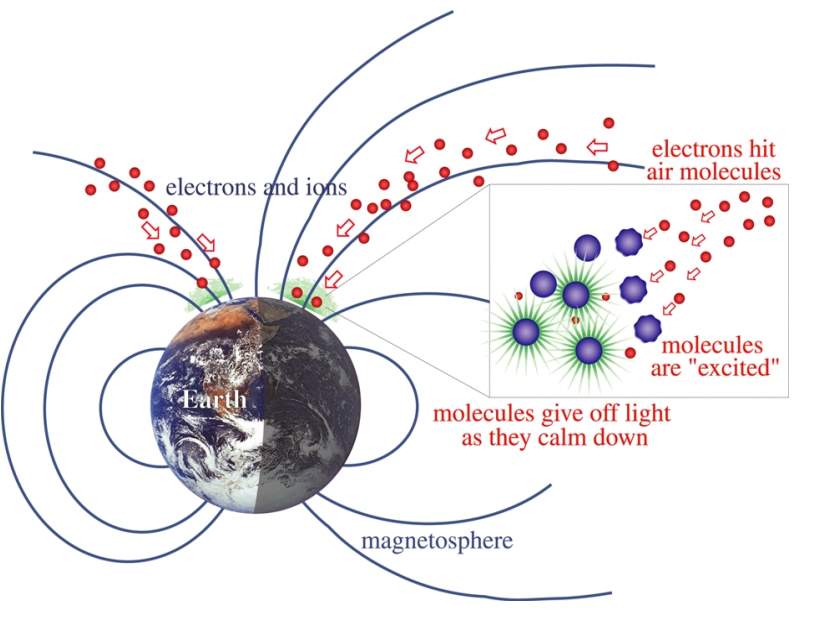
Figure 4.2: Aurora formation [27]
In the case of the Geomagnetic Storm of 1989, the charged particles from the solar flare were able to penetrate more deeply into the magnetosphere, resulting in their collision with atmospheric molecules closer to the Equator once they had reached the atmosphere along their respective magnetic field lines [23].
Due to the variable nature of solar flare emissions, their distortion of the magnetosphere is also variable. This means that as the plasma impacts the magnetosphere, it experiences oscillatory expansion and contraction, which causes electromagnetic induction by Faraday’s Law on the Earth, resulting in an elevated ground current [28]. Additionally, the rate of these oscillations create a current which is pseudo-DC, meaning that even though it is alternating, it’s alternating on a longer, more irregular period than power distribution grids. As such, power distribution grids can be damaged or disrupted by the increase and irregularity of ground currents for which their transformers are not rated, or for which precautionary switches would be tripped, respectively. Similarly, conduction-based telecommunications cables experience signal disruption when these currents are induced, as the man-made lines provide a path of lower resistance along which the magnetically induced current can travel.
The effects of solar flares at the Earth’s surface are also significantly diminished by radiation products such as X-rays being absorbed by the atmosphere. As X-ray photons travel through the atmosphere, they encounter oxygen and nitrogen atoms. When they collide with these atoms, the energy from the X-ray is absorbed, causing an electron to be released. These collisions result in an overall energy increase in the atmosphere, which – in turn – causes an increase in temperature and an accompanying expansion of the Earth’s ionosphere. The ionosphere is the layer of the atmosphere through which man-made high-frequency radio waves travel, and this expansion leads to the ionosphere’s distortion, resulting in disruption of these radio transmissions, and inhibiting global communication and positioning systems.
Additionally, this expansion of the ionosphere can affect spacecrafts and satellites. As the ionosphere increases in size, it intersects with a satellite’s trajectory, introducing unforeseen friction which slows the satellite, necessitating a course adjustment and possibly causing a premature re-entry. Satellites and spacecrafts are also prone to charged particles causing an electrical discharge that can destroy its onboard electronics systems. As the charged particles strike the satellite, charge can begin to accumulate on different parts of the satellite at different rates. If sufficient charge accumulates on adjacent components creating a significant voltage difference, the eventual rapid discharge can damage or destroy electronics. If the satellite is used for rerouting communications signals, this can once again lead to inhibited communications, albeit indirectly [28].
The Earth’s climate can also be affected by the total energy emitted by the Sun that reaches the planet. Although sunspots generally follow an 11 year cycle, there exists variability from cycle to cycle in terms of energy emissions, resulting in long-term climate trends that are at least partially caused by solar events. There also exist periods in which sunspots do not appear to follow the established trend. In the case of the Maunder Minimum, an era in the 1600s that had very few detectable sunspots and solar activity, Earth’s climate was found to decrease in temperature to match the decrease in solar energy output that becomes Earth’s energy input [6]. This time was termed the Little Ice Age, and serves to underscore the importance of continued observation of solar surface activity due to its direct effect on our climate.
5. Observation Methods
In order to better understand solar flares, and effectively mitigate their negative effects or exploit their positive effects to our benefit, they must undergo continued observation and analysis. Observation of solar events can be sub-divided into space-based and ground-based categories. Space-based observations consist of observations performed from spacecraft and satellites in orbital or extra-orbital locations relative to the Earth, giving the observatories the advantage of a generally unimpeded and uninterrupted view of the Sun at all times, as well as the ability to experience space weather before it reaches the planet. Ground-based observations consist of terrestrial observation of solar events, after having been affected by the Earth’s atmosphere. Additionally, ground-based observation includes the study of traces of historical solar events in radionuclide records constructed from ice core and tree ring samples, the characterization of which would allow for the determination of the long-term implications of the solar-terrestrial relationship on climate.
Primary space-based observations of solar events have been performed by the Solar and Heliospheric Observatory (SOHO), a cooperative effort between NASA and the European Space Agency consisting of a spacecraft launched in 1995, with the mission of investigating the chromosphere, transition region, and corona of the sun, studying the interior structure of the sun using helioseismology, and observing space weather phenomena from Lagrangian Point 1 (L1) [29]. L1 is the point in celestial mechanics at which the spacecraft is able to maintain its position relative to the Sun and the Earth without any external control inputs, relying only on the effects of gravity. L1 is ideal for the SOHO’s observational mission as it provides an uninterrupted view of the Sun and sits in the path of any space weather associated with solar flares. Figure 5.1 shows L1’s position relative to the Sun and the Earth (not portrayed to scale).
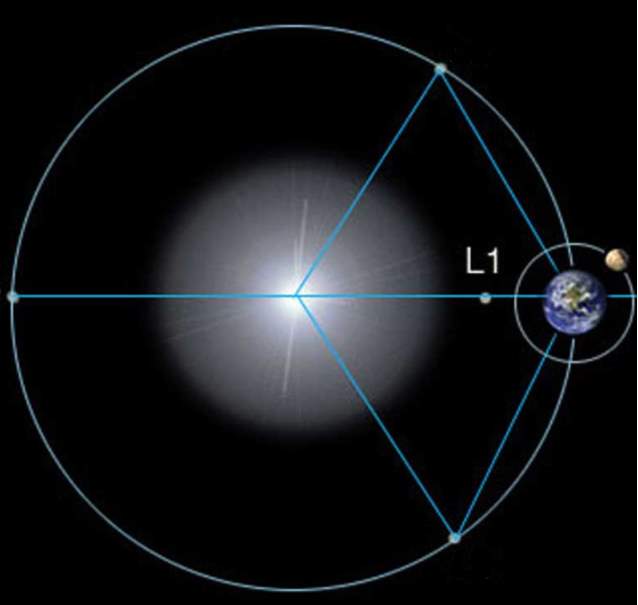
Figure 5.1: Langrangian Point 1, where the Solar and Heliospheric Observatory orbits [29]
The SOHO primarily uses helioseismological methods to study the Sun’s interior, wherein inferences are made regarding the structure and behaviour of the sun through the sound waves created by convective processes at the Sun’s surface. This is comparable to geoseismology, which entails the study of the Earth’s interior by observing oscillatory behaviour at its surface. The field is split into global and local helioseismology, which are the study of oscillatory waves propagating through the Sun’s interior, and the wave behaviour solely at the Sun’s surface, respectively.
With respect to solar flares specifically, the SOHO houses two payloads that are explicitly meant for analyzing solar weather. The Charge, Element, and Isotope Analysis Stream (CELIAS) is responsible for analyzing solar wind as it travels past the installation, polling the charge, elemental, and isotopic composition of the solar wind, as its name implies. The CELIAS is also able to serve as a warning system for Earth, intercepting solar wind 30-60 minutes in advance of the planet.
The Solar Wind Anisotropies (SWAN) is responsible for detecting the relative strength of the solar wind blowing toward Earth by reading the pattern of ultraviolet light which alien hydrogen atoms emit uncharacteristically. As particles travelling in the solar wind impact these hydrogen atoms, they lose their electrons, as well as their UV glow. By analyzing the UV pattern, the relative strength of the wind can be determined [29].
Ground-based solar flare observation methods vary widely in their level of sophistication. For example, solar radiation bombarding the Earth’s surface can be measured by precisely oriented pyrheliometers and pyranometers, such as those shown at the Aerological Observatory of Japan in Figure 5.2.
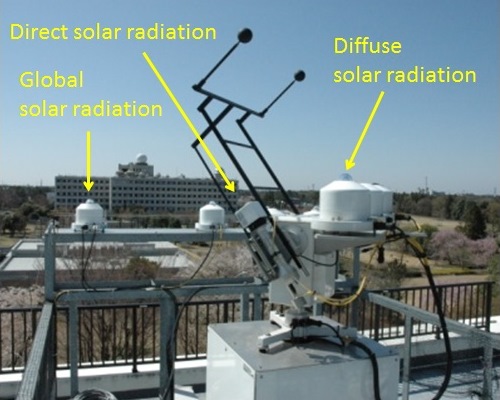
Figure 5.2: An array of pyrheliometers and pyranometers used to measure surface radiation. Direct radiation describes energy reaching the Earth’s surface normal to a beam of sunlight, diffuse radiation describes energy reaching the surface via diffusion and reflection processes by way of the atmosphere, and global radiation describes the total solar radiation reaching the Earth’s surface [30].
These instruments are stimulated by the incoming radiative waves, and convert the radiation to heat using thermopiles, ultimately providing a voltage reading which corresponds to the radiation being measured [30].
Temporal variations in cosmic radiation from solar activity are being studied through the examination of radionuclides such as 10Be, which can be produced by cosmic rays and stored in polar ice cores after bombarding the planet, and offer the ability to potentially reconstruct the sequencing of cosmic activity, and its associated effects on the planet. The mechanism in which this bombardment and storage process occurs consists of 10Be nuclides forming during cosmic rays’ interaction with atmospheric gases, and being transported to the ground as an aerosol, where they become part of the ice core radionuclide record. Despite the study of these ice cores presenting the possibility of determining long-term trends, these methods of tracking solar activity are currently considered to be unreliable, due to uncertainties introduced on an annual time scale by atmospheric mixing, and other means of radionuclide deposition to the ice [31].
The records of these events are being studied in an effort to determine whether or not any correlation can be determined between solar events and their effect on Earth’s climate. Due to the scientific community’s current inability to study solar events and other space weather definitively based on traces left behind terrestrially, information that has been explicitly documented by humans describing these events needs to be studied in order to determine their effects, while predating direct observation. There is no way for scientific historians to confirm with absolute certainty that the events being described are, in fact, the effects of solar events being experienced on Earth, and factors such as antiquated language to describe the phenomena make the endeavor uniquely challenging, which places greater relative certainty on directly observed solar events.
These methods of observation can be used to study solar flares in an effort to benefit from them, as well as lower the risks associated with them.
6. Solar Flare Energy Capture and Storage
The Sun is an enormous generator of power that is constantly undergoing the process of thermonuclear fusion. Engineers and scientists have, for years searched for ways to utilize the energy produced by the Sun. This has led the production of solar cells and solar panels. Hypothetical structures such as the Dyson’s sphere (a megastructure around a star to utilize all of its energy [32]) have been proposed for further utilizing the sun’s energy. Therefore, if solar flares produce enormous amount of energies by accelerated particles, they could be utilized to provide energy for human kind. However, beyond the prohibitive scale of a project such as the Dyson’s sphere, the feasibility of embarking on such a venture to utilize energy from solar flares is not justified due to the following two points.
- Frequency and Direction: Solar flares are irregular and intermittent. Their frequency varies from several a day during the solar maximum to less than one a week during the solar maximum with an average life time of 10 minutes [33] [34]. Coupled with the irregularity of solar flares is the direction of the flare. Solar flares travel out directly from the site of the flare [35], therefore, comparing the size of the sun to the Earth, there is a low possibility of most of the flares occurring to be directly aimed at Earth for capture.
- Energy Storage: As previously established, the energy produced by a solar flare is about 2 x 1025 J. If such a flare is directly aimed at Earth for utilization, there would be lots of issues concerning the storage of such an amount of energy. Currently, the world’s largest energy storage was built by Tesla in South Australia [36]. This storage contains an array of about 400,000 batteries that are about 2.1 by 1.3 by 0.8 m in size and 1,200 kg in weight and cost about 390 million dollars and can only store about 120 MWh. Therefore, the cost and space required to store energies from solar flares would be unprecedented and not feasible [37].
Considering these above points, utilization of solar flare energy would not be a feasible engineering venture. However, the study of solar flares could prove useful to the scientific world to provide more understanding about are solar flares form and other processes on the sun and other stars [18]. The study of solar flares can prove useful to the engineering world because understanding them better can help prevent the potential damage they could cause electronics, satellites and spacecrafts as common methods such as shielding do not protect from high-energy protons [38].
7. Solar Flare Effect Mitigation
The breadth of ways in which solar flares can disrupt life on Earth make it a problem that can be solved, or whose effects can be lessened, in a variety of different ways. Telegraph disruption, for example, is a negative effect on an antiquated technology, and therefore no longer warrants an engineered solution as it was naturally resolved. Its modern equivalent – that of conduction-based telecommunication wires – is of far greater consequence, as much of the world’s communication infrastructure is still dependent on these wires. It has been found, however, that the degradation in signal quality is not observed through the use of fibre-optic cables due to their core made of glass or plastic, as was observed during the Geomagnetic Storm of 1989 [3]. Although expensive, other benefits of fibre-optic communication cables that are unrelated to solar flare effect mitigation have made them desirable to the point that they are in the process of replacing much the traditional conduction-based wire infrastructure, with geomagnetic storm protection serving as an added benefit.
Power distribution grids require protection from solar flare-induced geomagnetic storms, and several methods have been proposed to accomplish this. First, surge protection could be implemented by the installation of emergency energy overflow storage systems to prevent equipment damage [39]. For instance, flywheels could be used to convert excess energy introduced to stored mechanical energy, or capacitor banks could be used to convert excess energy to stored electrical energy. Second, power distribution grid transformers could be designed to withstand the elevated ground current surges in addition to their normal surge protection. Both of these methods face the same problem, in that there are high costs associated with each, and they would only be needed in extremely unlikely circumstances.
In light of this, observation and avoidance has become the preferred method for grid protection. With enough advance warning, and the proper response protocols in place, the grid can be manually shutdown during geomagnetic events, effectively isolated it from harmful surges.
The energy storage solutions proposed for power grids can be implemented in spacecrafts, where static discharge is the main danger presented by solar flares. By designing non-electrical components from non-electrically conductive materials, and heavily insulating electrical components, charge buildup can be redirected into an energy storage body and dissipated in a controlled manner. This is possible due to its small scale relative to a power distribution grid.
8. Conclusion
Solar flares are caused by energy released by heliomagnetic processes on the Sun’s surface, and can result in the ejection of charged particles and radiation products which travel through space in the form of solar wind, and can potentially affect the Earth if they intersect. The Earth is largely protected by its magnetosphere, which deflects charged particles around the planet, and the atmosphere, which absorbs the majority of photons carried by solar wind. Despite this protection, the increase in solar wind strength following a flare can still adversely affect the Earth in the form of increased ground current causing power grid and communications disruptions, ionosphere expansion causing high-frequency radio signal degradation and satellite orbital friction, and increased radiation at the Earth’s surface.
Engineering theory cannot currently provide an effective means of storing and using the immense energy produced by solar flares. Additionally, solar flares do not offer a consistent and reliable source of energy; the likelihood of being directly impacted by a solar flare’s emission cloud is highly unlikely given the nature of emission trajectory with respect to the size of the Earth, making them a poor candidate for a viable renewable energy source.
Lessening the risks of solar flares is a multifaceted task; some of the risks have already been solved by the natural progression of technology – such as signal disruption in antiquated telegraph lines – while others still pose problems with no clear solution – such as the degradation of high-frequency radio waves which travel through the ionosphere in global communication and positioning systems. Solutions for power distribution grid disruption due to ground current surges exist in the form of energy storage devices such as flywheels and capacitor banks, however, the cost of implementing these solutions is prohibitive given the events’ rarity. The most effective means of risk mitigation is observation and advance warning of impending increases in solar emissions, paired with an effective response protocol.
References
[1] R. Nuwer, “Ancient Documents Reveal Sunspots, Auroras and Other Solar Activity before Galileo?”, Scientific American, 2016. [Online]. Available: https://www.scientificamerican.com /article/ancient-documents-reveal-sunspots-auroras-and-other-solar-activity-before-galileo/. [Accessed: 25- Mar- 2018].
[2] T.E Bell and T. Phillips, “A Super Solar Flare”, NASA Science, 2008. [Online]. Available: https://science.nasa.gov/science-news/science-at-nasa/2008/06may_carringtonflare [Accessed: 25- Mar- 2018].
[3] T. Phillips, “Severe Space Weather–Social and Economic Impacts”, NASA Science, 2009. [Online]. Available: https://science.nasa.gov/science-news/science-at-nasa/2009/21jan_severespaceweather [Accessed: 25- Mar- 2018].
[4] S. Odenwald, “The Day the Sun Brought Darkness”, NASA Science, 2009. [Online]. Available: https://www.nasa.gov/topics/earth/features/sun_darkness.html [Accessed: 29- Mar- 2018].
[5] S. Lewin, “Sun Unleashes Strongest Solar Flare of Past Decade?”, Scientific American, 2017. [Online]. Available: https://www.scientificamerican.com/article/sun-unleashes-strongest-solar-flare-of-past-decade/ [Accessed: 23- Mar- 2018].
[6] “Properties of the Sun”, Cliffsnotes.com, 2018. [Online]. Available: https://www.cliffsnotes.com/study-guides/astronomy/the-sun-a-representative-star/properties-of-the-sun. [Accessed: 24- Mar- 2018].
[7] ”Our Star the Sun”, Soho.nascom.nasa.gov, 2018. [Online]. Available: https://soho.nascom.nasa.gov/classroom/sun101.html. [Accessed: 24- Mar- 2018].
[8] H. Zell, “Layers of the Sun”, NASA, 2017. [Online]. Available: https://www.nasa.gov/mission_pages/iris/multimedia/layerzoo.html. [Accessed: 24- Mar- 2018].
[9] D. Hathaway, “NASA/Marshall Solar Physics: Photospheric Features”, Solarscience.msfc.nasa.gov, 2018. [Online]. Available: https://solarscience.msfc.nasa.gov/surface.shtml. [Accessed: 24- Mar- 2018].
[10] H. Zell, “Strong Evidence For Coronal Heating Theory Presented at 2015 TESS Meeting”, NASA, 2015. [Online]. Available: https://www.nasa.gov/feature/goddard/sounding-rockets/strong-evidence-for-coronal-heating-theory-presented-at-2015-tess-meeting. [Accessed: 24- Mar- 2018].
[11] ”Light shone on star mystery: Why sun’s corona is much hotter than its surface”, ScienceDaily, 2013. [Online]. Available: https://www.sciencedaily.com/releases/2013/02/130204094608.htm. [Accessed: 24- Mar- 2018].
[12] R. Garner, “Understanding the Magnetic Sun”, NASA, 2016. [Online]. Available: https://www.nasa.gov/feature/goddard/2016/understanding-the-magnetic-sun. [Accessed: 24- Mar- 2018].
[13] ”Magnetic Field Lines Tangle as Sun Rotates | UCAR Center for Science Education”, Scied.ucar.edu. [Online]. Available: https://scied.ucar.edu/magnetic-field-lines-tangle-sun-rotates. [Accessed: 24- Mar- 2018].
[14] J. Bergman, “Sunspots – Windows to the Universe”, Windows2universe.org, 2016. [Online]. Available: https://www.windows2universe.org/sun/atmosphere/sunspots.html. [Accessed: 24- Mar- 2018].
[15] ”Sunspots and the Solar Max : Feature Articles”, Earthobservatory.nasa.gov. [Online]. Available: https://www.earthobservatory.nasa.gov/Features/SolarMax/solarmax_2.php. [Accessed: 24- Mar- 2018].
[16] ”Archive of Astronomy Questions and Answers”, Image.gsfc.nasa.gov. [Online]. Available: https://image.gsfc.nasa.gov/poetry/venus/q142.html. [Accessed: 24- Mar- 2018].
[17] ”Solar flares – Earth Facts and Information”, Basicplanet.com. [Online]. Available: http://www.basicplanet.com/solar-flares/. [Accessed: 24- Mar- 2018].
[18] G. Holman, “Overview of Solar Flares”, Hesperia.gsfc.nasa.gov, 2018. [Online]. Available: https://hesperia.gsfc.nasa.gov/rhessi3/mission/science/overview-of-solar-flares/index.html. [Accessed: 24- Mar- 2018].
[19] B. Joshi, A. Veronig, J. Lee, S. Bong, S. Tiwari and K. Cho, “PRE-FLARE ACTIVITY AND MAGNETIC RECONNECTION DURING THE EVOLUTIONARY STAGES OF ENERGY RELEASE IN A SOLAR ERUPTIVE FLARE”, 2011.
[20] ”The Science of Magnetic Reconnection”, NASA, 2014. [Online]. Available: https://www.nasa.gov/content/goddard/science-of-magnetic-reconnection. [Accessed: 24- Mar- 2018].
[21] P. Sweet, “Mechanism of Solar Flare”, Annual Review of Astronomy and Astrophysics, vol. 7, 1969.
[22] R. Ramaty and N. Mandzhavidze, “Solar Flares: Gamma Rays”, Cds.cern.ch, 1998. [Online]. Available: http://cds.cern.ch/record/367281/files/9810089.pdf. [Accessed: 24- Mar- 2018].
[23] ”User guide from SIDC – Royal Observatory of Belgium”, Sidc.oma.be. [Online]. Available: http://sidc.oma.be/educational/classification.php. [Accessed: 24- Mar- 2018].
[24] ”What are solar flares? | Help”, SpaceWeatherLive.com. [Online]. Available: https://www.spaceweatherlive.com/en/help/what-are-solar-flares. [Accessed: 24- Mar- 2018].
[25] K. Fox, “Solar Flares: What Does It Take to Be X-Class?”, NASA, 2011. [Online]. Available: https://www.nasa.gov/mission_pages/sunearth/news/X-class-flares.html. [Accessed: 24- Mar- 2018].
[26] “Spacelab at Work”, NASA History, 2009. [Online]. Available: https://history.nasa.gov/EP-165/ch4.htm#n44 [Accessed: 29- Mar- 2018].
[27] “Aurora: Fabled Glowing Lights of the Sun-Earth Connection” NASA Flight Centre, 2002. [Online]. Available: https://pwg.gsfc.nasa.gov/polar/EPO/auroral_poster/aurora_all.pdf [Accessed: 23- Mar- 2018]
[28] “About Space Weather: Impacts” Space Weather Prediction Center, 2003 [Online] Available: https://www.swpc.noaa.gov/impacts/ [Accessed: 25- Mar- 2018]
[29] “SOHO Instruments” SOHO: Solar and Heliospheric Observatory, 2018 [Online] Available: https://sohowww.nascom.nasa.gov/about/instruments.html [Accessed: 28- Mar- 2018]
[30] “Ozone and Radiation Observation” Aerological Observatory of Japan, 2005 [Online] Available: http://www.jma-net.go.jp/kousou/obs_third_div/index-e.html [Accessed: 28- Mar- 2018]
[31] G.M. Raisbeck and F. Yiou, “10Be in polar ice cores as a record of solar activity”, The ancient sun: Fossil record in the earth, moon and meteorites, pp 185-190, 1980
[32] F. Dyson, “Search for Artificial Stellar Sources of Infrared Radiation”, Science, vol. 131, no. 3414, pp. 1667-1668, 1960.
[33] ”Solar flares: everything you need to know”, Telegraph.co.uk, 2012. [Online]. Available: https://www.telegraph.co.uk/news/science/space/9097587/Solar-flares-everything-you-need-to-know.html. [Accessed: 24- Mar- 2018].
[34] N. Redd, “Space Weather: Sunspots, Solar Flares & Coronal Mass Ejections”, Space.com, 2017. [Online]. Available: https://www.space.com/11506-space-weather-sunspots-solar-flares-coronal-mass-ejections.html. [Accessed: 24- Mar- 2018].
[35] ”Solar Storm and Space Weather – Frequently Asked Questions”, NASA. [Online]. Available: https://www.nasa.gov/mission_pages/sunearth/spaceweather/index.html#q5. [Accessed: 24- Mar- 2018].
[36] S. Paul, “Tesla cranks up big battery in Australia”, Reuters, 2018. [Online]. Available: https://www.reuters.com/article/us-australia-power-tesla/tesla-cranks-up-big-battery-in-australia-idUSKBN1DN0B4?il=0. [Accessed: 24- Mar- 2018].
[37] N. Harsmen, “What is Tesla’s SA battery and how will it be used?”, ABC News, 2017. [Online]. Available: http://www.abc.net.au/news/2017-07-07/what-is-tesla-big-sa-battery-and-how-will-it-work/8688992. [Accessed: 24- Mar- 2018].
[38] E. Stassinopoulos, G. Brucker, D. Nakamura, C. Stauffer, G. Gee and J. Barth, “Solar flare proton evaluation at geostationary orbits for engineering applications”, IEEE Transactions on Nuclear Science, vol. 43, no. 2, pp. 369-382, 1996.
[39] “Solar Shield–Protecting the North American Power Grid” NASA Science, 2010. [Online]. https://science.nasa.gov/science-news/science-at-nasa/2010/26oct_solarshield [Accessed: 29- Mar- 2018].
Cite This Work
To export a reference to this article please select a referencing stye below:
Related Services
View all


Related Content
All TagsContent relating to: "Engineering"
Engineering is the application of scientific principles and mathematics to designing and building of structures, such as bridges or buildings, roads, machines etc. and includes a range of specialised fields.
Related Articles

DMCA / Removal Request
If you are the original writer of this dissertation and no longer wish to have your work published on the UKDiss.com website then please: