Solar Penetration in the Saudi Power System
Info: 9032 words (36 pages) Dissertation
Published: 11th Dec 2019
Tagged: Energy
4.1 Introduction
Saudi Arabia is conveniently bounded by the latitudes 310Nand 17.50Nand longitudes 500Eand 36.60E. This strategic location lies in the center of the sunbelt zone that receives a huge amount of sun shine. Thus, Saudi Arabia experiences high average annual solar radiation of approximately 2200 kWh/m2 and larger sunlight duration with an average of 8.89 hours, especially in the summer [44, 45]. This ideal geographical area makes Saudi Arabia to be one of the countries that have high natural potential for taking advantage of solar energy. In addition to the vast fl desert land clear skies around the year, this location enables Saudi Arabia to be the world leader in producing and exporting solar energy [46, 47]. The total amount of solar energy received in the country is ten times the Saudi electrical requirements and it is sufficient to electrify Saudi Arabia for 72 years [48, 49]. The average daily solar radiation in Saudi Arabia is about 250 W/m2, comparing to the solar radiation in Europe and other North America countries that only receive between 100-200 W/m2 daily. Moreover, Saudi Arabia is part of the rainless region in the Middle East that has a very high rate of sunny days over the course of the year for most parts of the country [50].
Saudi Arabia is the worlds leading oil producer as it produces more than 13% of the world oil, more than any other country in the organization of the petroleum exporting countries (OPEC) [50] ; however, the oil production has already started to decrease in the last years due to diff t factors. This decline mode in oil production, coupled with the extraordinary increase in electrical demand and the high potential of solar energy, qualifies Saudi Arabia to become the main candidate to utilize solar energy in its energy resources [50]. Since the power generation in Saudi Arabia heavily relies on fossil fuel based power plants to supply the increasing demand, more than half of the produced oil and natural gas are used as fuels for these conventional generation units [45]. Even though Saudi Arabia consumes that much of oil, fuel cost is not an issue for the Saudi government. However, it is interested in taking the lead in harvesting solar energy and using the oil revenue to create a convenient infrastructure for penetration of solar panels. If Saudi Arabia utilizes the significant potential of the solar energy efficiently, the power can be exported to some European countries that receive less power from sunlight with affordable cost [50].
Based on the aforementioned facts, the Saudi government established King Abdullah City for Atomic and Renewable Energy (K.A.CARE) in 2010 with a main goal to create a sustainable energy for the Saudi future by developing a reliable alternative energy resources supported by modern local industries. K.A.CARE plans to resolve load growth and the environment challenges by supporting the existing traditional power plants with a mixture
of sustainable resources that can generate clean power without pollution. The plan targets to have 41 GW of solar capacity, 16 GW photovoltaic (PV) and 25 GW consecrated solar power (CSP), to be installed by 2030 [4]. Later on, this plan was postponed to 2040 and the Saudi Vision 2030 has changed the plan as it targets generating 9.5 GW of renewable energy by 2030 [51, 52]. Even though this plan mysteriously does not provide details, most of this energy would be met through solar technology.
4.2 Advantages of Solar Penetration in the Saudi Grid
It is well known that generating electricity from the traditional power plants is the main reason for polluting the environment with the emission of gases like Carbon Oxides (CO
& CO2), Nitrogen Oxides (NO, NO2 & N2O), and Sulfur Oxides (SO2 & SO3) [53]. As a matter of fact, all power plants in SEC are fossil fuel based power plants because the price of the fuel is very low in Saudi Arabia and SEC takes the low cost as an incentives to not
consider renewable energy sources [48]. This results in enormous increasing in greenhouses gases emissions, which leads Saudi Arabia to be ranked as the 14thamong the countries that have high CO2 emissions from fuel combustion, according to International Energy Agency (IEA) [54]. CO2 emission levels reached more than 200 million metric ton in 2010 and it is expected to increase to approximately 1380 million metric ton in 2030, considering the
electricity generation will still be from conventional power units [48]. This increase in green houses gases has detrimental impact on human health as well as the global warming. To overcome all of these issues, a switch to renewable solar energy sources is vital for countries that have great potential of solar energy. Using solar plants as an alternative to generate
electricity has several benefits for Saudi Arabia as it reduces the air emission, minimizes the atmospheric pollution and save the environment and human health. Saudi government plan to install 41 GW of solar energy will save more than 1000 million barrels of oil and reduce 410 million ton of CO2 per year [50]. Hence, using solar energy in Saudi Arabia will assure
both economic and environmental friendly electricity generation [45].
In General, comparing to the conventional power plants, the solar energy has tremendous features: it has no fuel cost, requires fairly less maintenance, and does not have noise pollution [48, 55]. Therefore, solar generation has been increasing worldwide in the last decade and the fast development in solar industry, the low operational cost, and the increased efficiency have made the solar power is the most promising renewable energy to replace the traditional power plants. It becomes easy to deploy and integrate solar plants [56]. Thanks to the abundant potential of sunshine, Saudi Arabia will exploit the solar energy that can help with shaving the peak demand from the national grid, especially, the peak-load demand that is associated with the extensive use of air conditioner (AC) units that coincides with the maximum solar radiation in the summer season [57]. Moreover, the price of oil is increasing which results in increasing the cost of electricity production from oil based power units. Therefore, Saudi Arabia has significant economic incentives as its consumption of petroleum and natural gas will be much reduced when replacing some of the existing conventional power plants with photovoltaic and consecrated solar power [46, 58]. Consequently, extra oil and natural gas could be exported and more revenue would be gained. Additionally, using solar power in the sparsely populated remote rural areas in the far north and south regions of Saudi Arabia is important to avoid any extra cost of constructing new transmission lines
and reduce the transmission losses amount [45, 48]. Furthermore, country’s expansion into solar energy would create more jobs for Saudi citizens.
On the other hand, Saudi Arabia usually goes through harsh and extreme environmental conditions that might impact the performance of the PV system as dust may accumulate on the PV panels which would reduce the efficiency by 10-20% [47, 48]. Moreover, as previously stated, Saudi Arabia receives less rain throughout the year which makes it diffi to naturally clean the accumulated dust [59]. Also, the extreme high temperature, that reaches 500Cduring summer months, could result in lowering PV performance as voltage drops due to conversion efficiency [48, 60].
4.3 History of Solar Energy in Saudi Arabia
In 1960s, Saudi Arabia has started the fi solar project when a small photovoltaic beacon was installed at Madinah airport [46]. Since 1970s, the Energy Research Institute (ERI) at King Abdul Aziz City for Science and Technology (KACST) has started several solar research activities [58]. In 1977, Saudi Arabia cooperated with the United States to launch a joint solar energy program known as Solar Energy Research American Saudi (SOLERAS). Both the US Department of Energy and the Saudi Arabia invested USD 50 million to this program [46]. One of the outcomes of this joint program was the Solar Village to supply energy to remote regions from solar power in 1980 .The 350 kW photovoltaic Solar Village electrified two rural areas in the northwest of Riyadh that were not connected to the power grid: Al-Jubaila and Al-Uyaina, serving more than 3000 citizens [46, 50]. This project was the largest solar project in its type during that time and the fi solar independent project
in the Middle East [45, 46]. It costed about USD 18 million to generate 1 to 1.5 MWh per day of energy [53]. The SOLERAS program ended in 1997 after addressing the economic and technological diffi of solar energy in the region [46]. Another international joint program was established with the Federal Republic of Germany in 1986 and ended in 1991. This program, which was called HYSOLAR, investigated and developed hydrogen production and utilization technologies [46].
Later on, another joint project between the ERI and the National Research Energy Laboratory (NREL) in the U.S was established in 1994 and it is called Saudi Atlas Project [61]. It focused mainly on the determination of convenient locations to measure the solar radiation in Saudi Arabia. The project selected twelve locations throughout the country for the measurement stations that can measure the solar horizontal, direct beam, and diff radiation. The measurements are then sent to a central unit which calibrated the radiation data to get accurate and reliable data [46].
In May 2010, at the King Abdullah University of Science and Technology (KAUST) in Thuwal in the western region of Saudi Arabia, 2 MW PV rooftop mounted array system was installed. The total number of installed panels is 9,300 that are distributed on the school roof with an area of 11,600 m2. It is estimated that this project can supply around 3,281 MWh and save 1700 ton of CO2 emission per year. The cost of this rooftop project was more
than USD 17 million [46, 53]. The fi stand-alone solar power plant was built to electrify
Farasan Island the Red Sea in southwest of Saudi Arabia. This power plant, which started operation in June 2011, has a capacity of 500 kWp and it covers an area of 7,700 square meters. The solar power plant cuts off shipping about 28,000 barrels of diesel to the island
to generate electricity using diesel power plant [45, 53]. It provides the clean energy (864 MWh/year) to about 200 houses [52].
A 25 MW thermal power plant has been installed at Princess Noura University for Women (PNUW) in Riyadh in April 2012. The plant utilizes about 36,160 m2 of large fl plate solar collectors to heat the water for the university students. Throughout the expected life span of this plant, it is estimated that 52 million liters of fossil fuel and 125000 metric ton of CO2 emission would be reduced [45]. Furthermore, a large solar parking project with a capacity of
10.5 MW has been constructed by Saudi Aramco to cover 4,500 parking space with an area of 200,000 m2 of the North park of its headquarter in Dhahran in the eastern region of Saudi Arabia in 2012 [53]. About 120 thousand Copper Indium Selenide photovoltaic panels are used to provide shades and generate clean energy [45]. Another 200 kW rooftop PV project has been launched at King Abdullah Financial District (KAFD) in Riyadh in 2012. It can provide 330 MWh/year of energy using about 800 PV modules that cover an area of 1300 m2 [45, 52]. In 2013, a 3.5 MW solar park was built in King Abdullah Petroleum Studies and Research Center (KAPSARC) in Riyadh and a 5.4 MW solar farm was commissioned at King Abdulaziz International Airport in Jaddah [52]. There are several solar projects that are planned to be built in diff t cities in Saudi Arabia for diff t purposes: 10 MW at Khafji, 50 MW at Alaflaj, 50 MW at Jouf, 50 MW at Rafha, 550 MW at Duba, and 100 MW at Makkah [45, 52, 62].
Although Saudi government has started pioneering initiatives in solar energy, the country still does not have a considerable progress in solar power industry. This can be attributed to the lack of governments solar incentive programs and abundance of oil reserve and its relatively low cost. Yet, the total installed capacity of the solar energy in Saudi Arabia is
only 22 MW [58]. This number is relatively small comparing to the amount of sunshine received in the region. The installed solar capacity in Germany is 40 GW while receiving only half of the solar radiation in Saudi Arabia [62].
4.4 Solar Irradiance in Saudi Arabia
According to [44, 46, 53], the daily global solar radiation in Saudi Arabia ranges from 4493 W/m2 at Tabuk in the northern region to 7014 W/m2 in Bishah in the southern area with an average value of 5644 W/m2. Since 1970, there are 40 measurement stations throughout the country to collect data about the global solar radiation and bright sunshine duration. Hepbasli and Alsuhaibani in [46] used that data and observed that the solar radiation is higher in most of the southern cities while the northern cities received relatively low radiation. They found that the sunlight duration range from 7.4 to 9.4 hours. They also concluded that Bishah has the best location to install solar power plant. In the middle of the summer season, the daily solar radiation reaches 7.09 kWh/m2 whereas it could reach only 3.82 kWh/m2 in the winter [47]. According to [63], the best ten cites for solar irradiance in Saudi Arabia is shown in Figure 4.1. As can be seen in the fi these locations are distributed among three operating areas: Western, Central, and Southern. The solar energy productivity is observed to be higher in in both the northern and the southern regions of Saudi Arabia due to low average temperature in the north and high average solar radiation in the south [64]. Furthermore, the east and the west coasts as well as the central parts of Saudi Arabia receive higher intensities of irradiance in summer months [60]. In July 2014, the renewable resources atlas found that the direct norm irradiance (DNI) had the highest average of 9 kWh/m2 in
Tabuk city [58]. The DNI values range from 7.0 to 4.0 kWh/m2 in January and from 9.5 to
4.0 kWh/m2 July in the west and east costs, respectively [65].
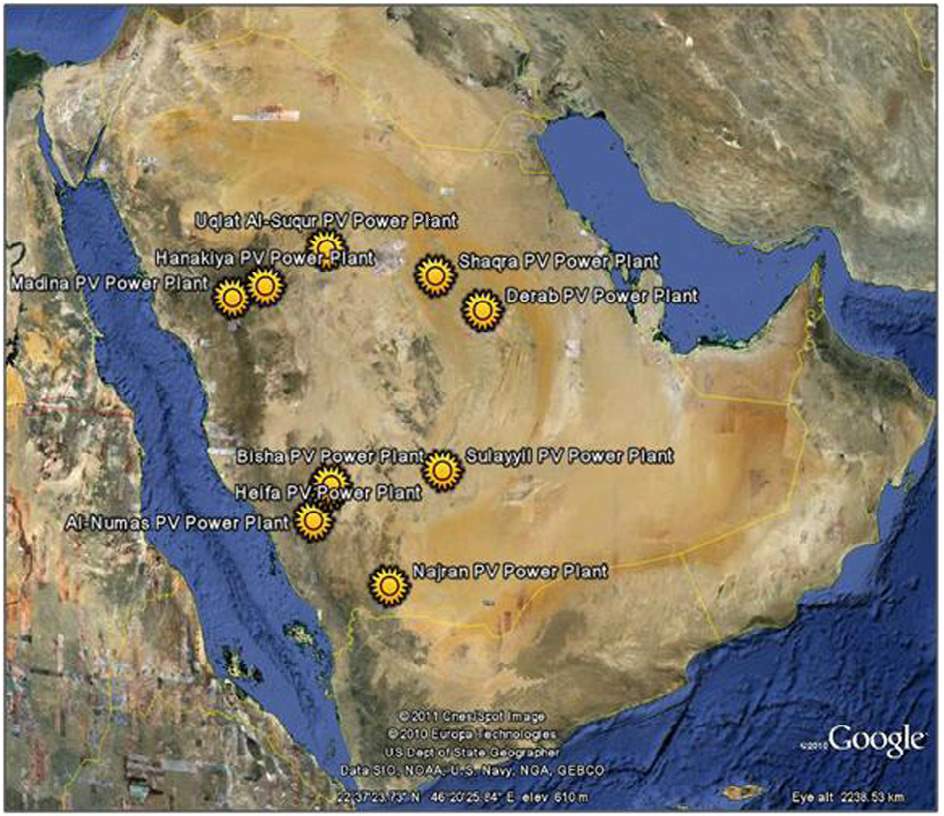
Figure4.1:Best ten cites for solar irradiance in Saudi Arabia [53].
4.4.1 Solar irradiance in Saudi Arabia from December 2014 to November 2016
It is believed that the solar irradiance information in Saudi Arabia was limited in the past. However, the available data from a historic measurement network clearly indicates that generating electricity from solar energy is a promising technique in the country. To
confirm that and gather more accurate data about the solar irradiance and the environmental conditions, K.A.CARE has established a unique solar measurement network known as the Renewable Resource Atlas as part of the Renewable Resource Monitoring and Mapping program (RRMM) that is deployed in most areas of the country in January 2013. Up until April 2017, the network has 46 meteorological stations distributed throughout the country. These stations record the required solar and wind resource measurements: Global Horizontal Irradiance (GHI), Diuse Horizontal Irradiance (DHI), Direct Normal Irradiance (DNI), wind directions and wind speed at diff t elevation levels as well as the associated atmospheric data. These measurements are then sent to the central data management system and they are available to the public and can be accessed via the online interactive portal, Saudi Arabia Renewable Resource Atlas [66]. As shown in Figure 4.2, the Renewable Resource Atlas utilizes three types of the instrument configurations (Tiers): Tier 1 Research station installed at 28 stations (star symbol), Tier 2 Mid-Range station installed at 18 stations (square symbol), and Tier 3 Simple station (circle symbol). Tier 1 has three configurations; A, B, and C based on the available instrument. Further details about the diff between these types and the selection criteria of each type are summarized in [67]. The elevation of each stations and the associated instrument configuration are shown in Table A1 in Appendix A.
The data used here are DNI, DHI, GHI and the ambient temperature collected from 40 locations with serially completed data for a period of 24 months from December 2014 to November 2016. The remaining six stations have more than four missing data, so they have been neglected. The average monthly total radiation is calculated for DNI, DHI, GHI, and the temperature to analyze the overall solar resource at each location and within each
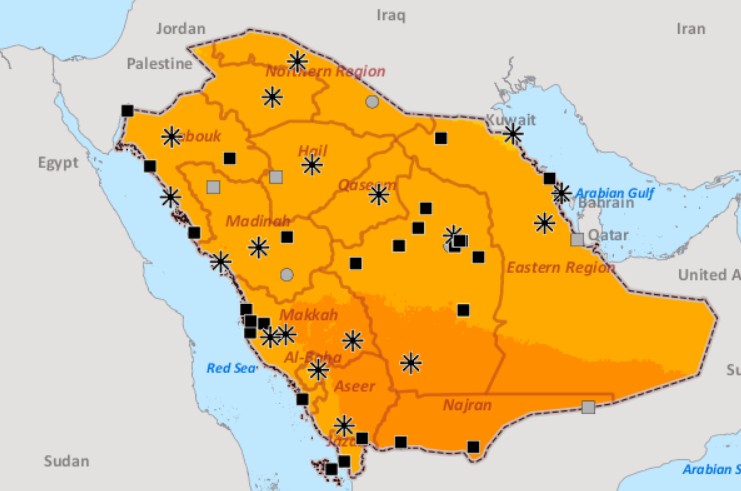
Figure4.2:Map of solar monitoring network in Saudi Arabia [66].
region and are summarized in Table A2 in Appendix A. The selected 40 stations are carefully divided into groups based on their geographical locations to identify the radiation patterns among the operating regions specified by SEC. the number of stations at each region varies as the central region has 12 stations while eastern region has only 5 stations. The plot in Figure 4.3 shows the average monthly irradiance for some of the locations. For the selected 40 station, the average monthly GHI ranges from about 5537 Wh/m2 at Dhahran in the eastern area to 6696 Wh/m2 at Najran in the southern area of Saudi Arabia. It is also noticed that the DHI and DNI show a variation of 1179 Wh/m2 and 3201 Wh/m2, respectively.
It can be seen that the stations in the southern portion of Saudi Arabia have the highest average monthly GHI at Najran and Sharurah. In terms of average monthly DNI, all stations in the northern region have recorded the highest DNI across the country. This fact can be
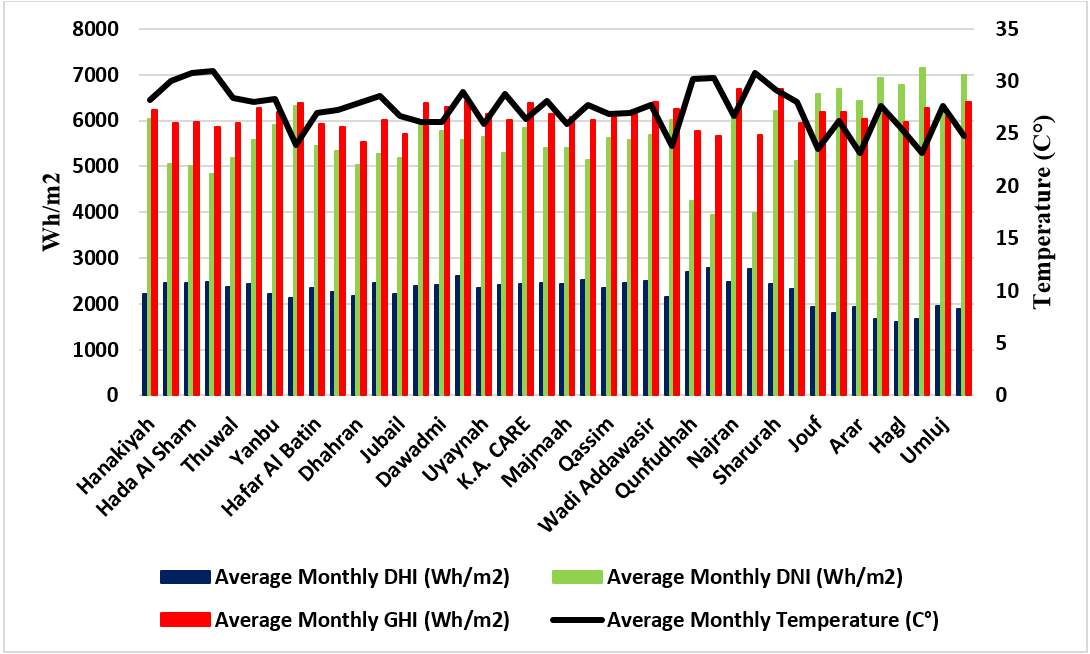
Figure4.3:Summary of average solar irradiance and temperature in all sites.
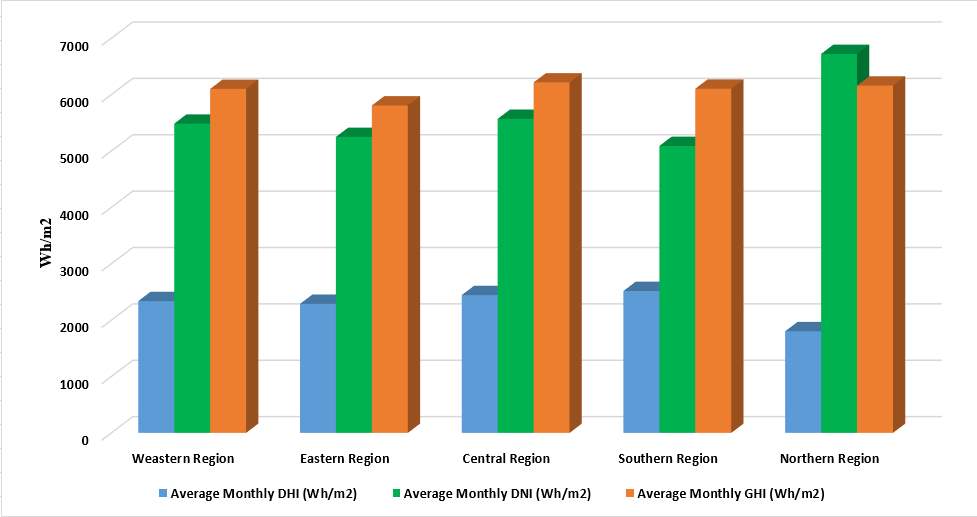
linked to the highest number of cloudless days that have been experienced in the northern area. On the other hand, the stations in north Saudi Arabia have the lowest values of DHI, which is the totally opposite of the pattern of the DNI due to the lower scattering of the radiations [67]. In fact the highest average value of DHI (2775.55 Wh/m2) is observed at Jazan (in the southern region) which has the lowest monthly average value of DNI (3934.4 Wh/m2). For each station, the maximum ambient temperature occurred in the summer at July and August as the highest temperature during this 24-months period was recorded at Hafar Albatin in the Eastern province. It was 39.90Con August 2016. Comparing the solar irradiance among the operating region, Figure 4.4 presents the overall magnitude of the solar resources at each region. It can be seen that the central region has the highest average monthly GHI (6216.3 Wh/m2) whereas the eastern region has the lowest GHI. This
can confirm the results found by [67] for the period of from October 2013 to September 2014. For the selected period in this study, the variation of the average monthly DHI, DNI and GHI are 0.714 kWh/m2, 1.63 kWh/m2, and 0.41 kWh/m2, respectively. This variation can be attributed to several factors: levels of sunshine, humidity, and pollution. However, the relatively small variability indicates that the solar irradiance is consistent throughout Saudi Arabia.
 Regarding the continuity of the solar radiation, all stations in the southern region never record a GHI value below 4000 Wh/m2 as shown in Figure 4.5. The maximum values of GHI in all stations occurred in the months of May and June of 2015 and 2106 while the peak average monthly DNI has been recording in July 2016 in the northern part and in October 2016 in the central and the southern areas.
Figure4.4:Average monthly solar irradiance for all regions.
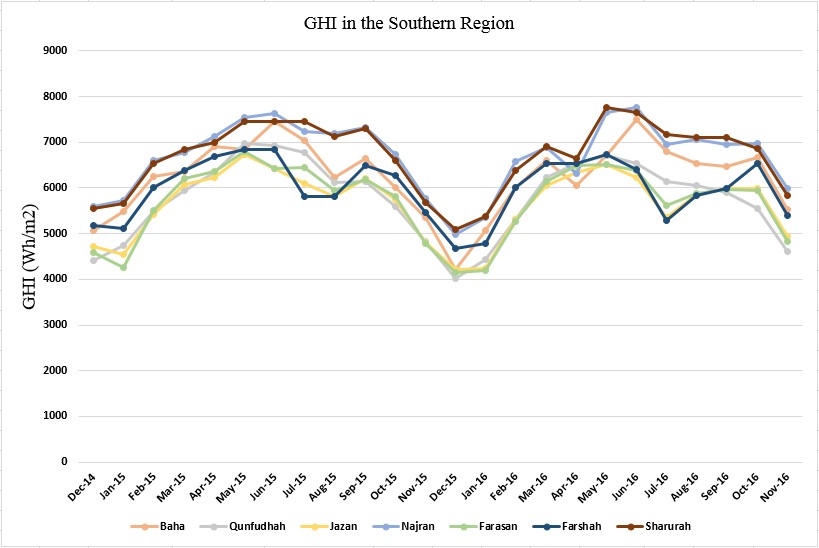
Figure4.5:Average global horizontal irradiance in the Southern Region.
The diff fraction is defi as an indication of the amount of clouds during a specific period of time [68] and it can be described by the ratio of direct horizontal irradiance to global horizontal irradiance. Figure 4.6 shows the monthly average diff se fraction for all fi e regions. The fi e regions are ranked based on the clearest sky as follow, northern, western, central, eastern and southern areas. In terms pf individual stations, the diff fraction varies from about 0.27 at Tabuk in the northern area to 0.49 at Jazan in the southern portion of the Saudi Arabia. In fact, about half of stations across the country have the diff factor between 0.35 and 0.40 as can be seen in Table A3 in Appendix A.
In Summary, the global horizontal irradiance is high at all areas across the country. This indicates that most of the locations in Saudi Arabia are convenient to install photovoltaic
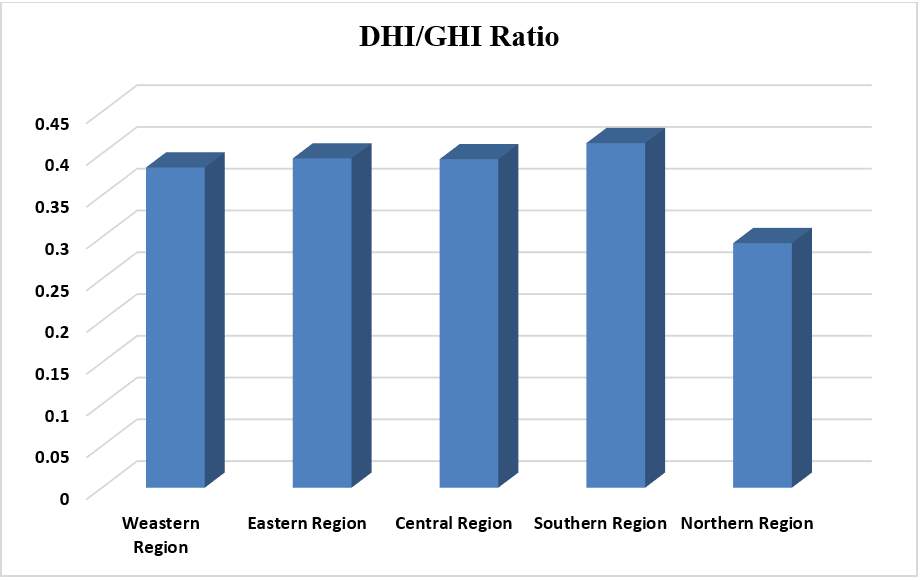
Figure4.6:Averages monthly DHI/GHI ratio by regions.
(PV) to harvest the energy from the sun. However, the relatively high ambient temperature which reaches more than 400Cin most cities in Saudi Arabia during summer season could deteriorate the efficiency of the PV. Both three measures used here; DHI, DNI, and GHI clearly reinforce the fact that the solar energy potential is strong in Saudi Arabia and is sufficient to generate clean electricity as their minimum values are far above the minimum accepted threshold for PV and Consecrated Solar Power.
4.5 Impact of the Solar Penetration on the Stability of the Saudi Grid
As far as the author knows, most of studies related to solar energy in Saudi Arabia investigated the availability solar irradiance and the best locations for installing PV plants based on available irradiation information. However, many of the stability and operation issues regarding solar PV grid integration have not yet been investigated and fully explored. The effect of the PV penetration on the power system stability and reliable operation of the Saudi grid deserves a comprehensive investigation as the expanding of using solar PV raises concerns about associated impact on the stability and operation of the grid. It is important to study the behavior of the grid during the PV integration to ensure that the grid reliability and security should not be jeopardized. Therefore, this chapter focuses on the impact of high PV penetration on the frequency response and voltage stability of the Saudi grid.
4.5.1 Solar PV Model
The general structure of a solar PV plant that is connected to a grid is shown in Figure
4.7 [69]. It composes of PV module, DC/DC power electronic converter, DC/AC power electronic inverter, power transformer to be connected to the grid, and control system. In some cases, a storage system is integrated into a grid connected PV plant. To represent the dynamic performance of the solar PV plant, the GE solar photovoltaic plant model is used. This model is designed to be used with PSSE and is accurate enough to capture the dynamics of the PV. The GE PV model is superior to the built-in PSSE PV model due to the limitation of the allowable number of PV units [15].
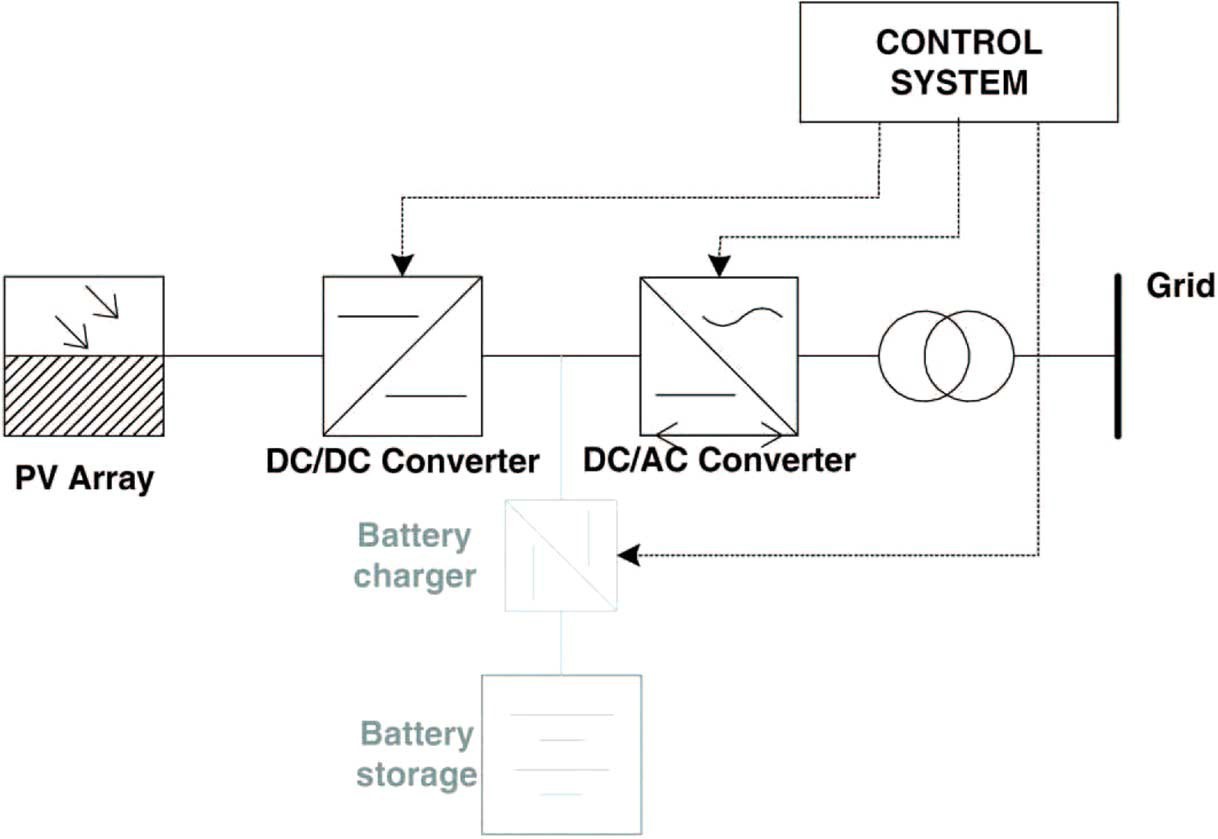
Figure4.7:General structure of a grid connected solar PV plant [69].
The GE PV model is prepared to show the dynamic behavior of the solar plant when any disturbance occurs in the grid; however, it is not built for short circuit or electromagnetic studies [70]. In fact, the fast dynamics associated with the inverter control response are modeled using algebraic equations [70]. In the real system, the inverters of several solar PV units are aggregated and injected to the power grid at a single point. In the GE model, these almost identical inverters are represented by one equivalent large inverter. However, it is diffi to analyze the disturbances that occur through the solar plant local grid. In addition, the presented GE model assumes that the supplied power from all inverters are the same, which means the solar irradiance are uniform throughout the PV plants [70]. For the load fl w model, the GE solar plant is represented by a conventional generator and a
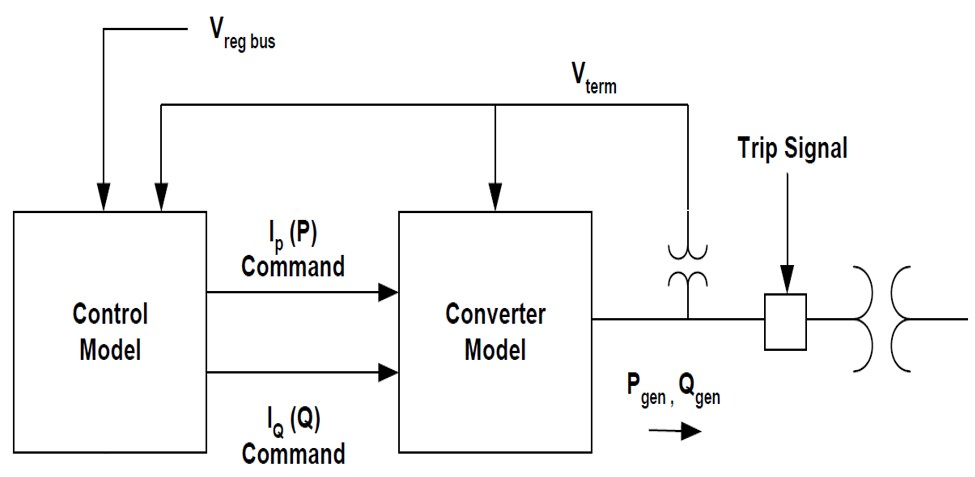
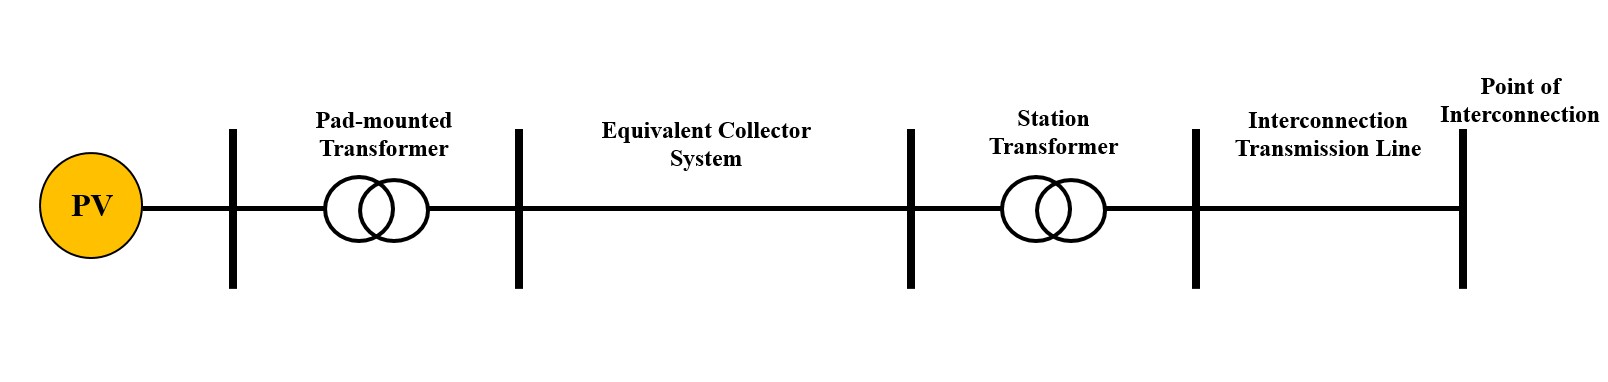 transformer connected to the grid as can be seen in Figure 4.8. It is important to ensure that the MVA rating of the generator must match the PV device ratings [70, 71]. Regarding the dynamic model, the GE PV model has two main components: the inverter model and the electrical control model as shown in Figure 4.9.
Figure4.8:Load fl w representation of large scale PV unit.
Based on the control commands being provided from the electrical control model (GEPVE), the inverter model (GEPVG) injects real and reactive current into the grid. Also, the inverter model, which fully represents the dynamic behavior of the large scale PV unit, has under and over voltage and frequency protective functions and it represents the interface between the power network and the solar plant [70, 71].
The control model initiates the active and reactive current commands based on the actual terminal voltage. It also controls the amount of active and reactive power transmitted to the grid according to the power fl w initial conditions and the reactive power control methods, including voltage regulation (VRS), fi Q, and fi power factor. It is equipped with converter current limiter that limits the total real and reactive currents to go beyond the converter capacity based on a user-specified fl (PQFLG) which can be either real power priority or reactive power priority. [15, 70]. The parameters of both GEPVG and GEPVE
 for one of the PV units used in this study are summarized in Table 4.1 and Table 4.2, respectively.
Figure4.9:GE solar PV model dynamic model overview [70].

 Table4.1:Dynamic model data for inverter model (GEPVG).
| Description | Value |
| PRATE, rated power, MVA | 600 |
| Xeq-equivalent reactance for current injection | 99999 |
| VHVRCR2- HVRCR voltage 2 | 1.2 |
| CURHVRCR2- Max. reactive current at VHVRCR2 | 2 |
| Rlp LVPL-Rate of active current change | 5 |
| T LVPL-Voltage sensor for LVPL | 0.02 |
| LVPL voltage 1 | 0 |
| LVPL power 1 | 0 |
| LVPL voltage 2 | 0.5 |
| LVPL power 2 | 0.167 |
| LVPL voltage 3 | 0.90 |
| LVPL power 3 | 0.98 |
| XLVPL | 0 |
Table4.2:Dynamic model data for control model (GEPVE).

Description Value

Tfv V-regulator fi 0.15
Kpv V-regulator proportional gain 18
Kiv V-regulator integrator gain 5
Rc line drop compensation resistance 0
Xc line drop compensation reactance 0
QMX V-regulator max limit 1
QMN V-regulator min limit -1
IPMAX Max active current limit 1.12
TRV V-sensor 0.02
KQi MVAR/Volt gain 0.1
VMINCL 0.88
VMAXCL 1.15
KVi Volt/MVAr gain 120
XlQmin min. limit for Eqcmd 0.55
XlQmax max. limit for Eqcmd 1.55
Tv Lag time constant in WindVar controller 0.05
Tp Pelec fi in fast PF controller 0.05
Fn – A portion of on-line PV converters 1
 ImaxTD – Converter current limit 1.12
Continuedonnextpage
Table 4.2 – Continuedfrompreviouspage
| Description | Value |
| Iphl – Hard active current limit | 1.12 |
| Iqhl – Hard reactive current limit | 1.12 |
| TIpqd – Reactive droop time constant | 5 |
| Kqd – Reactive droop gain | 0 |
| Xqd – Reactive droop Synthesizing Impedance | 0 |
| Vermx – Reactive power control maximum error signal | 0.01 |
| Vermn – Reactive power control minimum error signal | -0.01 |
| Vfrz – Reactive power control freeze voltage | 0.7 |
4.5.2 Solar PV Plant Location and Penetration Levels
The locations of the PV plants should be selected effectively such that each chosen location must receive adequate enough of the average solar radiation throughout the year and should be closed to the load centers. . It has been stated earlier in Section 4.4.1 that most areas in Saudi Arabia are exposed to higher levels of solar irradiance. This means that all of the fi e regions are suitable to install solar PV plants. Since the conventional generators in the Saudi model will be gradually replaced by PV plants as the solar penetration increases, a proposed selection criteria in [15] is applied in this study. Due to the fact that the solar plants are operated at higher power factors values, the conventional machines with higher power factor are chosen to be displaced fi
According to the Saudi Arabian Grid Code [42, 72], the maximum allowable frequency deviation is 0.2 Hz. As long as the frequency deviation are kept within these limits and become stable after tripping one of the largest generation machine, more PV plants can be added to the developed Saudi model. The PV plants are gradually added to the system with the following penetration levels: 10%, 30%, 50%, and 65%. Any addition of PV plants more than 65% results in losing stability of the system. The locations of the PV plants are shown in Figure 4.10, Figure 4.11, Figure 4.12, and Figure 4.13. The amount of generation from PV plants at each penetration levels are summarized in Table 4.3. Tables in Appendix B D list the generators that have to be displaced to accommodate for PV units within the studied area for all fi e penetration levels.
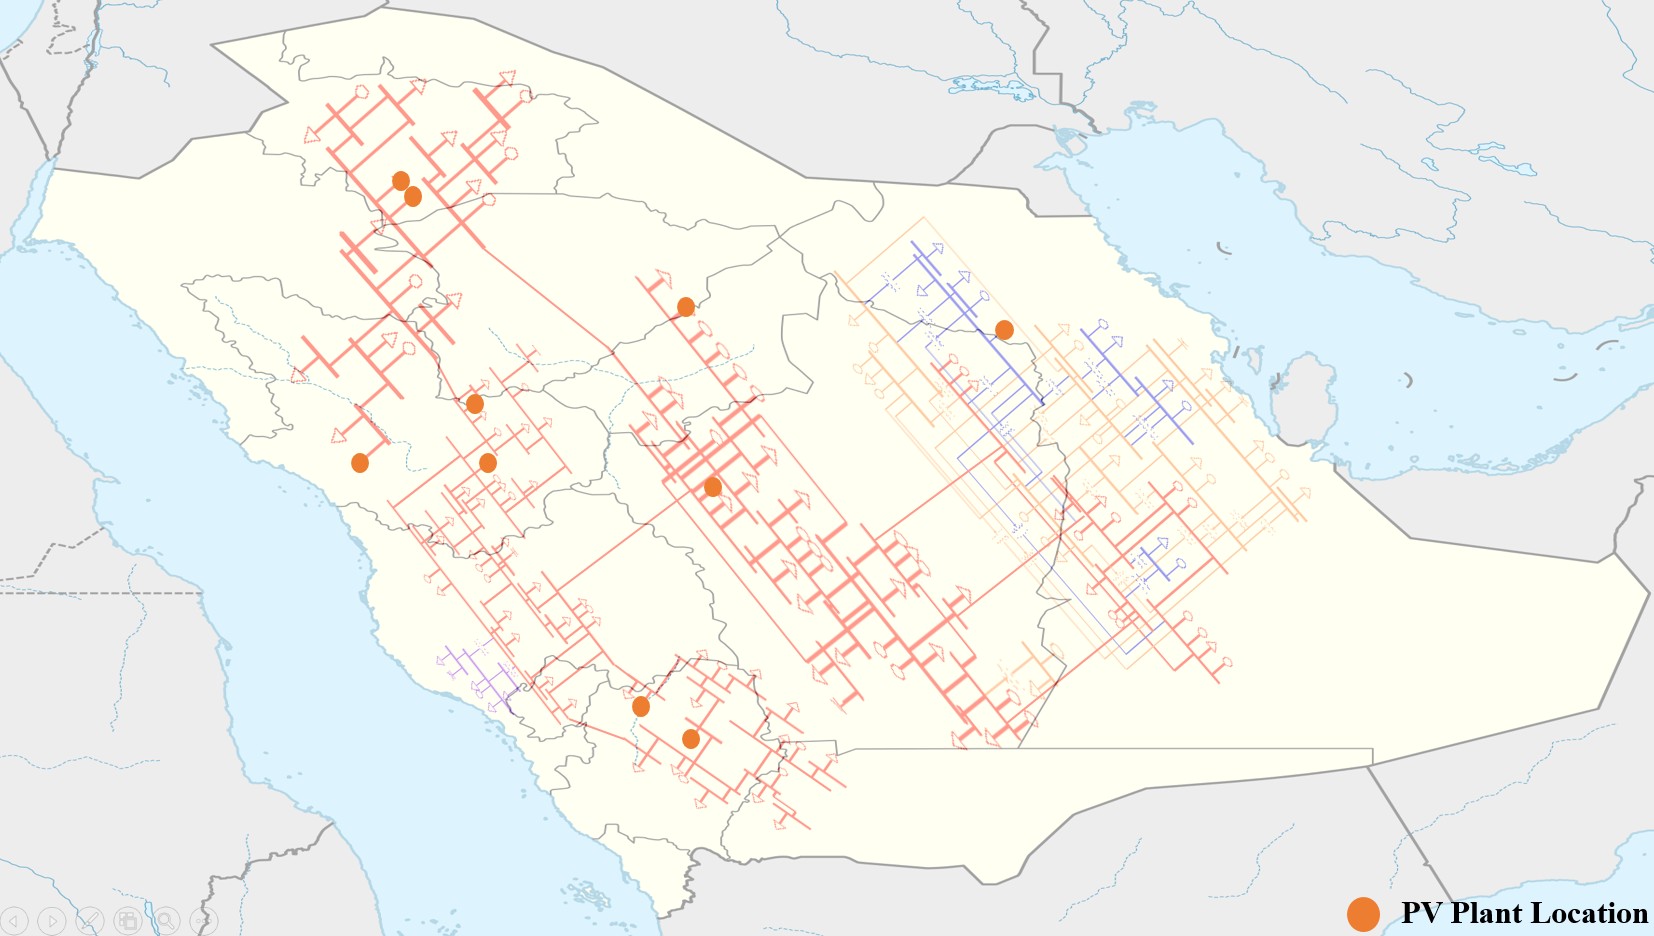
Figure4.10:10% PV Penetration Map.
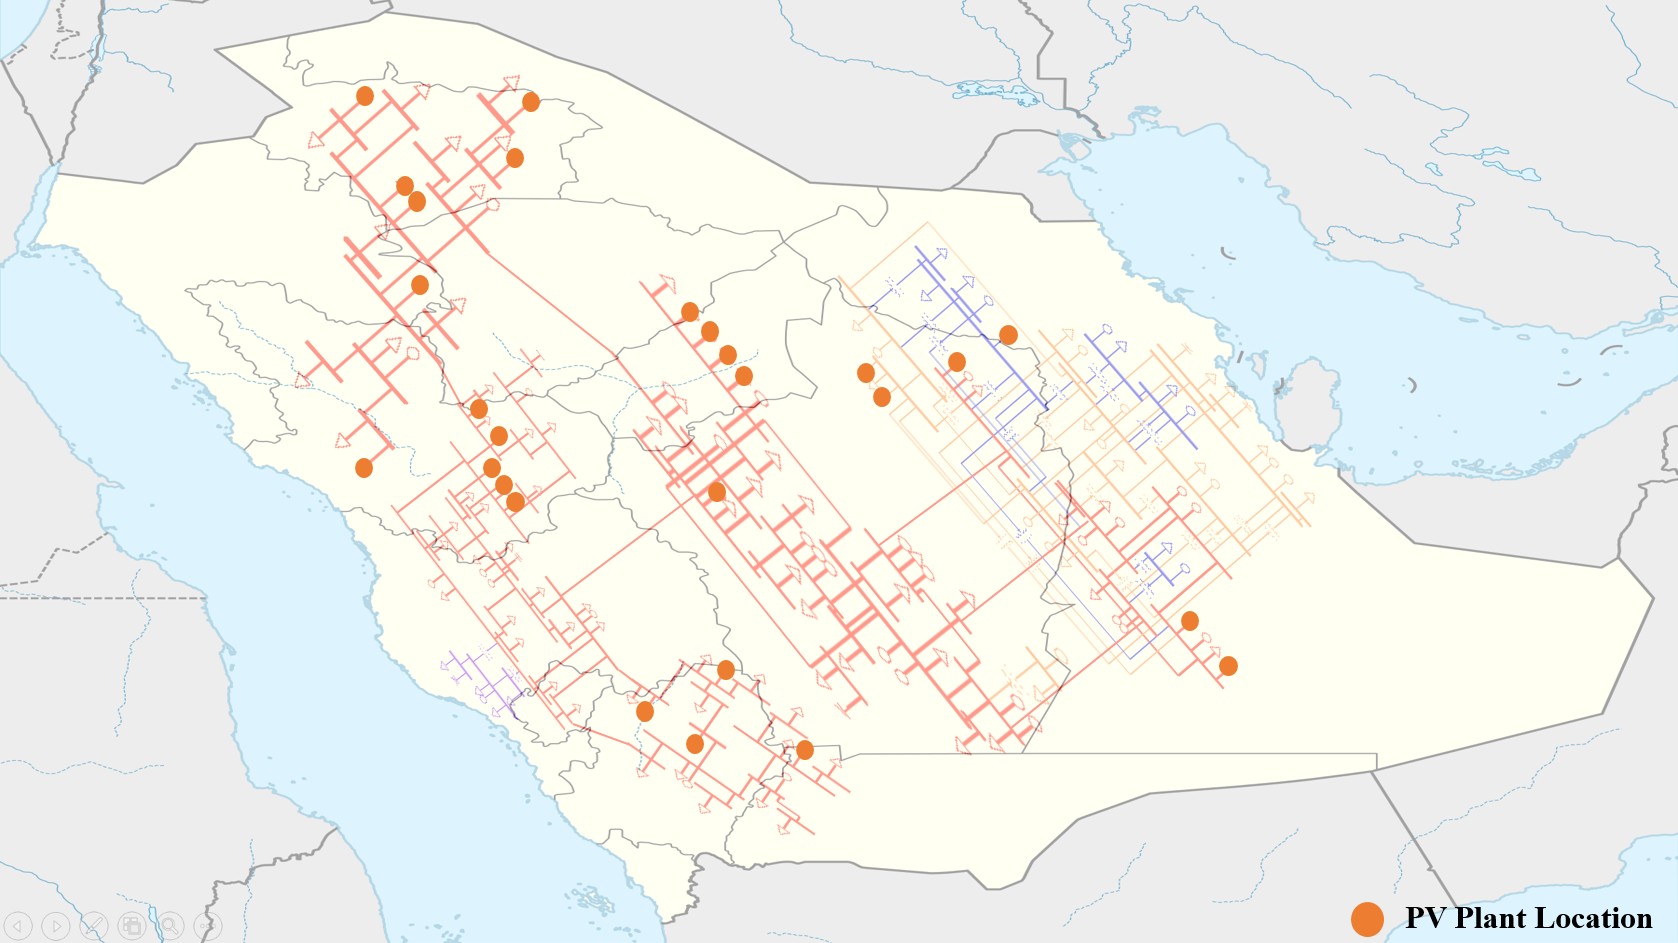
Figure4.11:30% PV Penetration Map.
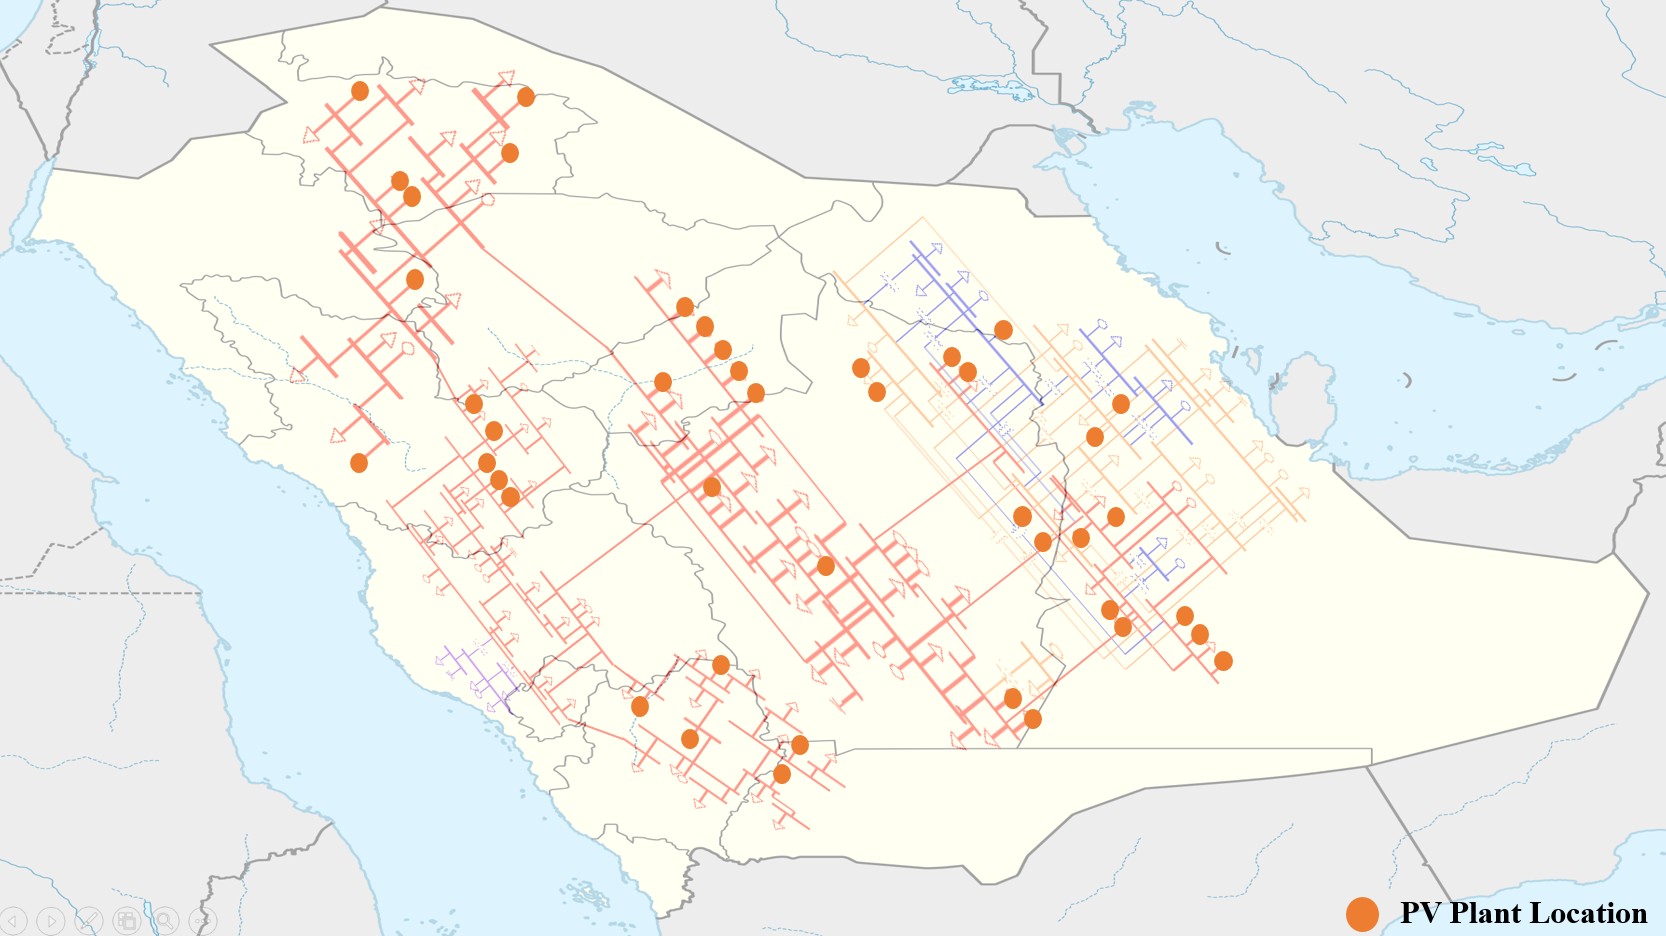
Figure4.12:50% PV Penetration Map.
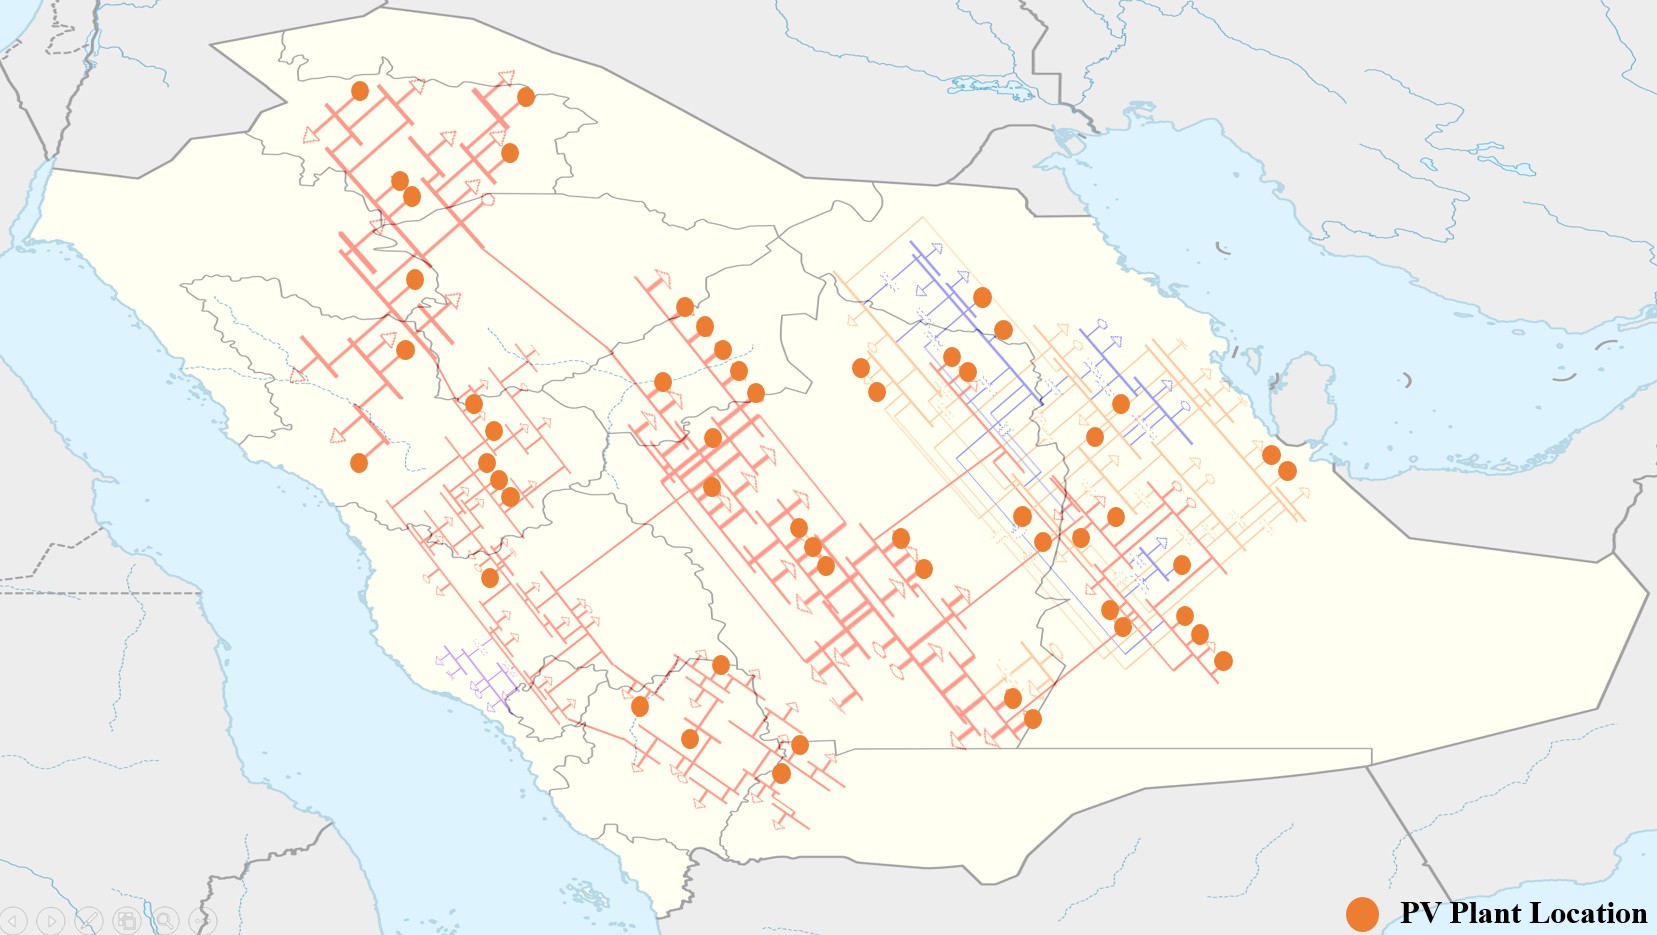
Figure4.13:65% PV Penetration Map.
Table4.3:The generation of each of the solar PV penetration level.
| SolarPVpenetrationlevel | Activepower(MW) |
| 10%PVpenetration | 3,081.40 |
| 30%PVpenetration | 18,270.58 |
| 50%PVpenetration | 30,463.25 |
| 65%PVpenetration | 39,654.68 |
4.5.3 Impact of PV penetration in the Saudi Grid on the Fre- quency Response
It is well known that displacing conventional coal-fired machines with renewable units can result in reducing the overall system inertia which can lead to several system problems during disturbances. Therefore, when an event happens in the grid that is having much renewable units, the system frequency may deviate too much and result in losing stability of the system. It is found that the settling frequency is associated with the governor ratio in the system as the higher governor ratio reduces the frequency deviation [15]. In this section, a dynamic simulation is performed to observe how the system frequency is responding after disturbances as the PV penetration levels increases.
High PV Penetration Impact on Frequency Response Characteristics
In order to observe the impact of high PV penetration on the frequency response characteristic (β), a conventional machine is tripped at each operating area with different PV penetration levels. Then, the average Beta value for all cases for each penetration level
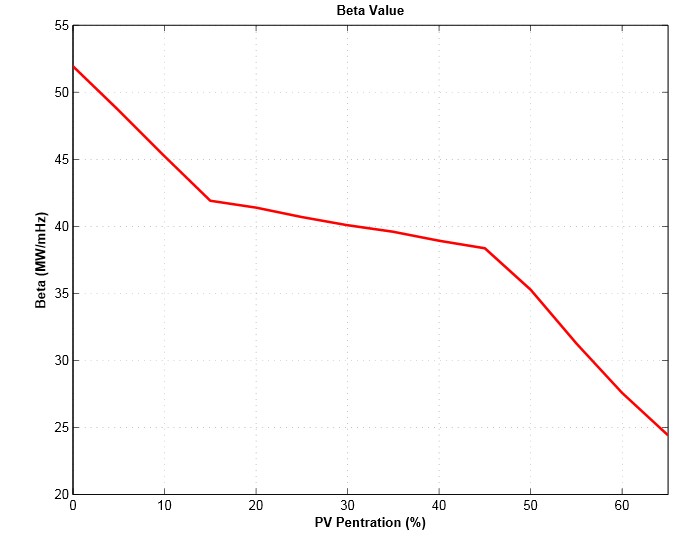 is calculated. It has been noticed that the Saudi grid Beta value declines as the penetration level increases as shown in Figure 4.14. This can be attributed to the fact that the overall system inertia is reduced as the system includes more renewable resources.
Figure4.14:Saudi grid Beta value with diff t PV penetration levels.
Frequency Response after Tripping Large PV Plant
The amount of power that comes from photovoltaic systems heavily depends on weather conditions; thus, cloudy or rainy weather may result in fl the delivered power from PV or even leading to loss of a considerable portion of PV plants. Moreover, the PV plants
could trip due to different types of disturbances or protection errors. Therefore, a worst case scenario of losing a PV plant is simulated in this section to study the behavior of the grid. The PV penetration under 10%, 30%, 50% and 65% is simulated respectively.
The PV plant at bus 310 in the central region is tripped out at t=5 s. the PV plant generates about 860 MW at the time of disconnection. Figure 4.15 and Figure 4.16 show the frequency response and the voltage profi response at bus 218 when the solar plant is dropped at several PV penetration levels. It can be observed that the increase of PV penetration levels has a clear impact on the bus frequency as well as the bus voltage. Tripping the PV plant generates momentary oscillations in the system frequency and its value is affected by the penetration level as more PV penetration results in higher is oscillation magnitude. The magnitude of the frequency decreases to almost 59.994 Hz for 65% of PV penetration level, which indicates the significant risk of PV penetration on the stability of the grid. Regarding voltage profi at 65% PV penetration, tripping PV plant results in higher momentary oscillations in voltage waveform with magnitude between 1.003 and 0.9985 pu.
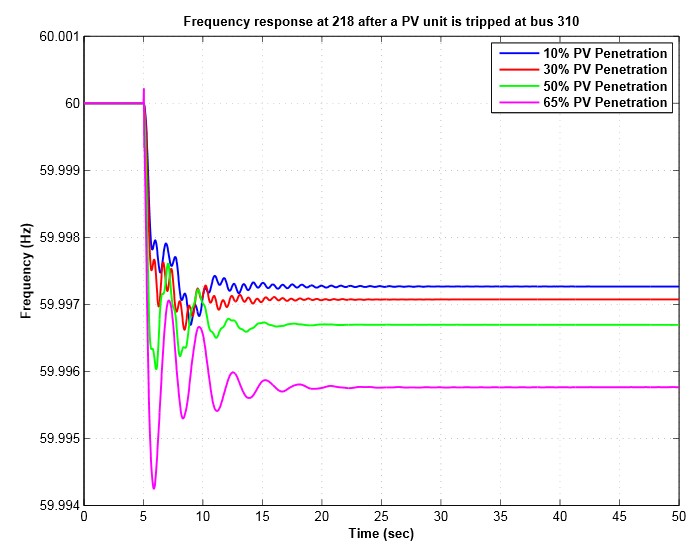
Figure4.15:Frequency response after tripping a large PV plant.
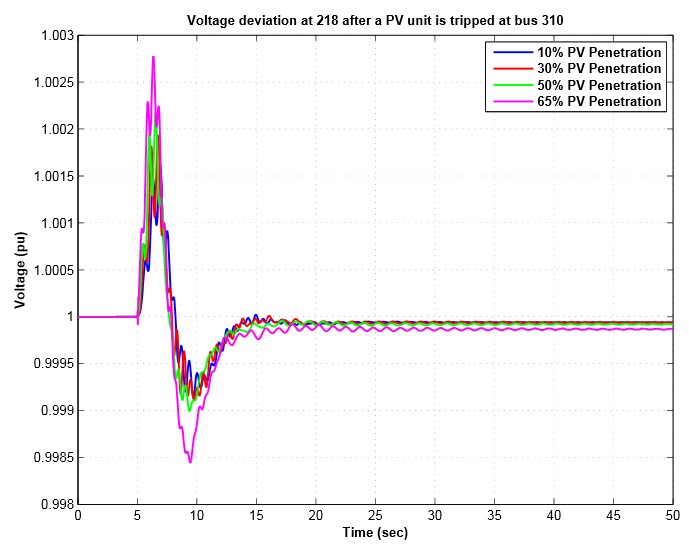
Figure4.16:Voltage profi after tripping a large PV plant.
4.5.4 Impact of the PV Penetration on the Transient Over- Voltages
This section investigates the possible transient overvoltage issues associated with the high integration of the solar generation in the Saudi grid. It analyzes the bus voltage response due to PV solar interconnection.
A screening process is conducted to select the transmission lines within and between the fi e operating regions that have the highest active and reactive power fl w. Therefore, ten
transmission lines (e.g. fi e for each region and other fi e connecting these areas) are chosen as candidates to perform this study. These transmission lines with their active and reactive power fl w are shown in Table 4.4.
Table4.4:Transmission lines with highest power fl w.

Operating Area
TransmissionLine
ActivePowerFlow(MW)
ReactivePowerFlow(Mvar)

Eastern 214-223 1557.8 170.0
Eastern-
Central 215-301 1265.7 396.0
| Central | 313-315 | 1251.4 | 213.1 |
| Western | 102-116 | 1225.1 | 228.6 |
| Northern | 501-502 | 768.70 | 257.5 |
| Southern | 401-403 | 551.00 | 19.80 |
| Western- | |||
| Central 109-311 | 465.20 | 125.0 | |
| Central-
Northern 312-507 |
352.80 | 44.40 | |
| Western-
Southern 105-401 |
158.10 | 118.4 | |
| Western-
Northern 111-503 |
43.900 | 5.270 | |
 For each of the selected transmission line, a three phase fault is applied at t=5s and lasts for fi e cycles before it is cleared. This fault is then followed by tripping the faulted line. This scenario is simulated for the Saudi Grid with all proposed PV penetration levels (10%, 30%,
50%, and 65% PV penetration levels). For each case, the bus that experiences the maximum transient voltage is selected in order to observe the impact of solar plant integration on the voltage response. Among all these cases, two cases are considered in this section.
Case 1:
The transmission line connecting bus 102 and bus 116 in the western operating area is tripped after applying a 3-phase fault and the voltage response at bus 508 is observed. Figure 4.17 shows the voltage profi at bus 508 during this disturbance whereas the bus maximum transient over-voltage is presented in Figure 4.18 for all PV penetration levels. It can be seen that 65% PV generation has resulted in about 1.5% less transient over-voltages than the system with no PVs present. The 50% PV penetration and 65% PV penetration cases shows the same transient response in terms of the transient voltage oscillations. The results show that the voltage oscillations are well damped with more PV units being added to the system. Therefore it can be concluded that the transient over-voltage behavior during line outage is significantly improved as the solar PV penetration level increases.
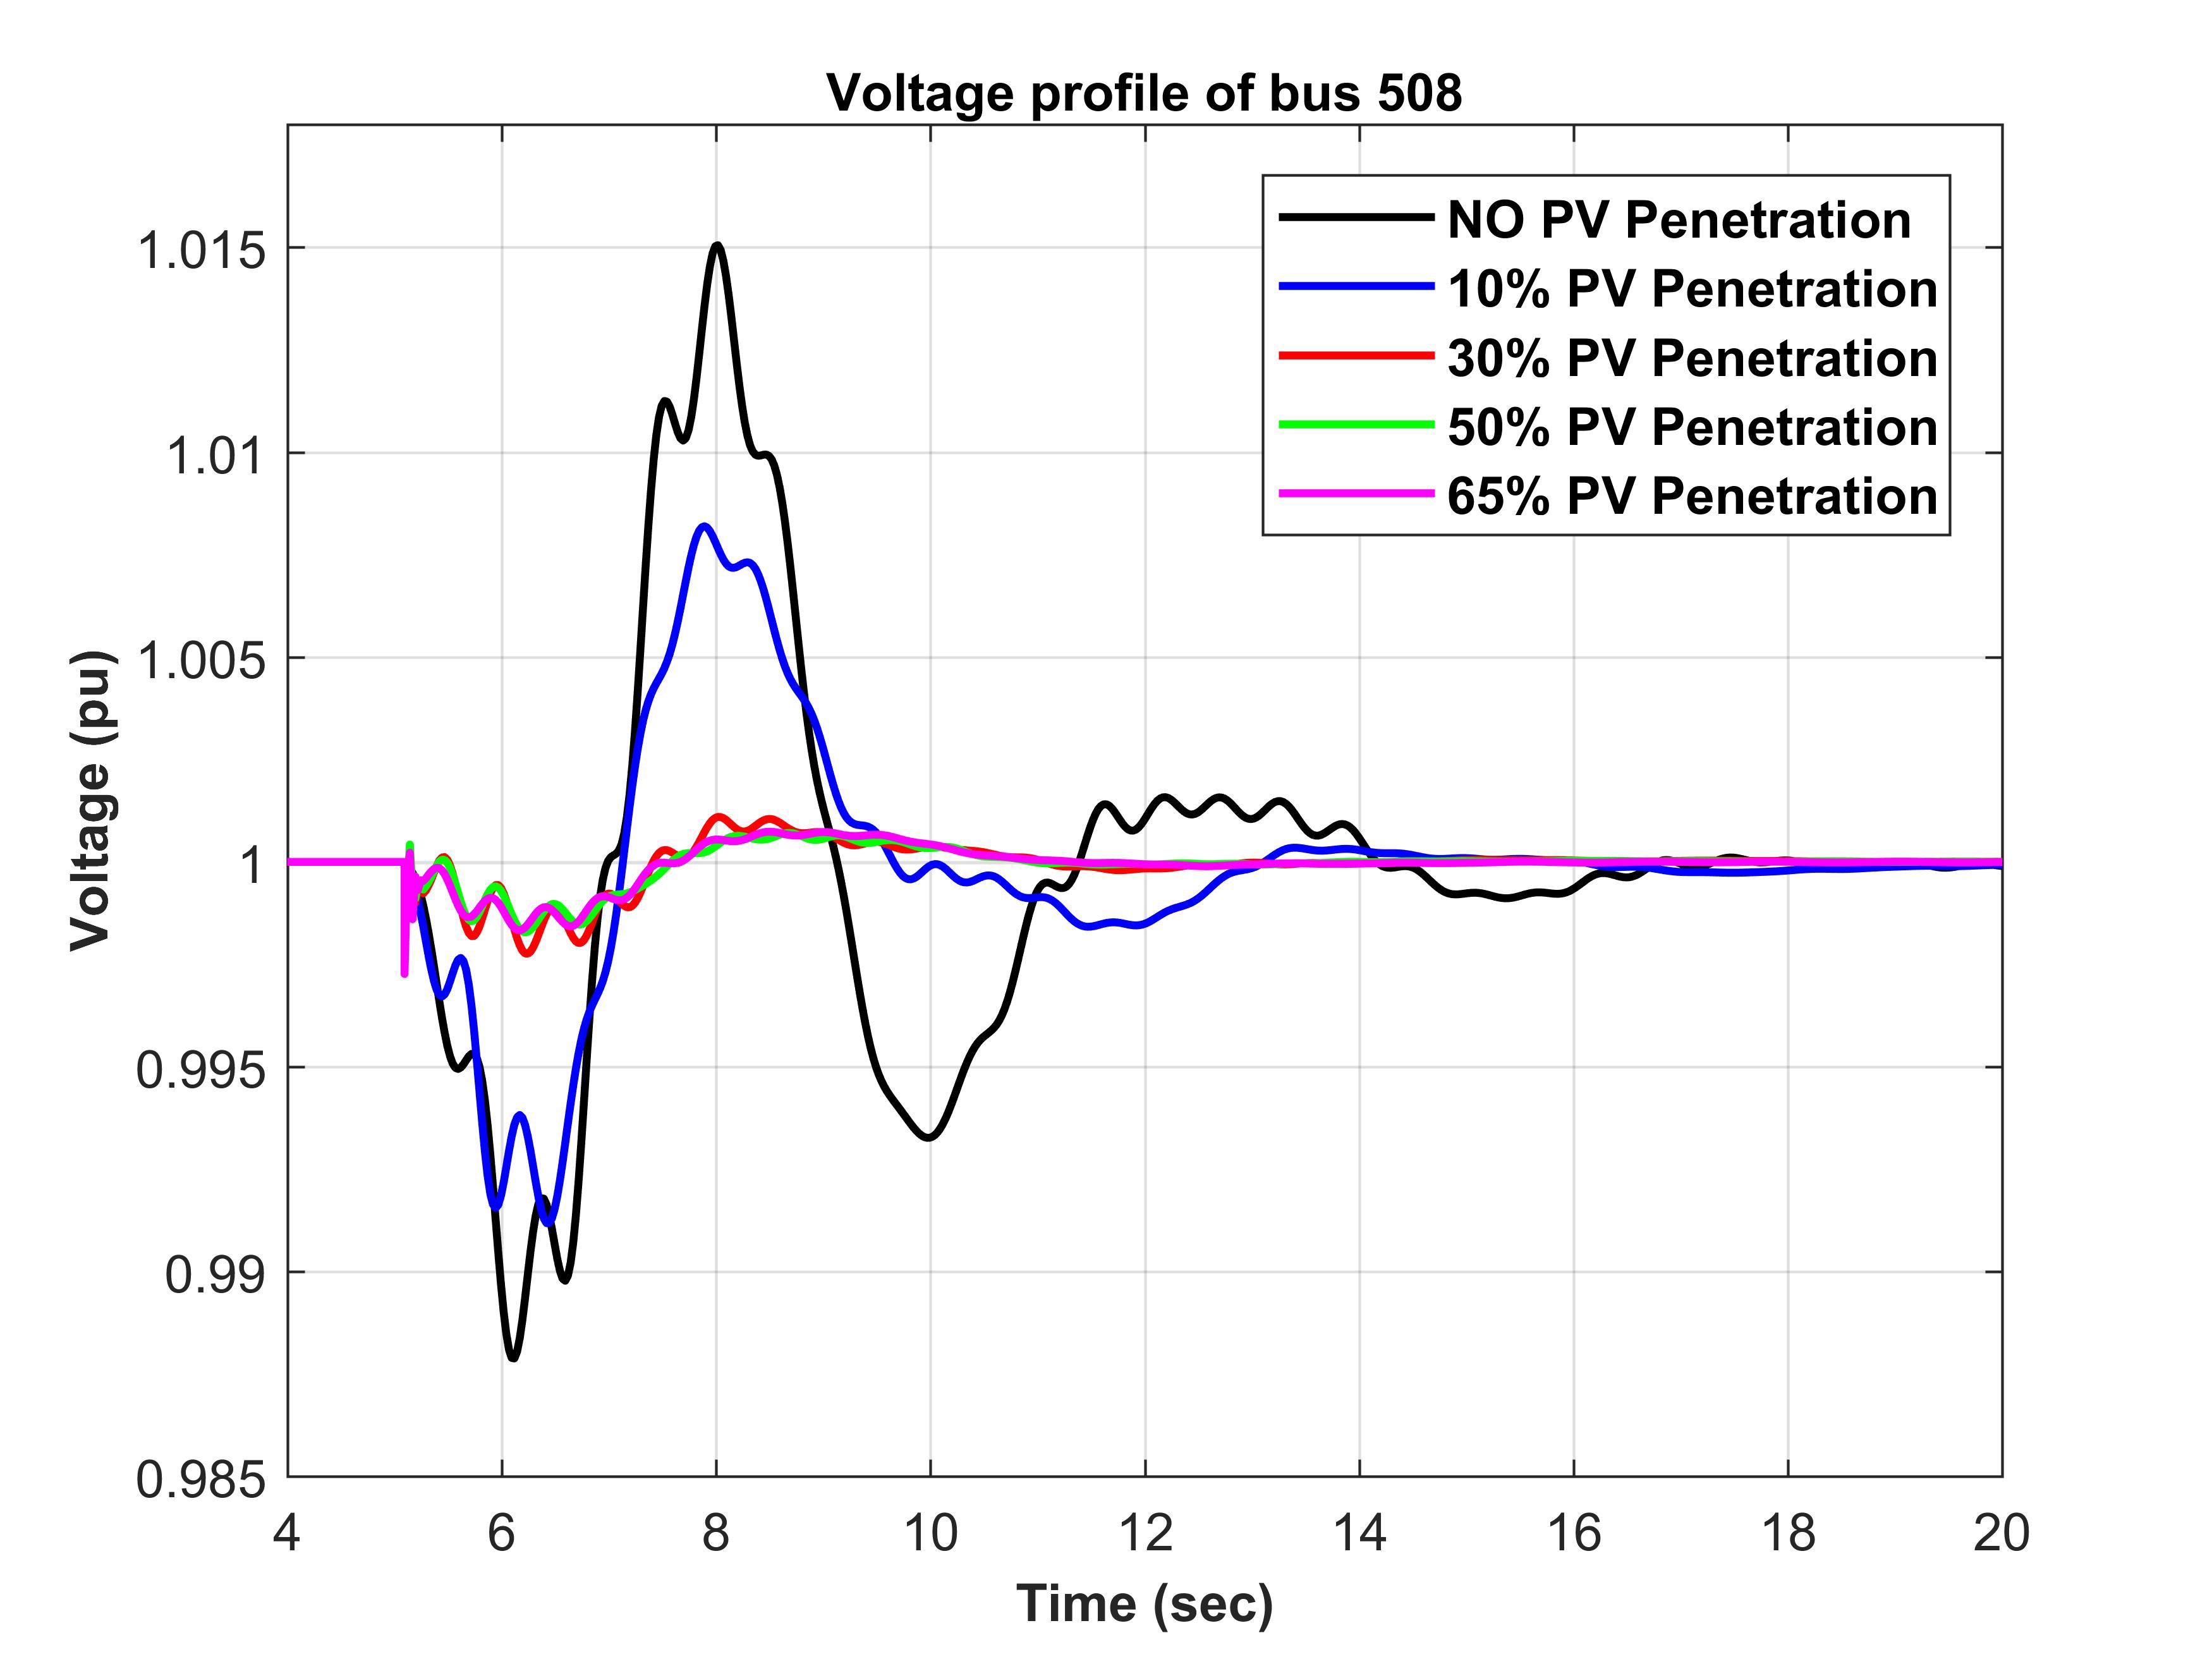
Figure4.17: Voltage profi of bus 508 for various penetration levels.
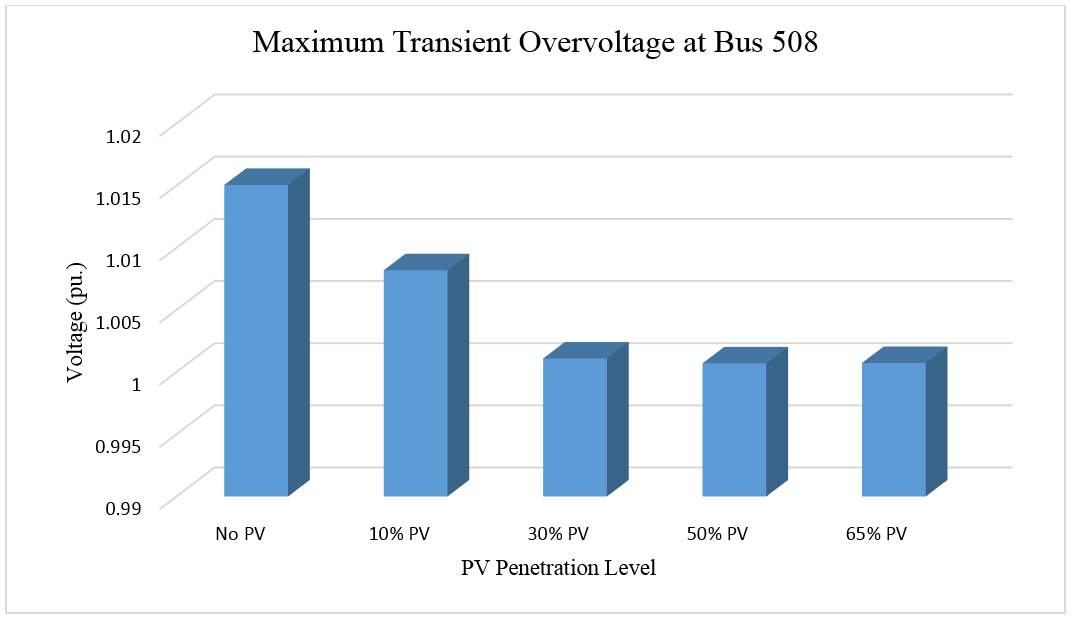
Figure4.18:The maximum transient over-voltage at bus 508 for various penetration levels.
Case 2:
A similar scenario has been applied on the tie transmission line between the Western region (Bus 109) and the Central region (Bus 311). The voltage profi and the maximum transient over-voltage at bus 512 are shown in Figure 4.19 and Figure 4.20, respectively. It could be observed that less voltage oscillations can be seen at bus 512 as the number of the PV plants increase in the system. On the other hand, the system without PV units experiences poor damped voltage oscillations. It can be said that the existence of solar PV units can improve the voltage profi by reducing the maximum transient voltage level by approximately 10% for the 65% PV penetration level. Additionally, the settling time for voltage fl is much decreased as the amount of the penetration level increases.
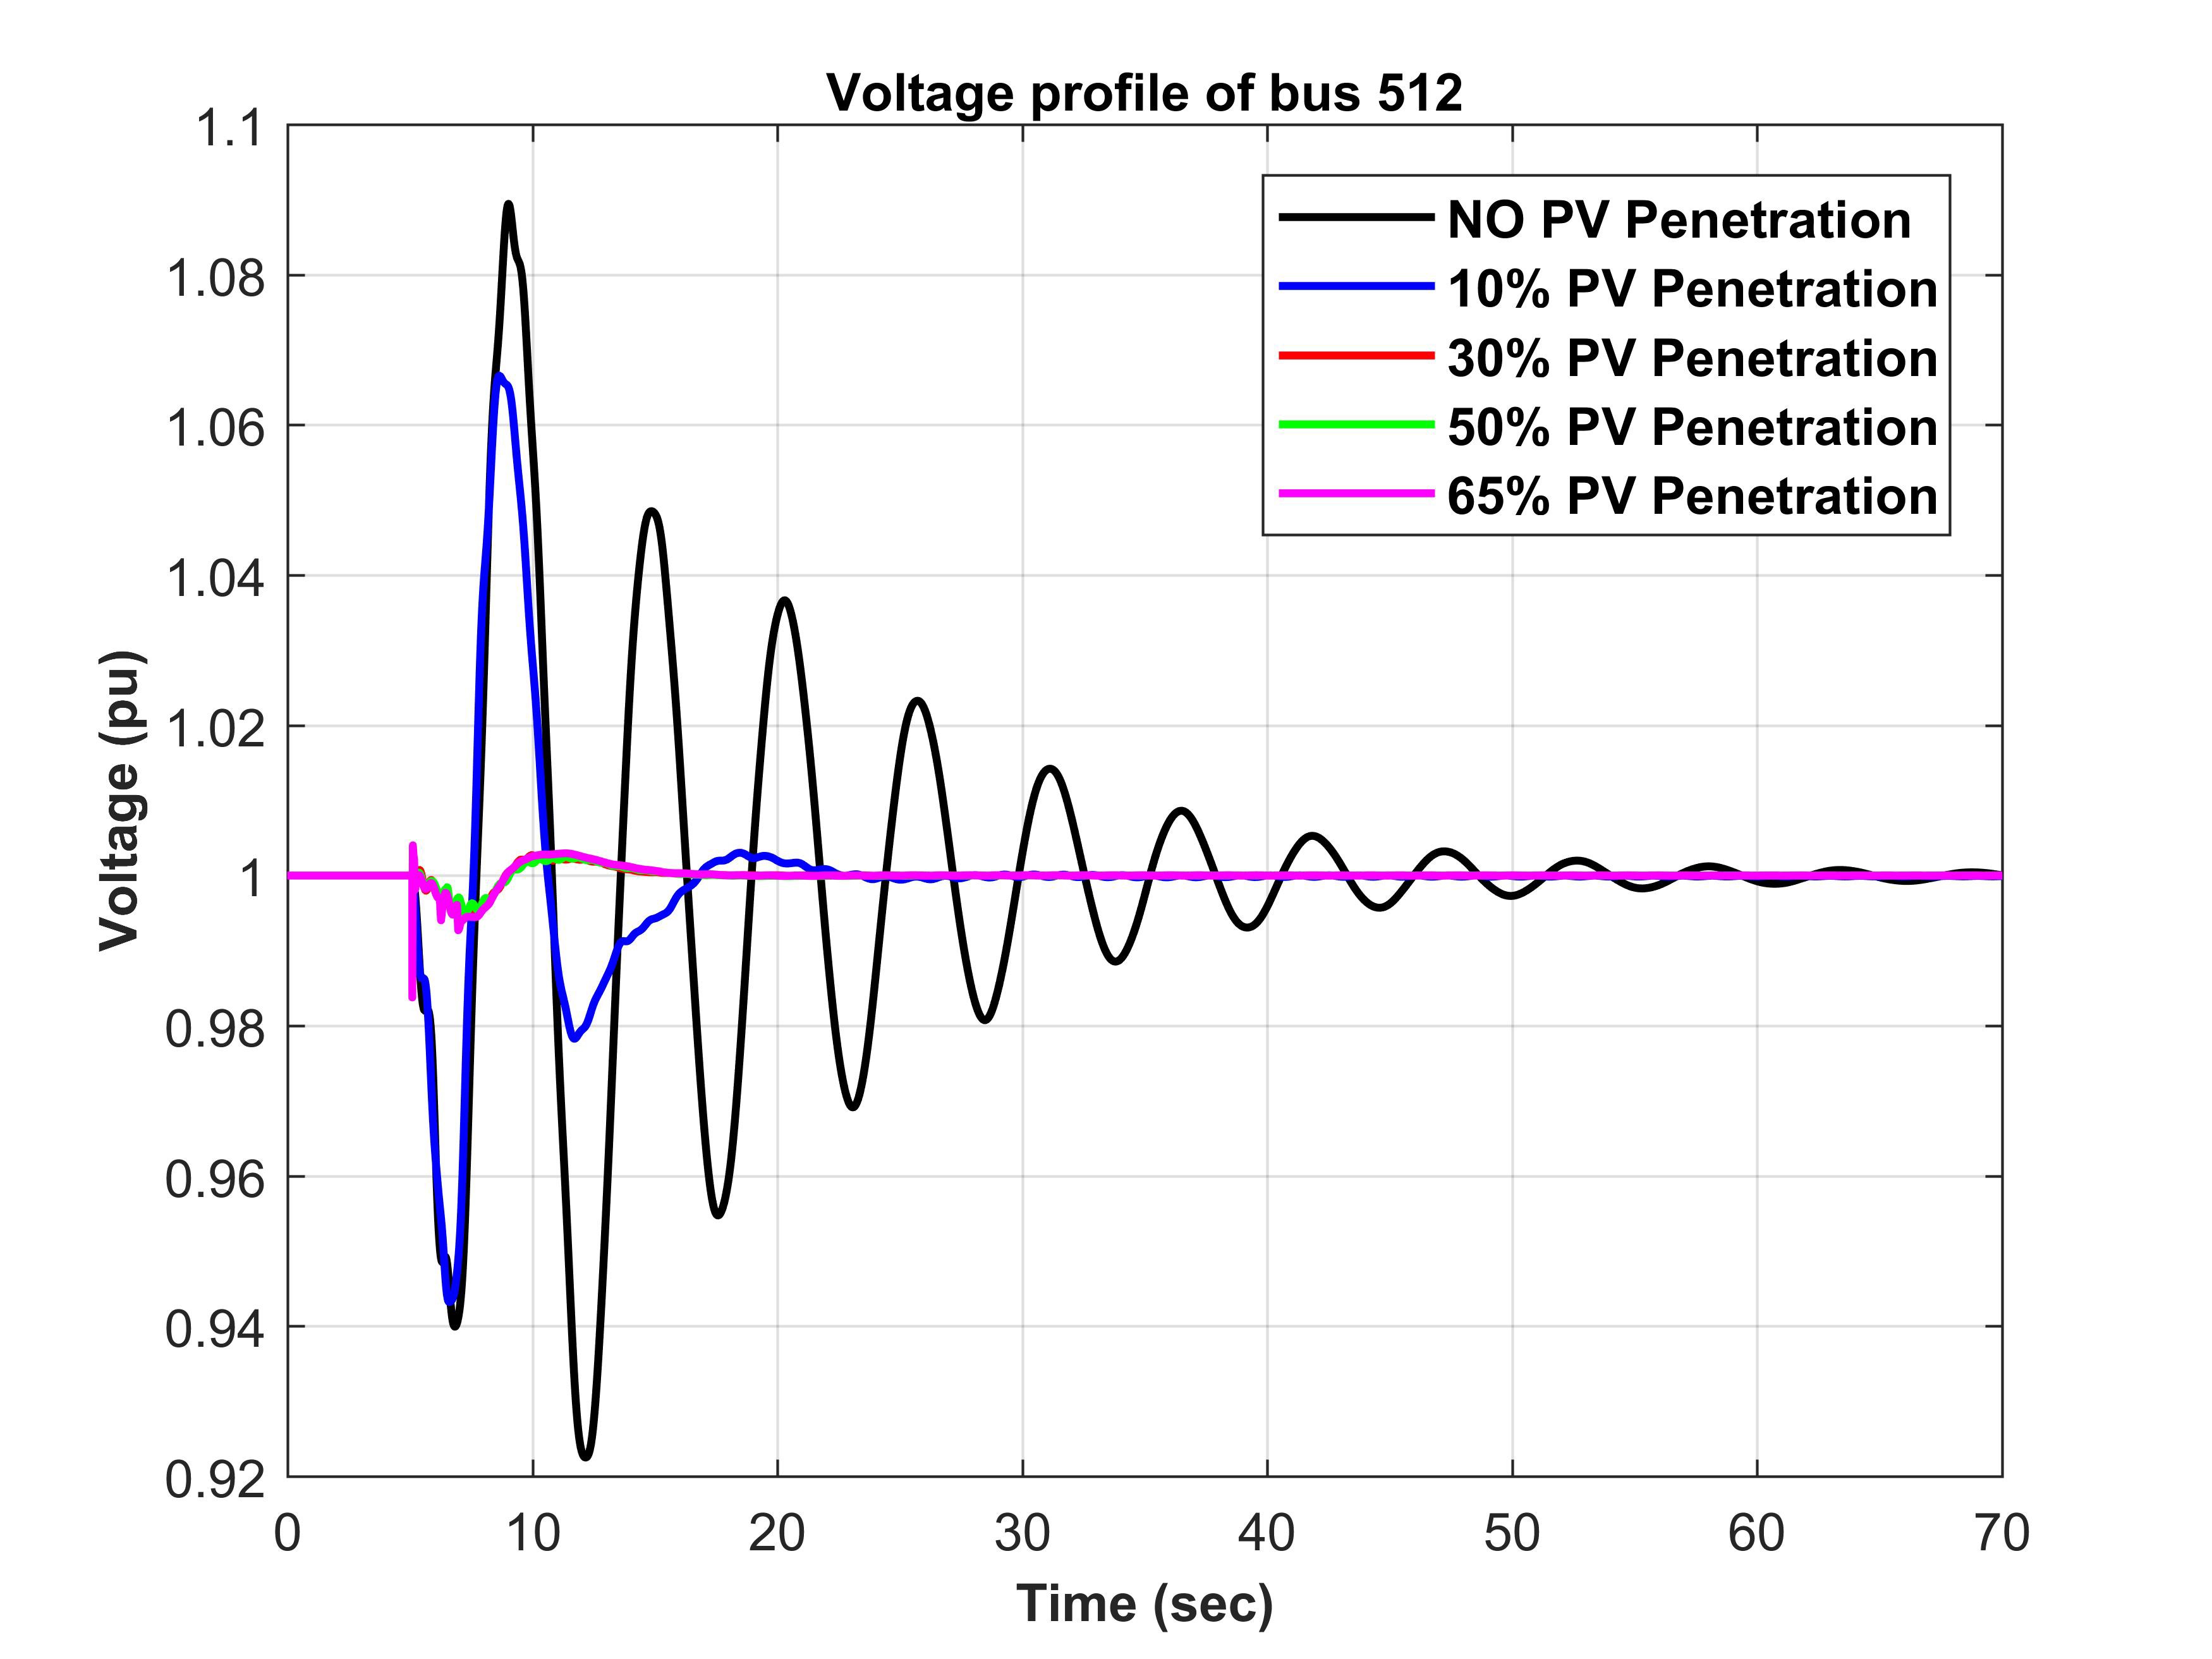
Figure4.19:Voltage profi of bus 512 for various penetration levels.
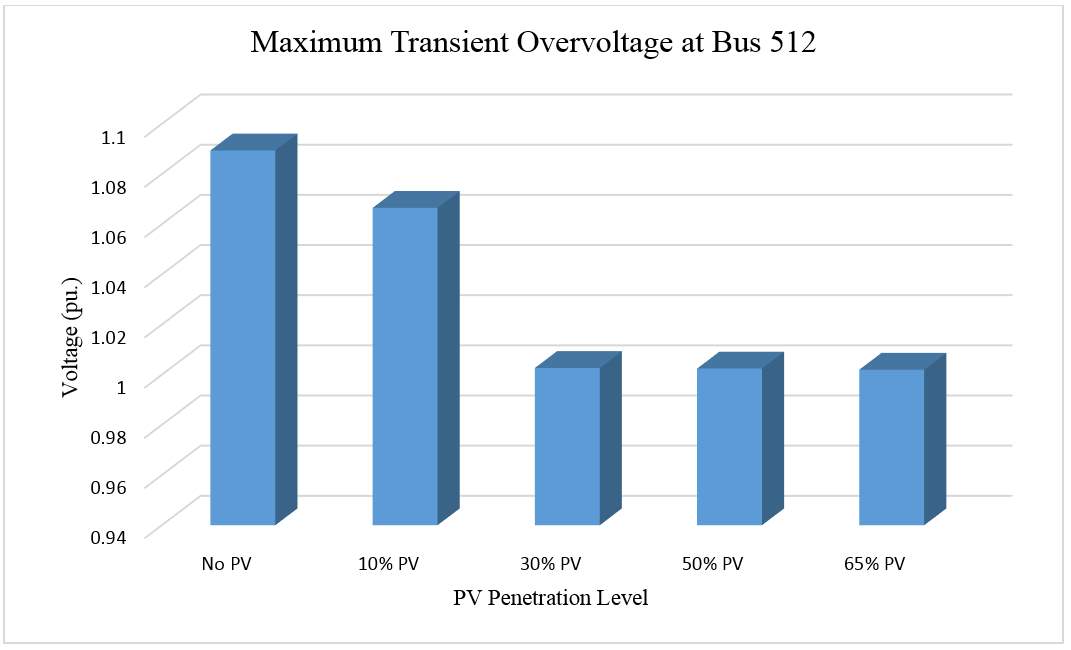
Figure4.20:The maximum transient over-voltage at bus 512 for various penetration levels.
As a result of the observations from the previous two cases, it can be concluded that the presence of the solar PV plants can overall improve the system voltage behavior during the line outages. In fact, addition of the PV generation units reduces the voltage deviation from its initial value. In the all ten studied cases, the overvoltage protection relay is not expected to be triggered.
4.5.5 Impact of Losing a Major Portion of Solar PV Plants
Being heavily dependent on the weather conditions, the amount of the power generated from the solar PV plants is not always available and a large portion of the generated solar power could be lost in cloudy days. Moreover, it is likely that these solar power plants could be tripped simultaneously due to system disturbances such as extreme voltage drop event [73].
Therefore, this section studies the expected worst case scenarios by assuming that a large portion of the PV solar units go offline at the same time for each PV penetration level. The objective of this study is to determine the maximum amount of the tripped PV plants beyond which the grid could become unstable or require shedding some loads.
In order to do so, the PV solar units are dropped one by one in each time for each penetration level, starting from 5% to 65% PV penetration level. The amount of tripped PV units is increased gradually until the critical rate is reached when the system becomes unstable. Table 4.5 summarizes the possible maximum amount of tripped power before the grid gets into unstable system for each penetration level.
It can be observed that for the lower levels of the PV penetration, more PV solar units could be tripped without effecting the system stability. However, as the PV penetration increases, the percent of the tripped PV generated power to the total PV power generation decreases. Figure 4.21 shows the percent of the tripped PV units compared to the total installed PV solar plants. It also shows the size of tripped solar power with the PV penetration level. It can be seen that the amount of the tripped power increases with the penetration level up to the maximum amount (e.g. 9124.017 MW) at 30%, then it starts decreasing before it increases back at 55%. It is known that replacing the conventional machines with PV plants reduces the overall system inertia. Therefore, when the penetration level goes beyond 30%, the system inertia sharply declines which leads the grid to not withstand losing extra solar power.
Figure 4.22 illustrates the system frequency response after tripping all PV units (100%) for the 5% PV penetration level while Figure 4.23 shows the system frequency when (8270.534 MW) of the solar power is tripped. It can be seen in Figure 4.23 that the system frequency
dropped to 59.825 Hz which is above the proposed limit of the low-frequency load-shedding relay to operate.
Table4.5:The maximum amount of the tripped solar power for all penetration levels.

Penetration Level
| PercentofTrippedPVUnits | AmountofTrippedPVPower(MW) |
|
100% |
3081.400 |
| 89% | 5420.150 |
| 65% | 5947.250 |
| 52% | 6320.050 |
| 50% | 7595.750 |
| 50% | 9124.017 |
| 40% | 8644.017 |
| 31% | 7494.600 |
| 27% | 7624.800 |
| 23% | 7010.167 |
| 23% | 7865.367 |
| 22% | 8079.434 |
| 21% | 8270.534 |

5%
10%
15%
20%
25%
30%
35%
40%
45%
50%
55%
60%
65%

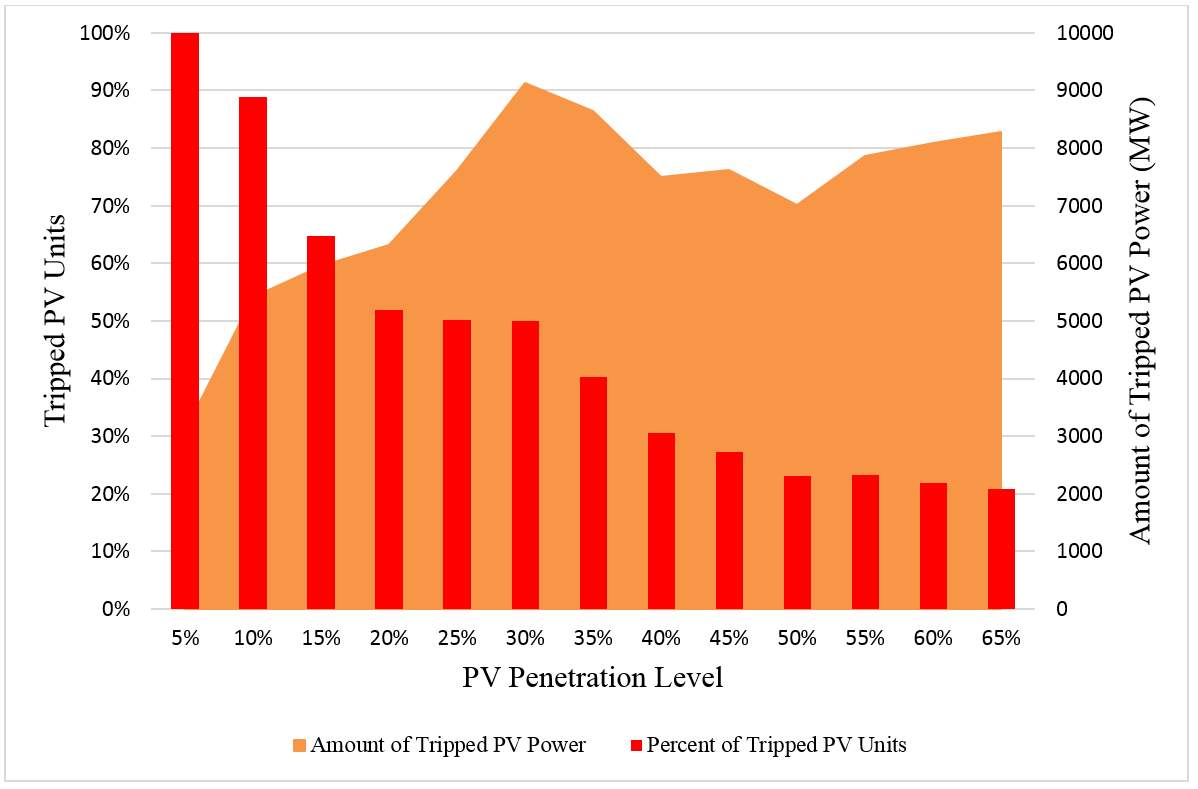
Figure4.21:The maximum amount of the tripped solar power for all penetration levels.
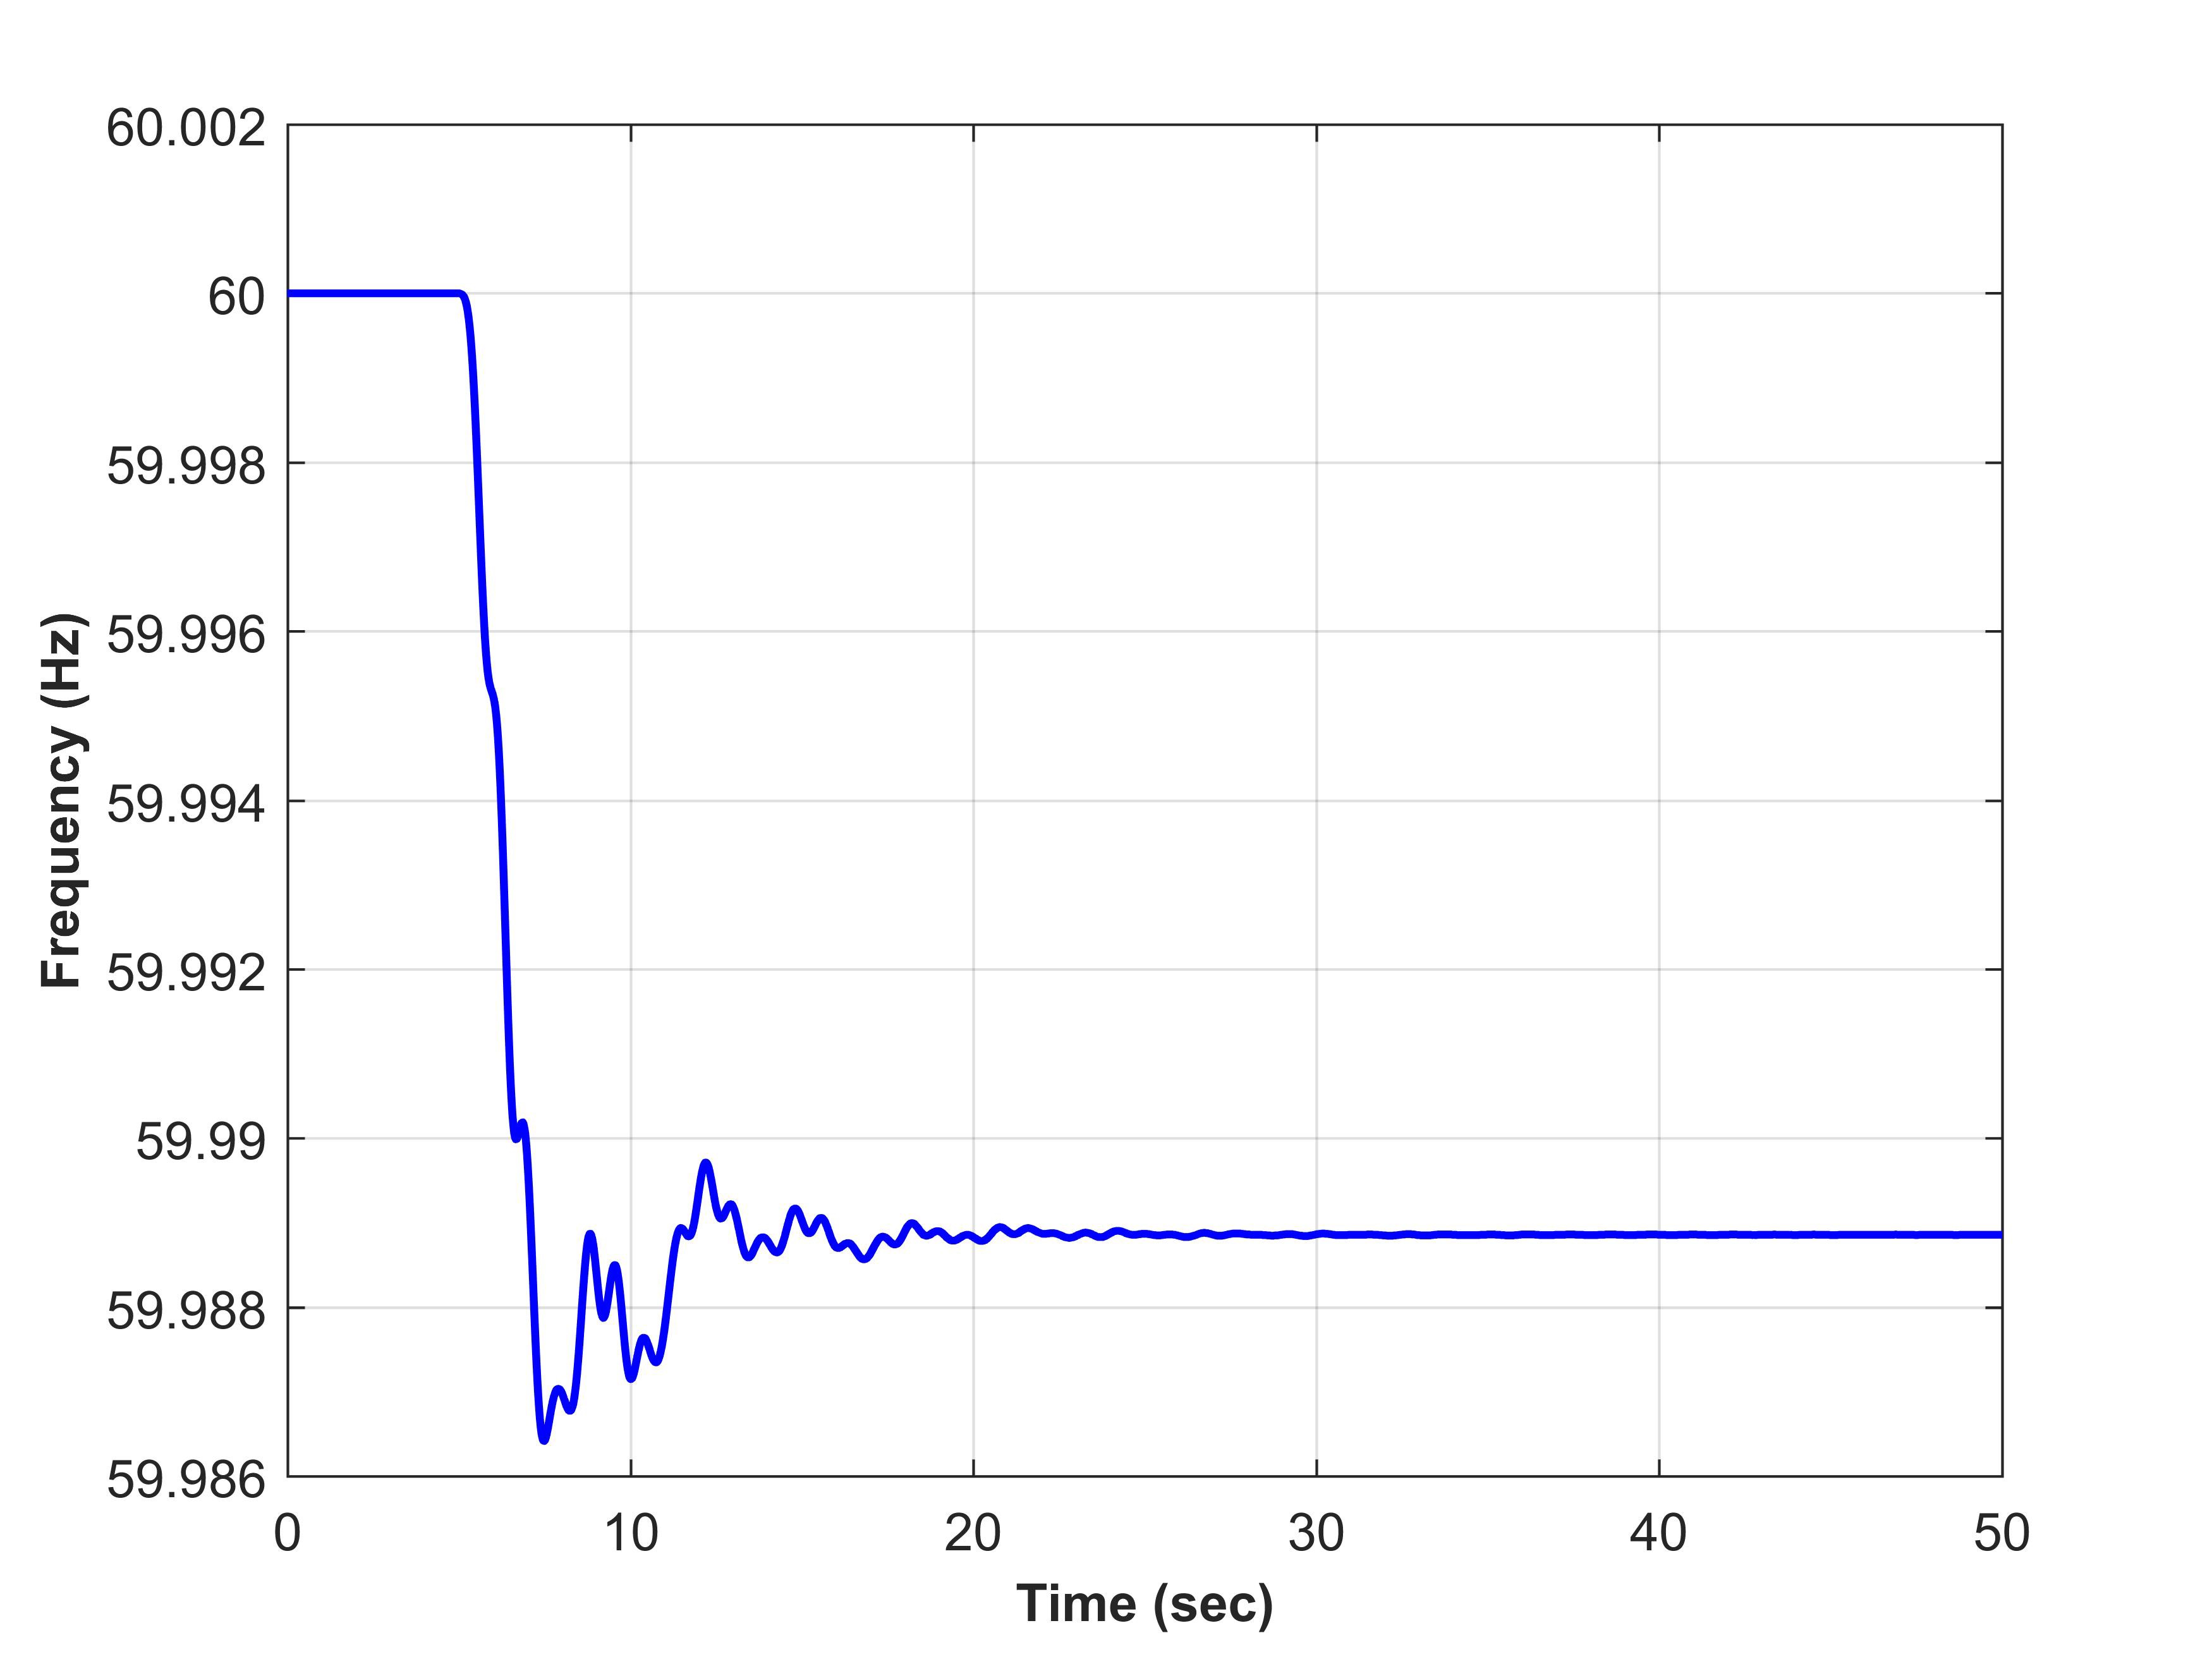
Figure4.22:Frequency response after losing all PV units in the 5% PV penetration level.
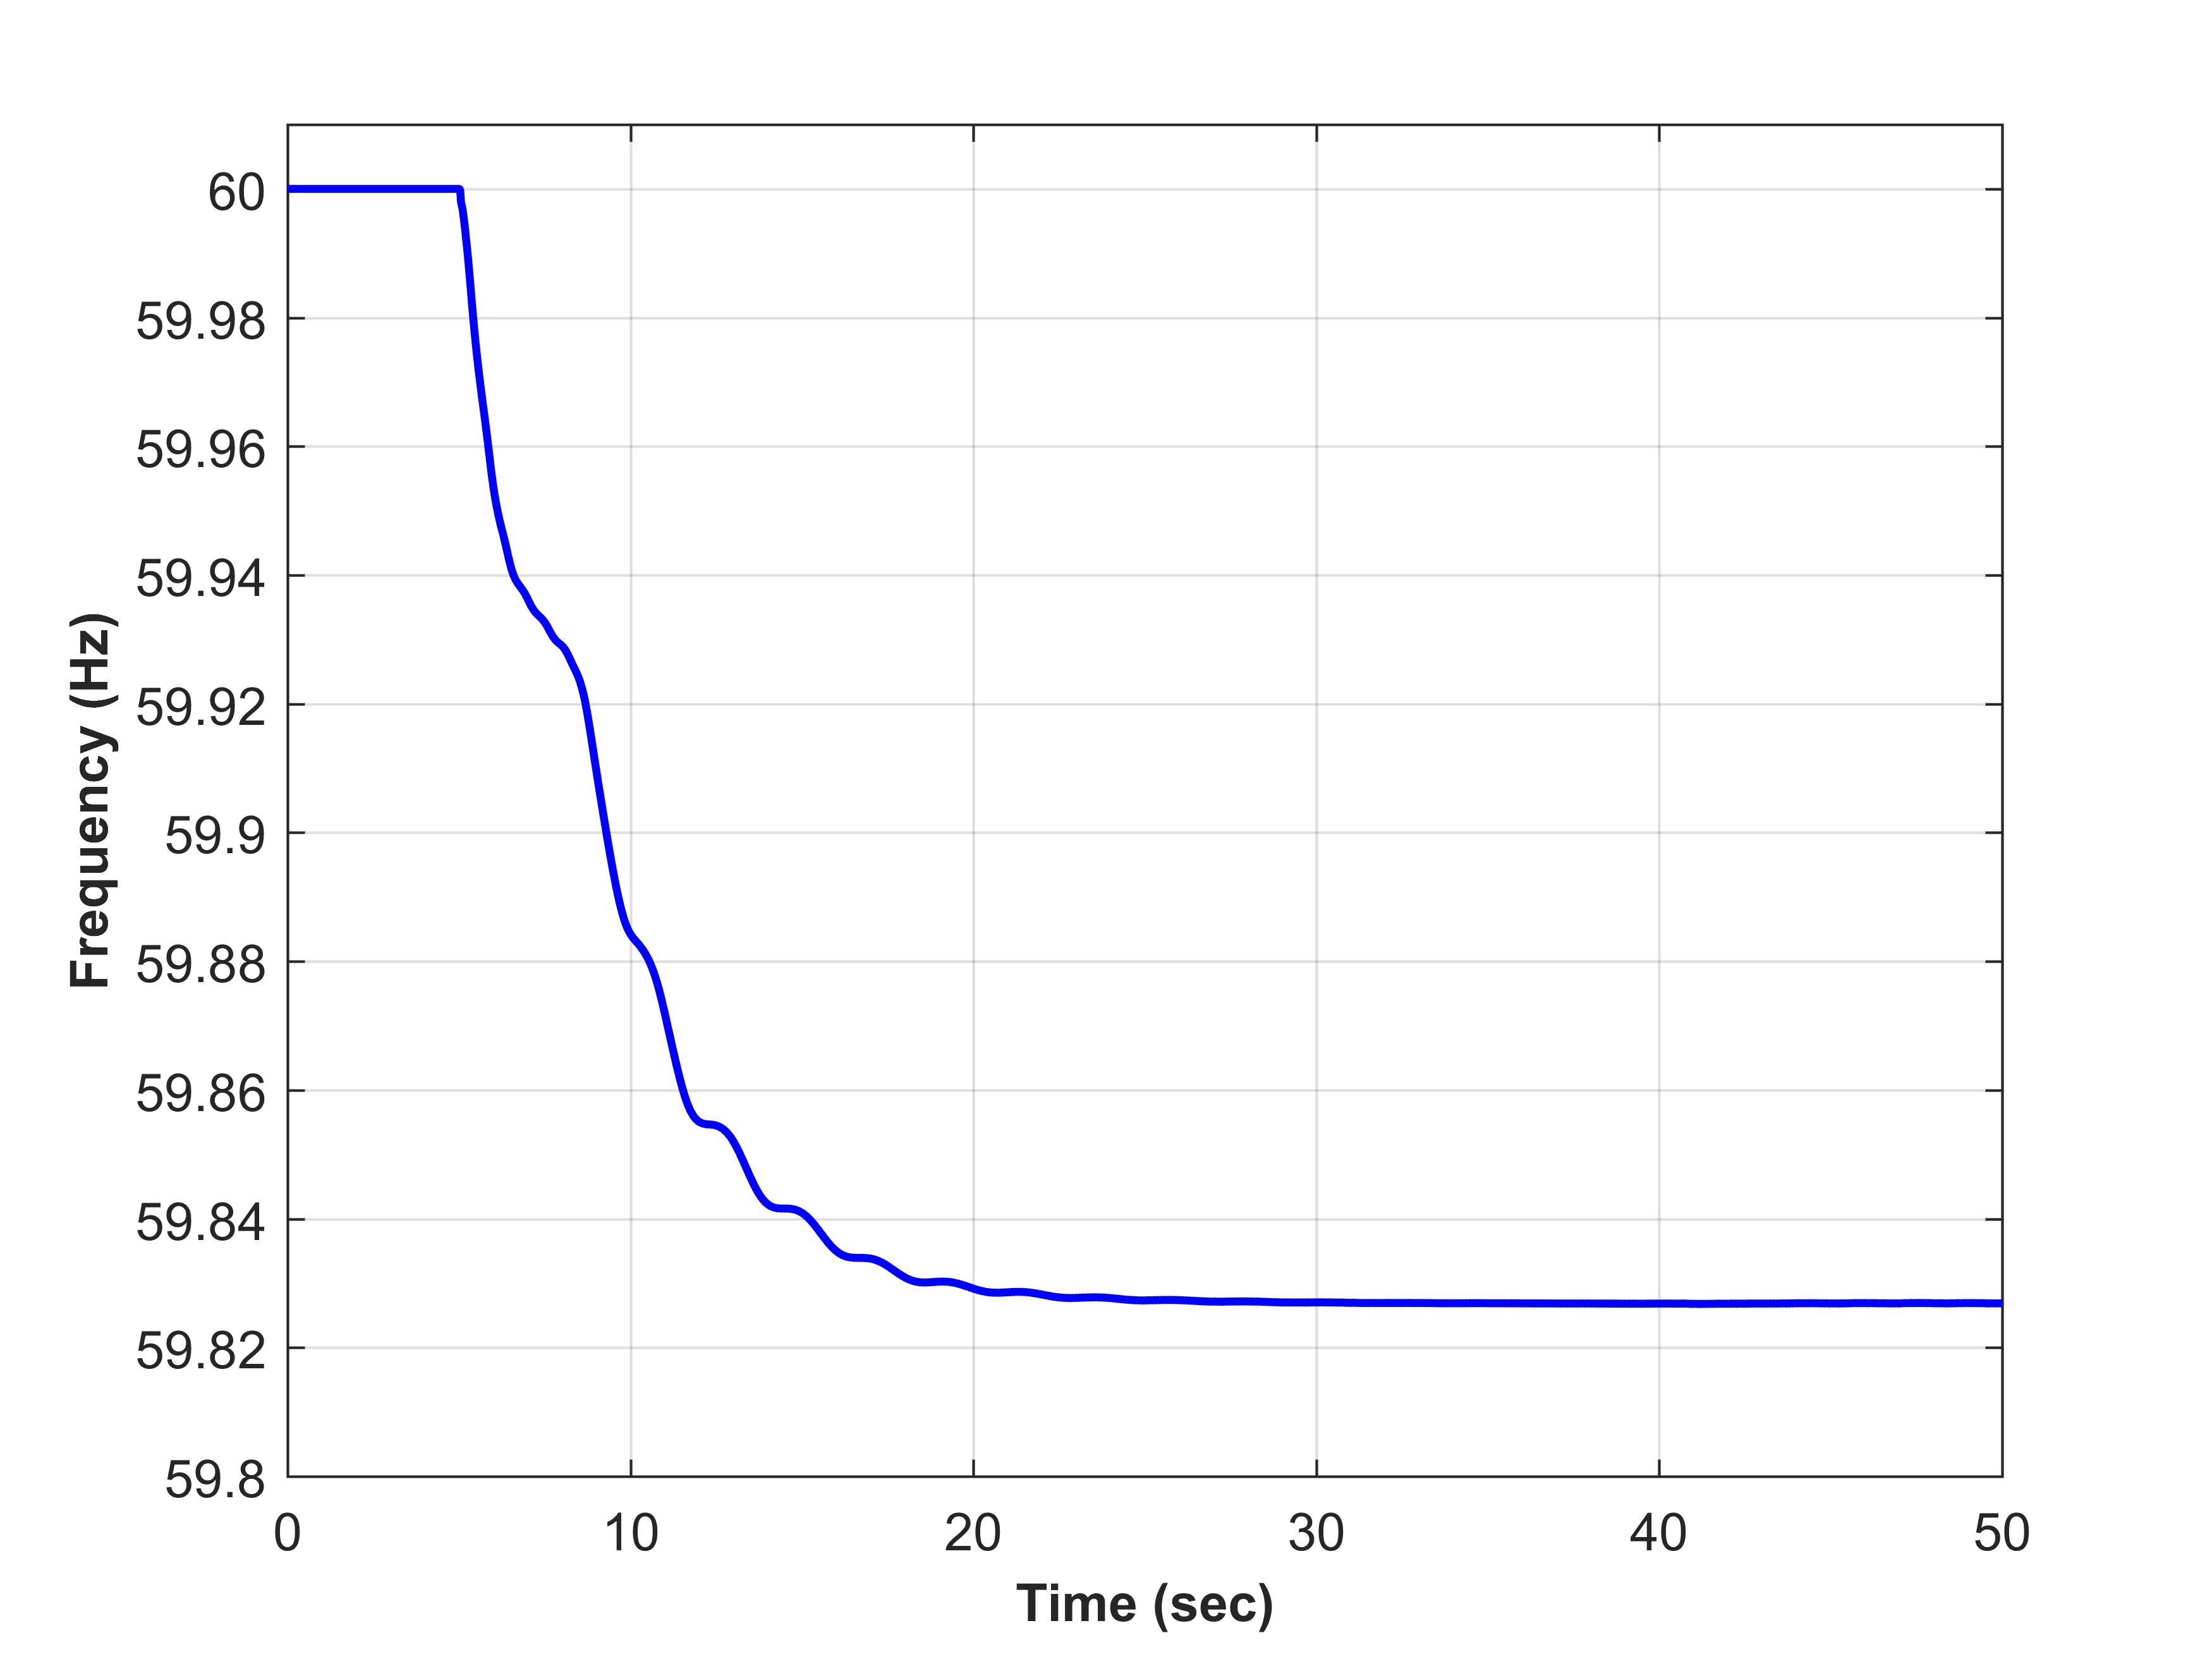
Figure4.23:Frequency response after losing 21% of PV units in the 65% PV penetration level.
Cite This Work
To export a reference to this article please select a referencing stye below:
Related Services
View all


Related Content
All TagsContent relating to: "Energy"
Energy regards the power derived from a fuel source such as electricity or gas that can do work such as provide light or heat. Energy sources can be non-renewable such as fossil fuels or nuclear, or renewable such as solar, wind, hydro or geothermal. Renewable energies are also known as green energy with reference to the environmental benefits they provide.
Related Articles

DMCA / Removal Request
If you are the original writer of this dissertation and no longer wish to have your work published on the UKDiss.com website then please: