Marine Energy Generating Devices & their Suitability for Ireland’s Coastline
Info: 36753 words (147 pages) Dissertation
Published: 13th Dec 2019
Tagged: Environmental StudiesEnergy
Current Status and Future Development of Marine Energy Generating Devices & Analysis of Their Suitability for Use Along Ireland’s Coastline
Executive Summary
The growth in demand for the generation of electricity from renewable energy sources is ever growing not only as an alternative to fossil fuels but also as concerns over the environment and political unrest increases across the world. Ireland in particular needs to begin to exploit the vast indigenous renewable energy resources it has at its disposal to reduce it’s over dependence on imported fossil fuels. The Irish government has set itself various targets in order to have renewable energy make a greater contribution towards Ireland’s overall energy mix. This has seen the growth in certain renewable resources such as the wind industry however this resource can be both unpredictable and intermittent. The development of renewable energy sources is a fundamental part of the Irelands climate change strategy and sustainable energy objectives.
The advancement of the usage of renewable energies will help in achieving the three energy policy goals of cost competitiveness, energy security and the reduction in greenhouse gas emissions (GHG). With little net emissions from renewable energy as opposed to fossil fuels, renewable energy sources contribute to the reduction in GHG emissions and the decarbonisation of the energy supply. Renewable energy also assists with energy security as it is an indigenous energy supply and in a time of geo-political issues and volatile energy costs it can decrease our over dependency upon imported fossil fuels, there is also the possibility that Ireland could become a net exporter of both renewable technology and renewable energy.
The 2009/28/EC European Renewable Energy Directive has set Ireland a mandatory of target 16% of its gross final energy consumption to come from renewable energy sources. Irelands National Energy Action Plan (NREAP) has also set targets of 40%, 12% and 10% for the contribution of renewable energy from electrical generation, heating and transport [1]. The 2015 Government White Paper on Energy “Irelands Transaction to a Low Carbon Energy 2015-2030” detailed Irelands low carbon future which the government hopes will obtain most of its energy from indigenous renewable energy sources. To ensure the government meets its 2020 targets and to prepare for more renewable energy deployment towards to 2030 the government has committed to the following:
- The introduction of a renewable energy support scheme for various RES-E technologies from 2016
- To ensure the existing support schemes are updated so as they are compatible with wholesale electrical market reform
- To ensure the nation grid will be capable and flexible enough to cater for the current and future renewable energy policy such as community renewable energy projects
- The publication of a renewable electricity policy and development framework in order to ensure proper planning and development of larger scale renewable electricity generation development
- Development of a framework to assist with renewable energy development taking guidance from the European Union (Energy Efficiency) 2014 Regulations.
There is huge potential within the seas and oceans to provide a clean energy generating resource from waves and currents. Ireland has excellent marine energy resources in particular wave and tidal resources, these energy sources are both predictable and vast and can both play major roles in the future development of Irelands sustainable energy sector. However up until recently marine energy generating technology has not reached a stage where large scale developments are economically viable. The aim of this thesis is to review the current status of marine energy generating technologies, addressing issues such as network integration, environmental impacts and economics, with particular consideration given to technologies suitable for Ireland’s coastline.
Table of contents
1.2 research methodology, objective & aims
3 Investigation Into Ireland’s Energy Usage And Fuel Usage For Electricity Generation
3.2 Fuel Inputs to Electricity Generation
3.3 Gross Final Consumption (GFC)
3.4 contribution of renewable electricity sources
3.7 RENEWABLE ENERGY TARGETS & EMISSIONS REDUCTION
4.2 key factors for marine industry development
4.3 theory behind tidal energy
4.4 energy CONVERSION OF TIDAL ENERGY
4.5 developments in tidal energy
4.6 current & future tidal energy technology
4.8 energy CONVERSION OF WAVE ENERGY
4.9 developments in wave energy
4.10 current & future wave energy technology
5 Investigation Into Ireland’s coastline to ascertain their suitability for marine energy generation
5.1.1 TECHNICAL & PRACTICAL TIDAL CURRENT ENERGY RESOURCE
5.1.2 ACCESSIBLE & VIABLE TIDAL CURRENT ENERGY RESOURCE
5.1.3 SPRING TIDE PREDICITONS & SITE SELECTION
5.2.1 WAVE THEORETICAL AND TECHNICAL RESOURCE
5.3 variability issues with wave & tidal power
5.4 site locations & parameters ASSOCIATED WITH wave & tidal power
6 Investigation of the most suitable marine energy generating devices for each of the four locations
6.1 west coast location – (wave)
6.1.1 AREAS OF ENVIRONMENTAL CONSTRAINTS
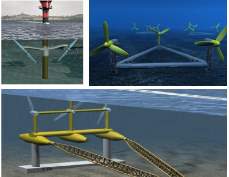
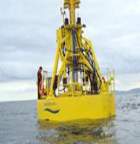
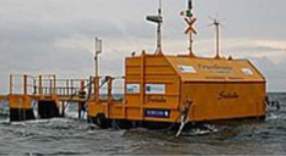
6.1.2 PATICULAR MARINE ENERGY RESOURCE DEVICE (POWERBUOY)
6.2 east coast location – (tidal)
6.2.1 AREAS OF ENVIRONMENTAL CONSTRAINTS
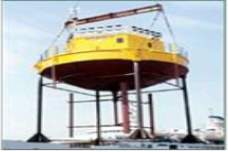
6.2.2 PATICULAR MARINE ENERGY RESOURCE DEVICE (OPENHYDRO TIDAL DEVICE)
6.3 north coast location – (tidal)
6.3.1 AREAS OF ENVIRONMENTAL CONSTRAINTS
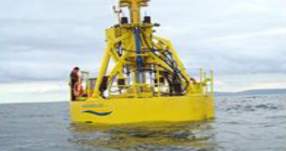
6.3.2 PATICULAR MARINE ENERGY RESOURCE DEVICE (SCOTRENEWABLESSR2000)
6.4 SOUTH west coast location (WAVE)
6.4.1 AREAS OF ENVIRONMENTAL CONSTRAINTS
6.4.2 PATICULAR MARINE ENERGY RESOURCE DEVICE (PELAMIS WAVE POWER)
7.1 marine energy convertor economics
7.1.1 ECONOMIC CHALLENGES OF MEC’s
7.1.2 METHODS FOR DEFINING THE COST OF MEC’S ELECTRICITY GENERATION
7.1.3 NETWORK AND GRID INTEGRATION
8 future of marine energy in ireland and throughout the world
8.1 marine energy future challenges
8.2 marine energy opportunities in irish market & abroad
Nomenclature/Glossary
AC Alternating Current
ADCP Acoustic Doppler Current Profiler
CO2 Carbon Dioxide
CIBSE Chartered Institution of Building Services Engineers
CIC Cumulative installed capacity
DC Alternating Current
DCENR Department of Communications, Energy and Natural Resources
EDF Électricité de France
EU European Union
GFC Gross Final Consumption
GHG Greenhouse Gas Emissions
GW Gigawatt
GWh/yr Gigawatt Hours/Year
HAT Horizontal-Axis Turbines
Hs Wave Size
HVDC High Voltage Direct System
IBA Important Bird Area
IET Institution of Engineering & Technology
JRC Joint Research Centre
Km Kilometre
Km² Kilometer Squared
Kg/m³ Kilogram per meter cubed
Ktoe Tonne Of Oil Equivalent
KW/m Kilowatt per meter
LCC Life-Cycle Costing
LEC Levelised Energy Cost
m Meter
MCED Marine current energy devices
MRIA Marine Renewable Industry Association
m/s Metre Per Second
Mtoe Million Tonnes Of Oil Equivalent
MPA Marine Protected Area
MW Megawatt
NAO North Atlantic Oscillation
NREAP National Energy Action Plan
NPWS National Parks & Wildlife Service
OCT Open Centre Turbine
OREDP Offshore Renewable Energy Development Plan
OWC Oscillating Water Columns
PTO Power Take Off
R&D Research & Development
SAC Special Areas of Conservation
SEA Strategic Environmental Assessment
SEAI Sustainable Energy Authority of Ireland
T Tonne
Tc Wave Energy Period
TEC’s Tidal Energy Convertors
T/m³ Tonne per meter cubed
TPER Total Primary Energy Requirement
TW Terawatt
TWh/yr Terawatt-hour per Year
UK United Kingdom
UoS Use of System
WAM Wave Analysis Mode
1 Introduction
1.1 thesis outline
Tidal movements and ocean circulation generate marine currents; local currents can be affected by differences in temperature, salinity levels and outflow of rivers [2]. There are presently a number of technologies which can be utilised in order to harness the kinetic energy which is contained within these marine currents. There are also many similarities between marine energy generation and wind energy generation as the two types of power are forms of flowing bodies and as such the power available at any particular site is proportional to the fluid density and the cube of its velocity. The main difference between the two is that the density of sea water is much greater than that of air (approximately 832 times greater), this means that the energy which can be generated from a marine energy generating device will be far greater than that of a wind energy device assuming that the fluid velocities are the same and that the wind energy generating device is of similar dimensions to the marine current energy [3].
Marine current energy devices (MCEDs) offer many advantages when compared to other renewable technologies. Over long time periods they are less unpredictable and intermittent when compared to technologies such as wind energy generation, this also helps make grid connections into existing electrical networks much less challenging. Due to MCEDs predictability access to a stable and reliable grid network will allow MCEDs to become a more stable supplier of base load [4]. The economic development of MCEDs is also set to increase as the costs associated with the technology decrease and the sector sees market growth and incentives. However for any proposed site a thorough investigation of current velocity characteristics, the cost of electricity within the region and the reliability of the proposed technology is required [5]. When a site has been selected the next step is to establish the best suited technology as well as the required support structure. Within Ireland the potential for marine energy generation has not been properly exploited despite the fact that Ireland has excellent marine energy generation capability.
Ireland is of course very heavily dependent upon the use of imported fossil fuels to meet its energy demands, this is not only a concern from an environmental aspect but also a major concern as regards the country’s economy recovery as most of the imported fossil fuels comes from regions of political instability which can lead to security of supply concerns and large fluctuations in prices. MCEDs have many advantages with a minimal impact upon the environment [6]; they offer a sustainable and clean form of energy generation with little visual impacts. There is also huge potential as regards the exporting of electricity via grid interconnectors should an EU energy market or Euro grid emerge. Ireland also has many research and development facilities including the Beaufort Laboratory in Cork, the Atlantic marine energy test site in County Mayo, Smart Bay in Galway as well as the facilities at Queens University, Belfast. The seas around Ireland offer huge potential this can only be realised if the technology behind the energy extraction is properly developed.
1.2 research methodology, objective & aims
Ireland as a country is very well situated to exploit the benefits that are possible through the exploitation of marine energy generating devices. This paper will review the current status and proposed future development of marine energy generating technologies together with addressing issues such as network integration, environmental impacts and economics, with particular consideration given to four specific locations around Ireland’s coastline. These survey locations were based on the north, south, east and west coasts. The methodology that was utilised for this thesis was desk based study of on-line journals and literature as well as review and analysis of national and international standards. There was also a review of existing geographical surveys, tidal and wave survey of Irish coastline as well as consolation with industry experts.
In order to properly investigate and analyse how marine energy generating devices can be used to their full potential along Irelands coastline many specific factors must be addressed, this thesis is based on an assessment of these factors and the associated objectives of the thesis are as follows:
- To investigate and analyse Irelands current energy usage and its over-reliance on imported fossil fuels
- To investigate and analyse the current technologies and future developments in marine energy generation
- To investigate and analyse Ireland’s coastal regions in four specific regions around Ireland’s coast and to ascertain their suitability for marine energy generation. Analysing which region offers the best potential for marine energy generation.
- To investigate and analyse the most suitable marine energy generating devices for each of the four locations along the Irish coast and to ascertain which offers the best potential when matched with a particular marine energy generation device
- To investigate and analyse the economics, grid connection, costs and environmental issues associated with marine energy generation and to formulate solutions to these issues
- To investigate the future of marine energy generation and the role that it will play in Irelands future energy generation requirements.
2 Literature Review
The literature review undertook to research the range of technologies and methods that are utilised for the estimation and extraction of both tidal and wave energy. The literate review in respect of both wave and tidal stream energy gave a valuable insight into this energy resource along Ireland’s coastline. The literature research did reveal that particular in the case of tidal stream energy assessments conducted to date have not fully assessed the flow of energy that is available, this needs to be included in technical resource assessments together with an assessment of the constraints. The literature review did reveal that depending upon typical constraints such as technical information, tidal velocities, depth and economic factors that the estimation of resources can vary widely and so will have an impact upon the results of any assessments. In respect of wave energy the literature did highlight that the main constraint this energy resource comes from both economic and environment factors, it should also be noted that more research is required to ascertain the impact of these constraints around the entire Irish coastline especially as either an under or over estimation of these figurers’ can lead to energy resource estimations being over estimated, some literature were found to be over generous in not only the amount of energy which could be extracted but also as regards the availability of feasibility of even utilising the energy resource.
The literature review did find that there is huge potential for both wave and tidal stream energy generation within Irish waters. The most recent work on tidal stream energy resource by a government agency was done by SEAI in 2005, the review detailed a number of locations around the Irish coastline which were deemed suitable for development of commercial tidal arrays, the areas identified where in the Shannon estuary and along the east coast of Ireland. The 2014 the “Offshore Renewable Energy Development Plan” also found that further areas in along the south east coast and north west coast were also suitable for the development of tidal energy. The research did also fine that SEAI are now conducting more specific and detailed assessments of these areas and this work continues to date. In respect of the wave energy resource a detailed assessment of Ireland’s wave energy resource was conducted in 2005 by the SEAI/MI.
The report details the theoretical and accessible wave energy resource levels, the study found that theoretical resource within Irish waters was 525TWh as way of a comparison the report further derailed that in 2006 the Republic of Irelands total electricity requirement for electricity was 27.8TWh. The report went on further to detail that the resource amount in Ireland will depend upon a number of key factors including, cost effectiveness of the technology and the amount of power which can be practically connected to the grid and the capacity of the network when other intermittent renewable sources are considered. The research into suitable sites for both wave and tidal did allow a more forward thinking assessment of both energy resource potentials this was based upon advances in technology and research. The literature review for both sources aimed to review both the current and future technology characteristics as well as incorporating any potential future developments in each resource. The research into suitable sites for both wave and tidal did allow a more forward thinking assessment of both energy resource potentials this was based upon advances in technology and research. The literature review for both sources aimed to review both the current and future technology characteristics as well as incorporating any potential future developments in each resource; this allowed all possible technologies to be considered and gave allowed an understanding of the potential that exists with these technologies. The literature research included technical and economic factors such as grid connection and the economics/life cycle costs of the device.
Literature research was also carried out from published academic papers from various institutions such as the IET & CIBSE. From the literature it is clear that there is a lack of published papers and conference papers on either wave or tidal energy especially when compared to the off-shore wind energy sector. The design and the technology associated with both wave and tidal devices are still very much in their infancy. In addition to the papers and publications discussed above there are three very significant published works on tidal and wave generation there are:
- Electrical Design for Ocean Wave and Tidal Energy Systems by Raymond Alcorn and Dare O’Sullivan. Published by the IET.
- Integrating Wave and Tidal Current Power report published by the International Energy Agency (IEA)
- Electricity from Wave and Tide – An Introduction to Marine Energy by Paul A Lynn. Published by Wiley
These works all took a broad and but very detailed review of marine energy detailing the technologies as well as the economic, environmental and grid issues that are key factors in marine energy resource development. Much of the literature that was sourced and reviewed looked at either the available generating technologies or the initial concept stage of marine energy resource array development. There is however a lack of information and literature which is based upon documented operational experience of tidal stream commercial arrays but in particular wave energy resource arrays.
.
3 Investigation Into Ireland’s Energy Usage And Fuel Usage For Electricity Generation
3.1 PRIMARY ENERGY
Here we will review Ireland’s overall energy supply in respect of changes to the total primary energy requirement (TPER), this is the total amount of energy which is used within Ireland in any year. Figure (1) details the trend from 1990 to 2015 in Irelands energy supply this emphasises the change in the energy mix. In 2015 the primary energy mix in Ireland was 13.9 million tonnes of oil equivalent (Mtoe) [7]. This figure includes the energy required for the conversion of primary sources of energy into forms that are useful to consumers.
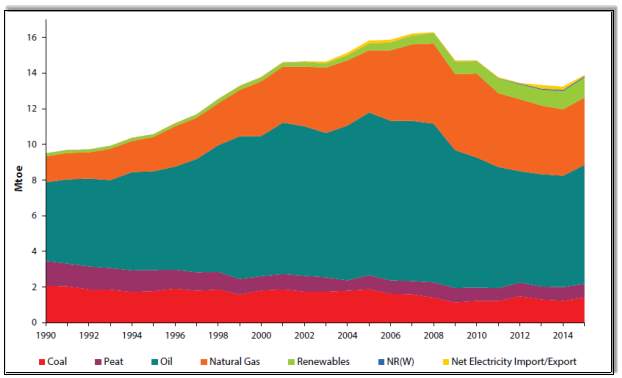
Fig (1) Total Primary Energy Requirements 1990 – 2015, [7]
From Figure (1) we can see that the primary energy requirement for Ireland increased by 4.9% when compared to 2014, there was an increase in Oil by 6.8% mainly due to growth within the transport sector while there was a 15.7% increase in coal consumption because of an increase in electricity generation [7]. There has also been an increase in the renewable energy sector between the years 1990 to 2015 as total renewable energy grew from 168 ktoe to 1,150 ktoe an increase of 586%. The figures for 2015 show a year on increase from 2014 of 12.8% in respect of the contribution of renewable energy to TPER[7].The SEAI (Sustainable Energy Authority of Ireland) document “Energy-in-Ireland-Key-Statistics-2015” detailed that between the years 2013 and 2014 Irelands dependency upon fossil fuels dropped from 89% in 2013 to 85% in 2014, this lead to a reduction in the cost of energy imports into Ireland from €6.5 billion in 2013 to €5.7 billion [8].
The size of this reduction can also be attributed towards falling oil prices and the increased use of gas imports. In 2014 the landfill gas, hydro, wind, biomass and biogas were the main components from renewable energy to electrical energy generation and accounted for 22.7% of gross electrical consumption within Ireland during 2014, this meant a reduction in CO2 emissions of 2.6 Mt and a €255 million reduction in fossil fuel imports [8]. Figure (2) shows how renewable energy contributed 1.8% of Irelands TPER between the years of 1990 to 2004 and that this figure has increased to 8.3% by 2015.
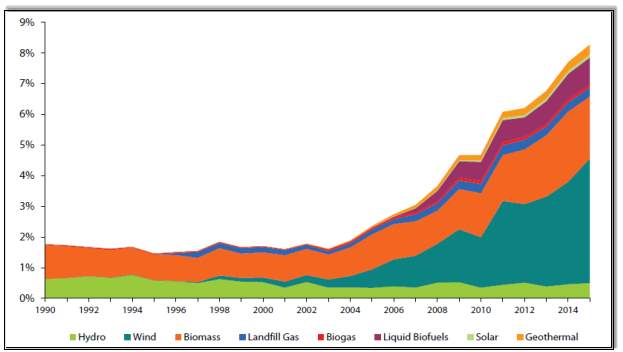
Fig (2) Renewable Energy Contribution to TPER 1990 – 2015, [7]
3.2 Fuel Inputs to Electricity Generation
In excess of one-third of the Irelands total primary energy demand comes from fuel inputs for the generation of electricity, they accounted for 4.5 Mtoe out of an overall total of 13.9Mtoe for 2015 [7]. Figure (3) details the flow of energy in electrical generation for 2015 as regards inputs and outputs in respect of the various fuel types. The left-hand side of the diagram details the share of primary energy input to electrical generation through the various fuel types while the right-hand side of the diagram details the gross electricity consumption which is generated by each of the fuel types. As the various fuel types have efficiency conversions which are dissimilar there is a difference in the shares. When combustible fuels are utilised for the generation of electricity there will be transformation losses, these losses account for 46% of the primary energy input. In recent years there has been a decrease in the fossil fuel inputs, this is due to the switch from oil to gas which is more efficient as well as the greater usage of renewable energies.
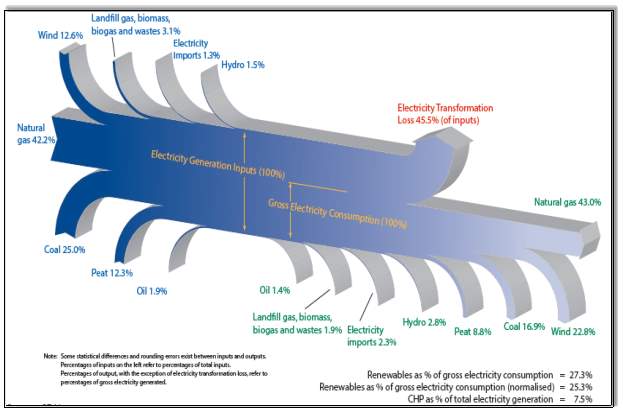
Fig (3) Flow of Energy In Electricity Generation For 2015, [7]
The SEAI, Sustainable Energy Authority of Ireland 2016 document “Energy-in-Ireland-Key-Statistics-2015” gave the following key points in respect of electricity generation during 2015 in Ireland:
- There was 4,500 ktoe of energy utilised for the generation of electricity, this was 3.1% more than in 2014 and 14% greater than in 2001
- Fuel input for electrical generation took account for 32% of the total primary energy requirement
- The use of coal for electrical generation accounted for 25% of the total electricity fuel mix while oil accounted for 1.9%
- Natural gas was the dominant fuel as regards electrical generation and accounted for 42% (1,899 ktoe) although this was a reduction of 3.7% on the previous year
- The use of renewable energy accounted for 16.7%, the largest contributor to this was wind which accounted for 12.6% of the total
- The figure for net electricity imports fell by 69% to 58 ktoe and had a share of 1.3% of the electricity generation fuel mix
3.3 Gross Final Consumption (GFC)
The gross final consumption (GFC) for electricity within Ireland from the years 1990-2015 is detailed below in Figure (4). Gas generated electricity has grown at a large rate and the gross electricity consumption has doubled during the stated period. One interesting point is that while electricity demand has increased the inputs to electricity generation has decreased this can be traced to greater efficiencies in electricity generation as well as the ever increasing use of renewable energy.
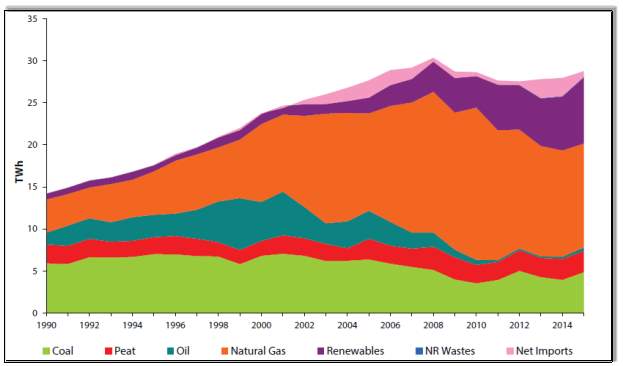
Fig (4) Gross Electricity Consumption By Fuel Source 1990-2015, [7]
The period 1990-2015 has also seen growth in the development of grid interconnections between the UK and Ireland. The 500MW (Megawatt) East-West interconnector between the Republic of Ireland and Wales became fully operational in 2013 this is in addition to the 500MW Moyle Interconnector between Northern Ireland and Scotland which since 2002 has an operating capacity of 250MW. This has also caused an increase of in-excess of 400% in the importation of electricity of in 2013 although it must be stated that this is from a very low base [7].
Despite there being many years of recession during this period the gross consumption of electricity has continued to grow. Gas generated electricity has grown at an average yearly rate of 4.7% while in contrast the generation of electricity from oil has fallen to 1.4% within the overall fuel input figure for generation of electricity. Electricity which is generated from renewable energy has seen an increase from 4.9% in 1990 to 27.3% in 2015 renewable energy and is now the second main source for the generation of electricity [7].
.
3.4 contribution of renewable electricity sources
Wind and hydro energy were the main contributors in respect of renewable electricity generation in 2015 which amounted to 25.3% of Irelands gross electrical consumption, each accounted for 21.1% and 2.5% during the year [7].Renewable waste and biomass contributed 1% towards the country’s gross electricity consumption while 0.6% came from landfill gas, biogas contributed 1% while solar contributed 0.01%, the total figurers for renewable energy are detailed in Table (1).
| % OF GROSS ELECTRICITY | YEAR |
| RENEWABLE % OF GROSS ELECTRICITY | 25.3 |
| HYDRO | 2.5 |
| WIND | 21.1 |
| BIOMASS & RENEWABLE WASTE | 1 |
| LANDFILL | 0.6 |
| BIOGAS | 0.1 |
| SOLAR | 0.01 |
Table 1: Renewable Energy Contributors To Electrical Generation 2015; Source SEAI
3.5 tidal energy potential
In respect of tidal energy the accessible tidal resource within Ireland is determined as regards site availability and suitability as well as tidal stream speeds, appropriate depth and commercial constraints. As part of the published 2014 document “Irelands Offshore Renewable Energy Development Plan” (OREDP) detailed that there is the potential for between 1,500MW to 3,000MW of tidal energy generation potential development without any environment consequences. In 2006 “Openhydro” an Irish owned company were the first to install a tidal energy generating device of the coast of Scotland; they have also installed two 2MW grid connected turbines which formed part of the Paimpol-Brehat array in France in 2016. They have also developed a 100MW development of Toor Head, County Antrim, there is also a proposal from another Irish company “DP Energy” to develop a 100MW tidal resource development near Fair Head, County Antrim.
3.6 WAVE energy potential
The OREDP has detailed that there is the potential for 17,500MW of wave energy resource development within Irish waters with no adverse effects upon the environment. The key to the success is the investment in the enhancement and development of the demonstration and test facilities which research renewable energy offshore development. There are test facilities in Ringaskiddy, County Cork which has the LIR National Ocean Test Facility, the quarter of a mile test site in Galway Bay and the Atlantic Marine Energy Test Site which is located off the Bellmullet coast, County Mayo. At present there are no wave energy commercial arrays, however as the technologies improve it is expected that both tidal and wave energy will be ever increasing contributors to Irelands electrical energy generation capabilities.
3.7 RENEWABLE ENERGY TARGETS & EMISSIONS REDUCTION
Ireland is required to meet two mandatory EU Renewable Energy Directives by 2020 which are:
- A minimum of 16% of gross final energy consumption is to come from renewable sources
- A minimum of 10% of energy consumed for transport is to come from renewable sources
In addition to these Ireland has also set itself national targets for heat and electricity to be achieved by 2020, these are:
- RES-E 40% of gross electrical consumption to come from renewable sources
- RES-H 12% of thermal energy to come from renewable sources
As of 2015 the renewable energy overall contribution to the final gross energy consumption was at 9.1% while the share of renewable energy electrical generation was at 25.3%, both figurer’s are only a little over half-way towards meeting their targets. The changing fuel mix and generating technologies in recent times have caused changes in the CO2 emission per kWh, over recent years the share of high carbon fuels such as oil and coal has been reducing while there has been a rise in the use of lower carbon fuels, it should also be noted that imported fuels are not excluded from the reporting of national greenhouse gas emissions under IPCC and EU legal reporting obligations. Since 1990 there has been a drop of 49% in the carbon intensity of electricity from 896g CO2/kWh to 456g CO2/kWh in 2014, this figure did however increase in 2015 to 467.5g CO2/kWh caused mainly by the increased use of coal for the generation of electricity [7].
4 Investigation And Analyse The Current Technologies And Future Developments In Marine Energy Generation
4.1 industry development
The development of electrical generation through MCEDs is to date still very much in its early days with only a small number of trial devices being installed and connected to the electrical network [9]. There are also many major challenges which need to be overcome in particular the reliability, robustness as well as trying to reduce both cost and risk. This is shown through the apportioning of EU (European Union) research themes with 68% of these funds being apportioned to technology development as detailed in (Figure 5).
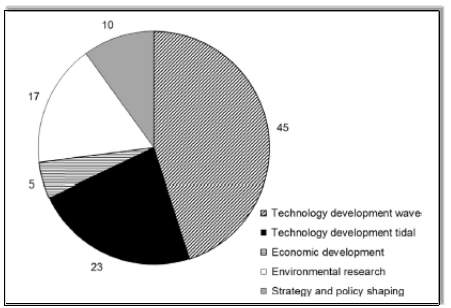
Figure (5) The Research Themes Funded By The EU IN 2011, [10]
To fully realise the potential of marine energy generation especially in the short term greater research and innovation is required together with the breaking down of technical barriers. Special attention is required in the following areas :
- Reliability Demonstration
- Sub-System Development and Optimisation
- Pre-Commercial Sea Array Trials
- Advancement In Technology
- Maintenance Systems Which are Predictive
- Electrical Array Systems
At present only a small selection of tidal devices have proven extensive operational records, this however has been achieved by utilisation already proven technology and know-how from the wind industry [11]. With wave energy the technology is still unproven and requires much greater R&D, prototype testing, innovation and demonstrations, in order to achieve the required levels of reliability. A key aspect of wave energy generation relates to maintainability of the devices in very harsh environments. At present wave energy generation devices are being designed to operate in high resource environments with strong wave conditions of (>50kW/m) but testing of prototypes has only taken place within mild resource environments, it is therefore essential that designs and materials utilised offer long-term survivability [12]. At present tidal energy generation devices are the most commercially viable when compared to wave energy generating devices this is due to the following:
- Greater Design Cohesion With The Industry
- More Advanced Component Convergence
- A More Engaged Supply Chain
- More Robust & Extensive Prototype Demonstrations
- Greater Reliability & Maintainability Proven Through Extensive Testing & Operational Hours
4.2 key factors for marine industry development
Various factors need to come together in-order to establish a fully coherent strategy for marine technology is developed this will also require support from governments, these are as follows:
- Capital support to support the growth of mutli-device arrays and systems this will also need revenue support from the generated electricity
- The provision for grid access in a timely manner and at an economical cost to the coastal areas which have high marine energy resources
- The proper planning and procedures to ascertain and record the environmental impacts of marine energy resource devices
There a degree of optimism within the industry as regards the time and efforts that is needed to have these conditions implemented but there is still a lack of engagement from many governments and this has impeded the progress of renewable energy especially within the marine energy sector. Countries progress in terms of assessing the contribution of renewable energy is expressed in terms of the cumulative installed capacity (CIC) which is measured in megawatts and is equal to the total rated power of all its wave and tidal devices.
The United Kingdom (UK) was for example expected to be generating 50MW by 2015 however this is tiny when compared to the nations average electrical generation of 50GW (Gigawatt). In order to make a significant dent in this it would require 1 GW of CIC, which can be met by one thousand 1MW machines. In order for this to be achieved the trade association “Renewables UK”hasgiven a deadline of 2020 for this to be achieved [13]. The UK’s “Carbon Trust” has predicted that by the year 2050 electricity generation of 20GW from wave devices and 8GW from tidal devices will be achieved, they also gave predictions for global capacity to be at 189GW for wave devices and 50GW for tidal devices [14]. It is still however unclear how during the coming years the installation and manufacturing of both tidal and wave energy resource devices will continue to advance especially among the countries of Western Europe the USA and Canada. Again looking at the UK as a barometer for Ireland we can observe from Figure (6) the two possible situations for the growth of CIC in the UK for both wave and tidal energy generation. It’s expected that both technologies will make an equal contribution although it has been suggested that due to the special engineering challenges associated with wave devices that tidal technology will go move ahead of wave technology.
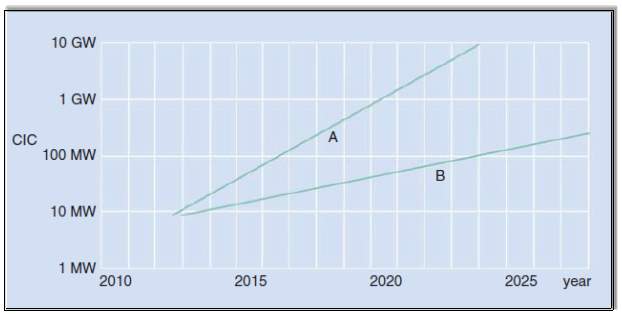
Figure (6) Potential Growth of Cumulative Capacity CIC In The UK, [13]
From the graph we can see the curve “A” matches the predictions from “Renewable UK” with 1GW being achieved by 2020 and this rising rapidly towards 10GW and beyond. Curve “B” is more conservative in its outlook it assumes a doubling of CIC every three years with 1GW being achieved during the early 2030’s. It should be noted that both curves are in fact straight lines on a logarithmic log which implies exponential growth. This is not usual for an industry which is considered new and vibrant but will tail off as the market penetration increases. It is however likely that the industry will continue to grow, however the amount that it grows will depend upon the development and advancement of the marine energy resource devices. There is also the associated technology developments which are integral factors needed to safeguard these large arrays as well as ensuring they are not only viable technically but also meet the stringent economic and environmental requirements.
4.3 theory behind tidal energy
The main influences upon the ocean tides are the gravitational attractions of both the sun and the moon. The water on a seashore will rise twice every 24 hours, 50 minutes and 28 seconds, this is the moons apparent period of rotation around the earth, this results in tides which are referred to as semi-diurnal, areas which have only one low and one high tide in day are known as diurnal. The high and low points that are reached by the tide are known as high water and low water, the vertical difference between them is referred to as the tidal range. The tidal range will vary over the course of a month according to the position of the earth, moon and sun. From Figure (7) we can observe that when there is a new or full moon (when the sun and moon are inline) the gravitational attraction is at its greatest and so the tidal range is at its greatest, this is called the “spring tide” a “neap tide” occurs when thesun and moon are at right angles, the moon is in its first or second quarter and the resulting tidal range is at a minimum.
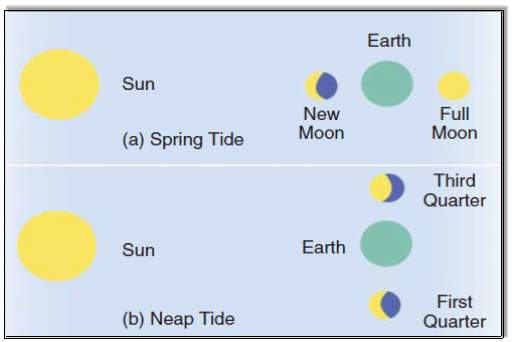
Figure (7) Relative Positions of Moon, Sun & Earth Giving Rise To Spring & Neap Tides, [12]
As the moons orbit around the earth is more elliptical than circular and the earth is not at the centre of the ellipse there is a time during each month when the moon is nearest the earth, this is referred to as “perigee” and a time when its furthest away which is called “apogee”. There are a few locations where this is the major effect upon tidal ranges and the resulting tidal ranges are called “anomalistic”. There is also the “declinational” effect upon tidal ranges where the moons declination (the angular offset to the earth’s equatorial plane) makes two tides a day unequal in range. The focus of this paper is on tidal streams that are the oscillating horizontal currents that accompany the rise and fall of the tides [15]. Tidal stream technology capturers the moving waters kinetic energy while tidal barrages ustilise the potential energy from stored water. The global tide stream resource is 2-3TW (Terawatt), of this only about 3% is suitable for the generation of electricity, it is however unevenly distributed. Tidal streams may be predictable but they are however not constant, a stream is made up of a flow phase as the tide rises this alternates with an ebb phase as it falls, to achieve good electrical generation high peak velocities are required in both phases, an efficient device is bi-directional that is it will generate electricity on both ebb and flow. The flow magnitudes will vary during the lunar cycle and normally peaks a few days after a new or full moon, it will also increase further at the time of the equinoxes in May and September.
Propagation of tidal waves comes from the tide generation forces which generate strong tidal currents in shelf sea regions. Regions such as these are suitable for electrical generation when they are intercepted by arrays of tidal energy convertors. However the phase of any electrical generation can vary between the shelf sea regions considerably. As per Figure (8), the gravitational attraction between the Earth, moon and Sun produces gravitational attraction and tide generation from the moon is caused by an imbalance between forces which are acting upon a particle caused by the gravitational attraction of the moon as well as the centrifugal force caused by the Earth rotating about the centre of gravity of the Earth-moon system [16].

Fig (8) Gravitational & Centrifugal Force Between Earth & Moon [17]
Only at the centre of the Earth is the balance of these forces exactly the same at all other points on the surface of the Earth these small force imbalances result in tide generating forces. There is also a similar force excreted by the Sun, the Sun has a magnitude of approximately 50% of the moons force and these forces when working in tandem acts upon the waters of the Earth’s oceans to drive the tides. Due to the smaller distance between the Earth and the Moon the gravitational force which is exerted on the earth by the moon is 2.17 times greater than that of the force which is exerted by the Sun [18]. For example when a larger bulge of water is created on the side of the Earth nearest the moon at the same time a bulge of water is created on the earths side furthest away from the moon these two forces create a bulge of water around the earth. The period of the tides varies according to the solar and lunar gravitational effects as well as other various geographical peculiarities. From Figure (9) the distribution of M2 current speeds over the north-west European seas can be seen, in the blue circles. The Earth rotates on it axis every 24 hours and a lunar cycle is 29.5 days (new moon to new moon also referred to as Synodic month or lunation). From Figure (10) “M2” is the principal lunar semi-diurnal constituent and has a period of approximately 12h 25.2 min.
Time on Earth is measured relative to the Earth’s rotation the principal solar semi-diurnal “S2” and has an exact period of 12 hours. Tidal signal are considerably distorted due to interactions with continents and in particular the tidal signal over the north-west shelf sea is dominated by the “S2” and “M2” constituents while their superposition explains the semi-diurnal (twice daily) and spring-neap (fortnightly) modulation of the tides. Typically a wave which is generated in the deep ocean propagates onto the shelf seas; the wave interacts with topographic and bathymetric features and together with the effects of “Coriolis” results in a complex tidal signal over the shelf seas. Very strong tidal currents in many regions are caused by the pressure gradient through phase differences within the vertical tide.
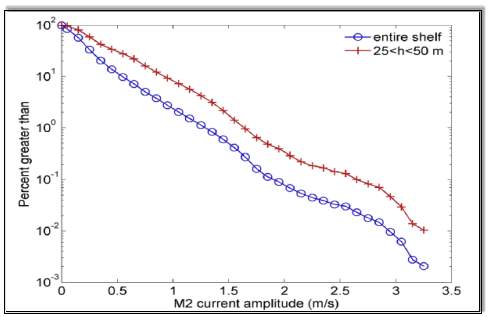
Fig (9) Cumulative Distribution of M2 Current Speed Over NW European Shelf Seas, [19]
The NW European shelf contains a considerable amount of sea-space and is a key area in the development of tidal energy generation. For water depths of between 25-50m the depths of water suitable for first generation devices the distribution follows the red line from Figure (10). The vast majority of the shelf seas and the theoretical tidal energy resource from the “M2” constituent alone are in currents which a <1m/s (meter per second) when it is constrained by water depths in the range 25 < h < 50m. Thus sea space within higher tidal stream sites is limited and this will cause the necessity to investigate deeper water and lower tidal stream sites. High tides also known as spring tides occur when the sun and the moon are in line either pulling on the same side or opposite side (full or new moons). Neap tides occur when the moon and the sun are orthogonal with their gravitational forces pulling the water in different directions which causes the bulges to cancel each other out. Maximum power is generated during spring tides meanwhile minimum power is generated during neap tide. The gravitational force that mutually attracts any two particular bodies is directly proportional to the product of their masses and is inversely proportional to the square distance that separates the masses. The force which is exerted by the moon or sun on a molecule of water can be derived from the following:
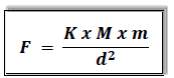
Where:
F: Force Attraction
K: Universal Constant of Gravitation
M: Mass of the Sun or Moon
m: Mass of a Molecule of Water
d: The Distance from the Sum/Moon to a Water Molecule
There are three specific tidal phenomena at different locations around the earth and these are detailed in Figure (10), as can be seen the tides around Western Europe and in particular Ireland is the “Semidiurnal Tide” type.
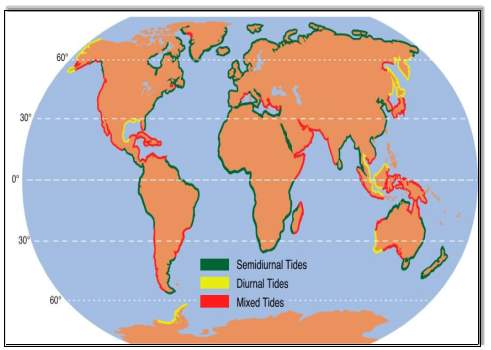
Fig (10) Type of Tides Around The World
Semidiurnal Tides With Monthly Variation:
This particular tide has a period of 12hr 25m, this is because of the Earth’s rotation relative to the sun and the moon and occurs twice every 24h 50m & 28secs [20]. Here the landmass is exposed to two low-tides and two high-tides during each period of rotation, the amplitude of waves will always vary according to the particular lunar month. As discussed above when there is a full or half-moon there are higher tidal ranges with neap tides occurring during the half-moon period due to the gravitational pull being at a minimum. Figure (11) details how one tide has a greater range than the other with a higher “high” and a lower “low” this results in a greater tidal flow when water is coming in and leaving during the period between the high and low tides. From Figure (12) we can observe how the tidal output troughs and peaks four times a day as the tide comes in and out twice on a daily basis.

Fig (11) Semidiurnal Tide
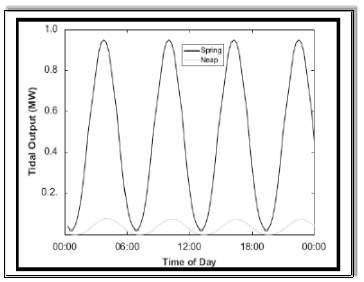
Fig (12) Power Output During Spring & Neap Tide
Diurnal Tides With Monthly Variation:
This particular tide occurs mainly is South East Asia, the tidal period is 24h 50mins & 28secs a full revolution of the moon around the earth. As the Earth rotates a specific point of the Earth’s surface will pass through various parts of the equilibrium tide envelope and will thus experience a diurnal variation in the tide levels. A particular area will have a diurnal cycle when it experiences a low and a high tide in any particular lunar day, this particular tide cycle is very common the Gulf of Mexico.
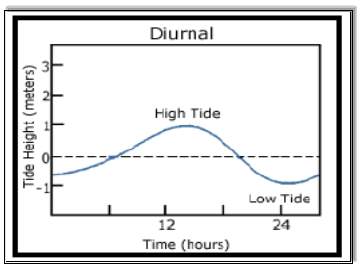
Fig (13) Diurnal Tide
Mixed Tides:
This tide is a combination of the characteristics of a semidiurnal and diurnal tide. An area has a mixed tide if it has two low tides and two high tides of various sizes during a lunar day, they also have the ability to have bi-monthly and monthly variations. They are generally found in Asia and in the Mediterranean Sea.
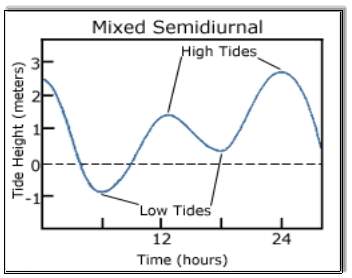
Fig (14) Mixed Tide
There are many periodic phenomena which effect tidal behaviour; the ones detailed below are having the greatest impact.
- The “Saros” period of 223 synodic periods which is the same as 18 years and 10 days is the time that the Earth, Sun and Moon require in order to return to their same relative positions
- Between March and September there is a half year cycle of 178 days between the highest spring tides due to the moons orbit inclination
- There is a 14 day cycle caused by the interaction of the gravitational field between the sun and the moon. Due to the moons elliptical orbit the cycle is modified slightly and as a result successive spring neap tides can vary in amplitude by 15%
4.4 energy CONVERSION OF TIDAL ENERGY
To be effective tidal stream devices must generate electricity in both a reliable and efficient manner; there are however issues which have to be overcome for this to be achieved, they are as follows;
- On both ebb and flood tides complex flow patterns which can accelerate from rest to velocities in excess of 3m/s
- Energy levels that can vary over a lunar cycle usually peak at spring tides and even further during the March and September equinoxes
- Turbulence which causes short-term fluctuations
Energy from tides can be obtained from potential energy which is obtained from vertical movements of water associated with the fall and rise of tides and from kinetic energy which comes from horizontal water movements usually known as tidal currents. Tidal current turbines extract kinetic energy via the movement of unconstrained tidal streams which generate electricity. Currents can be predictable as they have the same periodicity as vertical oscillations; they do however tend to follow an elliptical path. The ideal kinetic energy can be found from the following formula:
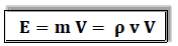
Where:
ρ: Is The seawater density (approx. 1022 kg/m³)
v: Is the Volume of Water
m: The Mass of Water
Tidal devices utilise the kinetic energy obtained from the water flow in the tidal cycle, this is proportional to the cube of the stream velocity and the cross-sectional area of the device, thus if the velocity is doubled the power will increase by a factor of 8. Making assumptions such as the tidal cycle being sinusoidal and the neap spring variation also being sinusoidal the mean power level in a cross flow is obtained from the flowing equation:
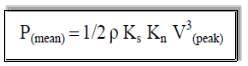
Where:
V(peak): Maximum Spring Tide Velocity
Ks: Velocity Shape Factor
Kn: Neap Spring Factor (neap 60% of Spring) = 0.57
r: Density Of Water (t/m³)
Vpeak is a depth averaged velocity and gives and accurate velocity value throughout the water column. However as can be observed from “Betz Limit” which states that the maximum theoretical power coefficient for any turbine assuming the rotor has no velocity component in the wave and is frictionless will be 0.59. However as there is the presence of the seabed and the surface there is an upper and lower boundary which can cause an increase in the maximum theoretical power coefficient if the turbine occupies a larger portion of the flow channel [21].
Throughout the column of water there is a variation on the profile of the velocity, a 1/7 power law is used in order to determine the velocity profile which is zero at the sea bed and a maximum at the surface. Tidal current energy extracts energy in a much the same as wind energy is extracted from the air, there is however fundamental differences in their respective operating conditions, due to water having a far higher density than air with also the power intensity being much larger than that of air streams. This therefore allows for water turbines to be much smaller than an equivalent wind turbine.
4.5 developments in tidal energy
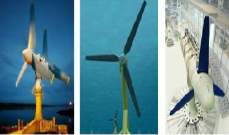
The design of TEC’s (Tidal Energy Convertors) has evolved over the past number of years, the first generation of devices were designed for bottom mounted installations, second generation devices such as floating TEC’s exploited the very powerful mid/high water column resources with now third generation devices exploiting the additional tidal resources that are within the water column for example Archimedes screw or tidal kite. Figure (15) from The JRC (Joint Research Centre) classifies TEC’s as follows in:
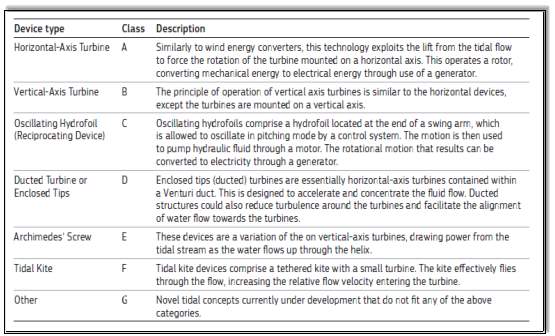
Fig (15) Classification of Tec’s, [22]
Horizontal-axis turbines (HAT) are the most common form of tidal energy design, they account for 76% of the world-wide R&D (Research & Development) which is undertaken in the research of tidal devices. The development of HAT devices in open water testing has been both intensive and sustained and is an indication of the high degree of technical readiness of the devices. At present the EU accounts for 50% of the existing tidal developments, there is also however increasing development in Australia, Canada and the USA while development has also been increasing in East Asia. France and the UK lead the way as regards sites under construction; the UK has leased twenty-six zones for tidal development with France currently having five sites under construction. The Netherlands has recently announced a series of small arrays for construction on dykes. In is anticipated that by 2018 Europe will have a tidal installed capacity of 57 MW [23].
In 2018 construction on a new 100MW tidal energy plant near Ballycastle on the North Antrim coast is planned, the project is worth in excess of £400 million and is a joint operation with “DP Energy” (a Cork based company) and Bluepower NV (a company founded by “DEME Blue Energy and Nuhma”, both Belgian companies). It is anticipated that the project when fully complete will generate 100MW of electricity.
The “Fairhead” project is a venture between and “Brookfield Renewable Energy Group” and “Openhydro”, it’s anticipated that the project will comprise of between 50 -100 tidal turbines. There are also currently two major developments in France by “EDF” located in Paimpol-Bréhat and the installation of seven turbines as part of the “Normandie Hydro Project”. “Openhydro” as also associated with “Alderney Renewable Energy” in respect of a 300MW tidal development in the waters around Alderney. The project which is called “Race Tidal Ltd” will be located fifty five miles for the English coast and eight miles from France. The development is not expected to begin generating until 2020 and will connect the planned FABLink interconnector between the UK, Alderney and France. The 398MW “Meygen” tidal stream project at Inner Sound in the Pentland Firth, Scotland is Europe’s largest tidal steam project construction began in 2015 of four 1.5MW turbines. The configuration is made up of three “Andritz Hammerfest Hydro HS1500 turbines” and one “AR1500 machine designed by Lockheed Martin”. The next phase will comprise of “Next-generation Seagen U tidal turbines”, the full 398MW project is due for completion in 2020.
Canada is also a major player in tidal stream generation with several companies conducting research in the Bay of Fundy between New Brunswick and Nova Scotia which is regarded as the best location for tidal energy generation in North America and could potentially produce in excess of 30,000MW of energy. The 300MW “Cape Sharp Tidal” project between “Openhydro” and “Emera” in Nova Scotia as well as a 4MW tidal array in the Bay of Fundy is also under development. With tidal turbines the maximum power generated is only achieved for a few days per month during the spring tide. If a turbine was installed to match its full energy generation during spring tide its load factor would typically be in the region of 18%, this has encouraged developers to install turbines which are rated at a lower level than the maximum power which is potentially available at a particular site. This is known to as (EDR) “Electrical Down Rating” and is detailed in Figure (16).
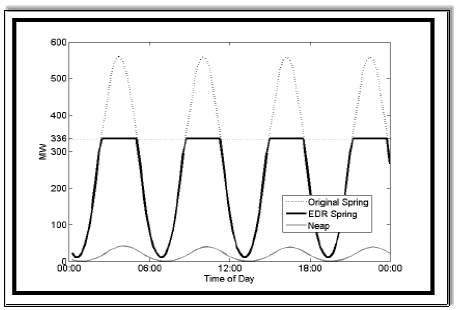
Fig (16) Tidal Power Over The Spring-Neap Cycle, [24]
4.6 current & future tidal energy technology
| DEVICE TYPE | DESCRIPTION |
 |
OSCILLATING HYDROFOILS:With the Pulse Tidal generator the vertically oscillating movement of a horizontal blade is utilised. This device is suitable for shallow waters as the swept area is rectangular rather than circular. Hydraulic pressure transmits power to a gearbox and a generator which are housed above the waterline in a steel nacelle. Devices similar to this technology have been previously developed most notably by the “IHC Engineering Business” but development was ceased in 2003. |
 |
CROSS-AXIS TURBINE: These devices have either a horizontal or vertical axis, the vertical axis has an advantage as the output of the turbine is not influenced by the flow direction of water. Maintenance can also be simplified by locating the main drivetrain above the water. A floating vertically-axed turbine has been developed by “Ponte di Archimede International Company” called the “Kobald”. With this device the three bladed turbine is fully submerged under a floating platform which has the rest of the powertrain. The turbine shaft is connected to a gear which in turn is connected to a brushless synchronous machine. |
 |
PROTEUS GENERATOR: This device was developed by “Neptune Renewable Energy”; this device has a vertical axis which is referred to as the “Proteus” The water speed is accelerated by a Venturi Duct towards a cross flow rotor which has a vertical axis. The turbine is connected to a DC (Direct Current) generator by a gearbox and the power is supplied through cables to the shore. This device is best suited to shallow waters and estuarine locations. |
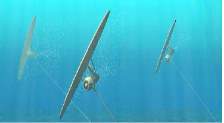 |
KITE: With this device the turbine is attached to a wing and moves in loops through the water while being attached to the seabed via a wire. An advantage of this device is that it has a lower torque per power and thus associated weight and cost as it moves through the water at a speed that is higher than the water speed. Studies have shown that a 1m (meter) turbine is capable of generating 500kW (kilo-watt) as opposed to a fixed turbine with the same capacity being 30m in diameter . |
|
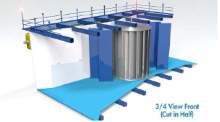
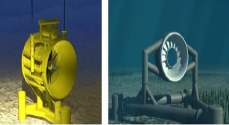
ENCLOSED TIPS (VENTURI): At the present there are several ducted turbines which are being developed; The Lunar Energy’s Rotech Tidal Turbine detailed in fig (a) has a symmetrical venture duct which causes the water speed to accelerate through the duct as well as aligning the current. The devices in fig (b & c) both have an open centre with the rim of the duct containing a permanent magnet synchronous generator which consists of gearless solutions. All three devices have bi-directional symmetrical turbines. |
| DEVICE TYPE | DESCRIPTION |
|
SINGLE SEABED-MOUNTED: The seabed-mounted turbines are often referred to as the first generation devices and they are generally only suitable for shallow waters. For deeper waters, floating devices ae more suited as this is because the water speed is at its fastest closest to the surface. One example of this is the “Atlantis Resources Corporation’s AR-1000 turbine” fig (a). This device has three blades and also has a gearbox, permanent magnet generator and a variable speed drive. As the tide changed the rotating mechanism within the turbine turns with each tidal change as required. |
(c) |
MULTIPLE SEABED-MOUNTED: Here two two-bladed turbines are mounted on a crossbeam ona surface piercing structure. This device also has the ability to raise the turbines above the water surface for repairs and maintenance. The turbine is pitch-controlled and the mechanical energy is transferred to an asynchronous generator via a gearbox , the device is developed by “Marine Current Turbines” and is the “SeaGen S” device. “Tidal Energy Ltd” have also developed a device which as several turbines, this three bladed device is mounted on a triangular frame with the hub of each turbine having the ability to rotate. It is connected to an induction motor through an epicyclic gearbox fig. 9(b) There is also a proto-type under development with the same power-train which can be used in deeper locations fig. 9(c), this is Marine Current Turbines”, “SeaGen U” device. |
(a) (b) 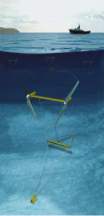 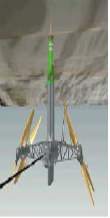 |
FLOATING: These devices are best suited to deep water applications and are commonly referred to as second generation devices. They can either be fully or partly submerged and they do not require a yaw mechanism and the tide pulls the turbine into its required correct position. They also offer the advantage of offering greater accessibility which leads to reduced maintenance and operation costs. “SMD Hydrovision Tide1” fig (a) is a device which is naturally buyout; it consists of two two-bladed turbines within a rigid structure, development on this device has at present ceased. “Hydra Tidal Energy Technology” have developed a device with four adjustable rotors and eight blades, this is called the “Morild II” fig (b).The device floats and two of the turbines rotate in the opposite direction to the other two rotors and the blades are pitched for bi-directional use. The turbines have a variable speed while the generators run at a constant speed. There is hydraulic transmission from the rotating turbine to the two synchronous generators. |
The growing trend within the industry do develop and advance different options as regards the drive train, manufacturers are seeking to avoid issues and to minimise the risks by utilising induction generators rather than porotype generators. There is a growing trend for powertrains to have integral gearboxes so minimise both the weight and size of the generator; this is very much seen in the development of floating turbines. PM generators are the preferred type for direct drive systems particular for enclosed tip-type turbines.
4.7 theory behind wave energy
Waves are a by-product of wind which in itself is a solar energy by-product. Wind creates a movement within the upper layer of water in the sea this then gives an undulating form to the surface. The undulations are very small at first they do however increase in size as the wind blows and as waves merge to form larger waves and this causes an exchange of energy. Once the wavelength is in excess of the depth of the water they propagate as gravity waves with an associated low loss of energy. Waves are formed in the open sea and as they approach the coast the energy they possess is dissipated in shallower waters. Energy which is transported by waves is the sum combination of equal parts of the potential energy which is linked to the deformation of the fluid environment around its position on the surface plane and the kinetic energy which is associated to the velocity field of the particles within the water, it is therefore mechanical energy.
Waves can be characterised by several different characteristics, these being:
- Wave Height (H), which is the distance between the wave crest and the wave trough
- Amplitude (a), is half the wave height
- Wave Period (T), required time for two successive waves troughs/crests to pass through a specific wave point
- Wavelength (λ), this is the horizontal distance between success troughs/crests
These are standard wave characteristics however in recent times H1/3 and T1/3 are now being utilised in the calculations of energy from waves. They represent the average value of the highest 1/3 of reported wave periods and their associated heights. All this is relevant as much of the historical data of wave information is based on observations from lighthouse keepers, members of the public and sailors rather than measurements from scientific equipment. Wave classification has three specific classifications that being shallow, medium and deep-water, these groupings are important as on average there is 10% more energy in a deep water wave than a shallow water wave.
A wave is a deep water wave if the respective wavelength is at a minimum double the depth of the water in which the wave is travelling. When a wave is in shallower water the wave will run along the ocean floor which causes it to loose potential energy from the associated frictional effects and becomes increasingly difficult to model. The wave climate also referred to as “sea state” at a coastal location is made up of two types of ocean wave:
- Swell: These are waves which have travelled a long distance with little energy loss and are generated from winds which are some distance from the coast location
- Wind Wave: These are generated from local winds close to the coastal location
The generation of energy from waves is based on the “Airy Wave Theory”which was developed by George Biddell Airy in the 19th Century, there are various equations which are used in order to describe the energy which is contained within a wave front, there are also different equations which are used for devices which are located within shallow waters, deep waters and intermediate waters. We define intermediate water as water where the depth is less than one half of the wavelength and greater than one twentieth of the particular wavelength of the wave front in question. Deep water is described as waters in which the depth is greater than one half of the particular wavelength of the wave front in question.
A regular wave can be represented through a sinusoidal shape with period, wavelength and height, a regular ocean wave characteristics is detailed in Figure (17). Ocean waves which are regular and sinusoidal are not frequent and can only really be created within a controlled environment. Within real life environments there is always a combination of waves with various periods, directions and heights.
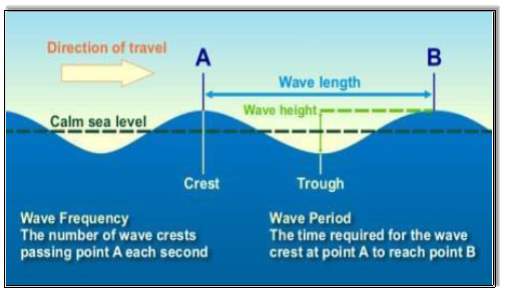
Fig (17) Characteristics of a Regular Wave [25]
4.8 energy CONVERSION OF WAVE ENERGY
The “Airy Wave Theory” has two primary variables and a number of constants, the particular constants are gravity (g), density of water (ρ) and the depth of the water (d), while the main variables are wave period (Te) and the significant wave height (Hs), the ocean surface wave energy equations for Airy Wave Theory are detailed in Figure (18).
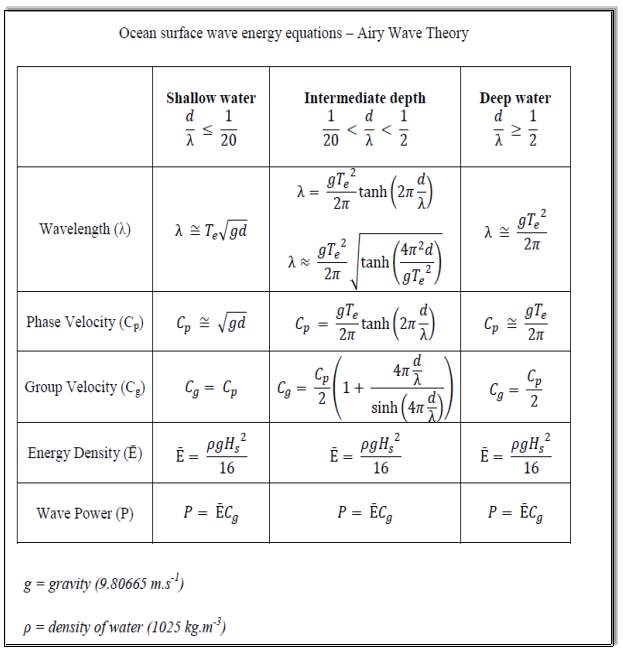
Fig (18) Ocean Surface Wave Energy Equations
The wave period is the time in seconds between two successive wave crests which reach a particular point in space, while the significant wave height is defined as the height if the top one third of wave heights in any given period of time and is given in meters, see Fig (19).
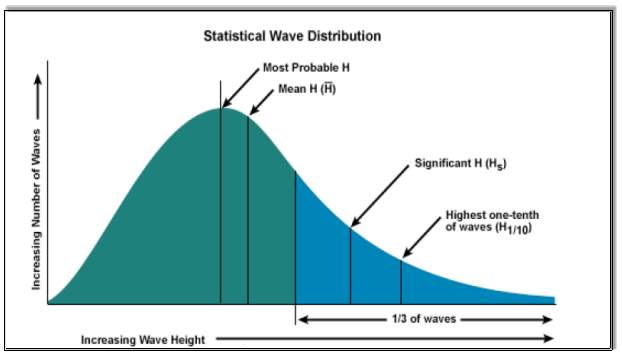
Fig (19) Statistical Wave Distribution [26]
We can define wave power as the flow of energy through a vertical surface which is perpendicular to the propagation direction. It is therefore usually expressed in W/m², this is however not its standard usage and it is preferred to quantify wave power in W/ m-¹ which is the watts per meter of wave front, this is vertically integrating the power per surface from the bottom of the sea to its surface as the kinematic flow at depth is known if the corresponding value at the surface is known. For infinite depth 95% of the energy within the wave is contained in a depth that is equal to half its wavelength. Wavelength is typically between 60m to 160m.
Typically any proposed site to be utilised for generation of electricity through wave energy generation needs to have an energy generation capacity that is in-excess of 15 kW/m, the western European seaboard along with the western seaboards of north and South America together with Australia and New Zealand are regarded as being prime areas for wave energy generation [27]. There are many challenges which need to be overcome to not only increase the performance of wave energy convertors but also to make it commercially viable. One major challenge is in the conversion of the slow, random and normally high-force oscillatory motion into a useful force that is capable of producing an output that will be acceptable to the respective utility network providers.
Waves not only vary in period and height but also in force, the gross average power levels can be predicated while the variable input has to be converted into a consistent electrical output and this therefore requires an energy storage system. Wave direction can also be highly variable so for the wave from which the energy has to be captured the wave devices are required to be aligned on compliant moorings. Waves which are closer to the shore due to natural occurrence of refraction and reflection are more predictable.
In order to capture the irregular motion of waves the overall design of the generating devices is effected, in order to operate as efficiently as possible the devices for every specific location must be rated for the most common power levels of that area. Around Ireland the most common offshore waves are typically in the region of 30-70 kW/m [28]. However consideration must also be given to the extreme conditions which the devices will encounter that can rare cases exceed 200 kW/m. This not only causes structural issues but also issues with revenue as the main bulk of the energy generated from these devices will be under the occur during the most commonly occurring waves but the construction cost of the device will of course be that its can withstand these extreme conditions.
A WEC must have an absorber which is can be either of the following, float, flap or oscillating column, the absorber will convert the potential and kinetic energy into the required from of energy. The WEC will also have a power take off (PTO); these can be pneumatic systems, direct electrical energy or a hydraulic system. Electrical energy generated is then connected to the network grid via network grid infrastructure such as offshore, onshore and transmission infrastructure which will connect to the grid, the steps in the conversion of wave energy is detailed below in figure [20].
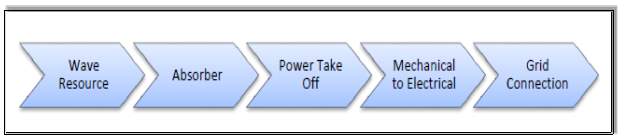
Fig (20) Steps In Eave Energy Conversion
Wave energy conversion requires a structure that is mechanically efficient and is capable of both absorbing and converting wave energy at an economical cost. There is also the extreme environment that the device must operate in not only from the force of the seas but also as regards salinity and temperature. WEC’s are capable of absorbing energy in surge, pitch and heave but advanced devices can also absorb energy from roll, yaw and sway.
4.9 developments in wave energy
Wave energy convertors are developed in-order to extract energy from shallow near shore waters as well as out to the deep waters far off-shore, this is shown in Figure (20).
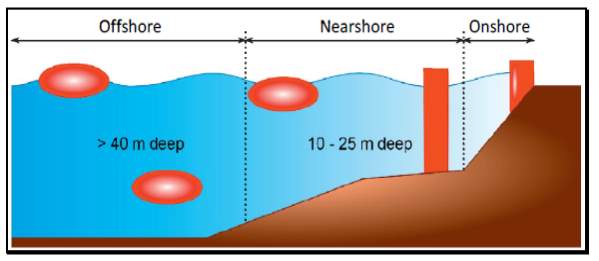
Fig (20) Wave Energy Convertor Locations
Currently there are many versions of WEC projects in respect of locations, designs and concepts. Wave energy convertors can be characterised based upon the following criteria; where they are designed to function, the water depth of the location and the location itself. It has been established that both the potential and kinetic energy of a wave can be harnessed so based on how energy is absorbed wave energy convertors can be put into three main groups, these being:
- Overtopping Devices
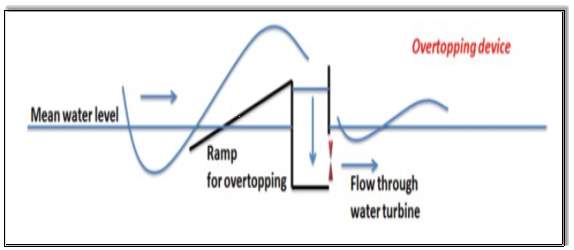
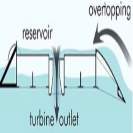
Overtopping devices capturer the sea water from an incident wave within a reservoir which is located above sea level, the water is then returned to the sea via turbines. The Wave Dragon would be an example of such a device, this device utilises a pair of large reflectors which are curved in order to gather the waves into a central receiving part. The water then flows over the top via a ramp into the raised reservoir. From here the water returns to the sea through a number of low-head turbines.
- Oscillating Water Columns (OWCs)
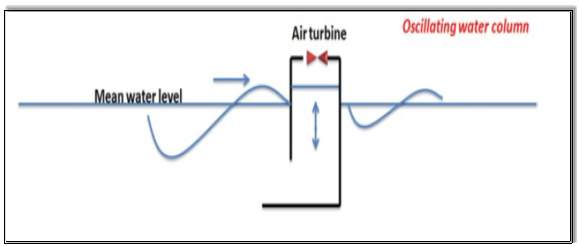
This type of device has a chamber which has an opening to the sea which is beneath the waterline. Waves which then approach the device are forced into the chamber which applies pressure on the air within the chamber. Air is then drawn through the turbine as the water retreats. Low pressure well turbines are often used for this particular application as they rotate in the same direction no matter what the flow direction is, this therefore removes the need to rectify the airflow.
- Wave-Activated Bodies
This type of device has small dimensions when compared to the incident wavelength. They can either be a submerged structure located beneath the water surface which relies on the pressure differential or a structure that floats upon the surface of the water and heaves up and down. Due to their small size the direction of the wave is not critical. In order to generate electricity WEC’s are required to be moored by cables and anchored to the seabed as per Figure (21). The WEC mooring system comprises of three main parts; the anchor, connectors and the mooring line. The main requirements for a WEC mooring system are that it can withstand the very harsh environment it is in as well as other loadings which are involved to keep the device secure. The moorings are subject to very cyclic nonlinear load conditions which are induced by incident waves. There are two main categories for WEC mooring conditions these being single point mooring and spread mooring. Single point mooring allows the WEC to be weather-vane while a spread mooring will restrict the WEC motion along the horizontal and not allow it to weather-vane, this type is appropriate for non-directional energy convertors.
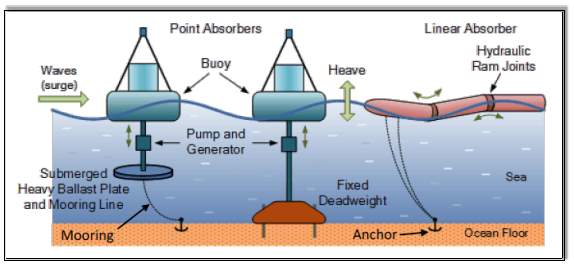
Fig (21) Wave Energy Convertors Mooring & Anchor
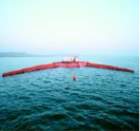
The wave energy resource which is available to both Ireland and the UK is significant; this is especially the case with the UK where in 2010 the “Crown Estate” leased upto 600MW of wave energy projects and 1000MW of tidal energy projects [29]. There is the opportunity to develop projects when the technology has not only matured but also reached a level where it is considered economic. Countries in Europe have been developing wave energy technology for the past twenty years. In France the “SEAREV” was launched in 2003 and in 2013 studies on a commercial development began, the system comprises of closed sealed floater which contains a wheel that acts like a pendulum. The lower half of the wheel is weighted with concrete and has a diameter of 9m. The wheel moves back and forth as the waves make the floater oscilliate. Hydraulic pumps are connected to the pendulum wheel and charge high pressure accumulators this then discharges energy into the motors and drives the electric generator. The units is 24m long and weights 1000t (tonne) and has a capacity of 500kW. The “Pelamis” project is an array of pendulor devices with pilot operations in Portugal and Scotland. Tests have also been carried out with the device connected to the electric grid near the Orkney Islands, however due to lack of investment the project has not developed commercially. The “Limpet” project on the Isle of Islay has been in test since 2000. It utilises OWC “oscillating water column” technology and has a capacity of 500kW. The “Wave Dragon” prototype was established in 2007 in Wales, it has a capacity of 7MW and utilises floating slack-moored wave energy generation technology. From Figure (22) we can see the different technology types of WEC’s under development, the current trend in the wave energy convertors is for point absorber types followed by oscillating water column and oscillating wave surge convertors types, there is some diversity in designs and with other technologies but this is generally down to location being, nearshore, offshore or shoreline
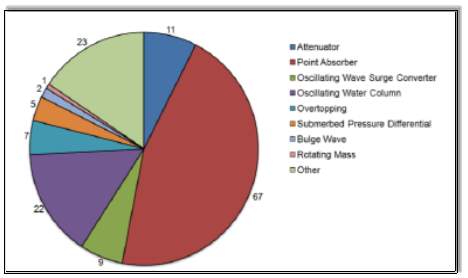
Fig (22) Analysis Of WEC’s Under Development Based On Technology Type [30]
The majority of the WEC technology under demonstration is small single device prototypes and Table (2) gives details of these planned small array projects within Europe. It is hoped that these projects will act as a bridging to larger projects
| PROJECT | COUNTRY | CAPACITY | DEVELOPER | WEC TECH. |
| WESTWAVE | IRELAND | 5MW | ESB | TBC |
| AEGIR | UK | 10MW | VATTENFALL | PELAMIS |
| LEWIS | UK | 3MW | AQUAMARINE | OYSTER |
| BERNERA | UK | 10MW | PELAMIS | PELAMIS |
| SOTENAS | SWEDEN | 10MW | PELAMIS | SEABASED |
Table (2) Planned Small Array Projects In Europe
4.10 current & future wave energy technology
| DEVICE TYPE | DESCRIPTION |
 
(a) |
ATTENUATOR:These devices are generally long multi-segment structurers that are orientated parallel to the direction of the wave. The oncoming waves of various height and force cause a flexing motion along the lengths where the segments connect. The flexing is connected directly to the convertors which are typically hydraulic pumps. As the attenuator devices have a small area which is exposed to the face of the waves the hydrodynamic forces of the inertia, slamming and associated drag which can cause significant dames are reduced. Examples of this device would be the “Pelamis” (a). |
(a) (b) |
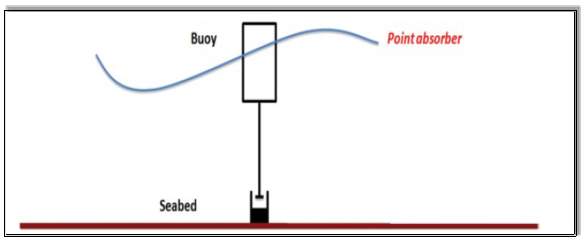
POINT ABSORBER: These devices have a small horizontal dimension when compared to the lengths of the wave and conditions that they operate in. The rise and fall of the wave height at a particular point is utilised by these devices. They can either be submerged under the water taking advantage of the pressure differential or a floating structure which heave up and down on the water surface. As these devices are typically small they are not reliant upon wave direction. Examples of this device would be the “PowerBuoy”” (a) & “Wavebob” (b). |
(a) (b) |
OSCILLATING WAVE SURGE CONVERTOR: These devices are comprised of a hinged deflector which is positioned perpendicular to the direction of the wave. This then moves back and forth in order to fully exploit the horizontal velocity of the wave. Examples of this type of device would be the “WaterRoller”” (a) & “Oyster” (b). |
(a) |
OVERTOPPING DEVICES: These devices have reservoirs which are utilised in order to capture water through impinging waves to levels which are above the surrounding sea level. As water is released back to the sea it is done via turbines which are driven by the water to generate energy. Eamples of this type of device would be the “Wave Dragon” (a) & “Oyster” (b). |
(a) |
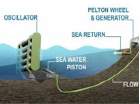
OSCILLATING WATER COLUMN: This device consists of a chamber which has an opening to the sea below the waterline. As waves approach the device water moves into the chamber which then applies pressure to the water that is within the chamber. This wave action cause the captured water column within the device to act like a piston which compresses and decompresses the chamber forcing air through an opening which is connected to a turbine. As it rotates I the same direction regardless of airflow a low pressure Wells Turbine is often used. There are examples of OWC’s being used as point absorbers as illustrated.
|
(a) (b) |
PRESSURE DIFFERENTIAL: These devices can be separated into two categories. One type are generally located near the shore and fixed to the seabed. They use the pressure difference that is generated between the wave troughs and crests over the device. When the crest of the wave is over the device the air that is inside of it is compressed by the water pressure and the device is moved up and down. An example of this would be the “Archimedes Wave Swing” (a). The other type is normally located on the shore line or near the shore. A semi-submerged chamber which is open at the bottom as the level of the water raises and lowers the air within is moved. This airflow drives the turbine and rotates in the same direction even though the airflow is bidirectional. Examples of this would be the “Oceanlix” (b). |

(a) |
BULGE WAVE: Bulge wave devices have a rubber tube which is filled with water and lies parallel to the wave direction. As the wave front passes the tube will flex and then compresses the water within. This compressed water then is used to drive a turbine. An example of this technology is the “Anaconda” (a), which was developed by Bulge Wave Power. |
 (a) (a) |
WAVE BOB: This device works on the same principle as the bicycle pump, this device consists of two main parts a tours which is a round shaped section and a separate float which is positioned within a hole in the centre of the tours and this then has a larger weight suspended from it which is located in the water. The larger weight moves up and down in the water at a different frequency to the lighter round shaped tours. The devices are connected through a central column and as the system moved up and down a hydraulic circuit is pressurised which then drives and electrical generator, an example of this device is opposite (a).
|
5 Investigation Into Ireland’s coastline to ascertain their suitability for marine energy generation
5.1 tidal resource in ireland
Sites suited for tidal energy generation are usually along coastlines, channels, inlets and between headlands. The tidal current speed in these areas is generally greater than those in the seas and oceans. Ireland has a coastline of approximately 7,500km in length and is connected to several seas and oceans. The tidal current flow is strong the St. Georges Channel through to the Irish Sea as well as along the North Channel; the current flows are low along the West and South coasts, see Figure (23). The local tides in Ireland are influenced by the hydrography and bathymetry around Ireland’s coast; narrow straits create a funnelling effect which in turn increases the tidal currents velocity [31]. When assessing the tidal current resource it is very important to consider the major influence of the tidal current velocity. A good indicator at any particular site of the potential energy within a tidal current is the kinetic flux density; this is relative to both the cube of its speed and the fluid density.
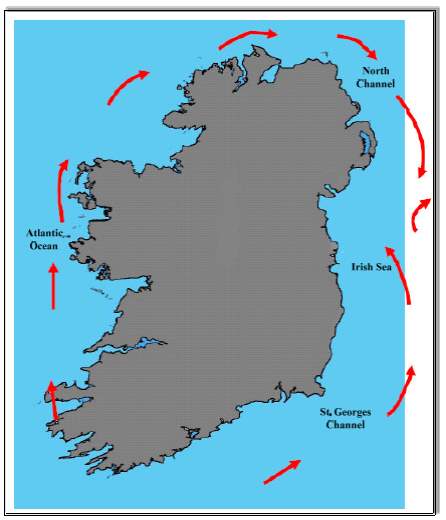
Fig (23) The Sea’s and direction of tides around Ireland [32]
Irelands tidal energy resource has seen very little research; in 2004 the SEAI “Sustainable Energy Authority of Ireland” published a report entitled “Tidal and Current Energy Resources in Ireland”. The report assessed the tidal and marine energy resources around Ireland’s coast using a combination of hydrodynamic models and data analysis to detail the following:
- The total energy potential for the Irish coast under various resource scenarios such as technical and theoretical
- An evaluation of sites in respect of first and second generation tidal energy convertors constrained by various parameters such as current speed and water depth
- An assessment of the financial return through an analysis of potential tidal energy developer selling prices
Ireland has excellent potential as regards marine energy generation and potential sites, there are however several constraints which cause viability, accessibility and practical issues. The SEAI report identified sites which offer the most cost effective potential to exploit the available marine energy generation potential within Irish waters. The report detailed that the areas which offered the greatest potential were in the North Channels and St. George’s as well as along Ireland east coast; these sites generally have two key common areas, their location which is in-between land masses and also the influence of the seabed’s local geometry, the sites are shown in Figure 24.
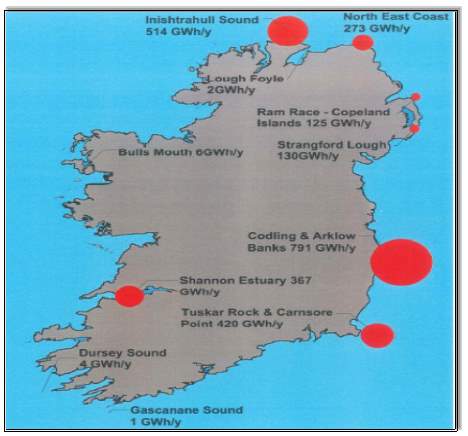
Fig (24) Practical Marine Current Energy Resource In Ireland [32]
The report analysed eleven sites around the Irish coast and this information is detailed in Table 3 below in respect of both the viable and practical tidal energy resources available.
| LOCATION | PRACTICAL TIDE ENERGY RESOURCE (GWh/yr) | VIABLE TIDE ENERGY RESOURCE (GWh/yr) |
| Inishtrahull Sound | 514 | 15 |
| Lough Foyle | 2 | 2 |
| Codling & Arklow Banks | 791 | 70 |
| Tuskar Rock & Carnsore Point | 420 | 177 |
| Gascanane Sound | 1 | 1 |
| Dursey Sound | 4 | 1 |
| Shannon Estuary | 367 | 111 |
| Bulls Mouth & Achill Island | 6 | 6 |
Table 3 SEAI Tidal Stream Energy Potential For Ireland
This can be further separated out to an accessible wave energy resource of 21 TWh/yr and an accessible tidal energy resource of 10.46 TWh/yr, however it needs to be clarified that these figurer’s are based upon levels of technical development which were relevant when this report was first published in 2004 and that the period between then and now has seen there has been vast improvements in design and efficiency of these devices which will greatly expand the levels of accessibility for the resources at these sites. Figure (24) Details the viable marine current energy resource sites along Ireland’s coast.
5.1.1 TECHNICAL & PRACTICAL TIDAL CURRENT ENERGY RESOURCE
The report also detailed the technical current energy resource; these values were based upon the existing tidal current technology. Only sites which had a peak velocity in their tidal current which was in excess of 1.5m/s were used to calculate the technical tidal resource, see Figure (25). The velocity was based upon current tidal current turbines with an efficiency of 0.39. The technical tidal energy resource was also limited by technical issues such as connection to the national grid, deployment technology and some form of support structure. Despite these limitations the technical tidal current energy resource along the coastline of Ireland is estimated to be 10.46 TWh/y (terawatt-hour per year) [33]. In respect of tidal stream resources the main constraining thresholds are with peak spring current flow which is 1.2 m/s and water depth which is between 20 – 80m. With this main threshold constraints identified the main areas for tidal energy resource were found to be along the southern section of the Irish Sea through to the St. Georges Channel, including Carnsore Point, Arklow Banks, Codling and Tuskar. Other resources along narrow complex tidal straits and estuaries have also been documented.
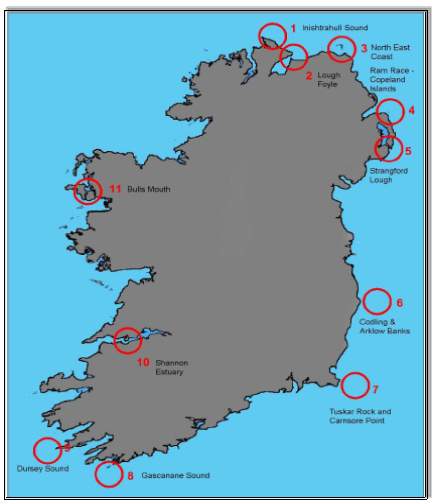
Fig (25) Location of 11 Tidal Current Energy Sites [32]
As per “Table 2” the practical tidal current energy resources are limited not only by water depth but also as regards their respective site locations. MEC’s are prohibited from restricted areas such as military zones or shipping lands, nor where they could cause interference to cables and existing submarine pipes. The SEAI report detailed eleven suitable sites, see figure (18), these sites were chosen as they met with all the constraints as regards water depth and location, the report calculated Ireland’s practical tidal current energy resource to be 2.633 TWh/y [33]. The main tidal energy resources were found to be in County Wexford and Country Waterford along the Irish Sea coast through to the St. Georges Channel. There were also favourable tidal energy resource conditions in County Donegal. Sea loughs and tidal inlets/estuaries which were found to have strong tidal stream currents have also been documented.
5.1.2 ACCESSIBLE & VIABLE TIDAL CURRENT ENERGY RESOURCE
The report did also review the accessible current energy resource, which is the practical tidal current energy resource but with the limitations of regulatory institutions. These limitations range from environmental to health and safety to planning. The accessibility to suitable sites can be limited due to the amount of permits and permissions which are required from various authorities. It was concluded that as none of the chosen eleven sites where constrained from these issues and that the practical tidal current energy resource is the same as the accessible current energy resource that being 2.633 TWh/y.
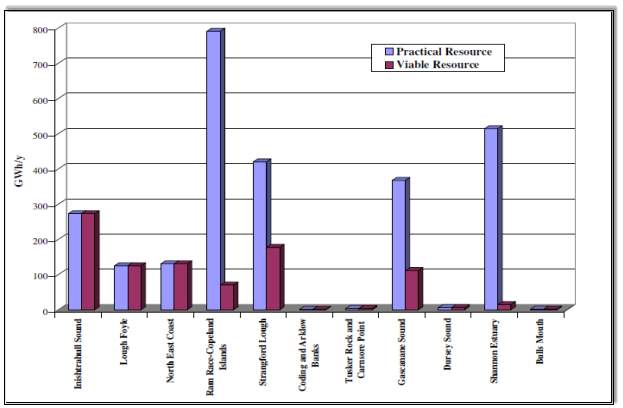
Fig (26) Viable % Practical Tidal Current Energy Resource For Chosen Eleven Sites Around Ireland (33)
As per Figure 26 the viable tidal energy resource was also reviewed, this being the accessible tidal resource but with commercial constraints such as grid network connections, costs, scale. “Marine Current Turbines Ltd” a company from the UK developed an economic model in order to ascertain the Irelands the viable tidal current energy resource around the coastline of Ireland. The model was used to define the number and size of turbines at each of the eleven proposed sites as well as capital cost and outputs at each of the eleven sites. A peak tidal current velocity greater than 2 m/s was required at each site as anything lower is considered uneconomical. The turbines were spaced at 65m apart and they were positioned so as to allow ships to be able to bypass them. The model gave a viable tidal energy resource of 0.915 TWh/y [34]. Figure (26) details each of the chosen eleven locations potential viable energy resource.
5.1.3 SPRING TIDE PREDICITONS & SITE SELECTION
The report detailed an assessment which was carried out by an engineering consultancy who developed a 2-D numerical model of the tidal and currents around Ireland. The model was used to predict the tidal current surface speeds through two (ADCP’s) “Acoustic Doppler Current Profiler” which were installed at Bulls Mouth and the other in the Shannon Estuary. For this the landward boundary of the strip was taken at a point in which the water depth reached 10m while the seaward boundary was taken at a 12 nautical mile limit from the Irish coast. Figure 27 details the predicted, peak and spring-tide velocities from the 2-D model; the results for the east coast were confirmed from measurements of tidal velocities along the west coast from the installed ADCP’s.
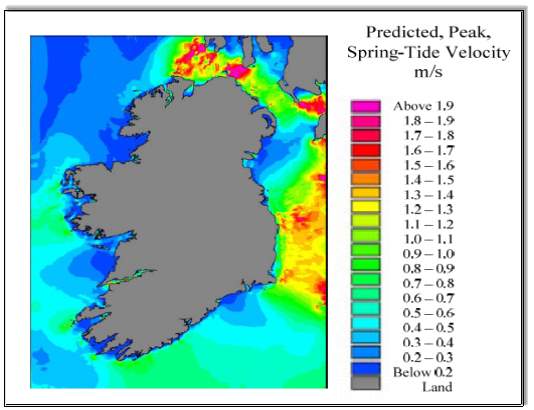
Fig (27) Predicated, peak, spring-tide velocities around Ireland [32]
In order to ascertain the viability of any proposed site a review of the physical constraints, operational assumptions and financial issues which need to be adhered to is required; these are as follows:
- Water depth must be a minimum of 20m, this is so the minimum rotor diameter of 15m can be utilised
- Maximum water depth of 80m
- Mean maximum spring tide current velocity should be in excess of 2m/s
- Consideration must be given to the grid and shore connections
- Insurance premiums and possible seabed rentals
- The availability of the device which is assumed to be 90%, this is about one month of downtime per year
- Costs associated with foundations, environmental assessments, seabed preparations, onshore/offshore transport, installation and cable laying
- Costs associated with grid connections
- The operation and maintenance costs, normally between 2% to 5% of the total energy cost and are dependent upon the number of devices
As stated previously the viable tidal energy resource in Irish waters is 0.915TWH/yr or 2.18% of Ireland’s electricity annual requirement. Table (4) details the tidal energy resource within Irish waters as a percentage of electrical consumption.
| RESOURCE CATEGORY | RESOURCE TOTAL TWH/yr | ELECTRICAL CONSUMPTION (2010) |
| THEORETICAL | 230 | 500 |
| TECHNICAL | 10.46 | 25 |
| PRACTICAL | 2.63 | 6.27 |
| ACCESSIBLE | 2.63 | 6.27 |
| VIABLE | 0.92 | 2.18 |
Table 4: tidal energy resource within Irish waters as a percentage of electrical consumption Source SEAI
Presently there is no documented spatial map of Irelands coastline and so many assumptions have had to been made in respect of tidal energy resource sites around the country. This has been noted at high level forums including the “Zero Carbon Society 2050 Forum” in Dublin in 2009. It was expressed at this forum that accurate up-to-date tidal energy resource assessments will help identify more suitable sites previously though as not being suitable mainly on economic grounds and will also assist in the accurate calculation of the practical and accessible tidal current energy resources. There is also the further issue that the practical and technical tidal energy resource assessments may be inaccurate due to the continued advancements with tidal current turbines.
5.2 wave resource in ireland
The west coast of Ireland’s wave climate is dominated by the prevailing North Atlantic water systems and is regarded as being the best wave energy resource in Europe. The“Wave Energy Resource Atlas of Ireland”was published in 2005 and provided assessments of the wave potential within the seas of the Irish Republic. The wave atlas assessment is based on a combination of WAM (Wave Analysis Model) from the National Ocean and Atmospheric Administration and the measurements and recordings of six buoys around the Irish coastline which provided outputs of both wave power and wave height, these buoy positions are detailed in figure (28). There is still little research on the wave resource and climate of Ireland, any studies on wave climate to date have only researched nearshore sites together with some off-shore sites along the west coast.The wave energy resource in Ireland is limited to the Atlantic Sea board along the western coast as well as the substantial energy resource which is available from the Celtic Sea along the countries South coast.
The energy resource during the winter can reach over 100kWm-1 however this drops to 20kWm-1 in the summer [35]. The west and northwest of the country have outstanding levels of wave energy resource which is amongst the largest in the world, the mean height of a wave off the either the west or northwest coast can be in excess of 4m. Most of the annual incident of wave energy along the Irish Atlantic coast approaches from the sectors of 240° to 300° with 270° being most dominant. The Irish Sea wave climate swell arrives from the south west and as it is sheltered from the north Atlantic swell, it generally exhibits north-south directionality being heavily influenced by the prevailing tidal streams and fetch.
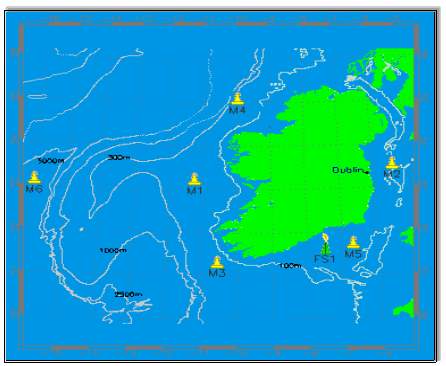
Fig (28) Irish Marine Institute Offshore Buoy Network [36]
5.2.1 WAVE THEORETICAL AND TECHNICAL RESOURCE
The mean annual wave power in kilowatts per meter of wave crest (kW/m) is the parameter that is used to evaluate the theoretical wave energy resource. Along Ireland’s coastline the wave energy resource varies on a considerable basis. Research has found that the technical wave energy resource within shallow nearshore areas which are less than 10km from the coast varies from less than 10km kW/m within the Irish Sea to 40-50 kW/m at the very tip of the Dingle Peninsula in Country Kerry [35]. The wave energy resource increases the greater the distance from the shore as well as in areas that are exposed to open waters which are unconstrained by land. It reaches levels of between 60-70 kW/m along Irelands western and southerly coastlines. The waves along the Irish west coast are large in magnitude due mainly to the westerly track of low pressure systems across the North Atlantic [35]. From Figure (29) we can see that Irelands west coast has very high energy sea states in excess of 100 kW/m especially in the months during Winter, the main issue here is that much potential energy during the winter months is comprised of large sea states and so the amount of extractable energy is inhibited due mainly to the WEC’s technology limitations. In the summer time the energy generation levels can be up to 20 kW/m, the annual variability of the wave resource for the summer is between 20 to 35% [35].
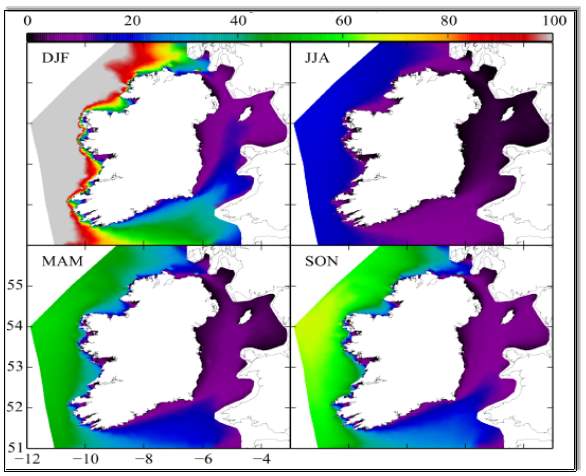
Fig (29) Irelands Seasonal Average Wave Power Per Meter Crest Of Wave (kW/m)
The direction of the wave energy resource along Ireland’s coastline also requires close attention as this not only has an impact upon the design of the devices but also will impact as to where they can be positioned. The Irish wave climate has strong inter-annual variability this is due to the larger scale atmospheric circulation patterns. WEC’s responses vary at different frequencies of excitation and their power generating performance depends upon the bandwidth of the spectral distribution of energy, the spectral shape and the particular device characteristics. The Irish wave energy resource has stated that the potential wave energy which could be generated off the coast of Ireland ranges from 0.14 GW (Giga Watt) to 2.4 GW [35]. The wave power energy resource off Ireland’s coasts poses large seasonal variation as compared to other resources such as wind power; this is however slightly compensated for with the lower average hourly variation.
Figure (30) details the maximum directional resolved wave power for various locations around the Irish coast, the west coast has a larger directional spread at the locations “1” and “4” compared to the directional spread at locations 2 and 3, they also share a very similar frequency of power levels which are between 20 to 100 kW/m . [35] The east coast location “6” has a lower frequency of power levels which are above10 kW/m, while on the south coast the frequency of occurrence above 10 kW/m occurs most frequently at location “5”.
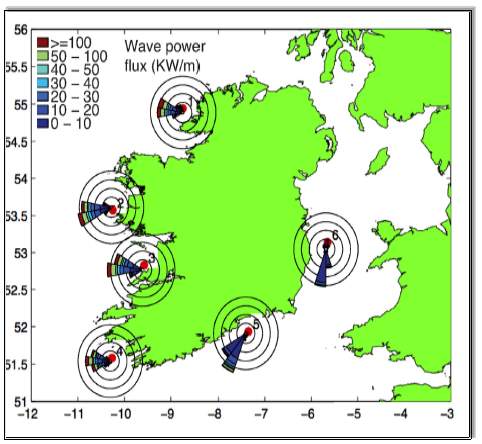
Fig (30) Directionality Of The Wave Energy Resource Around Irelands Coast (kW/m) (37)
The technical wave resource for the region is the theoretical resource but limited by external limitations such as the main wave resource occurring in areas that are between 10 to 100m in depth and where the wave power is in excess of 20 kW/mWC An early study of the European wave resource found that the average wave power within European waters is at its highest along Irelands west coast which was recorded as having an average wave power of 76kW. A later study in 2005 detailed that the theoretical wave energy resource within Irish waters was 525TWh as a comparison Republic of Ireland’s electricity requirement for the year was 27.8TWh. It is however very important to take into consideration the amount of the theoretical energy that cannot only be captured via wave energy resource device but also the amount of this resource which can be converted into electrical energy. In respect of the mean annual wave power in kilowatts per meter of wave crest it has been analysed that the greatest area of energy wave nearshore resource is to be found in the south-west and western coastal regions, this was recorded as being between 40-50 kW/mWC while the nearshore wave energy resource along the east coast was found to be between 0-10 kW/mWC.
5.2.2 SEASONAL VARIATIONS
Ireland’s wave climate has major inter-annual variability in terms of wave size (Hs), it is overall less than 15% for the annual means but it is more than 25% during the spring and winter periods. The Atlantic coast has an inter-annual variability which is more noticeable at the nearshore. Research to date has tended to focus on the west coast as energy generating potential has been seen as having much greater potential than the east and south coasts. Ireland Atlantic coast experiences very high energetic sea states and they do not normally dissipate with any significance until they are close to the shore, this is an issue as WEC’s are designed to operate at certain levels and any operation outside of this can cause issues and means potential energy exploitation during the Winter is lower than could be expected.
The amount of energy levels between the summer and winter is varies on a large scale, as discussed earlier there is little variability in terms of direction, the dominant incoming wave direction on the Atlantic coast is west to southwest with only a slight 10-20° southerly shift from the west. On the east coast the waves come mainly from a southerly direction, this is similar to what is seen along the south coast, average peak direction is much the same as the mean direction, however off the northwest coast there is a slight northerly shift in the peak direction as regards mean direction. Local winds also play a large role in the Irish wave climate, swells which are generated in the North Atlantic basin and travel long distances are also very prevalent along the west coast, thus the wave climate around Ireland is very heterogeneous.
The North Atlantic Oscillation (NAO) has a major influence upon the Irish wave climate especially during the winter. Studies have shown that wave height is directly correlated with the NAO with wave height having a direct correlation with NAO, research has shown that correlation coefficients in excess of 0.7 along coastlines with just the Irish Sea eastern seaboard being an exception. There is also a major seasonal variability to the wave energy resource with winter having the largest magnitude waves mainly due to the more intense depressions in the North Atlantic Directional resolved wave power which is defined as the energy flux through a surface with normal incidence to a particular direction. There is also a specific correlation as regards the energy periods during the winter on the west and northern coasts which shows and increase in the energy period associated with positive NAO phases in these areas; this is also the case during the spring time, the NAO does not have any major influence on the autumn and summer wave climate.
Figure (31) details the percentage wind-sea fraction of the waveenergy spectra, it details three specific areas with distinctive wave climate regimes. Within the Irish Sea inexcess of 60% of the potential wave energy is from local winds. At the south coast the wind-sea and swell components are equally represented, this contrasts with the west coast which is swell dominated except for areas where the swells are attenuated by bays, inlets or islands. It has also been observed that the hindcast quality seems to degrade with higher wind-sea friction values.
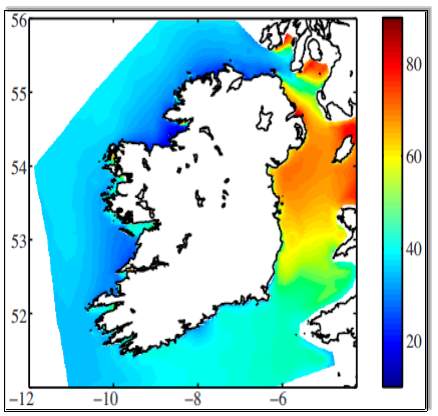
Fig (31) Average Wind-Sea Fraction Of The Wave Energy Spectra [38]
.
5.3 variability issues with wave & tidal power
The United Kingdom’s “Carbon Trust” assessed the variability of issues which can be associated with both wave and tidal energy generation in chosen resources around the United Kingdom and its assumed these findings are transferable so therefore would also apply to Ireland. The report found the following with respect to wave energy:
- The regions have high seasonal variation with the average monthly wave power available being up to seven times larger in summer than winter
- On average wave power delivers five times as much energy during periods of peak electrical demand as compared to periods of low demand
- The hour upon hour variability of the wave resource is low when compared to the available tidal resource
- There is more stability at high energy wave sites in the energy delivered by the wave overtime
- The diversification of wave generating capacity over a number of high energy wave sites can reduce the variability especially over the winter period
- Wave patterns are mainly random and therefore can be predicated
As regards tidal energy the following applies:
- Overall variability is dependent upon the specific site and the level of general development
- Small generation sited make the daily variation smoother as the maximum and minimum output of these sites occur at different times of the day compared to larger sites
- A 10% penetration rate results in low levels of daily variability
- Tidal current have site specific repeatable and predictable tidal patterns
- The power output at specific sites falls and rises to a peak approximately four times a day, this variation is normally site specific and predictable
Wave energy resources are present in the vast majority of Irish waters however in comparison Tidal resources tend to occur in more discreet and smaller areas and are mainly found along the north and east coasts where the tidal currents are at their strongest. A 2010 report by AECOM/SEAI detailed the assessment areas along the Irish coastline, these assessment areas extended out from the coast to a distance of 100km, the reason for the 100km limit is because of the current upper limit of “AC” (Alternating Current) export cable technology as with long distances “DC” (Direct Current) cables are required together with convertor stations on the land to allow conversion to “AC”.
5.4 site locations & parameters ASSOCIATED WITH wave & tidal power
The criteria for both the selection of the proposed sites and marine energy resource devices was based upon sequential steps that relate to various levels of researched information that was obtained on both the proposed site and the MEC’s themselves. In respect of the sites the initial assessment was made on sites where such developments are first of all permitted from both a legal and environmental aspects, areas of high environmental importance and military areas were excluded. Once these proposed sites cleared these initial constraints a more detailed in-depth research of the proposed sites was conducted based on both specific technical and economic criteria. Specific areas along each of the coastlines were identified in respect of the suitability for either wave or tidal energy, this was ascertained from researched literature and geographical surveys of both wave and tidal characteristics and documented resources on these sites.
Detailed research and descriptions of the available marine energy resources at both temporal and high spatial was done in order that design optimisation and proper planning for the proposed marine energy resource development was achieved, this is detailed in the sections below. The research facilitated in achieving the goal of device optimisation both in terms of the power produced as well as the performance level. The report gave assessments for not only wave and tidal but wind as well, as this report is only concentrating on wave and tidal the areas suited to wind powers were not included, this is detailed in Table 5 below.
| Assessment Area | Technology | Location |
| 1 | TIDAL | East Coast – South |
| 2 | WAVE | West Coast – South |
| 3 | WAVE | West Coast |
| 4 | TIDAL | Shannon Estuary |
| 5 | WAVE & TIDAL | West Coast – North |
Table 5 Assessment Areas
In order to ascertain the most suitable resource for a proposed site consideration also has to be given to the operating and development parameters of each resource, this is detailed below in Table 6 below. These parameters will be used to ascertain the most suitable resource device for the particular location.
| ASSESSMENT AREA | TIDAL | WAVE |
| Water Depth | 20m to 80m | 10m to 100m |
| Constraining Threshold | Peak Spring Current Flow >1.2m/s | Mean annual wave power (kilowatts) per meter of wave crest (WC) > 20kW/mWC |
| Approximate MW/km² | 50 | 10 |
| Average Turbine/Device Generating Capacity | 1MW | 0.5MW TO 5MW |
| Average Scale of Commercial Development (MW) & (Km²) | (50MW) (1km²) | (30MW) (3km²) |
Table 6 Resource Operating Parameters
In addition to the parameters listed above there are also other effects which are required to be considered. These include the following which will be reviewed in later sections.
- The method of the connection to the electrical grid such as hubs and cables
- The developments configuration in respect of alignment, spacing and footprint
- The requirements as regards installation, maintenance and commissioning/decommissioning
- The spacing between the devices and how the array is located
6 Investigation of the most suitable marine energy generating devices for each of the four locations
6.1 west coast location – (wave)
This area has the potential for the development of up to 12000MW of wave energy without causing major adverse effects upon the environment; these figures are based on the wave energy generating capacity of 5000MW in water depths between 10 to 100m and for an energy generation of between 6000MW to 7000MW in water depths between 100m to 200m, these figures are based upon existing information and may even be higher as there is still information gaps especially on the potential interactions between wave devices and key receptors in respect of the monitoring of wave installations deployed elsewhere. Detailed below in Table 7 is an assessment of the area from the MRIA (Marine Renewable Industry Association on the development potential for the area as regards wave energy.
| TECHNOLOGY | WAVE(10m to 100m DEPTH) | WAVE (100m to 200m DEPTH) |
|
Development Potential (MW) prior to assessment of Environmental Effects
|
>10000MW |
>10000MW |
| Development Potential (MW) with Environmental Effect (including mitigation)
|
5000MW |
6000MW to 7000MW |
|
Existing and propose developments |
0MW although area includes MRIA ‘initial developments areas’ for North Kerry, West Clare and southern section of North Mayo area. Area also includes Belmullet wave test site. |
0MW |
|
Remaining potential for development |
5000MW
|
6000MW to 7000MW
|
|
Summary of Main Constraints |
Protected sites, birds and marine mammals, seascape, navigation and commercial fisheries. |
Birds, marine mammals and commercial fisheries. |
Table 7 MRIA Tidal Energy Resource Assessment For West Coast from North Kerry To North Mayo
The coastline is both complex and varied, with large bays, sea loughs and varied seascapes. This includes Galway Clew, the Shannon, as well as numerous offshore islands. These various seascapes will have various levels of sensitivity as regards any wave energy resource development. The are several sites which the MRIA have recognised as having an excellent potential in respect of wave generating capacity include areas such as North Kerry, West Clare and the south section of North Mayo offering the greatest potential. For example the Belmullet test site Area “A” in Figure. 32), has the potential to cater for three full sale prototype devices. As the coast is both indented in nature and complex in many locations along this coastal region the effect of a development on one seascape will most likely have an effect on adjacent seascapes which are possibly of a lower sensitivity, thus increasing the local sensitivity of any proposed wave energy resource development.
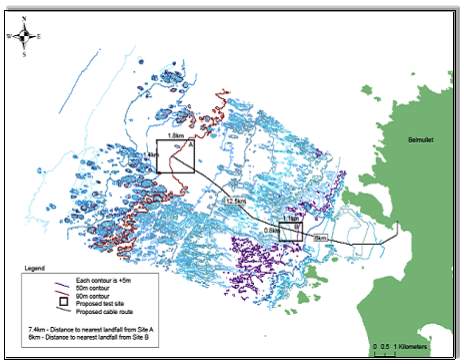
Fig (32) West Coast Viable Wave Energy Generation Project Area
Constraints on wave development are limited to the issue that the proposed developments for these areas are located far off-shore, this does though have an advantage of giving greater flexibility in developing new sites with less obstacles to hinder development. The majority of the wave energy generating resources are located in off-shore areas, however there is major potential for the development of coastal and near-shore sites through more technically advanced devices which are capable operate in shallow waters, such as oscillating wave devices. The west coast south of Belmullet has the largest wave energy resource of any region in Ireland.
6.1.1 AREAS OF ENVIRONMENTAL CONSTRAINTS
The main environmental constraints in this area are limited in their severity this is because the main areas which have been identified as potential development areas are located far from the shore, this gives this area the advantage of having greater flexibility to develop sites without disturbing eco-sensitive sites. The main factors which have an effect upon the level of wave resource development in this region are as follows:
- Commercial fisheries
- Potential effects on protected sites, benthic ecology, birds and marine mammals
- Seascape
The vast majority of the coastline is protected under European and National designations which include a large number of SPA’s (Special Protections Areas), SAC’s (Special Areas of Conservation), MPA’s (Marine Protected Areas), IBA’s (Important Bird Areas) and Ramsar sites. It is possible to avoid these sites by siting proposed developments further from the shore there is still however the possibility that wave development sites could affect local marine life as well the issue of noise generated during construction and installation causing barriers and issues to feeding/breeding grounds and as well as the migratory routes of marine life. The area also has breeding colonies of seabirds, dolphins and grey seals and there have been sightings of hump back whales, leatherback turtles and basking sharks in the area. Any proposed MEC array within this particular area would need a survey to be conducted in order to ascertain the likely significance of any wave development and their impact upon local marine and bird habitats and surroundings.
Consideration must also be given to the reduction of clustering developments by ensuring they are of sufficient distances apart so as to minimise the creation of barriers that can cause issues with movement and can lead to the exclusion of various receptors from large areas of the sea. Wave energy developments in this region do have the advantage over wind energy development sites in that they are not as intrusive to the seascape and as the majority of the wave resource along the west coast has been identified as being offshore. There is also scope for the deployment of the MEC resource closer to shore typically 0km to 5km which could utilise oscillating wave surge devices. This would require seascape assessments in order to determine the effect this type of device would have upon the seascape in respect of the offshore elements (device) and the onshore elements of this development (turbines are located on shore).
In respect of navigation and shipping there are limited constraints, the region has vast fishing grounds and the potential effect of any wave energy development would have the continuation of fishing around the development. It would be required to identify key fishing grounds and to ascertain very carefully what effect the development would have on these commercial fishing activities.
6.1.2 PATICULAR MARINE ENERGY RESOURCE DEVICE (POWERBUOY)
This region of Irelands coast has enormous potential with an estimated wave energy resource of 12000MW, this figure comprises of 5000MW of wave energy resource in the area of water depths from 10m to 100m and 7000MW in the area of water depths from 100m to 200m. The device that was chosen for this area is the “Powerbuoy” it can not only operate in these water depths but is also less visually obtrusive than other devices and so will not have a major effect upon the seascape., it also does not have many moving parts or cables which can cause issues with marine like becoming entangled in, see Figure (33) and Table 8 for device and key features.
| TECHNOLOGY | WAVE |
| FLOAT DIAMETER | 11M |
| FLOAT HEIGHT | 2M |
| HEIGHT ABOVE WATER | 8M |
| DRAFT | 36M |
| MASS | 150 TONNE |
| MOORING TYPE | CATENARY MOORED |
| ANCHOR TYPE | CONCRETE BLOCK |
| ANCHOR MASS | 165 T EACH |
| RATED POWER | 150KW |
| HYDRAULIC FLUID VOLUME | ~2500 L7 |
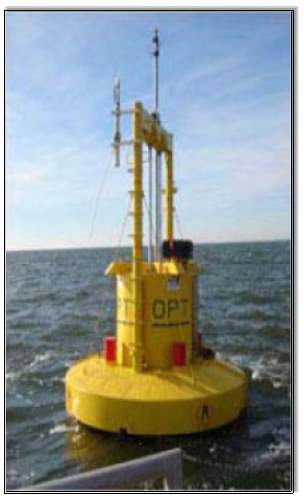
Fig 33 & Table 8 Powerbuoy Device & Key Specifications
The device was developed by “Ocean Power Technologies”, the structure is loosely fixed to the sea floor which allows it to move up and down with the waves. All of the control equipment are sealed within the device including the power electronics, electrical generator and power take-off. Each device has an internal float that acts much the same as a piston as it moves up and down as the waves pass along. The device has a low maintenance as all the vital components are housed within the device protected from the elements. Detailed above in Table (8) are the devices key characteristics for a 150kW rated device which is designed to operate in water depths above 55m and wave heights of between 1m to 6m during normal operation.
The device is a heaving point absorber which reacts against the subsea reaction plate. This movement between the reaction plate and the devices absorber buoy is converted into electricity through an electro-hydraulic power conversion system. The device is constrained from just drifting away as it is catenary-moored so that the device can move unrestricted in the wave heave. Figure (34) details how the system is moored between three surface piercing mooring buoys, the buoys are moored to the seabed via a concrete block. There is little risk of entanglement as the pre-tension levels on the mooring lines and the inter device spacing are not high enough. The device is best suited to longer wavelengths in-excess of 60m, the capture width of the device is greater than the width of the float as the device interacts with the entire surrounding wave field. The device also has advanced electronic solutions such as “wave-by-wave” tuning which gives an efficient wave energy capture in a extensive variety of sea states including survivability in severe storms.
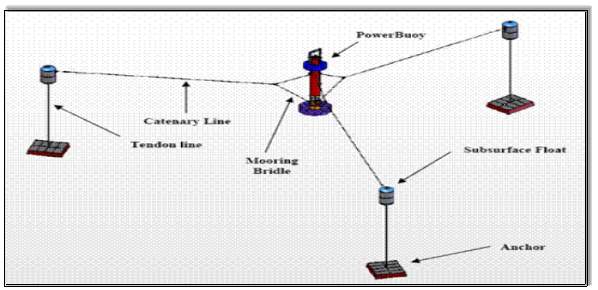
Fig (34) Powerbuoy Mooring & Footprint
As this device is a point absorber with a simple heave motion it is well suited to a mechanical system which drives AC generators which can be either linear or conventional. With the PB150 the full scale power convertor both inverts and rectifies the AC output which produces fully grid-compliant electricity at 575V, 50Hz or 600V, 60Hz. The power factor is between 0.9 and unity, the generator is rated at 150kW max daily average but has short term peak availability of 866kW.
The operation and maintenance of this device is similar to other hydraulic power take-off mechanism with the standard yearly inspection and maintenance periods. As the device is not large the device is normally recovered from the sea and the works carried out on the lands. Off shore construction projects are very dependent upon the weather and for the installation of this device along the west coast the most suitable construction time-period would be between the months of May to September when the seas along the west coast are calmer. Detailed below in Table 9 are the typical time requirements for such an installation.
The scheduled maintenance of the device much like the construction will be carried out during the calmer summer months; however there will be unplanned maintenance activated during the winter months due to device failures, the operation and activity resource requirements are detailed out in Table 10. The life span of this device is between 15-25 years and the decommissioning activities will occur normally over one to two summer months, this is normally dependent upon the size of the project area.
| ACTIVITY
|
RESOURCE | 10-UNITS | |
|
DIRECTIONAL DRILLING TO LAND POWER TAKE-OFF CABLE ON SHORE |
DRILL RIG | < 2 MONTHS | |
|
CABLE INSTALL | < 2 WEEKS | |
|
MOORINGS SYSTEM INSTALLATION
|
DERRICK BARGE, 2 TUGS SUPPLY BOAT | 3 WEEKS | |
| ELECTRICAL COLLECTOR SYSTEM INSTALLATION
|
DERRICK BARGE, 2 TUGS SUPPLY BOAT | 1 WEEKS | |
| DEVICE DEPLOYMENT & COMMISSIONING
|
DERRICK BARGE, 2 TUGS SUPPLY BOAT | 3 WEEKS |
Table 9 Powerbuoy Sire Pre Install and Construction Duration
| ACTIVITY
|
RESOURCE | 10-UNITS |
| RECOVERY AND RE-DEPLOYMENT
|
CUSTOM VESSEL | ANNUAL |
| UNPLANNED MAINTENANCD | CUSTOM VESSEL | EVERY 4 YEARS |
|
VISUAL INSPECTION OF UNDERWATER ELEMENTS
|
RESEARCH VESSEL, ROV | EVERY 5 YEARS |
| REPLACEMENT/REFURBISHMENT OF MOORINGS AND ELECTRICAL COLLECTOR SYSTEM
|
DERRICK BARGE, 2 TUGS SUPPLY BOAT | 10-15 YEARS |
Table 10 Powerbuoy Operational Activities Resources and Duration
6.2 east coast location – (tidal)
The potential tidal energy resource that is available in the area is in excess of 5000MW, there is also the resource potential to generate between 750MW and 1500MW without having a negative effect upon the local environment and local marine life. Tidal energy has the advantage over either wind or wave energy of having a higher generating capacity per km, this is because tidal stream energy is more concentrated and consistent than the other resources as well as more modern designs packing arrays more closely together thus tidal energy has a higher generating capacity for much less space. The Marine Renewable Industry Association (MRIA) has identified a small area along the Wicklow coast in which optimal tidal resource energy generation is available.
This area has a number of potential locations where tidal development could be utilised although technology dependent it can be accepted that the majority of the development will be beneath the water’s surface, this has the advantage of reducing the effect the proposed development would have on the existing sea scape. However there will be some portions of the development which will protrude the surface and as the main tidal resource for the area is between 0 to 5km from the coastline this will have some degree of impact upon the coastline. Detailed below in Table (11) is an assessment of the area from the MRIA on the development potential for the area as regards tidal energy.
| TECHNOLOGY | TIDAL |
| Development Potential (MW) prior to assessment of Environmental Effects |
>5000MW
|
| Development Potential (MW) with Environmental Effect (including mitigation) |
750MW to 1500MW |
| Existing and proposed development |
0MW although includes the area identified as an ‘initial development area’ by MRIA.
|
| Remaining potential for development |
750MW to 1500MW
|
| Summary of Main Constraints | Marine mammals, birds, benthic communities, commercial fisheries and navigation.
|
Table 11 MRIA Tidal Energy Resource Assessment For East Coast
In 2014 the Offshore Renewable Energy Development Plan designated areas which they considered suitable for tidal development, the south-east coast region of Ireland was one of those chosen, the south east coast region stretches from north county Dublin to Carnsore Point in Country Wexford. The specific areas in the region which were identified as potential tidal marine energy development areas were the Arklow/Wicklow Banks and areas of Carnsore Point, see Figure (35).
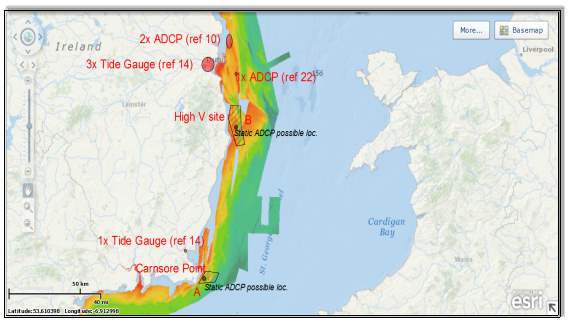
Fig (35) South East Coast Viable Tidal Energy Generation Project Areas
For the Carnsore Point area peak tidal flow can reach 1.8m/s this is due to the local bathymetry which funnels the flow around the headland. An issue with this site is that because of the localised resource the potential site is limited to 5km as well as the water depth being between 20 to 60m. In respect of Area “B” the Arklow Banks area the peak flow also can reach 1.8m/s again due to the local bathymetry funnelling the flow around the local sand banks. The potential site for this area is between 5km to 15km and has a water depth of between 20m to 40m. Both sites are suitable for second generation tidal energy generation devices and both areas have potential for development into the future with estimated peak flows of 2m/s being recorded in sections of the proposed sites. However careful consideration will have to be given to the issues of deploying devices in deeper water locations. As the high tidal flow locations in both areas are dependent upon the local bathymetry consideration will also have to be given to the following:
- The locations of the high tidal flows
- Local eddy currents which will affect the tidal flow
- Turbulence
6.2.1 AREAS OF ENVIRONMENTAL CONSTRAINTS
Possible tidal energy resource sites in this region must take cognizane of protected conservation sites such as Wexford Harbour, Slobs SPA, Ramsar, Wicklow Head SPA, Wicklow Reef SAC and Carnosre Point SAC. The main environment constraints as well as marine or other activities that have to be considered in respect of tidal resource developments are:
- Commercial fisheries
- Potential effects on protected sites, benthic ecology, birds and marine mammals
- Shipping and Navigation
There is a large area of the tidal resource that overlaps an area which has been identified by the National Parks & Wildlife Service (NPWS) as having the potential for Annex I habitat (benthic). Main issue with this is that the identified areas by the NPWS are very broad and further surveys and research must be conducted to determine the specific presence of benthic communities in specific locations and the effect a tidal resource development will have on them. Wicklow Harbour and Wicklow Head both of which are south of the region’s main tidal resource have sensitive areas in respect of bird life. Any tidal development could affect birds that feed or dive to feed in the area. There is no designated SAC’s in the area for marine mammals, however as there is still major uncertainty as regards how marine mammal life actually interact with tidal resource technology and there is little know as regards the risk of creating barriers to movement along feeding routes and migratory routes as well as the increased collision risk.
Any tidal resource development in this area will have the greatest affect upon commercial fisheries, shipping and navigation. There is at present a major lack of information in respect of inshore fishing this is typically those vessels that are less than 15m in length. Any tidal development will have to take place in areas of low shipping intensity. The main shipping lanes in this area are from Dublin and Rosslare, it has been estimated that any proposed tidal energy resource development in excess of 1800MW could encroach into these vital shipping lanes and so will have a significant adverse effect upon shipping in the area.
The dominant seascape in the area is low plateau and low lying coastal plain both are the least sensitive to offshore developments. The vast majority of any tidal resource development will be submerged below the water level thus having a significant less negative effect upon the seascape. This is however dependent upon the size of any proposed development, if the tidal resource is placed close to the shore for example between 0km to 5km there could be a proportion of the device which will protrude above the water surface and so have an impact upon the seascape.
6.2.2 PATICULAR MARINE ENERGY RESOURCE DEVICE (OPENHYDRO TIDAL DEVICE)
This region offers excellent potential in respect of tidal energy resource which has been estimated at 5000MW at its peak but there is also the potential for a tidal energy resource of between 750MW to 1500MW which would not have a negative effect upon either the local environment or its marine life. The device proposed to use for the region is the “Openhydro” Open Centre Turbine (OCT) as per Figure 36.
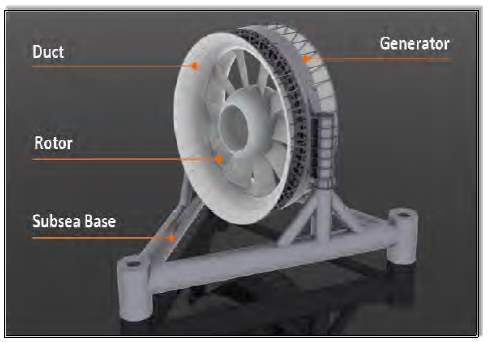
Fig (36) Open Centre Turbine
The device is designed for deployment on seabed and so is an excellent choice for a region like this with major shipping routes and scenic coastline. The device has four critical parts, an axis which is horizontal, a direct drive permanent magnet generator, subsea gravity base support structure and a hydrodynamic duct. The device is very simplistic with seals, gearbox or lubricants and so it requires little maintenance. The OCT’s installed here will have a rotor diameter of 16m which will mean a turbine height of 22m. It is built with glass reinforced plastic and steel. The gravity base is made from steel tubular sections which make up a triangular base with three feet at the vertices as well in the centre there being a vertical turbine support. The hydrodynamic efficiency of the motor is improved through the shape of the duct which contains the large permanent-magnet generator.
The basic tubular steel structure is made from steel and is designed so that it can be broken into several sections which are connected by flange joints and this facilitates ease of transport. Mobilisation of the device will take place at the harbour nearest to the array site, which in this case will most likely be Arklow. There is the issue of fast, oscillating tides being both difficult and hazardous environments to work in, with this the designers have taken advantage of a custom made installer barge to move the large turbines into position. The overall load of the base and turbine is 1000t with a height of between 20-25m.
Once at the installation site the seabase and the turbine will be lowered as one unit, this makes the install very quick usually in one hour. Figure 37 details how the turbine and the seabase will be lowered as a single unit onto the seabed.
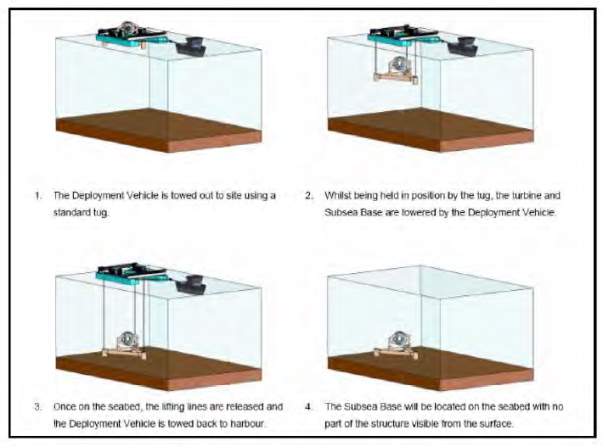
Fig (37) OCT Device Layout
As regards the maintenance and operation of this device, the associated auxiliary equipment will require ongoing inspection and remedial works, this falls into three categories.
- Scheduled Maintenance
- Unscheduled Maintenance
- Periodic Overhauls
OpenHydro see this device as being low maintenance mainly because of the “hot swap” methodology so that when the device requires servicing that the whole device including the turbine and seabase are brought to the surface and a new turbine will be immediately installed. The old turbine is brought to shore and then after servicing becomes available to hot swap with another unit.
6.3 north coast location – (tidal)
This region covers the north-west coast through to the north coast along the Irish border. At present there are no tidal energy developments within the area. The (DCENR) Department of Communications, Energy and Natural Resources in their 2010 report “The Strategic Environmental Assessment (SEA) of the Offshore Renewable Energy Development Plan” estimated a potential tidal extractable tidal power of between 750-1500MW for the region.
Potential sites have been identified that cover a much wider area than other regions as well as being more sporadic. Areas particularly identified are Lough Foyle, Inishtrahull, Lough Swilly, Mulroy bay and Arranmore. The areas around Lough Swilly, Mulroy Bay and Lough Foyle are at present unsuitable for commercial scale project due to mainly to a mixture of existing technology and the majority of water depths in the area being less than 20m. Further South along the coast towards Arranmore has a very low peak tidal current and lacks a sufficient tidal resource to make it viable for tidal energy generation.
The main area for tidal energy resource generation is located close to the inshore, there are also very limited constraints in-respect of water depth as well as restrictions associated with ecological sensitive areas and shipping lanes. The main area of tidal resource is located between 0 to 5km of the shore, there is also scope for the development of tidal developments between 5 to 15km for the shore. Detailed below in Table (12) is an assessment of the area from the MRIA on the development potential for the area as regards tidal energy.
| TECHNOLOGY | TIDAL |
| Development Potential (MW) prior to assessment of Environmental Effects |
>5000MW |
| Development Potential (MW) with Environmental Effect (including mitigation) |
750MW to 1500MW |
| Existing and propose development | 0MW although includes the area identified as an ‘initial development area’ by MRIA. |
| Remaining potential for development | 750MW to 1500MW |
| Summary of Main Constraints | Marine mammals, birds, benthic communities, commercial fisheries and navigation. |
Table 12 MRIA Tidal Energy Resource Assessment For North East Coast
The regions coastline extends north from Glendorragh Point in County Mayo to Inishowen Head in County Donegal and has various seascape types from sea loughs to large bays to numerous islands, peninsulas, flat/low lying complex islands and headlands. The region has shallower water depths than those on the west or south coasts together with low levels of vessel/shipping movements. This gives the region an advantage for the development of energy resources in offshore areas thus avoiding protected areas and reducing the effect on local marine and bird life.
The regions seascape is low lying coastal plain which is a less sensitive seascape type so most tidal energy resource devices will not cause significant issues as regards the seascape. However the significance of any effect will increase as the development increases so any potential developments will have to be sited at reasonable distance from the coast to avoid any issues. The coastline for this region is the most suitable tidal energy generating area is located south east of Inistrahull, See Figure (38), this area has both the required depth and tidal resource for a commercial development.
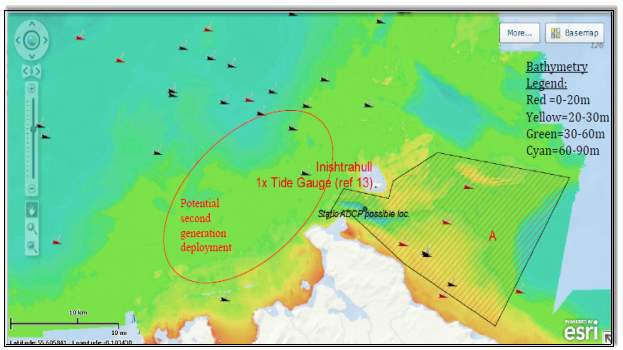
Fig (38) Inishtrahull Island Tidal Energy Generation Project Areas
The site detailed as “A” is suitable for a first generation tidal development with a peak velocity of 1.9m/s and a depth of between 20-80m. The area west of this is considered a first generation tidal development as it has the required water depth but is located in a deeper region and has pockets of high velocity.
6.3.1 AREAS OF ENVIRONMENTAL CONSTRAINTS
This region has a large number of protected sites with particular benthic ecology sites and the potential for tidal resource development sites to overlap into areas which have been identified by the NPWS as having potential to support sensitive Annex I habitat. The area has a large and very diverse marine life and Donegal has a high number of basking sharks along its coast. Birds also use the offshore and nearshore for feeding and loafing. The region also has World Heritage sites such as the Giants Causeway. The main areas which tidal resource developments could affect are from the loss of habitat as well as the exclusion because of the physical presence of the tidal resource devices together with the noise which is generated during the installation as well as the operation.
Any tidal development could affect birds that feed or dive to feed in the area. There is no designated SAC’s in the area for marine mammals, however as there is still major uncertainty as regards how marine mammal life actually interact with tidal resource technology and there is little know as regards the risk of creating barriers to movement along feeding routes and migratory routes as well as the increased collision risk. Development of upto 30 arrays within the area is possible without the direct overlapping into protected sites; the region is particularly sensitive to mobile mammal and bird species. The potential impact of a tidal energy resource on the area includes sediment re-suspension and substratum loss during installation for the seabed foundations, the introduction of a hard substrate can have a positive and negative affect with an increase in biodiversity but also changing ecological relationships.
The seascape in this region is less sensitive to tidal developments than developments such as wind or wave devices. This is because any proposed tidal development in the area will be mostly submerged beneath the water thus minimising the effect and level visual impact of a tidal resource development. The main issue would is that the main tidal resource for the area is closer to the shore than would be for a wave or wind resource development. Any tidal resource which is deployed between 0km to 5km from the shore will most likely have protruded out of the water and this has an impact upon the seascape. It would be favourable to position any tidal energy resource between 5km to 15km from the shore so as to reduce the visual impact upon the seascape. Shipping is not intensive in this particular region with a low frequency of cargo vessels
6.3.2 PATICULAR MARINE ENERGY RESOURCE DEVICE (SCOTRENEWABLESSR2000)
The research and development of tidal energy resource within this region has been very limited. The region has however been estimated to have a potential tidal extractable tidal power of between 750-1500MW for the region. For this region the Scot Renewables SR250 will be utilised, this is a floating tidal stream turbine which uses two contra-rotating rotors that extract the kinetic energy from the tidal flow; this is then converted into electricity from a power take off system. The main structure of this device is a cylindrical tube to which horizontal axis rotors are attached via retractable legs, See Figure (39). The SR250 was designed for ease of install, operation, maintenance and its survivability, the floating tubes re 33m in length and 2.3m in diameter and support two horizontal axis rotors which at the stern are splayed sideways.
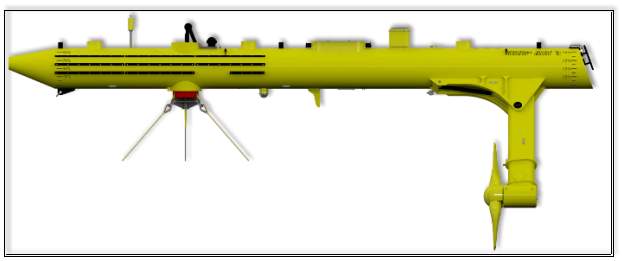
Fig (39) Scotrenewables SR250 Device
The retractable legs allow the device to operate in two separate configurations which are transport/survival mode where the rotors retract in-order to decrease the draught which allows the device to be towed more easily into ports for routine maintenance and to reduce loads during severe sea conditions and operation mode where the rotors are down in order to generate power. The device specifications are detailed in Table (13).
| PARAMETER | TIDAL |
| RATED TIDAL VELOCITY | 3 m/s |
| LENGTH | 33M |
| DIAMETER | 2.3M |
| ROTOR DIAMETER | 8M |
| MINIMUM DRAUGHT | 6M |
Table 13: Scot Renewables SR250 Parameters
Its key features are that the floating tubes place the turbines in water regions that have the highest tidal velocities thus increasing the energy availability; the mooring system allows the device to be deployed in deep water while during storm conditions the device ceases power generation automatically with the rotor legs retracting and the streamlined shape allowing waves to pass along it. . The device utilises a catenary-type mooring system which has both a single mechanical and electrical point. Once the device is safely connected to the mooring system it can freely orientate itself into the tide. This device is therefore able to respond to the dynamic changes which occur in current and wave conditions. An extra advantage is that rotors are placed in what is the most energetic part of the water column, near to the surface and away from the seabed induced turbulence, this is detailed in Figure 40.
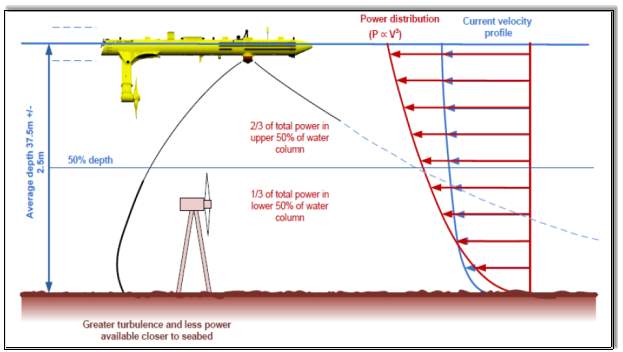
Fig (40) Scotrenewables SR250 Device Mooring System
The rotors with their counter rotating fixed pitch blades drive variable speed electrical generators and separate gearboxes which are housed within subsurface nacelles. The generated power is routed into the main tube where it is converted via power conditioners into grid-compliant electricity before it is transformed upto 6.6kv for export through a subsea cable. The device also has two removable equipment containers which are installed within the hull; this allows the pre-assembly and commissioning of equipment such as auxiliary systems and drivers offsite before their installation in the hull which therefore speeds up the construction process. For onsite maintenance access is done via the RIB. The device is designed for installation in arrays of 10MW and has a life span of 20 years. The device also has very low energy requirements in respect of install, maintenance and decommissioning. This is mainly because of the mooring system which allows the device to be very easily towed to the project install site and it also does not have a requirement for piled foundations to the seabed.
6.4 SOUTH west coast location (WAVE)
This area along Ireland’s south west coast has the potential wave energy resource of between 500 to 600MW in areas with wave depths of between 10m to 100m and 3000MW to 3500MW in water depths between 100m to 200m. The area has limited availability of shallow nearshore sites and in much of the locations the water depths rise to 60m within 20m to 25m from the shore. Figure 41 details the dominant wave energy resources in the region with the wave energy resource being the dominant resource along the south-west coast marked in blue.
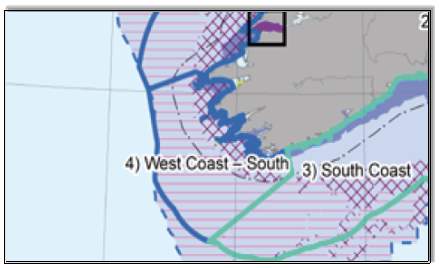
Fig (41) South-West Wave Energy Generation Project Area
Figure 42 illustrates a typical wave climate that is experienced off the southwest coast of Ireland, the typical wave height for the region (Hs) was found to be between 0.5m and 9m with wave energy period (Tc) being between 4s to 10s.
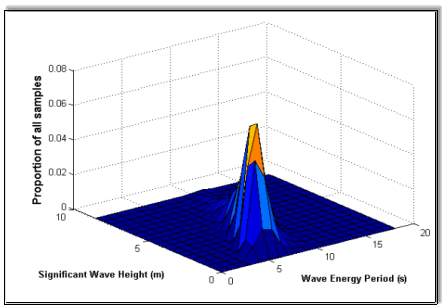
Fig (42) South-West Wave Energy Generation Project Area
Any research to date has detailed that there is not much correlation between wind and wave resource on the south west coast this is because of the existence of a remotely generated wave system which is generally a low frequency swell. The theoretical wave energy resource for this region is rated at between 60-70kW/m with specific areas such as the Dingle Peninsula having a resource of 40-50kW/m with this also been the same for the northwest coast of County Kerry, the region also has high speed currents.
The development of wave energy resource devices in this area is not constrained as the majority of any proposed developments are in offshore locations away from protected sites. Detailed below in Table (14) is an assessment of the area from the MRIA on the development potential for the area as regards wave energy. The “SEAI” have identified that the scale of any commercial wave array for this region is 30MW as opposed to 300MW for wind, there is however less constraints on the development of wave arrays on an environmental aspect.
| TECHNOLOGY | WAVE(10m to 100m DEPTH) | WAVE (100m to 200m DEPTH) |
|
Development Potential (MW) prior to assessment of Environmental Effects
|
>5000MW |
>5000MW |
| Development Potential (MW) with Environmental Effect (including mitigation)
|
500MW to 600MW |
3000MW to 3500MW |
|
Existing and propose development |
0MW although area includes MRIA ‘initial developments areas’ for North Kerry, West Clare and southern section of North Mayo area. Area also includes Belmullet wave test site.
|
0MW |
|
Remaining potential for development |
500MW to 600MW |
3000MW to 3500MW |
|
Summary of Main Constraints |
Protected sites, birds and marine mammals, seascape, navigation and commercial fisheries. |
Birds, marine mammals and commercial fisheries. |
Table 14 MRIA Wave Energy Resource Assessment For South West Coast
6.4.1 AREAS OF ENVIRONMENTAL CONSTRAINTS
Wave energy resource development in this area is limited as the main resource areas are located further offshore than similar developments tidal or wave energy resource developments, this does allow the development of wave energy resource sites which are far from eco sensitive areas. The main constraints which for a wave energy resource in this region are detailed below:
- Potential effects on protected sites, benthic ecology, birds and marine mammals
- Seascape
- Shipping and Navigation
In terms of local marine and eco life the majority of the areas which are suitable for wave energy resource development are in offshore areas and so located far from breeding ground and feeding areas. There is still a lack of research on the effect that wave energy resource devices have upon the local marine and eco life. The Skellig Michael which is a World Heritage Site is a constraint upon wave energy resource development in the area. The seascape of the area is very rugged and complex, with headlands, sheltered bays and exposed peninsulas it is thus very sensitive to man-made devices, it would therefore be prudent to develop the wave energy resource site to between 10km to 15km from the coastline so as to have a slight to moderate effect upon the seascape. This would also give the advantage of avoiding shipping and navigation areas thus reducing any adverse effect upon navigational safety as well as reducing any effect upon local and commercial fisheries.
The development of wave arrays further off-shore means that the main areas for shipping and navigation are avoided so there is no significant effect upon navigational safety this also means that there is a reduced adverse effect upon the local marine life and commercial fisheries within the area. Any proposed wave array development in the area must be reviewed in respect of the size of the proposed array which could be sited within the area whilst also maintaining suitable distances from any array so as to avoid adverse effects upon local marine life habitats as well as the creation of barriers which could restrict movement.
It is recognised that seascapes are less effected by wave developments as opposed to wind array developments this is of course mainly because of the fact that wave devices tend to lie on the surface of the water whilst wind arrays devices will protrude the water surface in some cases 40m to 50m beyond the surface of the water making them far more physically and visually intrusive. This is especially true of this region as the seascape is both distinctive and complex with sheltered bays, rugged peninsulas thus making it less sensitive to any wave array development. As stated above the main wave energy resource is far off-shore for this region so this will have it in the 10km to 15km distance bracket from the coastline ensuring there is only a moderate effect upon the seascape any further than this and any adverse effect will be only slight if any at all.
6.4.2 PATICULAR MARINE ENERGY RESOURCE DEVICE (PELAMIS WAVE POWER)
This area along Ireland’s south-west coast is better suited to devices that can operate in deeper waters; the energy resource from wave energy in the water depths between 100m to 200m has been estimated at 3000MW to 3500MW. The device chosen for this location is the “Pelamis” this device is a free-floating hinged contour device and it consists of four tubular sections which are connected via three hinged power conversion modules. The power conversion modules contain a sway joint and a heave which have different degrees of freedom. Wave induced motion is resisted by a set of hydraulic rams which are configured as pumps. The hydraulic rams pump oil into smoothing accumulators which then via an electrical generator coupled to a hydraulic motor drain at a constant rate. The device components are all contained within the device cylinders. The key points of this device as that it offers great flexibility as it can be installed in a range of water depths and seabed conditions it is also easily detachable and attachable from it electrical and mooring connections.
| TECHNOLOGY | WAVE |
| LENGTH | 180M |
| WIDTH | 6M |
| STEEL WEIGHT | 750 TONNE |
| BALLAST WEIGHT | 800 TONNE |
| MOORING TYPE | CATENARY MOORED |
| ANCHOR TYPE | STEVPRIS TYPE EMBEDEDMENT ANCHORS |
| ANCHOR WEIGHT | 14.5 TONNE |
| RATED POWER | 750KW |
| POWER CONVERSION | ELECTRO-HYDRAULIC POWER CONVERSION SYSTEM |
| HYDRAULIC FLUID VOLUME | 12,800 Litre |

Fig 43 & Table 15 Pelamis Device & Key Specifications
The operation of the pelamis is achieved through the sizing of the accumulators which are sized to ensure the smooth continuous output across the wave groups. In order to allow the dumping of excess power into the sea, oil to water heat exchanges are included as well as providing the required thermal load in the event of a loss of the grid. The overall power conversion efficiencies (mechanical to electrical) are 70% at low power to in excess of 80% at full capacity. There is a single transformer which used in order to step-up the voltage to the required level for transmission to the shore. Through a single umbilical cable high voltage power is fed to the sea bed then to the shore through a standard sub-sea cable. A caternary mooring system is used and this is slack moored in a mooring configuration that ensures the device is self-references as well as pointing at the incident waves. This is detailed in Figure 44.
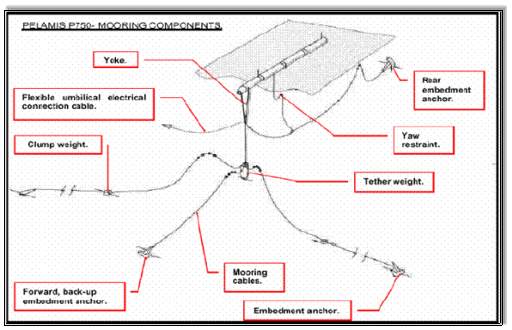
Fig 44 Pelamis Mooring Configuration
As with many other devices the maintenance will be either carried out on-shore or in sheltered waters. This device is designed so it can be easily disconnected from its moorings and so be towed to the maintenance facility and its various sub-systems can be lifted with a standard three-ton crane. The device also has extensive instrumentation with remote diagnostic capability and a high level of redundancy which removes the requirement for much physical intervention. A recent development with this device is a quick connect/disconnect system which will allow quick deployment and device recovery. Each section of the device has a power conversion system with hydraulic fluids being released from high pressure accumulators into hydraulic motors which drive 3 phase asynchronous (induction) generators which are rated at 125kW, a built in redundancy in the hydraulic system to ensure there is a fault tolerance. Each module can generate 250KW and heat exchangers allow dumping of unwanted power in the event of grid failure or cable damage. The generated power is routed into the main tube where it is converted via power conditioners into grid-compliant electricity before it is transformed up to 6.6kV for export through a subsea cable. A “habitat” system has also been developed, this can seal off a portion of the tubular section and allow dry access to areas of the device which are below the waterline, and this means the device does not need to be recovered for joint repairs or standard repair operations. As with similar devices the construction periods are best during the May to September months when the sea is calmer. Table (16) details the typical construction/installation programme for a Pelamis device, this is normally spread over a two year period. As with construction the main maintenance activities will occur when the seas are calmer during the May to September months. The device has a typical life span of between 15-25 years and the decommissioning activities will typically occur over one to two summers.
| ACTIVITY | RESOURCE | 10-UNITS | |
| DIRECTIONAL DRILLING TO LAND POWER TAKE-OFF CABLE ON SHORE
|
DRILL RIG | < 2 MONTHS | |
| SUBSEA CABLE INSTALL | CABLE INSTALL VESSEL SUPPLY BOAT | < 2 WEEKS | |
|
MOORINGS SYSTEM INSTALLATION
|
DERRICK BARGE, 2 TUGS SUPPLY BOAT | 3 WEEKS | |
| ELECTRICAL COLLECTOR SYSTEM INSTALLATION | DERRICK BARGE, 2 TUGS SUPPLY BOAT | 1 WEEKS | |
| DEVICE DEPLOYMENT & COMMISSIONING | CUSTOM VESSEL | 3 WEEKS |
Table 16 Pelamis Pre Install and Construction Duration
| ACTIVITY | RESOURCE | 10-UNITS |
| RECOVERY AND RE-DEPLOYMENT | CUSTOM VESSEL | ANNUAL |
| UNPLANNED MAINTENANCED | CUSTOM VESSEL | EVERY 4 YEARS |
| VISUAL INSPECTION OF UNDERWATER ELEMENTS
|
RESEARCH VESSEL, ROV | EVERY 5 YEARS |
| REPLACEMENT/REFURBISHMENT OF MOORINGS AND ELECTRICAL COLLECTOR SYSTEM
|
DERRICK BARGE, 2 TUGS SUPPLY BOAT | 20-25 YEARS |
Table 17 Pelamis Operational Activities Resources and Duration
7 investigate and analyse the economics, grid/network connection, and costs associated with marine energy generation
7.1 marine energy convertor economics
Although the marine energy convertor devices which have been chosen for each of the four locations are all different they all typically have the same components as follows:
- Dynamic power cables (floating MEC only)
- Submarine connectors and other submarine electrical systems
- Submarine power cables
- Generators and balance of on-board electrical plant (power electronic Converters, transformers, switchgear etc.
- Offshore substations
- Onshore substations and grid connections
Costs for each of the project areas are of course project specific and will vary for each of the respective project areas. However there will be the requirement for certain major components for each of the project areas; the costs for a typical marine energy convertor array are detailed in Table 18.
| COMPONENT | COST |
| GENERATOR | €40-€70/kW |
| POWER CONVERTOR | €90-€110/kW |
| POWER TRANSFORMERS | €40-€60/kW |
| SWITCHGEAR | €60-€100/kW |
| SUBMARINE CONNECTORS | SPLICE HOUSING: €60-€100 PER CONNECTOR,
DRY MATE CONNECTOR: €100-200K PER CONNECTOR, WET MATE CONNECTOR: €150-250K PER CONNECTOR |
| DYNAMIC POWER CABLES MV | €300-€800/M |
| SUBMARINE ARRAY CABLE MV | €300-€800/M |
| SUBMARINE EXPORT CABLES MV | €1000-€2000/M |
| OFFSHORE SUBSTATION | TOPSIDE €120-150K |
| ONSHORE SUBSTATION & GRID CONNECTION | €100-€250K |
Table 18 MEC Component Costs
In respect of charging regimes there are 2 approaches, one being “deep” charging and the other being “shallow” charging. With shallow charging the developer will have to provide the finances for all of the works right up to the electrical grid network point. This includes substation costs as well as costs associated with the extension of the existing network grid if required. With deep charging the developer must provide all the finances to complete the works, Figure 45 details connection of a new MEC the and the associated connection charge concepts where the device is depicted. Items which are marked in red within a shallow charging system would be picked up by the developer as well as up to the connection point of the existing grid (items marked in blue up). In respect of a deep charging system all upgrades to the existing network trafos, power lines, and breakers will have to be financed by the developer.
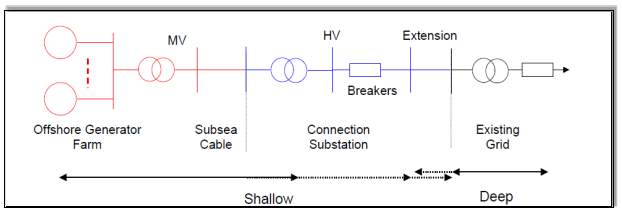
Fig 45 Connection Charging Setup
Although the preference within Ireland and Europe is for shallow charging regimes in order to encourage the generation of electricity through renewable energy there is still a preference for deep charging. Apart from the usual connection charges grid operators also apply Use of System (UoS) for the bulk transmission of generated energy to load centres. This is another means for grid operators to recoup the cost of system upgrades especially where shallow charging has been applied. The charge can be location dependent especially if the particular region has transmission losses or high reinforcement costs.
Flicker requirements are very important especially as regards the generator control system. Marine energy such as wave and tidal are by their nature pulsating although the pulsation frequencies are significantly lower than where flicker limits are at their most stringent the associated amplitudes are large. The flicker emissions must not be breached as if it is there is severe implications for the generator control system as there may be a requirement to reduce the pulsation through power smoothing. With power smoothing there is energy storage within the generator system. This will impose the requirement for variable speed control capability as well as power electronics convertors with electrical energy storage.
7.1.1 ECONOMIC CHALLENGES OF MEC’s
The MEC’s reviewed in this thesis are will need to be removed on a regular basis for maintenance purposes, this causes many issues including redundancy within the cable network there is also the requirement from a connection between the dynamic cable and static cable for floating MEC’s, there may also be the necessity for the MEC to be rapidly and quickly connected and re-connected to the existing electrical grid network thus showing the necessity for some form of connector or for two connectors when it’s a radical circuit. Each of the four sites are different however in general the seabed is predominantly rocky in all location and the areas which are to have tidal energy resource devices are most likely to be swept clear of most sediment. These conditions in each of the four location present very difficult conditions for laying cables as well as costly installation and methods of protection.
These methods include rock dumping, armour casing, rock trenching, concrete mattresses and horizontal directional drilling. These methods drastically increase the cable cost install and cause major issues to the sector. Sites need to be selected that have sufficient sediment so as to avoid expensive costs for installation methods as this goes together with the mooring requirements of wave energy systems. Challenges also need to be overcome as regards the dynamic power cables protection and this will entail numerous extra components such as stress relievers, bend resistors, scour protection and floatation module. The total cost of a submarine cable can be extremely volatile and there are many factors which can have an influence over the final cable cost. They are as follows:
- Materials Cost – Mainly copper and steel
- Mobilisation Cost – Especially if The Site Is Remote
- Seabed Conditions – This Will Have An Effect Upon The Installation Method
- Availability of Equipment – This Is Mainly Down To Market Demand
The main factors which affect the cost of any cable are as follows:
- The Cable “CSA” Cross Sectional Area
- The Cables Installation Costs
- The Voltage Rating Of The Cable In Particular The Insulation Rating/Thickness
All of the four sites have challenges which are common to all the installs which need to be overcome. These include access to sensitive equipment during simplistic faults such as battery chargers, digital protection relays, and power electronic convertors, these can cause large expense. Safety is also a key consideration such as having a point of isolation and earthling within locations where it is difficult to either verify this or even lock out. There are major issues in respect of multiple MV and LV connection of cables to a submarine hub; these situations require remotely operated vehicles operation and/or many expensive mate-able connectors. The is also the major issue as regards the lack of expertise in the area of installation and construction of submarine hubs
The current carrying capacity of cables is dictated by “IEC60287” The cable manufacturer will define the maximum permissible continuous current which is based upon the maximum conductor operating temperature. In respect of XLPE insulated cables the maximum conductor operating temperature is around 90°C, the cable must dissipate heat during normal operation so using the thermal properties of all of the cables components such as (insulation, sheats, screens, amour, filer and serving) the maximum permissible current is calculated. In respect of submarine cable specifications assumed values are used for the conditions and surroundings as detailed below:
- Burial depth of 1M
- Ambient temperature of 20°C
- Thermal resistivity of surroundings of 1 Km/W
- Sheaths bonded at both ends and earthed
Thermal resistivity, burial depth and the ambient temperature are under the control of the designer/installer as they also vary over the time so the maximum permissible current also varies. The four locations that this paper has reviewed all have similar seawater temperatures which vary on a seasonal basis between 6-15°C as does the land temperature which also varies on a seasonal basis between 3-17°C. There will of course be periods of extremes outside of these temperatures which entails that the cable ampacity will due to ambient temperatures also vary throughout the year.
7.1.2 METHODS FOR DEFINING THE COST OF MEC’S ELECTRICITY GENERATION
The cost of MEC’s can be expressed in several ways including the per unit cost of the device (cost/unit area), the cost of the device per rated power (cost/MW) and the per unit cost of generated electricity (cost/kWh), the cost of the device per rated power is the most favoured manner in which to calculate the MEC cost as is takes cognise of the following:
- The running costs of the MEC, which takes account of the costs involved in both the maintenance and operation of the device. These are typically the costs involved in the taxes, admin, insurance, telecommunications and servicing
- The capital costs should be separated into the site specific costs and the MEC device cost. The costs involved for a MEC typically consist of structural costs, turbine costs, electrical elements, control systems, foundation and mooring costs. The site specific costs are typically expenses associated with the design, specification, cabling, install costs, permits, connections to grid networks and expenses associated with commissioning
- There are also the expenses connected with the possible repayment of loans to investors and financial institutions.
As there are no fuel costs associated with MEC’s when initial install and set-up costs are finished, the only expenses after that are the ongoing maintenance and running costs. It is also envisaged that as the market for marine energy resources grow the costs will decrease. Through life-cycle costing (LCC), a more accurate cost as regards the evaluation of the economics of marine energy resource technology can be obtained. This method brings together all of the revenue and associated expenditure of any MEC device during its life cycle into one single standalone cost. The equation for calculating is as follows:

Where:
Cpv: Is The Capital Cost Of The Technology Which Is A Single Payment Which Occurs In The First Year Of The Project Irrespective Of The Finance Conditions
Mpv: Is The O&M Yearly Costs, This Includes Inspections, Salarys And Insurance
Fpv: Yearly Fuel Costs
Xpv: External Costs Such As Damage Prevention and Damage Loss
Spv: The Salvage Value Of The Device During Its Final Year Of Life
The rated power cost is then calculated by dividing by the rated power, as with any MEC the main issue is the expense that is involved in the generation of electricity. It is only viable from an economic aspect to generated electricity it the expenses involved in the generation of the electricity is lower than the existing tariff. Through the LEC levelised energy cost the unit cost per kWh can be calculated, the LEC gives an assessment of electrical generation costs over a specific period of time. This method details expenses which happen at irregular intervals as comparable to equivalent equal expense payments which occur at regular intervals, this method has the advantage that it gives an assessment of the LCC as repayments which are equal and annual. To calculate the LEC the annual LCC must be divided by the yearly generation of electricity and it is defined as unit cost/kWh. LEC’s are often used to make comparisons between emerging and new technologies.
There are of course other costs not all financial which need to be identified when ascertaining the full true cost of the generation of electricity. These are typically referred to social costs and effect not only the environment but also the people and wildlife. In respect of the costs that are associated with lifecycle emissions from the electrical generation achieved through MEC’s are very heavily dependent upon the heat and power mix which occurs during both the manufacture and install of any MEC device. Any environmental impacts are very much in proportion to any emissions which occur during the actual generation of electricity.
7.1.3 NETWORK AND GRID INTEGRATION
There are many common issues which onshore renewable energy generation has which are similar to marine energy resources, these include reactive power compensation and stability losses. Electricity which is generated by MEC’s must be brought onshore, in to keep transmission losses to a minimum the electricity is required to be stepped up to a higher voltage. The overall size of the required step-up transformer will be dictated by two major factors, first of all the marine energy current systems power capacity as well as the distance from the device to the shore. Direct current alternating current and high voltage alternating current are the two options required to obtain electrical offshore transmission.
Voltage and current are the major influences as regards electrical power transmission; AC is the favoured transmission as regards transmission of electrical power through the utilisation of (HVAC) high voltage alternating system. This is a reliable and mature technology that transmits at a high voltage electrical power as AC and typically consists of the following:
- Three-phase submarine cable
- Offshore substation containing transformers and reactive power compensation
- An AC collecting system at the MCED
- An onshore substation containing transformers and reactive power compensation
HVDC) usage is also favourable especially on an economic basics alternative to HVAC for long distance electrical power transmission. HVDC allows electrical power to be transmitted as DC at high voltages and resolves many of the stability issues than occur when offshore devices are connected to the grid. The HVDC contains the following:
- AC to DC convertors
- Transformers
- DC cable
- DC to AC convertors
- DC current filtering reactance
MEC’s require a reliable network grid connection to the site to ensure the electricity that is generated can be fed into to a grid network; all renewable energies are perfect base-load suppliers. The demand for electricity throughout the day varies with various intervals throughout the day seeing peak demand requirements. The advantage that marine energy generation has over other renewable energies is that it is fairly predictable and so it can match the supply with the demand which is a key integration of renewable energy. To maximise the economic potential of marine energy resources it is essential to have a reliable grid as poor grid stability will lead to major losses and issues such as this will lead to a limitation of generating capacity of the sites identified in this paper this will be an even bigger issue if the penetration rate is high. Each site will have to be reviewed as regards the possible requirement for deep reinforcement which is the requirement for additional hardware to the network downstream due to the addition of extra generating capacity. There is a requirement for a defined time period to be established for the starting of generators and the synchronisation of this with the grid. Load fluctuations can be forecast in advance and so decisions in advance can be made in respect of what particular system is required at any particular time. It should be commented on that asynchronous generators used with MEC’s can cause stress on the network this is Currently there is no single piece of legislation that details all of the requirements in-respect of energy grids within Ireland. There is however a large range of both primary and secondary legislation that come together to create the legal context for the electricity grid within Ireland, the relevant electrical obligations are detailed below in Table 19.
| OBLIGATION/INSTRUMENT | MAIN AIM |
| Renewables Directive
2009/28/EC |
Promotes the generation of electricity produced from renewable energy sources in the internal electricity market. |
| Sustainable Energy Act
2002 |
Regulatory framework for the generation of energy from the renewable sources Ireland. Under this Act the Sustainable Energy Authority of Ireland (SEAI) is required to promote and assist the development of energy from renewable sources, promote the redirection in greenhouse gas emissions, and promote research into renewable technologies |
| Electricity Regulation Act
1999 |
Gives the Commission for Electricity Regulation the power to grant licences to generate and supply electricity
Gives the Commission the power to grant authorisations for the construction of generating stations;
Provides for the access to the transmission or distribution system by licence holders, holders of authorisations and eligible customers |
Table 19 Relevant Electricity Related Obligations
As well as the above legislation there have been several initiatives and studies as regards the grid network to ensure the efficient implementation of renewables not only within Ireland but connections to the UK and Europe, these are as follows:
- ALL ISLAND GRID STUDY: This was a study between Ireland and Northern Ireland which attempted to research how the grid network across the whole island could be developed in a more economical effective manner so as to assist renewable sources generation of electricity. The study looked at four areas. The first aspect looked at the renewable resource available from all the various forms of renewable energy including wave and tidal. The second aspect researched how electricity which is generated from renewable sources can be accommodated on the grid network with regards to predictability and variability. The third aspect looked at the impact of renewable generation of grid operation in respect of cost and emissions as well as the required reinforcements to the gird that are required for the impact on renewable energy electricity generation. The final aspect took all of the previous reviewed elements and ascertained the economic cost and benefits that renewable energy generation has for society.
- GRID25 STUDY: The looks at the investment that is required in the high voltage system up to 2025. It looks to support growth in regions and to ensure the supply reliability. It looks at the exploitation of energy from renewable resources, carbon emissions reduction and a connection to the European grid network.
- FURTHER CONNECTION STUDY: This study was undertaken by Eirgrid and looks at the need for interconnections between Ireland the UK and Europe on various scenarios especially looking at high renewable electricity generation.
- OFFSHORE GRID STUDY: This study looked at how the electricity which is generated from offshore renewable sources will be integrated into existing grid systems and as to whether a second off-shore grid is required to be developed. The study also looked at where an offshore grid could be developed.
- NORTH SEAS OFFSHORE GRID INITIATIVE: This area has been identified as by the European commission as a key area for development. This grid would allow bulk transfers as well as exports between nine EU member states as well as Norway
“Grid 25” is a long term policy for the expansion of transmission networks throughout Ireland as well as assisting in Ireland’s goal to achieve the target of obtaining 40% of its electricity from renewable sources. There has presently only been a limited opportunity for these assessment to influence each other as the exact location of offshore renewable developments and the associated onshore connections have not been fully developed there is still an immediate need to provide the required capacity and network reinforcements to accommodate the future increases in renewable resources electrical generation, although there still remains major uncertainty as to where the increased capacity will need to be provided, this programmes will need to be flexible to respond to future developments.
8 future of marine energy in ireland and throughout the world
8.1 marine energy future challenges
In order for marine energy to make a significant impact upon not only Ireland’s but the world’s electrical energy consumption both the tidal and wave devices will have to be installed in sufficient numbers and be of sufficient generating capacity. To make a significant impact the individual power rating of devices will have to reach the megawatt scale; this will require major investment and infrastructure as if we were to take a generation figure of 1GW it can be assumed that if devices rated at 1MW with an average capacity factor of 30% this would mean 3000 devices being required. Devices of this size and generating capacity are expensive. The design, simulations and prototypes all also have to be factored into these costs even before the heavy engineering and fabrication even begins, the whole process can take many years.
The years to come will see both wave and tidal devices progressing from the drawing board to full scale prototypes, there has also much progress in the areas of maintenance, reliability and the survivability of these devices within the very harsh environments of the seas. For all this to happen will require the coming together of the following key elements which will produce coherent strategies on a national scale supported by governments,
- Investment And The Development Of Systems And Multi-Device Arrays
- Feasible And Economic Access In Coastal Areas Which Have High Marine Energy Resource Capabilities
- Proper Planning With Rigid Procedures That Work And Take Account Of The Environmental Impact That Both Wave And Tidal Devices Have
The delivery of both wave and tidal technology that is both reliable and cost effective is vital to the future of marine energy generation. In the short term there will need to be an increase in both wave and tidal device performance, reliability, this will increase market awareness and investment. In the medium term costs will have to reduce as both the markets and policy makers will have to see progress in this area in order to actively enter the market. In order for both wave and tidal technology to progress there will be the requirement for advancements in technology and full scale deployment of arrays, cost reductions will be driven by the following parameters:
- The Increase Of The Energy Yield As Well As Economic Return Through The Advancement Of Power Capture, Reliability And Survivability
- Increased Innovation In The Area With Advanced Components, Material And Concepts
- Ensuring There Is Optimum Production, Installation And Operation Of The Devices
- Lower Cost With Higher Capacity, Volume Manufacture As Well As Fixed Maintenance Costs Which Are Spread Over Many Devices
In order to further reduce costs the industry in the next few years needs to look an industry wide standardisation of voltages. From reviews most of the devices operate in the 6.6kV to 11kV range, there needs to be an optimal voltage range that is not only low enough so that commonly available wet and dry mate connectors which are limited to operate at between 6kV to 8kV can handle but also high enough for any current that is being produced can do so through a manageable cable size. Another focus for future development is research into how far the offshore voltages of 6.6kV to 11kV are able to operate before a higher voltage is required due to the high level of losses being unacceptable.
Most MEC’s produce AC power, presently DC is only being developed and moved onto the prototype phase by a small number of manufacturers. The industry needs to take notice of the advantages that DC offers especially as regards the benefits that are associated with the aggregation output of multiple units. The next step will be in the development of working offshore porotypes before the industry sees the benefit in deploying them on a wide scale commercial basis. The extensive use if both T and hub connectors will play a key role in the development of marine energy, there is a lot of expense associated with wet connectors and to have two on a device is not economical so the advantage that T connectors can offer needs to be further researched within the industry. Both floating wave and tidal devices will require to be connected to the subsea electrical infrastructure via dynamic umbilical cables. These cables are currently uses in the gas and oil industries and will in the future be deployed on a wider scale within the industry.
8.2 marine energy opportunities in irish market & abroad
It is expected that large scale wave energy arrays are not feasible until at least after 2020 as the technology behind the resource is still developing and there is also the issue that by that time the Irish renewable energy market will be saturated by wind energy. The addition of diversity within the renewable generation market will not only facilitate a reduction in overall intermittency but will also reduce the need for thermal back-up, there is also the benefit that the expensive transmission infrastructure costs involved in bringing the energy from their remote locations to the demand centres can be shared. The addition of more interconnections between Ireland and the UK as well as Europe will encourage the advancement of marine energy within the Irish market. High voltage direct current interconnectors can also facilitate the provision of synthetic inertia which will increase the limits of non-synchronous generation even further. Energy storage on a large scale will also increase the conversion if non-synchronous intermittent generation into dispatchable synchronous generation within the Irish energy market, these types of storage systems include pumped storage facilities and power to gas type.
Use could also be made of plants which are either redundant or close to becoming redundant. One plant which this applies to is the Moneypoint power plant in County Clare which is due for decommissioning within the next 10 years. The plant has two dedicated 400kV lines which come from the plant to the Dublin which is a major load centre. In conclusion the domestic market outlook for both wave and tidal energy is limited, however the addition of wave and tidal energy to the renewable energy mix will increase the use of existing transmission structures as well as reducing intermittency.If the large amount of both wave and tidal energy that is potentially available cannot be properly exploited within Ireland due to not only market but infrastructure issues then exporting of this energy needs to be properly explored especially with large markets in the UK and France so close. Both the UK and France have ambitious targets which need to be achieved if their 2020 targets with France having to have 23% of its gross energy from sources and the UK having to achieve a target of 15%. This represents an opportunity for Ireland however the cost of importing renewable energy for the importing country are high and this will be a critical factor if Ireland is to become an exporter of its indigenous marine energy. There are two main ways in which marine energy generated within Ireland can be generated to export markets.
The first way would be through an integrated export network involving several interconnectors between Ireland and the export markets, there is also the option of a dedicated transmission infrastructure from the marine array through to the export market. This would involve long distances from the infrastructure high voltage direct transmission would be the only possible answer for the potential transmission for the connection of Irish marine arrays to both the UK and the Europe. HVDC is both cost efficient and more cost effective than HVAC, the elements involved in a HVDC system to transport marine generated power would be HVDC converter stations, Offshore platform (Which is at the marine energy generation source), Offshore cables and Onshore cables.
8.3 CONCLUSION
Ireland has a rich wave and tidal energy resource potential and with advancements in both efficiency and technology these resources can be exploited for their vast potential and make a significant impact upon the domestic and international electrical power generation requirements. The potential in Ireland for electrical generation from renewable resources is huge and wind power is leading the way, it is expected that by 2020 Irelands domestic demand for renewable electrical generation can be by onshore wind generation alone. In the coming years the growth of demand inelectrical generation from marine energies will be dictated from two main areas, firstly the ability of the electrical grid and transmission systems to cater for non-synchronous generation before there are issues with power system stability. Secondly the growth in electrical demand especially in the domestic market will be a key factor in the growth in demand for marine energy, there is also the issue that the growth of both wave and tidal energy may be stifled by the success of wind energy. In order for both wave and tidal energy to become an attractive option they must both become more commercially attractive.
Reliability is also a key factor as these devices are mostly working under water, far from the port and so it is important that the device requires as little maintenance as possible but also be reliable to achieve this developers have been trying to keep the number of components to a minimum as well as removing of components such as breaks, convertors, gears etc. Marine energy resource development will only grow if it becomes more economical, the cost of the installation, maintenance and operating of a device must not exceed the income it can generate through the generation of electricity. If energy prices are high and there is sufficient support from governments the industry will grow, it is very important that the devices are optimised in both respect of performance and cost.
The Irish government also has a key role to play, in order to stimulate development the government needs to develop a long term strategic plan and communicate this commitment to the industry as well as energy utility companies. The governments and the large companies are the key players and they have the power and the means to not only increase the deployment of marine energy but to also make it a viable attractive market. There is no denying that Ireland has a bountiful resource in respect of both tidal and wave energy but the issues in respect of economics and technology will need to be advanced and the challenge going into the future will be to see where both wave and tidal energy’s future lie in Irelands long term renewable energy mix.
8.4 future work
Although there have been many studies to date which have addressed the economic aspects of marine energy there is still further research required especially in the area of maintenance and operation costs. More research is required in areas such as network integration as well as the long term environmental and economic impacts to the fishing and shipping industries. There appears to also be a lack of research upon the potential social impacts that large scale marine energy resource developments will have especially as regards job creation and the effect such developments will have upon coastal communities.
Future research will be required as both the tidal and especially the wave arrays move from prototypes into commercial array development. Research will be required on the devices and their associated integral components as to how they stand up to the harsh environments and extreme weather conditions that they will have to operate in. Research is also required in the area of offshore substations in respect of both the economics and the technology that is required to make them feasible in such harsh environments. Another area to review would be the combination of marine resources especially with the more mature technology of wave energy resource, as these forms of renewable energies can be unpredictable as well as intermittent the combination of them makes sense making them a more attractive proposal for developers.
Another key area for research is the development of the devices as regards their visual impact and the planning issues they will face, presently floating or semi-submerged platforms are the preferred option for many marine energy resource devices as they are more advantageous as regards maintenance and repair. However these types of designs are acceptable if they are far from the shore but issues arise if they are close to the shore. Further research is therefore required in the design of near shore devices and arrays, consideration may have to be given as to if the power conversion can happen onshore or even within the marine device itself.
9 Reference
- SEAI, Sustainable Energy Authority of Ireland, Renewable Electricity In Ireland 2015, 2016 Report
- Chakrabarti, S.K. and K.C. Subrata, Ocean Environment, in Handbook of
Offshore Engineering. 2005, Elsevier: London. p. 79-131.
- Hwang, I.S., Y.H. Lee, and S.J. Kim, Optimization of Cycloidal Water
Turbine and the Performance Improvement by Individual Blade Control.
Applied Energy.
- Palmer, J., The Tide is Turning. The New Scientist, 2008. 200(2677): p. 35-36.
- Boyle, G., Renewable Energy Power for a Sustainable Future. Second Edition ed. 2004: Oxford University Press.
- Ferro, B.D., Wave and Tidal Energy: Its Emergence and the Challenges It Faces. Refocus, 2006. 7(3): p. 46-48.
- SEAI, Sustainable Energy Authority of Ireland, Renewable Electricity In Ireland 2015, 2016 Report
- SEAI, Sustainable Energy Authority of Ireland, Energy-in-Ireland-Key-Statistics-2015
- Magagna D, MacGillivray A, Jeffrey H, Hanmer C, Raventos A, Badcock-Broe A, et al. Wave and tidal energy strategic technology agenda. Strategic initiative for ocean energy (SI Ocean); 2014.
- Corsatea TD, Magagna D.Overview of European innovation activities in marine energy technology. Luxembourg: Publications Office of the European Union
- J. Grimwade, D. Hails, E. Robles, F. Salcedo, J. Bard, P. Kracht, et al., Review of Relevant PTO Systems. D2.03, MARINET, Cork, 2012.
- Khaligh A;” Energy Harvesting”. Illinois Institute of Technology 2008
- RenewableUK (2012) Marine Energy in the UK, London.
- Carbon Trust (2011) Marine Renewables Green Growth Paper, London.
- R.H. Clark. Elements of Tidal-Electric Engineering, Wiley-Interscience: New York (2007)
- J.H. Simpson, J. Sharples, Introduction to the Physical and Biological Oceanography of Shelf Seas, Cambridge University Press, 2012
- O Rourke, F; Boyle, F; Reynolds, A. “Tidal energy update 2009”. Applied Energy 2010
- Khaligh A;” Energy Harvesting”. Illinois Institute of Technology 2008
- P. Neill, MR Hashemi, MJ Lewis, Tidal Energy Leasing and Tidal Phasing, 2016.
- Clark RH. “Elements of tidal-electric engineering”. Wiley-IEE; 2007
- Sustainable Energy Ireland, Tidal & Current Energy Resources in Ireland. 2004
- The JRC (Joint Research Centre)
- D. Magagna, A. Uihlein / International Journal of Marine Energy 11 (2015) 84–104
- Denny,E. “The Economics of Tidal Power”. Power and Energy Society 2010 IEEE
- National Oceanic and Atmospheric Administration
- National Weather Service – National Oceanic and Atmospheric Administration. “Definition of significant wave height,” 2011
- A Global Wave Energy Resource Assessment, Cornett, 2008
- Marine Institute “Sustainable Energy Ireland”, Accessible Wave Energy Resource Atlas, Ireland 2005
- The Crown Estate, “Wave and Tidal Energy in the Pentland Firth and Orkney
Waters: How the Projects Could be Built,” The Crown Estate, 2011.
- Recent Advances in the Development of Wave Energy Converters Leichtweiß-Institute, Department of Hydromechanics and Coastal Engineering, Braunschweig University of Technology Beethovenstrasse, September 2013
- Boyle, G., Renewable Energy Power for a Sustainable Future. Second Edition
ed. 2004: Oxford University Press.
- Sustainable Energy Ireland, Tidal & Current Energy Resources in Ireland, 2004
- O’Rourke, F., F. Boyle, and A. Reynolds, Marine current energy devices Current status and possible future applications in Ireland. Renewable and Sustainable Energy Reviews. 14(3): p. 1026-1036
- Batten WMJ, Bahaj AS, Molland AF, Chaplin JR. Experimentally validated numerical method for the hydrodynamic design of horizontal axis tidal turbines. Ocean Engineering 2007;34(7):1013–20
- ESB International, Marine Institute, and Sustainable Energy Ireland, Accessible wave energy resource atlas: Ireland: 2005.
- Marine Institute M-Buoy Network (Marine Institute 2012)
- Gallagher, S., R. Tiron, E. Whelan, E. Gleeson, F. Dias, and R. McGrath. “The
Nearshore Wind and Wave Energy Potential of Ireland: A High Resolution Assessment of Availability and Accessibility.” Renewable Energy 88 (2016): 494–516.
- Gallagher, S., Tiron, R. & Dias, F., 2014. A long-term nearshore wave hindcast for Ireland: Atlantic and Irish Sea coasts (1979–2012). Ocean Dynamics, 64(8), pp.1163–1180
Cite This Work
To export a reference to this article please select a referencing stye below:
Related Services
View all


Related Content
All TagsContent relating to: "Energy"
Energy regards the power derived from a fuel source such as electricity or gas that can do work such as provide light or heat. Energy sources can be non-renewable such as fossil fuels or nuclear, or renewable such as solar, wind, hydro or geothermal. Renewable energies are also known as green energy with reference to the environmental benefits they provide.
Related Articles

DMCA / Removal Request
If you are the original writer of this dissertation and no longer wish to have your work published on the UKDiss.com website then please: