Survival Analysis and Supply Chain Financial Risk: United Kingdom Evidence
Info: 13144 words (53 pages) Dissertation
Published: 11th Dec 2019
2 CHAPTER 2: THEORETICAL FRAMEWORK AND LITERATURE REVIEW
2.1 The theoretical foundation
3 CHAPTER 3: RESEARCH DESIGN, METHODOLOGY, AND DATA
3.2.1 Cox Proportional Hazards Regression (CPHR)
3.2.2 Multiple Discriminant Analysis (MDA) and Logistic Regression (LR)
3.2.3 Regression Validation test
3.2.4 Hypotheses and Statistical test
3.3.3 Population, the sample size, and the sampling method
4 CHAPTER 4: PRESENTATION AND INTERPRETATION OF RESULTS
5 CHAPTER 5: SUMMARY, CONCLUSIONS, AND RECOMMENDATIONS
Abstract
The purpose
An investigation of Cox Proportional Hazards regression (CPHR) capabilities to evaluate events within the supply chain: whether there is possibility of the financial failure to occur and the expected survival time
Methodology
This research uses two legacy algorithms which are Multiple Discriminant Analysis (MDA) and Logistic regression (LR) as benchmarks to compare CPHR competency and accuracy to make a correct failure prediction for 60 financially ‘healthy’ companies and 60 bankrupt firms within the three-year period. However, regarding survival time, this paper uses k-means clustering approach and survival curves created by CPHR to investigate the timing of the bankruptcy
The outcome
The results have confirmed that CPHR can predict the chance of bankruptcy and is capable of evaluating data same precisely as MDA and LR. Moreover, survival curves and its function estimate firms’ probability to remain ‘healthy’. Therefore, supply chain managers could use these curves to evaluate financial risk of suppliers or customers within the chain
Authenticity
These methods are applied to the United Kingdom companies’ data for the very first time. On the other hand, similar research has been conducted based on the United States companies’ data
The type of study
Experimental research paper
Glossary of terms
Algorithm
A set of rules or process which must be followed while performing calculations
Accuracy
The quality or condition of being correct in judgment
Bankruptcy
A legal status when a company or person are not capable of paying their debts anymore
Capital
The wealth in the form of money
Disruption
The problems which interrupt the event
Estimation
A rough calculation or judgment of the value
Event
A significant matter that occurs or takes place
Finance
The management of large quantities of money
Financial risk
It is a potential loss associated with finance
Hypothesis
A proposed explanation made on limited evidence
P-value
A definition of the probability in a hypothesis test
Ratio
The quantitative relationship between two amounts
Regression
It is a process to estimate a relationship between variables
Sample
A small quantity of something (e.g. A part of the whole population)
Significance level
It is a probability of rejecting the null hypothesis (i.e. Usually below 5%)
Standard deviation
A quantity expressing by how many members of a group differs from the mean value
Standard error
A measure of a statistical accuracy of an estimate
Statistical model
A mathematical model which implements a set of assumptions
Supply chain
The sequence of processes involved in the production and distribution
Survival analysis
A branch of statistics to analyse the duration of time until the event will occur
Variables
An element which tends to vary
1 CHAPTER 1: INTRODUCTION
1.1 Background
The pace of globalisation fosters the opportunities for the supply chains (SCs) to expand; it creates a risk of adverse outcomes and challenges companies around the world. SC risk management team has techniques to identify and describe the nature of the risk in SCs, to evaluate the probability of the event and to determine the consequences of each registered risk which might result in SCs flow disruption. Risk management has two types of essential activities which relate to decisions about a supply chain. The first activity is principally strategic. The second is the execution. The first policy designs a structure of the supply chains, it identifies risks and devises a plan to succour in mitigating any adversity. The execution implements the most efficient ways of moving materials through the supply chains (Waters and Waters, 2011). Thus, the management teams, working in both divisions, are in charge of significant activities which determine SC damages. Earlier predictions lead to enhanced SC resilience, better financial performance, and safer company’s future. According to, a recent article about the supply chain risk, written by the FM Global website, the writer warns us that the UK’s decision to leave the European Union (a so-called Brexit), likely will create trade barriers in a variety of forms. The introduction of the EU single market policy in 1992, had enabled business to exchange services and products among the members freely. Although, the new UK-EU trade policy would lead to compliance and administrative costs for businesses. This article focuses on Brexit possibly outcomes for sourcing risks. This risk emerges when certain restrictions apply for the trades between suppliers or customers. The estimated cost for the supply chain to operate outside the UK is from 4% to 15%. For this reason, it might be one of the causes for catastrophic outcomes like financial bankruptcy to occur (Global and Posted, 2016). Moreover, sourcing from suppliers based in low-cost countries like China or India can be even riskier because of the loss of supplier capacity due to financial problems. On the other hand, many examples demonstrate that sourcing from these countries allows companies to maintain or enhance its end product competitiveness (Trent and Roberts, 2009). Overall, bankruptcy is very common occurrence in every country. The bankruptcy court of the United Kingdom reports statistics for the 12-month period ending 31st of March, 2016 of the companies which submitted bankruptcy orders: 14,507 in England & Wales, 924 in Scotland, and 344 in Northern Ireland (Insolvency service official statistics, 2016).
1.2 Problem definition
The companies can maximise their profit and grow if they only have a source of suppliers, provide attractive products or services and have a decent number of customers who willing to spend their income. The following research focuses on the supply chain (SC) disruption and the methods to mitigate the bankruptcy. Trends affect every industry and every company. Therefore, the London food supply chains are affected by trends, as well, and the risk of service failure is increasing. The changing capitals’ population profile has an impact on food and drinks sales. New trends contribute to higher consumer demand for different and choices. Moreover, a transport infrastructure is an issue too, because roads need to be upgraded all the time too. Thus, this brings significant challenges the logistic companies, to food and drink manufacturers and retailers. They must make sure they deliver products safely and promptly. If companies fail in providing products and satisfying customers, their businesses might face a risk lead to insolvency which is the result of lack of assets and a high number of liabilities (Sue Knief, 2016). The issues above represent the reasons why financial risk might emerge within the SC.
Thus, the problem of this research relates to survival analysis and alternative algorithms which can help to estimate financial risk within the supply chain.
Also, this study has two subproblems which are expected to be analysed:
SUBPROBLEM 1: To evaluate the competence and accuracy of Cox Proportional Hazards Regression (CPHR), a new, survival analysis algorithm, to make correct predictions while applying ‘’healthy’’ and bankrupt companies’ data
SUBPROBLEM 2: To estimate the financial risk (survival time) within the supply chain using Cox Proportional Hazards Regression (CPHR) survival curves
1.3 Limitations of the study
This research has some limitations. The data set within this paper consists only of the companies based in the United Kingdom. Thus, this research does not represent reliable results for the global supply chain managers. The research which includes the companies’ data from different world parts would be more representative. In that case, the results might surprise us because every country around the world has different accounting standards. The other significant limitation is covariates. This study examines only four ratios and the firms’ age. The investigation using different variables might result in different and more accurate results. Finally, this study is limited mainly to CPHR model analysis. Survival analysis has other methods which might be helpful to investigate too while predicting financial distress.
1.4 Structure of the research
To have a clear understanding what are the logical steps to solve the issues of the study we need to take a look to the following structure:
- The second chapter will present a brief literature overview about the supply chain’s (SC) relationship with the financial distress event within the company’s environment. Also, the survival analysis results investigated by the other authors will take part in the same chapter as well.
- The third chapter will contain precise details about the proposed quantitative research design. The methodology of this investigation is related to three statistical models: Cox Proportional Hazard Regression (CPHR), Multiple Discriminant Analysis (MDA), and Logistic Regression (LR). The third section will comment on the reasons for choosing this approach. Finally, the data which will consist of ratios calculated from companies’ financial statements will be the last point which concludes the whole chapter.
- The chapter four will present analysis and the results of this study.
- The final chapter five will summarise and discuss the outcome of the proposed research and will present the implications for the supply chain (SC) risk management team.
2 CHAPTER 2: THEORETICAL FRAMEWORK AND LITERATURE REVIEW
It is crucial to remember that the problem of this research relates to survival analysis and other algorithms which are capable of predicting financial risk within the supply chain (SC). The ability to estimate the risk is important to every company. The subproblem seeks to find out which set of rules should be the number one choice for the SC managers who are striving to predict adversities within the business. Moreover, the first research subproblem will cover the statistical comparison between Cox Proportional Hazards regression (CPHR) method which belongs to survival analysis, Multiple Discriminant Analysis (MDA), and Logistic Regression (LR) which are the traditional algorithms. Likewise, the second research subproblem will suggest how survival analysis can assist to SC customers or suppliers to predict the optimum timing before the occurred bankruptcy. Thus, the intention of this chapter is to present the four following sections:
- The first section will summarise theories of the research problem and subproblems.
- This second part will analyse the methodologies of the past empirical documents which relate to this research.
- The summary section will restate the relationship between the theories and the methods.
- The conclusions will finalise the whole chapter.
2.1 The theoretical foundation
The system of organisations which is called supply chain has many different types of risks. These risks are categorised and usually have similar definitions like delays risk, disruptions risk, supplier capacity constraints risk, transportation risk, technology risk, inventory risk, procurement risk, capacity inflexibility risk, design risk and poor quality risk (Wu and Blackhurst, 2009). This research is concerned with the analysis of delays and capacity inflexibility risks (i.e. Supply and demand risks). Clearly, these two types of risks are the major factors which cause issues. Wu and Blackhurst (2009) define delays risk as a cause of suppliers’ inflexibility. On the other hand, the capacity inflexibility risk refers to an inability to respond to changes in demand. Also, these risks can be classified as external risks which mean that the challenge to mitigate them within the supply chain is even more challenging because it can cause bigger, severe and adverse financial consequences. For example, Bundschuh (2003) has investigated that supply chain reliability is one of the most important goals within the company. Thus, the author has created a supply chain model which involves constraints of robustness and reliability. Ostring, 2004 loss of suppliers’ efficiency is defined as a loss in monetary value, anticipated loss of reputation and possible loss of regular customers. Brigham and Daves, 2002 has assured that demand risk is one of the most significant risks that firm has to deal with because sales are an essential factor to all companies’. Overall, the performance of the supply chain productivity mainly depends on suppliers and customers.
The risk mitigation plan within the supply chain has many different approaches according to the sources of literature. For example, Elkins (2005) offers 18 optimum practises how to alleviate supply chain risks. It is clearly stated that firms do not have to implement all of these methods to be able to mitigate adversities. The companies should choose the methods which are the most applicable in their case. Some of these methods require a minimal level of investment, providing the instant results while other are designated for a long-term purpose. Kleindorfer and Saad, 2005 have created a SAM framework for supply chain managers. This framework defines three main which must be practised as an efficient risk management foundation. These tasks were classified into the following steps: to identify the sources which specify risk and vulnerability, to assess the whole situation and to choose the most appropriate mitigation plan. The improvements to management capabilities to predict financial risk within the supply chain will result in effective company’s management.
2.2 The critical review
The bankruptcy prediction became one of the biggest concerns since 1930’s based on the literature. These initial studies are related to the concerns how to utilise ratios for the predictions efficiently. At the very beginning, all focus was only on the single ratio analysis. However, the first multivariate study to predict bankruptcy, which is still very popular these days was published by the well-known around the world Professor Edward I. Altman. Overall, there many different statistical approaches to estimating bankruptcy. It is important to note that survival analysis is more often used for the discussion of death in the biological organism and failure in the mechanical system. However, there are studies in the literature of this application for business failure purposes as well. There has been done relatively few studies to assess financial risk within supply chain using survival analysis method.
Lane et al. (1986)have investigated and presented the first paper based on Cox Proportional Hazards regression (CPHR) suitability to predict bankruptcy. This study presents an observation of a large sample. The investigation time frame was from 1979 to 1984. However, this study analyses bankruptcy based on annual companies’ report. The analyses present the results which claim that CPHR is a comparable with other methods to measure risk. However, we can conclude that this study was not necessarily reliable for these two reasons: 1) it was a first research based on CPHR 2) the data used was annual ratios which might not necessarily be accurate.
T. Shumway (1999) has argued that steady (static) models are cannot be a reliable solution to predict bankruptcy. His main argument is that observing only bankrupt companies’ data and ignoring the fact that ‘healthy’ businesses have a chance to bankrupt too is a risky method. Thus, he developed a simple CPHR model that uses all available information and estimates each firm’s bankruptcy risk. He uses many different accounting variables (Altman, 1968 and Zmijewski 1984) to estimate these models. The results have revealed that half of these variables are statistically significant which means that there is a difference between these values. The half of these variables are defined as statistically unrelated to bankruptcy probability. He found that CPHR model theoretically is more reliable. This method can assess risk based on time-varying covariates.
The critical opinion regarding these reliability assumptions is that only the right amount of evidence can decide which method and model are capable of making the best prediction. Also, every bankruptcy case is different. Thus, it requires deep assessment based on various methods.
M. Honjo (2000) was interested in researching how firm’s age is related to the bankruptcy. Thus, he examines 2,488 new businesses to find the answers this research problem. The main focus was on new companies which have a small capital. The results have found that the age is a very significant factor which leads to the bankruptcy. The firms under the age of 6 had a higher probability to fail. The Cox Proportional Hazards method had performed extremely well. Thus, it is evident that the first six years for the company is a dangerous time, which means that there should be an even more significant analysis implemented and the whole performance monitored to avoid financial distress. However, the main issue within this research was that the author had main the assumption that the age is related to the bankruptcy based only on one model analysis. Also, the model validation test to determine how accurately this model could apply in general was not implemented. Hence, it is not enough of evidence that the age could be the main leading factor which determines the bankruptcy in other cases.
Z.M. Noor and T.M. Iskandar (2002) have applied CPHR model to assess financial distress of Malaysian companies’. The period was 2005-2011. They have investigated 57 bankrupt businesses and made a conclusion that CPHR is capable of providing survival probability based on two variables: managerial ownership and the size of the company. However, the authors were aware that assessing only bankrupt companies’ data is not very reliable method since it does not provide information with an overall picture of the industry.
Cochran et.al (2006) has investigated the financial risk of Internet companies. CPHR was the only one model examined in this study. The results have concluded that the biggest predictors to decide whether the company will fail or not were: Net Income/Total Assets, Cash Flow/Total Liabilities, Cash Flow/Total Assets. Also, this study has utilised all CPHR capabilities and used event time model (dynamic model). The outcome has shown that liquidity provides more accurate results one year before the bankruptcy compared to profitability. This study just proves that CPHR method is a powerful tool in assessing all kinds of business.
B. Machielsen (2016) has presented one of the very latest Cox Proportional hazards analysis results. The investigation was focused on publicly listed firms in the European Union. This research has analysed the best methods to measure the probability of the bankruptcy. The outcome was surprising because CPHR results were not as accurate as expected. The Multiple Discriminant analysis using Ohlson (1980) variables had presented the highest accuracy when the validation test was performed. However, regarding bankruptcy prediction, Cox Proportional Hazards analysis was a still important method. The Logistic regression has provided similar results. Unfortunately, the performance of these models declines under a changing macroeconomic environment. On the other hand, I could argue that the set of Ohlson (1980) variables used within this research might be the reason why MDA has resulted as the most accurate method. Hence, maybe different sets of variables (Altman,1968 or Zmijewski,1984) would have produced a different outcome.
2.3 Summary
The literature overview can be concluded that CPHR is a very useful method to determine the probability of bankruptcy. All different studies have resulted positively despite the fact the fact that different variables, industries, time-frames and countries were investigated. The CPHR has performed same well as the other statistical methods. Unfortunately, it is evident that different sets of variables can result in more or less results outcome when applied to various, other methods like Multiple Discriminant analysis or Logistic regression. The reason for this might be that models have different capabilities to utilise the information.
2.4 Conclusion
The past empirical studies have provided a vast range of information which might be very useful in practice to determine the desired outcome. Although all scientific methods can be helpful for the investigation, it is important to understand that all cases are different. Thus, it means that the outcome can be different too. It is evident that it is always better to seek to obtain results for a short time period because it might be more reliable. The analysis is just the assumptions of what might happen in the future, and it does not guarantee 100% accuracy. The macroeconomic environment can change anytime unexpectedly. There is always a risk. It can result in more positive or more negative outcome. For this reason, it is crucial to perform different types of analysis and compare the results. Also, the addition plan should be considered in the case of the outcome which was not expected. Therefore, the current proposed research will investigate the data of companies’ located in the United Kingdom. This study will provide other evidence whether Cox Proportional Hazards regression is a powerful tool to determine the performance of the business or not.
3 CHAPTER 3: RESEARCH DESIGN, METHODOLOGY, AND DATA
This chapter presents the four main sections. Firstly, the intention of this chapter is concerned with revealing the reasons for choosing this particular design of the study. Secondly, this chapter introduces the statistical methods which are the solutions to investigate each subproblem. Thirdly, the next section will discuss the data which is needed, the sources, and the methods for gathering all the information. Also, the population, the size of the sample, and the sampling method will be the part of the discussion. The knowledge about the available solutions to our subproblems, the data which is needed to solve the issues, and the methods how to choose the right data will help to deal with the main questions of this study.
3.1 Research design
The definition of the research design refers to the strategy which helps effectively resolve the problem of this study. This strategy guides us how to link different components of the study in a logical and sequential way (Labaree, 2009).
The research type chosen for this study is ex-post facto research which analyses the independent variables that have already occurred, and afterwards, the researcher observes dependent variables (Kerliger, 1970).
The methodology of this research is purely quantitative. The main rationale behind the choice of this particular approach is that it offers many different methods for a researcher systematically investigate the social phenomena. The quantitative research uses statistical or numerical data. As a result, it assumes that the issue of the study can be measured. For this reason, it involves measurements (Watson, 2015). The features of this approach suit this study because the research problem is concerned with the statistical methods in predicting financial risk within the supply chain. Also, the subproblems are looking to evaluate the accuracy between few different statistical methods and focus on a possible method to deal with timing issues which might be advantageous for a supply chain manager to mitigate financial risk. The quantitative research has four main types: descriptive, correlational, quasi-experimental, and experimental (Hitchcock, 2012).
In this case, it is an experimental study which follows deductive research tradition. This tradition involves the testing of a predetermined hypothesis. This research strategy lets us manipulate the independent variable and find out how it is going to affect the dependent variable of the study (Watson, 2015).
3.2 Methodology
Two main subproblems refer to the approach to investigate the main problem which is concerned with helping to supply chain (SC) customers or suppliers to predict financial risk (event and time) within the chain and avoid the disruption.
SUBPROBLEM 1: To evaluate the competence and accuracy of Cox Proportional Hazards Regression (CPHR), a new, survival analysis algorithm, to make correct predictions while applying ‘’healthy’’ and bankrupt companies’ data
3.2.1 Cox Proportional Hazards Regression (CPHR)
Cox Proportional Hazard Regression (CPHR) can predict the time interval until the event will occur. This study will analyse the data using CPHR to anticipate the financial failure event. The ability to predict the event is the key factor for supply chain managers to mitigate the adversities within the company.
The hazard function h (t) below and the hazard rate will estimate time to financial bankruptcy:
ht=lim∆t→0+Pt ≤ T < t+ ∆t T ≥t) ∆t
- T represents a random variable which describes financial risk
- P (t ≤ T < t + ∆t| T ≥t) is the survival function
- ∆t is the cumulative hazard function
3.2.2 Multiple Discriminant Analysis (MDA) and Logistic Regression (LR)
To evaluate the accuracy of CPHR method this research uses the other two legacy methods which are Multiple Discriminant Analysis (MDA) and Logistic Regression (LR) to solve the first subproblem. These two approaches tend to classify a collection of objects into distinct groups. They use a classification principle. For example, if we want to estimate how likely we can expect approval for a mortgage based on our credit score rating we can use the logistic regression. The process is:
- To determine the number of people who tried to request a loan (population).
- To identify their credit scores (independent variables).
- To classify their scores as ‘approved and not approved.’
This process classifies independent variables into the distinct groups and calculates the probabilities of being approved or not approved.
3.2.3 Regression Validation test
This research uses regression validation test which is called ‘’leave-one-out cross-validation. This method is a technique which assesses statistical analysis results based on the independent data sample. The main goal is to determine how the results of the analysis would perform in practice. This technique uses the training set which is all 120 companies (known data) in this case and creates a testing set for the evaluation. The cross – validation technique gives an instant error rate, which shows how well the model has performed based on the ‘leave-one-out’ sample (Holmes, 2005). The CPHR, MDA and LR are tested using this method, and the number of wrong predictions (errors) is compared.
SUBPROBLEM 2: To estimate the financial risk (survival time) within the supply chain using Cox Proportional Hazards Regression (CPHR) survival curves
The second subproblem uses a k-means clustering algorithm for vector quantization. The main aim of cluster analysis is to divide the total number of observations (e.g. The data of companies within the supply chain) into the cluster groups. These groups are created to analyse observations which share similar characteristics (Halgamuge and Wang, 2005).
The following equation describes survival function which gives an instant conditional probability of the event when the survival of the company is longer than time t:
h (t, Xi) = h0(t)exp [βTXi]
- h0 (t) indicates the baseline hazard function. This baseline does not involve any parameters and considers to be the same for all the companies (it depends only on time)
- The exp expresses the parameters
- βT is the risk (beta) which equals to zero
- Xi marks a vector or explanatory variables (i includes different features of various firms)
- The whole part denotes hazard ratios
These two methods above will contribute to finding the answers for the SUBPROBLEM 2.
3.2.4 Hypotheses and Statistical test
This study implements the ‘Null Hypothesis’. There are two types of statistical hypotheses:
(1) Null Hypothesis – It claims that there is no significant difference between specified populations. Any reference results only because of the sampling or the experimental error. The indicator is ‘H0’.
(2) Alternative Hypothesis – It is the contrary case of the null hypothesis. It claims that sample observations are affected by non-random cause, and ‘H1’ or ‘Ha’ represents this assumption.
To test ‘Null hypothesis’, we will use ‘Chi-Square Test’ as the main test to prove or deny our hypothesis. This test is a statistical method which is used to compare the data of the research with the data we would expect to obtain, according to the null hypothesis (Martin and Bridgmon, 2012).
3.3 Data
The data must be the main factor to consider before defining particular research design and problem. Beynon-Davies (2009) defines data as values of quantitative or qualitative variables.
3.3.1 Variables
This research uses four financial ratios as explanatory variables for the analysis:
- Working Capital/Total Assets (Liquidity ratio)
- Retained Earnings/Total Assets (Leverage ratio)
- Sales/Total Assets (Profitability ratio)
- Earnings before Interest and Taxes/Total Assets (Solvency ratio)
Moreover, the bankrupt firm’s age at the time of the failure event will be another variable. Likewise, this study will present the ‘healthy’ companies’ age as well. These variables will be another key factor helping to solve the problems of this research.
3.3.2 The sources and methods
Since this research is concerned with the financial risk, it means we will be accessing companies’ financial performance. The analysis of this research will be based on the event which relates to lodging the petition with the UK bankruptcy court (winding-up of a company/liquidation). The main sources of sample data set are an electronic recourse ‘FAME’ (Financial Analysis Made Easy) for the bankrupt corporations and the news agency ‘Bloomberg’ for ‘healthy’ companies (www.bloomberg.com). It is important to note that this study involves firms which operate within the financial sector, although they have particular environment and regulations.
The aim is to match liquidated companies’ data with healthy companies’ data during the same three years’ time interval. This study contains firms which belong to very diversified sectors’. Thus, it is a good representation of typical ‘Supply Chain’ structure.
The data will be collected following this process:
- The data of all officially liquidated companies in 2016 based on the availability of the financial statements for the last three years before the bankruptcy has occurred (2015,2014,2013) is identified and gathered using library electronic recourses ‘FAME’ (Financial Analysis Made Easy).
- The stratified sampling method (Excel) will help to determine the sample size, which is necessary for the analysis.
- Randomly selected firms’ data is downloaded based on the sector of each bankrupt firm. The Standard Industrial Classification (SIC) code is the method to identify these industries.
- IBM SPSS, JMP and Stata statistic softwares will provide CPHR, MDA and LR algorithms to analyse the data.
The aim is to match liquidated companies’ data with healthy firms’ data during the same three years’ time interval. The firms belong to a very diversified sector’. Thus, it is a good representation of typical ‘Supply Chain’ structure (Figure 5.)
3.3.3 Population, the sample size, and the sampling method
This experimental study will require 120 samples. According to, Borg and Gall (1979) sample size decision must depend on the research type otherwise it can have a negative impact. The authors recommend more than 50 samples for the experimental studies to achieve the best results.
Table 1 below shows the total number of bankrupt and healthy companies. This research will apply the stratified sampling technique. It is a probability method which enables us to choose the sample of random enterprises of the total population. It ensures that the right number of businesses from strata group (default companies) will have an equal amount of firms according to the population. This method will help to obtain more accurate research results.
Table 1. Distribution of thesis regarding their population
| Type of Population | Total population | Sample size | Percentage % |
| Bankrupt companies 2016 | 908 | 60 | 50 |
| Healthy companies | 45,324 | 60 | 50 |
| Total | 120 | 100 |
3.4 Research Ethics
The conducted analysis of the facts and circumstances declare that this research evokes no ethical issues for consideration by others. Accordingly, no further action on the research ethics front is warranted.
4 CHAPTER 4: PRESENTATION AND INTERPRETATION OF RESULTS
This chapter presents the interpretation of results. The results are split into two sections. These sections cover the analysis for each subproblem. In the first part, Cox Proportional Hazards regression method is applied to the bankrupt, and healthy companies’ data and the accuracy is compared with two benchmarks which are Multiple Discriminant analysis and Logistic regression. The complete accuracy evaluation is based on model validation test. In the second part, survival curves of Cox Proportional Hazard regression are analysed, and the method how to alleviate supply chain’s risk is suggested.
SUBPROBLEM 1: To evaluate the competence and accuracy of Cox Proportional Hazards Regression (CPHR), a new, survival analysis algorithm, to make correct predictions while applying ‘’healthy’’ and bankrupt companies’ data
To begin with, Table 2 presents descriptive statistics for the data used in this research. The results of the predictive errors based on the different type of models are shown in Table 3, Table 7 and Table 11.The prediction time horizon is 12 months, 24 months and 36 months before the bankruptcy. This subproblem defines the event which is bankruptcy. Thus, the CPHR hazard ratio represents the risk for this event to occur and the survival defines the probability to ward off bankruptcy or to ‘survive’. The different sets of variables are used to for the CPHR, MDA and LR analysis. These variables create a different type of models which are defined as steady and adjusted models. The steady models use measurements of one specific point in time, and the adjusted models use the data of the steady models and also include variables which are the differences (trends) of the data within the whole three years’ observation period. All tables present the results of the errors. The ‘’Bankrupt companies (errors)’’ and ‘’Healthy companies (errors)’’ expressions depict the errors in predicting bankruptcy incorrectly.
Table 2. Descriptive statistics of the data
| N | Range | Minimum | Maximum | Sum | Mean | Std. Deviation | Variance | ||
| Statistic | Statistic | Statistic | Statistic | Statistic | Statistic | Std. Error | Statistic | Statistic | |
| Firm age | 120 | 65 | 4 | 69 | 1778 | 14.82 | 1.096 | 12.006 | 144.134 |
| R1 | 120 | 15.50 | 0.02 | 15.52 | 218.84 | 1.8237 | 0.21704 | 2.37755 | 5.653 |
| R2 | 120 | 36.03 | -18.60 | 17.43 | -49.49 | -0.4124 | 0.27564 | 3.01952 | 9.117 |
| R3 | 120 | 33.76 | -16.25 | 17.51 | -2.31 | -0.0193 | 0.23438 | 2.56752 | 6.592 |
| R4 | 120 | 58.57 | 0.00 | 58.57 | 458.50 | 3.8208 | 0.76877 | 8.42146 | 70.921 |
| S1 | 120 | 24.89 | 0.01 | 24.90 | 192.61 | 1.6051 | 0.21460 | 2.35087 | 5.527 |
| S2 | 120 | 24.04 | -22.91 | 1.13 | -24.62 | -0.2052 | 0.19688 | 2.15673 | 4.652 |
| S3 | 120 | 26.24 | -22.67 | 3.57 | 8.46 | 0.0705 | 0.20195 | 2.21230 | 4.894 |
| S4 | 120 | 29.84 | 0.00 | 29.84 | 269.72 | 2.2477 | 0.30122 | 3.29975 | 10.888 |
| T1 | 120 | 29.46 | 0.01 | 29.47 | 196.35 | 1.6363 | 0.24814 | 2.71821 | 7.389 |
| T2 | 120 | 9.13 | -6.20 | 2.93 | -5.54 | -0.0462 | 0.07497 | 0.82121 | 0.674 |
| T3 | 120 | 10.16 | -6.20 | 3.96 | 23.24 | 0.1937 | 0.09492 | 1.03983 | 1.081 |
| T4 | 120 | 29.46 | 0.00 | 29.46 | 336.94 | 2.8078 | 0.41538 | 4.55025 | 20.705 |
| Valid N | 120 | ||||||||
Notes:R=2015; S=2014; T=2013; R1, S1, T1=Working capital/Total assets; R2, S2, T2=Retained earnings/Total assets; R3, S3, T3=Earnings before interest and taxes/Total assets; R4, S4, T4=Sales/Total assets; Valid N=Total sample number
The errors for anticipating the bankruptcy 12 months in advance are disclosed in Table 3. In this case, we can see that the CPHR adjusted and LR steady models have an identical number of total errors. The CPHR adjusted model has made a wrong prediction for the bankrupt companies, reported that these companies are healthy, and accumulated 18 mistakes that are 30%. Therefore, LR steady model analysis has presented total 14 errors out of 60 bankrupt companies’. This number equals 23.7%. Furthermore, the CPHR adjusted model has predicted 23.7% incorrectly and made 14 errors within the sample of ‘healthy’ companies. Likewise, the LR steady model has calculated 18 mistakes that equal 30% of the sample. The initial results show the positive outcome. First of all, CHPR has performed same well as the well-known Logistic regression method. Secondly, the both models have predicted the bankruptcy 12 months before this event has occurred approximately 73.3% correctly.
The financial risk and the whole company’s performance can be defined using these or similar models. The misclassifications (errors) in each group are the indicators which must be considered. The different type of models can be created based on different principles. Thus, the outcome to predict the bankruptcy based on these principles could be better or worse.
Table 3. CPHR accuracy predicting bankruptcy 12 months before the event
| Model | Bankrupt companies (errors) | % | Healthy companies (errors) | % | Total errors | Overall errors % |
| Survival analysis models | ||||||
| CPHR steady | 11 | 18.3 | 18 | 30.0 | 48 | 35.0 |
| CPHR adjusted | 18 | 30.0 | 14 | 23.7 | 32 | 26.7 |
| Legacy models | ||||||
| LR steady | 14 | 23.7 | 18 | 30.0 | 32 | 26.7 |
| LR adjusted | 15 | 25.0 | 14 | 23.7 | 29 | 24.2 |
| MDA steady | 11 | 18.3 | 25 | 41.7 | 36 | 30.0 |
| MDA adjusted | 18 | 30.0 | 24 | 40.0 | 48 | 35.0 |
Notes: Steady models include data measured once in time; adjusted models define data used for steady models and include trends of variables
The statistical tests and the results which were performed in the CPHR model 12 months before the bankruptcy are shown in Table 4 and Table 5. These tests aid to test the null hypothesis which is the part of this research. Table 4 shows the residual sum of squares which is the discrepancy between the data and an estimation model. Table 5 represents p-value (Sig.) of the ‘’Omnibus tests’’ based on the whole model. The p-value 0.004 shows that this model is statistically significant (p<0.05) and it supports CPHR validity in this case.
Table 4. Omnibus tests for CPHR 12 months before the event
| -2 Log Likelihood |
| 574.499 |
Table 5. Omnibus tests for CPHR 12 months before the event
| -2 Log Likelihood | Overall (score) | Change from the Previous Step | Change from the Previous Block | |||||||
| Chi-square | df | Sig. | Chi-square | df | Sig. | Chi-square | df | Sig. | ||
| 559.460 | 13.229 | 3 | 0.004 | 15.039 | 3 | 0.002 | 15.039 | 3 | 0.002 | |
Table 6 shows the summary of the parameter coefficient (B), standard error (SE), Wald test, the degree of freedom (df), p-value (Sig.), the hazard ratio (Exp(B)) and confidence interval (CI) for each variable. This methodology of this research specifies four ratios as a part of the analysis. However, JMP Statistical software using step-wise selection has identified two main ratios and the age of firm which are the most significant independent variables. The p-value of R1 is 0.345 and R4 have 0.199. These values are not statistically significant. On the other hand, the p-value of firm age is <0.006. Overall, this variable has a positive effect on the whole model which is statistically significant.
Table 6. Independent variables for CPHR 12 months before the event
| B | SE | Wald | df | Sig. | Exp(B) | 95.0% CI for Exp(B) | ||
| Lower | Upper | |||||||
| R1 | 0.037 | 0.040 | 0.893 | 1 | 0.345 | 1.038 | 0.961 | 1.122 |
| R4 | 0.014 | 0.011 | 1.646 | 1 | 0.199 | 1.014 | 0.993 | 1.036 |
| Firm age | -0.050 | 0.018 | 7.516 | 1 | 0.006 | 0.951 | 0.918 | 0.986 |
Notes: R1=Working capital/Total assets (2015); R4=Sales/Total assets (2015)
The CPHR, LR and MDA estimated errors are presented in Table 7. In this case, we analyse the accuracy of CPHR 24 months before the event. The Cox Proportional Hazards regression steady model has the total number of 37 errors which is 30.8%. This model was capable of predicting 80% of bankrupt companies correctly and made only 12 errors. Equally, 58.3% for ‘healthy’ companies’ was predicted correctly, and it equals to 25 errors. However, bankruptcy 24 months before the event the most accurately was predicted by the LR adjusted model because the results show only 30% of mistakes. It means that prediction was 70% correct.
Table 7. CPHR accuracy predicting bankruptcy 24 months before the event
| Model | Bankrupt companies (errors) | % | Healthy companies (errors) | % | Total errors | Overall errors % | |
| Survival analysis models | |||||||
| CPHR steady | 12 | 20.0 | 25 | 41.7 | 37 | 30.8 | |
| CPHR adjusted | 18 | 30.0 | 23 | 38.3 | 41 | 34.2 | |
| Legacy models | |||||||
| LR steady | 12 | 20.0 | 24 | 40.0 | 36 | 30.0 | |
| LR adjusted | 15 | 25.0 | 23 | 38.3 | 38 | 31.7 | |
| MDA steady | 12 | 20.0 | 29 | 48.3 | 41 | 34.2 | |
| MDA adjusted | 14 | 23.3 | 26 | 43.3 | 40 | 33.3 | |
Notes: Steady models include data measured once in time; adjusted models define data used for steady models and include trends of variables
The model fit statistics are reported in Table 8 and Table 9. The p-value of the whole model based on data from 2014 is 0.036. It is <0.05 which declares that this model is same statistically significant as the model used for data of 2015.
Table 8. Omnibus tests for CPHR 24 months before the event
| -2 Log Likelihood |
| 574.499 |
Table 9. Omnibus tests for CPHR 24 months before the event
| -2 Log Likelihood | Overall (score) | Change from the Previous Step | Change from the Previous Block | |||||||
| Chi-square | df | Sig. | Chi-square | df | Sig. | Chi-square | df | Sig. | ||
| 560.072 | 11.887 | 5 | 0.036 | 14.427 | 5 | 0.013 | 14.427 | 5 | 0.013 | |
The summary of explanatory variables for Cox Proportional Hazards regression 24 months before the event is presented in Table 10. The same step-wise method is used to identify significant variables. In this case, the new S3 ratio and DeltaS3 trend were added on the top of the ratios of the model which was created to predict bankruptcy 12 months in advance. The most significant variable which increased the probability of survival is the again firm’s age of p<0.005. The p-values of other variables range from 0.983 to 0.039. The values are quite high and imply that ability to predict survival time decreases. It follows that in real life the best option would be to eliminate these variables to obtain more accurate results.
Table 10. Independent variables for CPHR 24 months before the event
| B | SE | Wald | df | Sig. | Exp(B) | 95.0% CI for Exp(B) | ||
| Lower | Upper | |||||||
| S1 | 0.054 | 0.129 | 0.176 | 1 | 0.675 | 1.055 | 0.820 | 1.359 |
| S3 | -0.003 | 0.122 | 0.000 | 1 | 0.983 | 0.997 | 0.785 | 1.268 |
| S4 | 0.021 | 0.034 | 0.388 | 1 | 0.534 | 1.021 | 0.956 | 1.091 |
| Firm age | -0.052 | 0.019 | 7.723 | 1 | 0.005 | 0.950 | 0.916 | 0.985 |
| DeltaS3 | 0.046 | 0.049 | 0.877 | 1 | 0.349 | 1.047 | 0.951 | 1.153 |
Notes: S1=Working capital/Total assets (2014); S3=Earnings before interest and taxes/Total assets (2014); S4=Sales/Total assets (2014); DeltaS3=difference between EBIT/TA in 2013 and 2015
The prediction for the 36 months before the event is shown in Table 11. The CPHR adjusted model has generated 26.7% of total errors. Also, this model has predicted only 14 errors for the sample which consists of bankrupt firms and 18 errors for the ‘healthy’ companies’. Clearly, it is not the best result again because the LR adjusted model has the outcome of only 24.2% for total errors. It indicates that the model has made a prediction for the whole 120 samples of bankrupt and healthy companies 75.8% correctly.
Table 11. CPHR accuracy predicting bankruptcy 36 months before the event
| Model | Bankrupt companies (errors) | % | Healthy companies (errors) | % | Total errors | Overall errors % | |
| Survival analysis models | |||||||
| CPHR steady | 12 | 20 | 25 | 41.7 | 37 | 30.8 | |
| CPHR adjusted | 14 | 23.7 | 18 | 30 | 32 | 26.7 | |
| Legacy models | |||||||
| LR steady | 12 | 20.0 | 23 | 38.3 | 35 | 29.2 | |
| LR adjusted | 15 | 25.0 | 14 | 23.3 | 29 | 24.2 | |
| MDA steady | 12 | 20.0 | 26 | 43.3 | 38 | 31.7 | |
| MDA adjusted | 18 | 30.0 | 24 | 40.0 | 48 | 35.0 | |
Notes: Steady models include data measured once in time; adjusted models define data used for steady models and include trends of variables
The tests which were carried out during this period are presented in Table 12 and Table 13. It verifies once again that the model which is statistically significant. In other words, the results emphasise that the p-value equal 0.023.
Table 12. Omnibus tests for CPHR 36 months before the event
| -2 Log Likelihood |
| 574.499 |
Table 13. Omnibus tests for CPHR 36 months before the event
| -2 Log Likelihood | Overall (score) | Change from the Previous Step | Change from the Previous Block | |||||||
| Chi-square | df | Sig. | Chi-square | df | Sig. | Chi-square | df | Sig. | ||
| 560.741 | 11.316 | 4 | 0.023 | 13.758 | 4 | 0.008 | 13.758 | 4 | 0.008 | |
Table 14 demonstrates the effect of the variables on the model separately. The ratios identified by JMP software are T1, T3, T4 and firm age as the most significant independent variables. We can see that the company’s age is the most powerful explanatory variable with the p<0.005 value.
Table 14. Independent variables for CPHR 36 months before the event
| B | SE | Wald | df | Sig. | Exp(B) | 95.0% CI for Exp(B) | ||
| Lower | Upper | |||||||
| T1 | 0.010 | 0.051 | 0.035 | 1 | 0.852 | 1.010 | 0.914 | 1.115 |
| T3 | 0.039 | 0.134 | 0.085 | 1 | 0.771 | 1.040 | 0.800 | 1.352 |
| T4 | 0.025 | 0.023 | 1.183 | 1 | 0.277 | 1.025 | 0.980 | 1.072 |
| Firm age | -0.051 | 0.018 | 7.743 | 1 | 0.005 | 0.951 | 0.917 | 0.985 |
Notes: T1=Working Capital/Total Assets (2013); T3=Earnings before Interest and Taxes/Total Assets (2013); T4=Sales/Total Assets (2013)
The experiments for Cox Proportional Hazards regression analysis using the data from three different periods of time aimed to evaluate how well and accurately CPHR, survival analysis model, can produce the results of the desired event. The legacy algorithms Multiple Discriminant analysis and Logistic regression were evaluated and used as the benchmark. To conclude, survival curves which were formed by CPHR model have the advantage of predicting the timing of the bankruptcy. However, it is discussed in the next section which is the part of SUBPROBLEM 2.
SUBPROBLEM 2: To estimate the financial risk (survival time) within the supply chain using Cox Proportional Hazards Regression (CPHR) survival curves
This section explains the method how to measure SCs financial risk using survival curves. In the first part of this research, the experiment was to apply Cox Proportional Hazards regression using different models and assess the ability to predict bankruptcy before the event. Thus, in this part, the experiment is to evaluate survival probability.
Figure 1. The survival curve for healthy firms
(Cluster group 1)
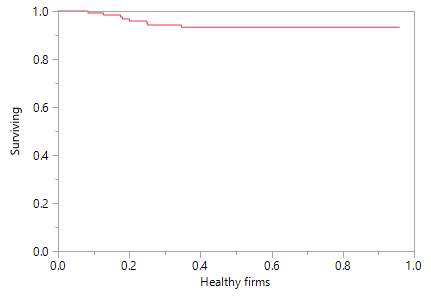
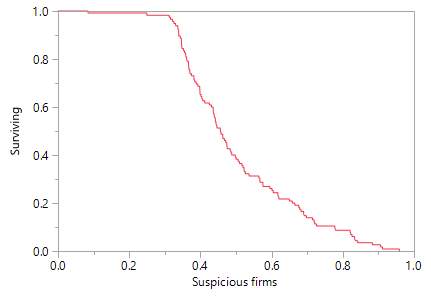 Figure 2. The survival curve for suspicious firms (Cluster group 2)
Figure 3. The survival curve for bankrupt
firms
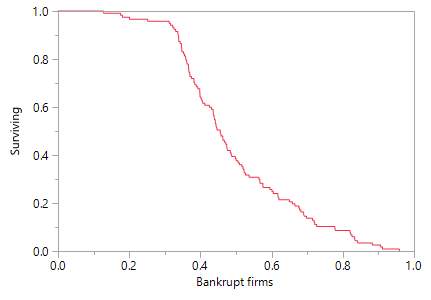 (Cluster group 3)
First of all, the, it is worth to remember that survival equation was explained in the previous chapter ‘Methodology’. In this section, we use a survival function as the primary method to evaluate the probability that firm will not become bankrupt within 12-month time horizon. Table 6 represents bankruptcy prediction using CHPR model 12 months before the event. The indicator B defines the effect of variables in this model on the whole survival time. It can be a positive effect if the value of B greater than 1 or adverse effect if the value is below one. The negative value of B indicated that variable decreases the survival time. In this equation, explanatory variable age has a negative value which means that firms which are older have bigger chance to become bankrupt within a one-year period. The coefficients which have a higher value in this model are R1 (0.037) and R4 (0.014). Thus, this indicated that companies which have high R1 and R4 ratios are more likely to survive longer. In this section, we use a survival function as the main method and time horizon from Table 6 to evaluate the probability that firm will not become bankrupt within 12 months.
The supply chain can have diverse groups. For instance, this research contains organisations from different industries too. To evaluate these industries, we use A-k means clustering algorithm. This method assigns cluster group to each of the companies based on their characteristics employed in the CPHR model. In this case, variables R1, R4 and age were assessed and considered as the main features of the cluster groups. Table 15 represents the results from A-means clustering algorithm. It shows that the group 1 has a mean of 0.5099 which is the highest. It indicates that this group contains healthy firms. The group 2 has an average of 0.18747 which indicates companies which have suspicious characteristics. The group 3 indicates the lowest mean which states that these companies have low B coefficients which say that they have a tendency to fail.
Figure 4. Survival curves for three cluster groups
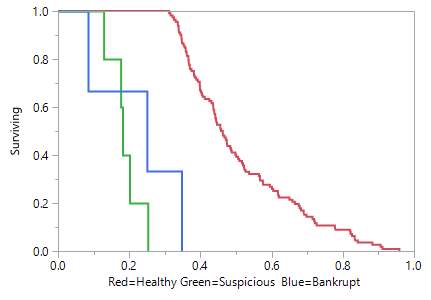
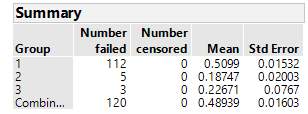 Table 15. Cluster groups’ summary
Furthermore, once these characteristics identified and grouped it means that SC managers can benefit from survival functions from each group to predict any possible risk within the whole supply chain. In Figure 1, Figure 2 and Figure 3 we can see survival function and the probabilities to survive for the firms which in the cluster group 1, 2 or 3. Figure 1 clearly confirms that cluster group 1 which was defined as the ‘healthy’ companies have a high probability of 1.0 to survive basically for the whole 12 months. Figure 3 states completely different results. The survival function of this cluster group starts decreasing quickly. It indicates that these companies would not survive 12 months. The last cluster group is presented in Figure 2. A-k means clustering analysis have identified these companies as suspicious because of its mean which is in the middle of groups 1 and 3. Thus, the results show that these companies have similar chances as the bankrupt firms to survive within 12 months. The survival function is at the bottom at the end of year one. It indicates that these companies have a high risk to become bankrupt.
Figure 4 summarises all three groups created by the k-means clustering algorithm. The businesses that assigned to the bankrupt clustering group should give a strong indication to the supply chain managers the financial risk will occur unless the immediate action plan to mitigate risk implemented. The companies which are in the suspicious group must be monitored. The survival function has a high probability for the businesses that are in the ‘healthy’ companies’ cluster group. It indicates that there is no risk for the period, which is assessed.
5 CHAPTER 5: SUMMARY, CONCLUSIONS, AND RECOMMENDATIONS
The supply chains’ management has to be very careful when assessing the risk within the whole chain. The right process to deal with the risk is a very crucial component to enhance the performance and resilience of the entire company. The central objective of this research was to incorporate the data measured and one point in time and create a standard model and the model which is defined as adjusted to develop a model which use data measured at the whole project’s observation time. These models were used to compare the suitability and accuracy results between CPHR, MDA and LR. Likewise, this research was centred on the firms from many different sectors to evaluate CPHR suitability to make accurate predictions. This study has assessed companies from 50 different sectors. Some other significant constituent is that various types of CPHR models have the capability to recognise performance downturns over the time. It is significant to note that the regular information updates contribute to the more efficient analysis and solutions. Moreover, the CPHR analysis uses a different type of explanatory variables.
The first subproblem of this research has escalated the ability of CPHR analysis to predict bankruptcy risk for a diverse type of firms (SC risk). The produced results present considerably positive accuracy between CPHR, MDA and LR. The aim of this subproblem is to certify appropriateness of CPHR in estimating supply chain’s survival. The specific type of methods practised in this experiment has boosted the reliability of results. For instance, the data set of 120 companies from many different industries, ‘leave-one-out model validation test and step-wise selection of independent variables had the main contribution to ensure the credibility of the findings. The accuracy which was estimated based on sample generated by cross-validation method has provided an excellent empirical benefit. Likewise, ‘leave-one-out’ model validation method was capable of scanning and analysing a large set of observations. Broadly speaking, this approach has estimated errors based on the total number of companies’ information. Foremost of all, the results of this subproblem indicate that Logistic regression method was the most accurate in predicting bankruptcy event within three years’ period. This approach has misclassified only 24.2% of companies wrong while predicting a case of bankruptcy 12 months in advance. Therefore, it was the lowest percentage of mistakes. Two years before the event it has generated 30% of errors and 36 months before the bankruptcy 24.2%. The CPHR and MDA have performed quite similarly within the whole observation time. Although, the findings show that CPHR has performed better than the MDA because it has generated fewer errors each year. In other words, 12 months before the bankruptcy this approach made 26.7% of wrong predictions, 24 months before 30.8%, and 36 months in advance 26.7% again. In general, the ability to classify the financial failure correctly is very encouraging. It demonstrates a substantial capability to make great predictions for any period. The accuracy of this model is a supportive evidence for the supply chain managers to rely on CPHR when assessing the danger within the chain.
The second subproblem of this research has aimed to investigate CPHR ability to foretell the time of failure. For example, the possibility to know the survival time within 12 months can be a significant benefit for supply chain management to prepare the action plan and diminish financial risk. A k-means clustering creates three cluster groups: healthy, suspicious and bankrupt companies. The CPHR survival functions generate survival curves for each of these groups. The findings depict that the survival curve for a healthy companies’ cluster group is a horizontal line which remains stable during the whole observation time. The second group includes suspicious firms. It is evident that probability to survive declines same quickly the survival curve of the third cluster group to whom bankrupt companies belong. When we look at the survival curves (Table 4) we can easily identify timing. The results have reported the survival time suspicious and bankrupt companies starts diminish at the beginning of the year (within 3,4 first months) and healthy companies remain stable the whole year.
Overall, the findings reveal that survival analysis is capable of predicting if and when the event (e.g. bankruptcy) possibly occur. Above all, this approach can be designated to assess not only potential risk of suppliers but customers as well. Beynon-Davies, Galliers and Sauer (2009) has defined demand risk as a capital flow disturbance within supply chain which can be an essential threat too. Since, customer demand for products fluctuates very often it is vital not to underestimate this type of risk (Zsidisin and Ritchie, 2008). The same authors have reported their study results which prove that demand risk has a higher negative influence on supply chain’s performance. Their study reports that the principal cause for the results is demand fluctuation which was noted before. The variations within the supply chain are cheaper to manage. Therefore, survival analysis can be beneficial to identify this important type of risk. The positive predictions can be a firm action plan to anticipate the outcome which would help to increase the growth and profit of the business.
This research suggests that any company which facing a negative financial failure consequence within their supply and demand chain should look into deeper failure analysis using Cox Proportional Hazards regression method. Of course, to be able to conduct these analyses, the heads of the companies must consider all the practical issues. For example, the SC management team must be provided with the statistical software and the training how to perform all the analysis, and how to interpret the results. The study has used a few different softwares to conduct and compare the analysis. The main softwares which were used are SPSS and JMP. The reason to test data with various softwares was the curiosity if produced results will be the same. Surely, the outcome was almost the identical. It is worth to mention that there are many other developed softwares available in the market (SAS, STATA, PYTHON, R, MINITAB). Sodhi and Tang (2012) explain that monitoring supply chain partners’ or customers’ performance often as possible because it is a part of the risk management process. The database for assessing survival analysis has to be as recent as possible. The most updated information could provide a more accurate outcome. The Cox Proportional Hazards regression requires the data of events which either positive or negative to create survival function.
While assessing the desired event, it is enough to use the data of the negative event (e.g. bankruptcy) from the same or similar industry. The first step is to identify the firms which are bankrupt. Then, scan and eliminate industries which are not appropriate.
Of course, if there is a possibility to investigate companies which might have a tendency to a failure within the supply chain, it would be another great option. It follows that the data can be gathered through the sources like Bloomberg, Yahoo Finance or Morningstar. However, the data of publicly traded firms usually is more accessible. Unfortunately, most of the databases which provide financial information do not provide a free of charge service. Therefore, it is important to consider the possibilities and options to access these databases. The data which consist the ratios which were used in this study, the age of the company are determined through the financial statements defined earlier.
Ultimately, this research supports the null hypothesis, which claims that there is no relationship between two or more groups. The data used in this research resulted in being statistically significant (Table 5, Table 9 Table 11) which confirms the hypothesis. The limitations of this study were identified in the introductory chapter. Therefore, anyone who wishes to take any further investigation related to this topic should consider the to conduct analysis based on different types of ratios or data which involves companies from various countries.
6 APPENDIX I
Figure 5. The industries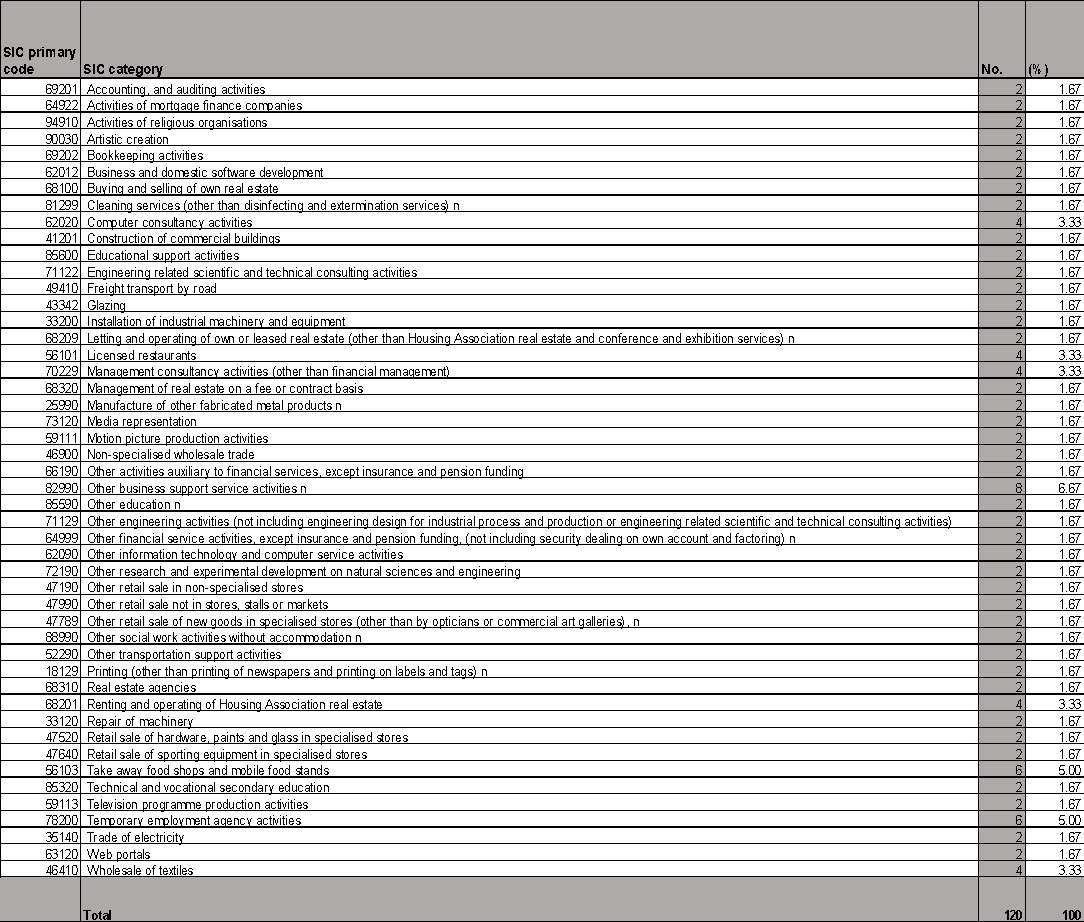
7 REFERENCES
Anon, (2017). Advances in the modelling of credit risk and corporate bankruptcy: Introduction. [online] Available at: http:/http://assets.cambridge.org/97805218/69287/excerpt/9780521869287_excerpt.pdf [Accessed 1 Apr. 2017].
Anon, (2017). Bankruptcy prediction in Norway: a comparison study. [online] Available at: http://webdoc.sub.gwdg.de/ebook/serien/e/uio_statistical_rr/04-07.pdf [Accessed 1 Apr. 2017].
Anon, (2017). Bankruptcy prediction models: How to choose the most relevant variables? [online] Available at: https://mpra.ub.uni-muenchen.de/44380/1/MPRA_paper_44380.pdf [Accessed 1 Apr. 2017].
Anon, (2017). Corporate Governance and Corporate Failure: A Survival Analysis. [online] Available at: http://www.ukm.my/fep/perkem/pdf/perkemVII/PKEM2012_3A3.pdf [Accessed 1 Apr. 2017].
Anon, (2017). Forecasting bankruptcy more accurately: A simple hazard model. [online] Available at: http://www-personal.umich.edu/~shumway/papers.dir/forcbank.pdf [Accessed 1 Apr. 2017].
Anon, (2017). The accuracy and information content of two traditional statistical methods in forecasting bankruptcy: evidence from European countries. [online] Available at: http://essay.utwente.nl/68784/1/Machielsen_MA_BMS.pdf [Accessed 24 Apr. 2017]
Balakrishnan, N. and Rao, C. (2004). Advances in survival analysis. 1st ed. Amsterdam: Elsevier North-Holland.
Bals, L. and Tate, W. (n.d.). Implementing triple bottom line sustainability into global supply chains. 1st ed.
Beynon-Davies, P., Galliers, R. and Sauer, C. (2009). Business information systems. 1st ed. Houndmills, Basingstoke, Hampshire: Palgrave Macmillan.
Beynon-Davies, P., Galliers, R. and Sauer, C. (2009). Business information systems. 1st ed. Houndmills, Basingstoke, Hampshire: Palgrave Macmillan.
Cleves, M., Gould, W. and Marchenko, Y. (2016). An introduction to survival analysis using Stata. 1st ed. College Station, Tex.: Stata Press.
Global, F., and Posted (2016) Supply chain risk in a post-brexit world. Available at: https://www.fmglobal-touchpoints.co.uk/srna-post-brexit.htm (Accessed: 24 November 2016).
Halgamuge, S. and Wang, L. (2005). Classification and clustering for knowledge discovery. 1st ed. Berlin: Springer.
Hitchcock, M. (2012) LibGuides: Nursing resources: Types of research within qualitative and quantitative. Available at: http://researchguides.ebling.library.wisc.edu/c.php?g=293229&p=1953454 (Accessed: 27 November 2016).
Holmes, E. (2005). Cross-validation of quasi-extinction risks from real time series. 1st ed. Seattle, Wash.: U.S. Dept. of Commerce, National Oceanic and Atmospheric Administration, National Marine Fisheries Service, Northwest Fisheries Science Center.
Insolvency service official statistics (2016) Available at: https://www.gov.uk/government/collections/insolvency-service-official-statistics#statistics-published-2016 (Accessed: 25 November 2016).
Knief, S. (2016) London’s food supply chains at increasing risk of service failure, says new UKWA report. Available at: http://warehousenews.co.uk/2016/05/londons-food-supply-chains-at-increasing-risk-of-service-failure-says-new-ukwa-report/ (Accessed: 25 November 2016).
Labaree, R.V. (2009) Research guides: Organizing your social sciences research paper: Types of research designs. Available at: http://libguides.usc.edu/writingguide/researchdesigns (Accessed: 27 November 2016).
Labaree, R.V. (2009) Research guides: Organizing your social sciences research paper: Glossary of research terms. Available at: http://libguides.usc.edu/writingguide/researchglossary (Accessed: 29 November 2016).
Martin, W.E., and Bridgmon, K.D. (2012) Quantitative and statistical research methods: From hypothesis to results. San Francisco, CA: Wiley, John & Sons.
Ostring, P. (2004). Profit-focused supplier management. 1st ed. New York: AMACOM.
Sodhi, M. and Tang, C. (2012). Managing supply chain risk. 1st ed. New York: Springer.
Trent, R.J. and Roberts, L.R. (2009) Managing global supply and risk: Best practices, concepts, and strategies. Fort Lauderdale, FL: Ross, J. Publishing.
Waters, C.D.J. and Waters, D.J. (2011) Supply chain risk management: Vulnerability and resilience in logistics. 2nd edn. Philadelphia: Kogan Page.
Watson, R. (2015) ‘Quantitative research,’ Nursing Standard, 29(31), pp. 44–48. doi: 10.7748/ns.29.31.44. e8681.
Wey, A., Connett, J. and Rudser, K. (2015) ‘Combining parametric, semi-parametric, and non-parametric survival models with stacked survival models,’ Biostatistics, 16(3), pp. 537–549. doi: 10.1093/biostatistics/kxv001.
Wu, T. and Blackhurst, J. (2009). Managing supply chain risk and vulnerability. 1st ed. New York: Springer.
Zsidisin, G. and Ritchie, B. (2008). Supply Chain Risk. 1st ed. Dordrecht: Springer.
Cite This Work
To export a reference to this article please select a referencing stye below:
Related Services
View all


Related Content
All TagsContent relating to: "Business Analysis"
Business Analysis is a research discipline that looks to identify business needs and recommend solutions to problems within a business. Providing solutions to identified problems enables change management and may include changes to things such as systems, process, organisational structure etc.
Related Articles

DMCA / Removal Request
If you are the original writer of this dissertation and no longer wish to have your work published on the UKDiss.com website then please: