The IKKs as Novel Regulators of Aurora Kinase: A Function and Cellular Mitosis in Prostate Cancer
Info: 9577 words (38 pages) Dissertation
Published: 20th Feb 2025
Tagged: Cancer
Abstract
Aurora kinases are proteins with an important role in the control of the cycle and cell proliferation and are overexpressed in prostate, breast, colorectal, lung, pancreatic, or glioblastoma cancers. Some studies have shown NEMO-binding domain peptide as a preventer of the kappa B kinase inhibitory complex formation. This peptide is elaborated using the sequence of NEMO residues characteristic of the inhibitory kappa B kinases alpha and beta. Our laboratory has taken advantage of this peptide targeting aurora kinase A.
This study has focused on the effects without the peptide in PC3 cells, with nocodazole concentration curves in LNCaP AI and MCF7 cells, and with the permeable NEMO-binding domain peptide in LNCaP AI cells. The verification of the efficacy of the peptide was based on the observation of the levels of aurora kinases and their partner proteins, after performing the Western blot technique.
The obtained results were an optimal concentration of nocodazole of 50 ng/mL in LNCaP AI cells, a decrease in levels of aurora kinase after the initial incubation times in LNCaP AI cells with the peptide, consistent levels of the markers with what was previously studied in PC3, and an ideal NOC concentration could not be found regarding MCF7 cells.
Contents
- Introduction
- Results
- Markers determination in PC3 cells
- NOC concentration determination in LNCaP AI cells
- Markers determination in LNCaP AIs using the NBD peptide
- NOC concentration determination in MCF7 cells
- Discussion
- Materials and methods
- Bibliography
Introduction
Cancer is one of the leading causes of death in this century, and at the moment there are known up to 200 forms (1,2). Four of the main tumour types worldwide both women and men in 2018 were lung (11.6%), breast (11.6%), colorectal (10.2%), and prostate cancer (7.1%) (1).
Regarding prostate cancer (PCa), it is the type of cancer which represents the highest impact in men in the UK with a risk rate of 1 in 6 (3). In a worldwide level, PCa is the second most recurrent and the fifth with the highest mortality in men in 2018. In recent years, improvements in treatments and early diagnosis have allowed the number of deaths has decreased in developed countries (1). The most influential risk factors for PCa are age, family history and race. Men aged over 50 or older, with an affected brother or father and/or being African-American are more likely to develop such cancer (4,5).
Another important aspect of PCa is the conditions of this disease are not static, so the type of tumour can start as hormone-naïve prostate cancer (HNPC) and turn into castrate-resistant prostate cancer (CRPC) over time. The HNPC is defined by not being treated with androgen deprivation therapy (ADT) or being still sensitive to this therapy, whereas, in CRPC, ADT no longer works (6,7). According to Prostate Specific Antigen (PSA) levels (greater than 5 ng/mL) or the appearance of metastases, the PCa could be classified as a localised disease, rising PSA-non-castrate, metastases-non-castrate, rising PSA-castrate, and metastases-castrate states (8).
For this reason, there are different treatments for PCa, and more than one is usually used to deal with the disease more effectively. The most recurrent types are surgery, radiation, chemotherapy and androgen deprivation therapies (9). The majority of patients are treated with ADT, which decreases testosterone levels, with the aim of reducing the spread of the tumour before using other treatments such as radiotherapy or surgery (10,11). New therapeutic targets are being investigated to find more effective treatments against PCa, which are based on inhibiting enzymes involved in the regulation of cell cycle and proliferation.
There is a series of proteins that belong to an extensive network of pathways that regulate cell growth and proliferation, and reduce apoptosis, as phosphoinositide 3-kinase/protein kinase B(PI3K/PKB), Janus kinase/signal transducer and activator of transcription (JAK/STAT), Ras/mitogen-activated protein kinase (Ras/MAPK), aurora kinase (AURK), and inhibitory kappa B kinase/nuclear factor-kappa B (IKK/NF-κB) (12–14). Accumulation of mutations in the genes that express these proteins can lead to over-activated signalling pathways, an uncontrolled cell cycle and favour appearance of cancer (15).
In relation to the above, NF-κB is a family of transcription factors, which is constitutively active in colorectal, breast or prostate cancer, and can overexpress genes linked to cell proliferation or inactivate genes that induce apoptosis (13,16). Inhibitors of kappa B (IκBs) refers to a family of proteins (IκBα, IκBβ, among others) which aim is to stop transcription factor NF-κB until IκBs are phosphorylated by the IKKs (13,17). About IKK/NF-κB interaction, IKK complex composed by IKKα (IKK1), IKKβ (IKK2), and IKKγ (NF‐κB essential modulator, or NEMO) (Figure 1) phosphorylates IκBα on serines (S) 32 and 36 in what is known as the canonical pathway (18,19). There is another pathway, the non-canonical, where it is only involved IKKα. The phosphorylated IκBα enhances its ubiquitination thanks to Skp, Cullin, F-box containing complex/β-transducin repeat-containing E3 ubiquitin-protein ligase (SCF/β-TrCP E3) and subsequent degradation, liberating NF-κB to translocate to the nucleus and regulate cell proliferation (19). Overexpression of IKKα, as well as IKKβ, can lead to PCa, and it seems IKKα is more present in late stages of the disease, while IKKβ in the earliest (13,20,21).
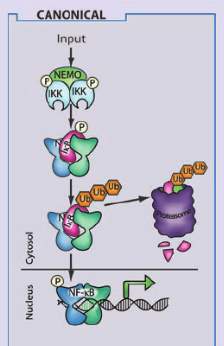
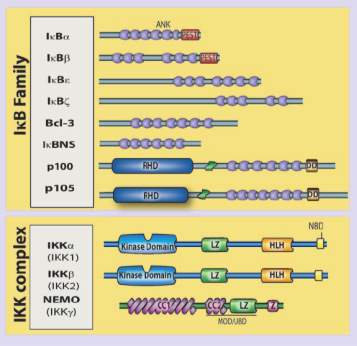
Figure 1. This scheme shows the IκB family and the IKK complex with their respective isoforms. In the case of the IKK complex, IKKα, IKKβ and IKKγ are participating, and their different domains are detailed, among which the kinase domain and the NEMO-binding domain are the most interesting in our study. On the right, it is the canonical pathway, which is the route where the three subunits of the IKK complex are involved since only IKKα participates in the non-canonical one. This image was taken from https://www.researchgate.net/figure/The-mammalian-NF-k-B-I-k-B-and-IKK-protein-families-Relevant-domains-typifying-each_fig1_49763131
Another family of kinases important in cell cycle progression and proliferation is AURK, a serine/threonine kinase which controls the mitotic spindle and centrosomes. There are three kinds of isoforms, A, B and C. Their abnormal expression can cause instability in mitosis or an irregular function of centrosomes. The levels of AURKA and AURKB are elevated in the majority of prostate cancer types (22). Targeting protein for Xenopus kinesin-like protein 2 (TPX2), and polo-like kinase 1 (PLK1) are two proteins related to AURKA. TPX2 is a microtubule-associated protein overexpressed in tumours, which can generate an uncontrolled amplification of the centrosomes, polyploidy of the genetic material and elongation of mitosis phase when it does not disappear after mitosis (23,24). The reason could be the TPX2 carboxy-terminal half domain, which interacts with the microtubules to manage the control both of morphology and cell proliferation, has no longer work (23,25). The other protein associated with AURKA activation is PLK1, a serine/threonine kinase overexpressed in cancer, which interacts indirectly with AURKA through TPX2 phosphorylation (26,27).
In relation to TPX2/AURK interaction, the description will focus on TPX2 with AURKA because it is more specific than with Aurora B (28). AURKA binds to the first 43 residues of the N-terminal of TPX2 (29), while TPX2 to 274-299 residues of AURKA (30). TPX2 induces the autophosphorylation of AURKA on threonine (T) 288, which is found in the catalytic domain, while AURKA phosphorylates TPX2 on residues S121 and 125 in humans (25,31,32). TPX2 and AURKA concentration peaks are at the beginning of mitosis until they are reduced by anaphase-promoting complex or cyclosome (APC/C) proteasome (28). A consequence of this binding is an AURKA conformation change, which works as a protection against dephosphorylation by the phosphatases, and its imminent degradation by proteosomal machinery (33,34). AURKA along with TPX2 can interact with other proteins, among them, PLK1 (Figure 2). AURKA together with BORA phosphorylates PLK1on T210 in G2 phase (35), and consequently, active PLK1 phosphorylates TPX2 on S204, favouring AURKA activation in Xenopus (26). BORA is another activator of AURKA, which is useful for centrosome and spindle formation in mitosis phase (36).
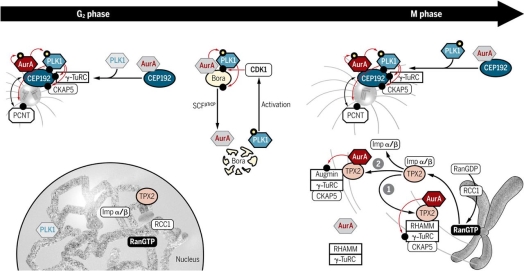
Figure 2. This picture shows how AURKA interacts with proteins such as PLK1 and TPX2 based on phosphorylations, as well as with other cofactors such as Bora, or nucleation microtubule proteins such as γ-TuRC during G2/M phase, managing to control cell proliferation and growth by regulating centrosomes and microtubules of the mitotic spindle. This image was taken from https://stke.sciencemag.org/content/11/543/eaar4195?rss=1
IKK/NF-κB pathway is involved in inflammatory processes and the AURKs role is linked to the control of mitosis and formation of kinetochores (13,37), but as seen previously both pathways are also related to the regulation of the cell cycle, and can cross-talk. In regards to IKK/AURKA interaction, IKKs can control M phase in a separate NF-κB pathway. IKKα phosphorylates AURKA on T288 in humans, and IKKα knockdown shows a decrease in AURKA activation (38). IKKβ induces AURKA degradation by β-TrCP, and its lack promotes cellular migration and tumour growth (39).
The family of IKKs kinases is being used as a therapeutic target in clinical trials, in particular, the catalytical subunits IKKα and IKKβ (13). In addition to testing the efficacy of these inhibitors alone, they are being investigated in combination with NF-κB inhibitors, or radiation therapy, to overcome chemoresistances (13). The inhibitors used so far are directed to inhibit the kinase domain (KD) of IKKα/IKKβ where the ATP binding pocket site is located. Some examples of these inhibitors that seem to work in PCa are small molecules such as BMS-345541, an ATP-non-competitive inhibitor, which acts as a great selective inhibitor of IKKα and IKKβ; CmpdA, an example of IKKβ inhibitor, whose effect has also been tested together with Docetaxel, a chemotherapy drug against castration-resistant PCa to struggle resistances; and apigenin, a IKKα selective molecule, which is a secondary metabolite obtained from the plants (40–42). Hence,the phosphorylation to activate these kinases is reduced after the inhibitors binding to their corresponding KD. The effects are non-proliferation of the tumour cells and apoptosis promotion (42).
Regarding the other therapeutic target, AURK, there are not too many molecules developed for its inhibition in the PCa, but there are some examples as Danusertib and Alisertib. Danusertib has worked in mouse models with PCa, decreasing and stabilising the tumours (43), and recently Alisertib has been tested in men with advanced PCa in a phase II trial without showing very clear results (44).
More recently, it is been studied another series of IKK inhibitors, which interact with the NEMO-binding domain (NBD), to block the formation of the IKK complex (13). NBD peptides have a size around 12 amino acids and they are designed with an extra end, a short cell-penetrating peptide (CPP), which allows the NBD to cross cell membranes more easily (45). This type of inhibitors binds to NBD, which is located in the C-terminal of IKKα or IKKβ. NBD sequence varies between IKKα and IKKβ, but it shares a common part in both kinases, LDWSWL. Hence, IKKγ cannot interact with alpha and beta subunits, and the NF-κB pathway is inactivated (13,42,46). The NBD peptides have been tested in animal models to check their effectiveness in different diseases that share inflammation as a symptom, like peritonitis, oedema, rheumatoid arthritis or activated B cell-like diffuse large B-cell lymphoma (46–48). These trials have shown positive results in terms of their greater specificity and safety compared to the IKK inhibitors (46,49). Despite this, it is still not appropriate to use this type of inhibitors in humans since its pharmacokinetic properties such as bioavailability, half-life, etc. they are not proven (49). Apart from animal models, virtual screening is being used in the design of potential inhibitors (13).
Based on the NBD peptides concept, recent data from our lab show that these peptides can be used to inhibit AURKA sites where IKKβ usually binds. It seems that TPX2 shares the same binding sites with IKKβ. NBD peptides, whose sequence is based on the NBD of the IKKs, can block these sites. TPX2 could not bind to AURKA, and the dephosphorylation and inactivation of AURKA would take place. This would mean a great advance in the fight against cancer.
NBD peptide accelerates dephosphorylation of AURKA/B /C and increases AURKA degradation. It is a mechanism evident in different PCa cell lines so that our project has aimed to prove the NBD effect on prostate cancer cells observing the levels of several markers which play a role in cell cycle, and try to extrapolate this finding to other types of cancer where there is overexpression of AURKA, in addition to other proteins.
Results
Our laboratory has previously worked on the determination of the effects of NBD peptide on proliferation and cell cycle markers, p-AURK A/B/C, total AURKA, TPX2 and p-PLK1, on the PC3 cell line. Therefore, the first experiment was performed on PC3 cells but without the peptide, so that the signal from the markers could be appreciated when there is no inhibition. Due to the importance of checking the effect of this peptide on other cell lines, this study has focused on another different cancer cell line, LNCaP AI cells, which also belongs to a prostate cancer androgen receptor-negative, that is, resistant. Initially, a NOC concentration curve had to be carried out to identify the optimal concentration at which cells in the G2/M phase can be trapped with the highest level of markers and allow them to be properly released so that they can re-enter mitosis. The concentration curve was carried out on one more cell line, MCF7s, which is an estrogen receptor (ER)+ breast cancer cells. Thus, the cell lines shown in the following experiments correspond to hormonal cancer types.
Markers determination in PC3 cells
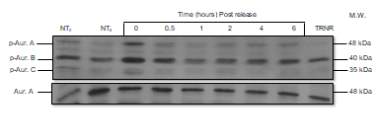
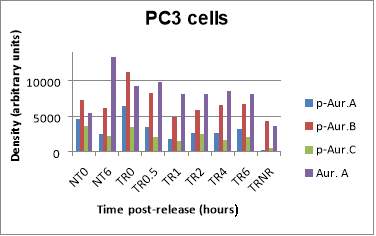
Below, a Western blot is presented with the levels of p-AURKA (48 kDa), p-AURK B (40 kDa), p-AURK C (35 kDa) and total AURKA (48 kDa) in PC3 cells under the following conditions, treatment with NOC at incubation times 0 and 6 hours (lanes 1, and 2 respectively), after treatment with NOC 50 ng/mL and release at incubation times 0, 0.5, 1, 2, 4 and 6 hours (lanes 3-8), and when treated at said NOC concentration, but without being released (lane 9) (Figure 3A). The concentration of 50 ng/mL is what has been determined in previous studies of this laboratory as ideal for trapping and releasing the cells of this cell line. At first glance, an expression of p-AURKA/B/C is the highest at TR0 (6398.74, 11222.619, 3478.497, respectively), but in comparison, the levels of TRNR are too low (287.82, 4279.962, 602.184). On the other hand, as the post-release incubation hours pass, the levels of these markers decrease in relation to time 0, but it seems that at intermediate time points such as 1 or 2 hours (1741.305, 4953.447, 1563.255; 2710.497, 5941.669, 2441.083), the expression is lower than after 4 or 6 hours (2640.012, 6585.033, 1649.619; 3262.962, 6683.912, 2096.134) where the values are approximately 1.5 times higher. This phenomenon is best appreciated in the p-AURKB bands since the p-AURKA/C ones are very weak. Regarding NT0 and NT6 (4663.134, 7277.376, 3573.548; 2478.912, 6115.083, 2162.69), their values are low compared to the TR at initial times. For total AURKA expression, TR0 and TR0.5 (9317.912, 9849.569) have slightly higher levels, while TR1-6 share values around 8000. TRNR (3696.426) shows a signal similar too low in comparison with TR0, while NT6 has an unexpectedly high signal of 13385.376 (Figure 3B).
A
B
Figure 3. (A) Phosphorylated AURKA A/B/C and total AURKA expression levels after nocodazole trap and release in PC3 cells. (B) The histogram shows the signal of p-AURKA in blue, p-AURKB in red, p-AURKC in green and total AURKA in purple, where NT0 and NT6 symbolize non-treated with NOC at time points 0 and 6 hours, TR corresponds to treated and released from 0 to 6 hours, which is the time range of incubation, and TRNR means treated but non-released.
NOC concentration determination in LNCaP AI cells
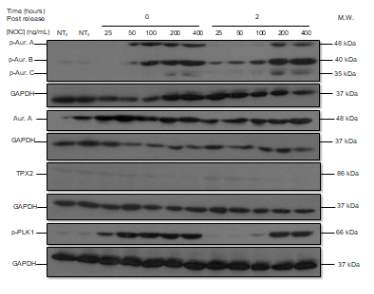
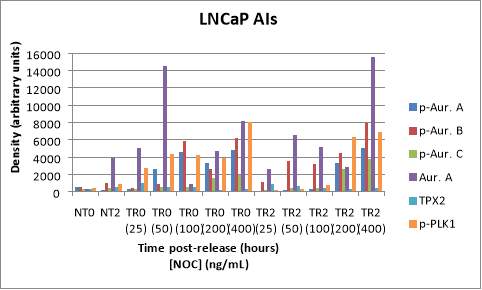
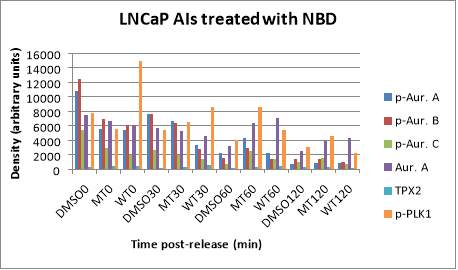
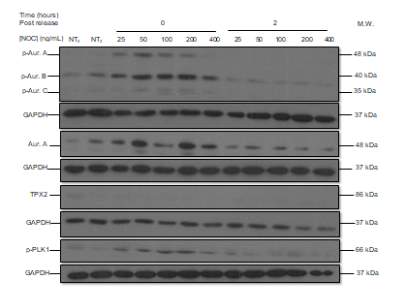
The following Western blot exhibits the levels of p-AURKA (48 kDa), p-AURK B (40 kDa), p-AURK C (35 kDa), total AURKA (48 kDa), TPX2 (86 kDa), and p-PLK1 (66 kDa) in LNCaP AI cells to determine the ideal NOC concentration for cell stimulation. The two first lanes correspond to NT with NOC at the incubation times of 0 and 2 hours (lanes 1, and 2 respectively), the next five lanes to TR0 after NOC treatment with the following concentrations, 25, 50, 100, 200, and 400 ng/mL (lanes 3-7), and the last five lanes have the same concentration progression but the incubation time point is 2 hours (lanes 8-12) (Figure 4A). The negative controls, NT0 and NT2, work since their levels are low with respect to TR, and the levels of TR0 with respect to TR2 are generally higher, with the exception of TR2 400 ng/mL. p-AURKA and p-AURKB in TR0 (100) have high values (4560.805, 5851.676, respectively) and after 2 hours of incubation, their values are the lowest (302.287, 3187.671) with respect to the NOC concentration of 400 ng/mL (5051.395, 7883.846). However, p-AURKC and total AURKA in TR0 (200) have the second-highest values (1590.130, 4689.387) and after 2 hours (2621.134, 2832.857) are less than in TR2 (400) (3811.967, 15581.466). Finally, the levels of p-PLK1 are almost the highest after 0 hours and the lowest after 2 hours at a NOC concentration of 50 ng/mL (Figure 4B).
A
B
Figure 4. (A) Phosphorylated AURKA A/B/C, total AURKA, TPX2 and p-PLK1 expression levels after nocodazole trap and release in LNCaP AI cells. The followed incubation time points were 0 and 2 hours, and the concentration progression was from 25 ng/mL to 400 ng/mL. (B) The histogram shows the signal of p-AURKA in dark blue, p-AURKB in red, p-AURKC in green, total AURKA in purple, TPX2 in blue and p-PLK1 in orange, where NT0 and NT2 symbolize non-treated with NOC at time points 0 and 2 hours, TR corresponds to treated and released from 0 to 2 hours, in a NOC concentration range from 25 ng/mL to 400 ng/mL. The densities are displayed after applying the normalization factor.
Markers determination in LNCaP AIs using the NBD peptide
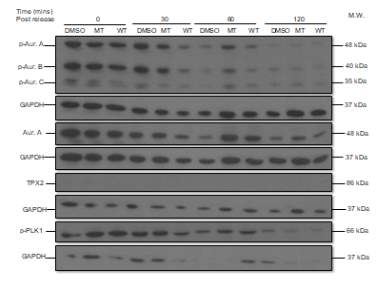
After determining the optimum concentration of NOC in LNCaP AIs in the previous experiment, a concentration of 50 ng/mL was used for the study of the effect of the NBD peptide on this cell line. The same proteins were studied (p-AURKs, total AURKA, p-PLK1 and TPX2) after the treatment with a vehicle (DMSO), MT or WT NBD peptide at different time points of incubation, from 0 to 120 minutes (lanes 1-12). DMSO serves as a negative control since its samples do not contain the peptide, while MT0 and WT0 would act as positive controls because they are not previously treated with NOC (Figure 5A).
Consequently, the signal of the different markers is higher in DMSO 0 (except in the case of TPX2) with respect to MT0 and WT0, and in turn, the values of MT0 and WT0 are similar. For example, in the case of p-AURKA, the signal corresponding to DMSO0 is 10772.027, MT0 5544.225 and WT0 5408.334. After 30 minutes of incubation, it can be seen that the levels of the markers in the presence of DMSO and MT NBD peptide were similar, while with the WT version, the values of the p-AURKA/B/C proteins, and total AURKA are inferior, so the peptide seemed to give inhibition of AURKA as can be seen in the histogram below. In the cases of TPX2 and p-PLK1, the lane signals in presence of WT30 (610.892, 8578.104, respectively) are greater than with DMSO30 (179.643, 5360.823) or MT30 (324.222, 6422.243).
In particular, the TPX2 value with WT30 almost doubles MT30 one (x1.88). The values of the markers in the presence of DMSO60 are lower than those corresponding to WT60, for example, total AURKA has signals of 3217.156 for DMSO60, and 7074.174 for WT60 which is twice greater than DMSO60 value (x2.19). But the values of WT60 can be still compared with MT60 as a reference to know if the peptide is effective. Protein levels with WT60 are lower in all cases in relation to the mutated version, except in total AURKA where its value with MT60 (6326.276) is lower than with WT60 (7074.174). The levels of the markers in the conditions of DMSO120 and MT120 are close to each other, but the expression values of the proteins are not always lower with WT120 since p-AURKA and total AURKA values are 857.300 and 4302.410, respectively, compared to 819.77 and 3915.726 with MT120. It can also be seen that at two hours of incubation, the levels of the markers are lower than at 30 minutes since the cells themselves must be closer to the end of mitosis, apart from the effect that the inhibitor can have (Figure 5B).
A
B
Figure 5. (A) Phosphorylated AURKA A/B/C, total AURKA, TPX2 and p-PLK1 expression levels after nocodazole trap and release in LNCaP AI cells, treated with DMSO (vehicle), MT (mutant) or WT (wildtype) NBD peptide at the following time points, 0, 30, 60 and 120 minutes. (B) The histogram shows the signal of p-AURKA in dark blue, p-AURKB in red, p-AURKC in green, total AURKA in purple, TPX2 in blue and p-PLK1 in orange. The shown lane densities are normalised thanks to the corresponding values from the loading control GAPDH.
NOC concentration determination in MCF7 cells
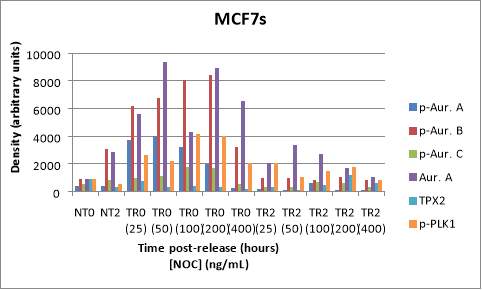
The following Western Blot shows non-treatment with NOC at time points 0 and 2 hours (lanes 1, 2) and a NOC concentration range from 25 ng/mL to 400 ng/mL after 0 and 2 hours of incubation of MCF7 cells (lanes 3-12). Similar to what happened with the LNCaP AIs blot, the negative controls of MCF7 cell line have lower values than in TR conditions. The strongest signals can be seen in the p-AURKB, total AURKA, and p-PLK1 markers. In this case, there is no consensus on a common concentration of NOC that provides maximum (or almost maximum) values in TR0 and minimum levels (or almost minimum) in TR2 among the different parameters (Figure 6A). For example, NOC 50 ng/mL would be the ideal concentration due to its balance between entrapment and release of MCF7s for protein p-AURKA (4006.358 in TR0 and 91.607 in TR2), which value is 40 times greater than TR2 one; 200 ng/mL in the case of total AURKA (8942.424 in TR0 and 1712.846 in TR2), whose value is 5 times higher than TR2; or 100 ng/mL in the case of TPX2 and p-PLK1 (414.603 in TR0 and 504.161 in TR2; 4163.615 in TR0 and 1462.832 in TR2). What is observed in these values, with the exception of TPX2, is a decrease in the expression level of the p-AURKA, total AURKA and p-PLK1 markers after 2 hours (Figure 6B).
A
B
Figure 6. (A) Phosphorylated AURKA A/B/C, total AURKA, TPX2 and p-PLK1 expression levels after nocodazole trap and release in MCF7 cells. The followed incubation time points were 0 and 2 hours (TR0 and TR2), and the concentration range for treated and released cells was from 25 ng/mL to 400 ng/mL. The shown lane signals are normalised thanks to the corresponding values from the loading control GAPDH (37 kDa).(B) The histogram shows the signal of p-AURKA in dark blue, p-AURKB in red, p-AURKC in green, total AURKA in purple, TPX2 in blue and p-PLK1 in orange, where NT0 and NT2 symbolize non-treated with NOC at time points 0 and 2 hours.
Discussion
There is an IKK-AURK cross-talk, so the NBD peptide can disrupt this communication and have an impact on cellular mitosis and therefore, in cell proliferation, as will be checked below. Regarding the results obtained in the first experiment related to the determination of the p-AURKs and total AURKA parameters in PC3 cells, the levels of p-AURKs in TRNR are too low compared to TR0, but they should be similar since in the case of TRNR cells have been stimulated just before entering mitosis, but they did not progress to that phase, and in the case of TR0, they were also only treated with NOC, therefore their values should be the highest in comparison to the other time points (50). It was seen that as the incubation time passes the levels of p-AURKs are lower, but after 4 and 6 hours, the values were not the lowest, being more logical that at more distant times their levels would be lower because the end of mitosis approaches and these proteins begin to be degraded (38,39).
In relation to the NT0 and NT6 controls, their values are low compared to the initial TR, but not with TR4 and TR6. The cells in NT0 and NT6 conditions must have lower levels of AURK markers because they do not enter into mitosis, unlike TR4 and TR6 where the cells do progress to the M phase. But in general, this experiment is confirming the profile of trap and release in PC3s, which is similar to greater literature.
Among the markers (p-AURKA, p-AURK B, p-AURK C, total AURKA, TPX2, and p-PLK1) that were targeted in the study of the optimal concentration of NOC in LNCaP AIs, the more intense and clear bands were those belonging to p-AURKB, total AURKA and p-PLK1. Perhaps the reason was a better entrapment of the cells that were later used to study these markers, but the most likely reason is that their primary antibodies have bound more strongly. Regarding the ideal concentration of NOC, it corresponds to an intermediate point (between 50 and 100 ng/mL) which allowed trapping the cells to obtain the highest possible levels of the markers and releasing them properly so that they can easily enter the mitosis phase, thus decreasing the values of the markers by protein degradation.
Although the optimal concentration of NOC is not clear at all, it seems that with 50 ng/mL is enough to manage to release the cells easily after two hours of incubation, which means that the cells can progress their cell cycle. The cells after treatment TR0 (400) and TR2 (400) curiously have the highest density signals in both cases, that is why it was ruled out as the optimal NOC concentration. Despite the results have not been perfect, the effect of the absence of the peptide seen in PC3s is translatable to LNCaPs as well. On the other hand, there is no certainty in the ideal NOC concentration for MCF7s since the range of possible concentrations covers 50, 100 and 200 ng/mL depending on the levels of the different markers as discussed above.
In relation to LNCaP AIs with NBD blot, the signal of TPX2 is lower with DMSO 0 surely because its detection has not been too good since the used Ab was very weak. The signals of TPX2 and p-PLK1 in the context of WT30 are higher than expected with respect to values with DMSO30 or MT30 because the peptide in its wildtype version should inhibit AURKA and therefore, its levels and the markers that interact with this protein should be lower. As mentioned before, in the case of TPX2, the possible reason is the inefficiency in the detection of this marker, while in the case of p-PLK1 it may be due to a delay in its regulation because it interacts indirectly with AURKA phosphorylating TPX2 (26).
Last but not least, the values corresponding to DMSO60 are too low with respect to WT60, and it should be the opposite since the vehicle does not contain the NBD peptide that can inhibit AURKA and promote its degradation, as well as the rest of markers. Most likely, there has been a human failure in the cellular stimulation of the DMSO60 dish. Hence, the correct pattern of higher and practically equivalent values of DMSO and MT, and lower values in WT has only been met at incubation times 0 and 30 min that might be enough to say that the effect of NBD is translatable to the LNCaP AIs.
In conclusion, this study demonstrates that AURKA, TPX2 and PLK1 proteins play an important role in the cell cycle and cell proliferation, although their interactions are not fully known. On the other hand, NOC concentration curves should continue to be developed to be able to move to the next level, which is the use of the NBD peptide in new cell lines. In PC3 and LNCaP AI cells, the optimum NOC concentration is 50 ng/mL. This permeable peptide has many therapeutic perspectives after knowing that it can be used to inhibit AURKA in conditions where it is overexpressed, and consequently block AURKA interactions with TPX2 since this protein protects AURKA from dephosphorylation, which in cases of cancer will be more pronounced. The peptide is working in the LNCaP AIs, at least after 0 and 30 minutes of incubation, but it should have worked at the rest time points as it was shown in previous studies of our laboratory when PC3 cells were used.
Due to lack of time, the effect of NBD peptide was not tested in other cells lines like MCF7, but it would have been interesting to have done so because it would provide a broader record of the therapeutic effects that this peptide can have in cases of cancer where AURKA is involved. Accordingly, the next step would be to study its impact in cancers where it has been shown that AURKA levels are abnormally high, such as in glioblastoma, breast or colorectal cancer, and repeat again the determination of the effectiveness of NBD peptide in LNCaP AIs for a better check. Another future work could be to verify the therapeutic effect of this peptide on different cancer cell lines in combination with small molecules, such as AURK inhibitors, which are another type of promising treatments.
Materials and methods
The required primary antibodies were mouse monoclonal antibody (mAb) anti‑TPX2 200 µg/mL (sc‑376812) purchased from Santa Cruz Biotechnology; rabbit mAbs anti‑phospho (T210) PLK1 100 µL (5472S), anti-phospho (T288/232/398) AURK A/B/C 100 µL (2914S), anti-GAPDH 100 µL (2118S) from Cell Signaling Technology (USA); and mouse mAb anti‑total AURKA 100 µg (ab13824) from Abcam (USA).
The secondary antibodies anti-rabbit mAb, and anti-mouse mAb were obtained from Jackson ImmunoResearch Europe Ltd (UK). Enhanced chemiluminescence (ECL) detection reagents were purchased from GE Healthcare (Bucks., England) and all cell culture reagents, included Roswell Park Memorial Institute (RPMI) 1640 media, were supplied by Life Technologies-Gibco (Paisley, Scotland).
Chemicals related to Western blotting like trizma base 99% purity (T1503), glycine ≥99% (G7126), sodium chloride (NaCl) ≥98% (S3014), sodium dodecyl sulfate (SDS) 92.5-100.5% (L5750), Tween® 20 (P1379), N, N, N’, N’-Tetramethyl-ethylenediamine (TEMED) (T9281), and dimethyl sulfoxide (DMSO) ≥99.5% (D5879), as well as Nocodazole 99% (NOC), Laemmli sample buffer 4x, stripping buffer, buffer 1, buffer 2, and phosphate-buffered saline (PBS) were purchased from Sigma Aldrich Ltd (UK).
The rest of reagents such as ammonium persulfate (APS) (BP179-25), 2-mercaptoethanol (BP176-100), dithiothreitol (DTT) (BP172-5) were from Fisher BioReagents (USA); bovine serum albumin (BSA) (BP9701-100) from Fisher Scientific (USA); methanol (20847.307) and glycerol from VWR Chemicals BDH (France); and acrylamide Bis-solution 30% (3029.1) was from Carl Roth (Germany). The wildtype Nemo-Binding Domain (NBD) peptide in a cell-permeable form with a 95.3% purity had the following sequence, YGRKKRRQRRRFTALDWSWLQT, while the mutant NBD peptide (U8198DG200-1) with a purity of 99.4% had the sequence YGRKKRRQRRRFTALDASALQT. Both were obtained from GenScript (USA). Nitrocellulose blotting membrane (10600003) was purchased from GE Healthcare (Germany), and the Medical X-Ray B-PLUS Full Speed Blue Films from RADIOMAT (79930089).
Culture of PC3 cells. PC3 cells were the kind gift of Prof. H. Leung (Beatson Cancer Institute, Glasgow) and maintained in RPMI medium containing 10% (v/v) foetal calf serum (FCS), 2 mM glutamine, 250 IU/mL penicillin and 250 µg/mL streptomycin at 37oC in a humidified atmosphere of air/CO2 (19:1). For experimentation cells were grown to near confluency on 4 cm dishes prior to treatments.
Culture of Lymph Node Carcinoma of the Prostate LNCaP androgen-insensitive (AI) cells. PCa LNCaP AI cells were the kind gift of Prof. H. Leung (Beatson Cancer Institute, Glasgow) and maintained in RPMI medium containing 10% (v/v) charcoal-stripped foetal calf serum (FCS), 2 mM glutamine, 250 IU/mL penicillin and 250 µg/mL streptomycin at 37oC in a humidified atmosphere of air/CO2 (19:1). For experimentation, cells were grown to near confluency on 12-well plates before exposure to vehicle or Strathclyde University (SU) compound.
Culture of Michigan Cancer Foundation-7 (MCF7) cells. MCF7 cells growing conditions were similar to PC3 cells.
The synchronisation of cells with NOC. PC3 cells were trapped overnight with 50 ng/mL NOC to synchronise them at pro-metaphase (G2/M). LNCaP AI cells, which were treated with NBD peptide later, were also trapped by 50 ng/mL NOC, while LNCaP AIs and MCF7s were treated with a range of NOC concentrations from 25 ng/mL to 400 ng/mL (25, 50, 100, 200, 400 ng/mL).
Cell stimulation. After being overnight for 16-18 hours, trapped PC3 cells were released (TR), while others were not trapped (TRNR) working as a positive control. Also, there was a group of non-trapped cells (NT), which were not trapped with NOC the day before, therefore they continued cycling and could be used as negative controls. The media was aspirated in the TR cells and their NOC was washed with 1mL of RPMI 1640 media. This step was repeated to stimulate cells to carry on with the cell cycle. After the release, all cells were incubated for different time points, from 30 minutes to 6 hours (NT6, TR30, TR1, TR2, TR4, TR6, TRNR6 dishes), except NT0 and TR0.
After every time point, cells were collected from the incubator and samples were prepared for the Western blot. The stimulation for LNCaP AIs and MCF7s consists of aspirating and washing the cells twice with RPMI 1640, and in this case, there was only one incubation time point of 2 hours for TR cells treated with different concentrations of NOC. The other part of the cells were classified in NT2 (also incubated for 2 hours), and NT0 and TR0 (TR0 25-400 ng/mL NOC), which were ready to extract their samples without previous incubation. For the experiment of LNCaP AIs with NBD, cells were treated as described above. After the release, 10 µL of 0.5% vehicle DMSO (V), 100 µM wildtype NBD peptide (WT) or 100 µM mutant NBD peptide (MT) were added to the cells before the incubation at different time points, 30 minutes, 1 hour and 2 hours (V0, MT0, WT0, V30, MT30, WT30, V60, MT60, WT60, V120, MT120, and WT120 dishes).
Western blotting
Preparation of whole-cell lysates (WCEs): the dishes containing all the cell lines mentioned above, which were previously incubated alone or with DMSO vehicle or NBD peptides, were put on ice, aspirated, washed once with 1mL of PBS pH 7.4, aspirated again, and lysed with 200 µL of 50 mM Laemmli sample buffer x1. The sample buffer was made from 2.5 mL of Laemmli buffer 4x (composed of 63 mM Tris HCl, Na4P2O7, 5 mM EDTA, 10% (v/v) glycerol, 2% (w/v) SDS, 0.007% bromophenol blue), 0.08g DTT and 7.5 mL of distilled water (dH2O). The prepared samples were collected in Eppendorf, which were boiling in a water bath for 5 minutes to finally be stored in the freezer until the next step was performed.
Electrophoresis in gels (sodium dodecyl sulphate-polyacrylamide gel electrophoresis, SDS-PAGE): the 10% (v/v) resolving gel was obtained after mixing dH2O, buffer 1 pH 8.4 (composed of 1.5 M Tris, 0.4% (w/v) SDS), 30% (v/v) acrylamide, 50% (v/v) glycerol, 10% (w/v) APS, and TEMED which helped with the polymerization. Then, 4.2 mL of polyacrylamide gels were cast in Bio-Rad Protein Electrophoresis and Blotting equipment, and immediately 200 µL 0.1% (w/v) SDS. After 40-60 minutes, the stacking gel made of dH2O, buffer 2 pH 6.8 (composed of 0.5 M Tris, 0.4% (w/v) SDS), 30% (v/v) acrylamide, 10% (w/v) APS, and TEMED was added together with combs of 1 mm during 10 minutes to generate wells. Following polymerization, the combs were removed and an amount between 10-15 µL of samples and 5 µL weight marker (WM) were loaded into the wells. After adding the running buffer composed by trizma 99%, glycine ≥99%, 0.4% (w/v) SDS and dH2O, gels were running for 1 hour and 45 minutes until the blue front reached the bottom of the gel.
Trans-blotting: gels from above were removed from the glass plates 1 mm and transblotted in a Bio-Rad transblot kit with transfer buffer during 2 hours at 0.30A. The kit included two sponge layers, two blotting papers, and a GE Healthcare nitrocellulose membrane, while the transfer buffer consisted of trizma 99%, glycine ≥99%, methanol and dH2O.
Protein blocking: the nitrocellulose membranes were shacking in 20 mL of 0.3% BSA in NATT buffer for 2 hours. NATT buffer, made of trizma 99%, NaCl ≥98%, Tween 20, and dH2O, was adjusted at pH 7.4.
Antibody incubations and washes: after the blocking, the membranes were introduced in a 3 mL solution of 0.2% BSA in NATT with the corresponding primary antibody (1 µL anti-p-AURKs, 0.5 µL anti-total AURKA, 4 µL anti-p-PLK1, 5 µL anti-TPX2) and were incubated overnight in a cold room. Next day, membranes were washed with 20 mL NATT changing solutions every 15 minutes for 1 hour and 30 minutes. Following the washes, 20 mL of 0.2% BSA/NATT and 2 µL secondary antibodies (Ab anti-rabbit in the cases of primary antibodies anti phosphorylated markers, and anti-mouse for the rest) were added to the membranes, which were incubated for 1 hour and 30 minutes. The second turn of washes as described above took place after the incubation time.
Developing with ECL: nitrocellulose membranes were dried and put into a mix of 5 mL ECL1 (composed of 250 mM luminol stock in DMSO, 250 mM cumeric acid in DMSO, and 1 mM Tris pH 8.5) and 5 mL ECL2 (hydrogen peroxide, and 1 mM Tris pH 8.5). Then, the membranes were shacked for 1 minute and 30 seconds and dried again to place them into exposure cassettes for films from Sigma for a maximum of 5 minutes. After this, the films were processed by an automatic X-ray filmprocessor model JP-33.
Data Analysis: the processed films were scanned by HP Scanjet G2710 software. Image J was used to edit the resulting images, and calculate the signal of each lane to later represent the values in histograms thanks to the Excel software.
Stripping and reprobing. Reprobing consisted of reusing nitrocellulose membranes to detect other types of markers by other primary antibodies. This can be used to detect common proteins in all previously seen cell lines, such as GAPDH (loading control). Before reprobing, a stripping was performed, which was based on adding 15 mL stripping buffer pH 6.7 (20% (w/v) SDS with Tris solution) and 105 µL 2-mercaptoethanol to the membranes and shaking at 60°C for 1 hour. Following this, membranes were washed and shook with NATT three times every 5 minutes. Then, membranes were put into 15 mL 0.2% BSA/NATT solution with 0.5 µL of Ab anti-GAPDH, which were incubated overnight at room temperature. Finally, the rest of Western blotting steps were followed.
Bibliography
1. Bray F, Ferlay J, Soerjomataram I, Siegel RL, Torre LA, Jemal A. Global cancer statistics 2018: GLOBOCAN estimates of incidence and mortality worldwide for 36 cancers in 185 countries. CA Cancer J Clin [Internet]. 2018 Nov 1 [cited 2019 Jun 8];68(6):394–424. Available from: https://doi.wiley.com/10.3322/caac.21492
2. Song Q, Merajver SD, Li JZ. Cancer classification in the genomic era: five contemporary problems. Hum Genomics [Internet]. 2015 Oct 19 [cited 2019 Jul 18];9:27. Available from: https://www.ncbi.nlm.nih.gov/pubmed/26481255
3. Cancer Research UK. Prostate cancer statistics [Internet]. 2018 [cited 2019 Jul 18]. Available from: https://www.cancerresearchuk.org/health-professional/cancer-statistics/statistics-by-cancer-type/prostate-cancer?_ga=2.6501746.1599547969.1563362768-108034699.1563362768#heading-Three
4. Bostwick DG, Burke HB, Djakiew D, Euling S, Ho S, Landolph J, et al. Human Prostate Cancer Risk Factors. Cancer [Internet]. 2004 [cited 2019 Jun 9];101(10):2371–490. Available from: www.interscience.wiley.com
5. Gann PH. Risk factors for prostate cancer. Rev Urol [Internet]. 2002 [cited 2019 Jun 9];4 Suppl 5(Suppl 5):S3–10. Available from: https://www.ncbi.nlm.nih.gov/pubmed/16986064
6. Ito T, Grant L, Duckham BR, Ribbands AJ, Gater A. Qualitative and Quantitative Assessment of Patient and Carer Experience of Chemotherapy (Docetaxel) in Combination with Androgen Deprivation Therapy (ADT) for the Treatment of Metastatic Hormone-Sensitive Prostate Cancer (mHSPC). Adv Ther [Internet]. 2018 Dec [cited 2019 Jul 18];35(12):2186–200. Available from: https://www.ncbi.nlm.nih.gov/pubmed/30415297
7. Saad F, Hotte SJ. Guidelines for the management of castrate-resistant prostate cancer. Can Urol Assoc J [Internet]. 2010 Dec [cited 2019 Jul 18];4(6):380–4. Available from: https://www.ncbi.nlm.nih.gov/pubmed/21191494
8. Scher HI, Halabi S, Tannock I, Morris M, Sternberg CN, Carducci MA, et al. Design and end points of clinical trials for patients with progressive prostate cancer and castrate levels of testosterone: recommendations of the Prostate Cancer Clinical Trials Working Group. J Clin Oncol [Internet]. 2008 Mar 1 [cited 2019 Jul 18];26(7):1148–59. Available from: https://www.ncbi.nlm.nih.gov/pubmed/18309951
9. Chen F-Z, Zhao X-K. Prostate cancer: current treatment and prevention strategies. Iran Red Crescent Med J [Internet]. 2013 Apr [cited 2019 Jun 6];15(4):279–84. Available from: https://www.ncbi.nlm.nih.gov/pubmed/24082997
10. Lu-Yao GL, Albertsen PC, Moore DF, Shih W, Lin Y, DiPaola RS, et al. Survival following primary androgen deprivation therapy among men with localized prostate cancer. JAMA [Internet]. 2008 Jul 9 [cited 2019 Jul 18];300(2):173–81. Available from: https://www.ncbi.nlm.nih.gov/pubmed/18612114
11. PDQ Adult Treatment Editorial Board PATE. Prostate Cancer Treatment (PDQ®): Health Professional Version [Internet]. PDQ Cancer Information Summaries. National Cancer Institute (US); 2019 [cited 2019 Jun 9]. Available from: https://www.ncbi.nlm.nih.gov/pubmed/26389471
12. Angulo P, Kaushik G, Subramaniam D, Dandawate P, Neville K, Chastain K, et al. Natural compounds targeting major cell signaling pathways: a novel paradigm for osteosarcoma therapy. J Hematol Oncol [Internet]. 2017 Dec 7 [cited 2019 Jul 18];10(1):10. Available from: https://jhoonline.biomedcentral.com/articles/10.1186/s13045-016-0373-z
13. Gamble C, Mcintosh K, Scott R, Ho KH, Plevin R, Paul A. Inhibitory kappa B kinases as targets for pharmacological regulation Correspondence Keywords inhibitory kappa B kinase; nuclear factor kappa B; kinase inhibitors; protein-protein interactions; inflammation. Br J Pharmacol [Internet]. 2012 [cited 2019 May 19];165–802. Available from: www.brjpharmacol.org
14. Briassouli P, Chan F, Savage K, Reis-Filho JS, Linardopoulos S. Aurora-A Regulation of Nuclear Factor-κB Signaling by Phosphorylation of IκBα. Cancer Res [Internet]. 2007 Feb 15 [cited 2019 Jul 18];67(4):1689–95. Available from: https://www.ncbi.nlm.nih.gov/pubmed/17308110
15. Otto T, Sicinski P. Cell cycle proteins as promising targets in cancer therapy. Nat Rev Cancer [Internet]. 2017 [cited 2019 Jul 18];17(2):93–115. Available from: https://www.ncbi.nlm.nih.gov/pubmed/28127048
16. Park MH, Hong JT. Roles of NF-κB in Cancer and Inflammatory Diseases and Their Therapeutic Approaches. Cells [Internet]. 2016 Mar 29 [cited 2019 May 23];5(2). Available from: https://www.ncbi.nlm.nih.gov/pubmed/27043634
17. Clark JM, Aleksiyadis K, Martin A, McNamee K, Tharmalingam T, Williams RO, et al. Inhibitor of kappa b epsilon (iκBε) is a non-redundant regulator of c-rel-dependent gene expression in murine T and B cells. PLoS One. 2011;6(9).
18. Napetschnig J, Wu H. Molecular basis of NF-κB signaling. Annu Rev Biophys [Internet]. 2013 [cited 2019 Jun 23];42:443–68. Available from: https://www.ncbi.nlm.nih.gov/pubmed/23495970
19. Prescott JA, Cook SJ. Targeting IKKβ in Cancer: Challenges and Opportunities for the Therapeutic Utilisation of IKKβ Inhibitors. Cells [Internet]. 2018 Aug [cited 2019 Jun 16];7(115):1–34. Available from: https://www.mdpi.com/2073-4409/7/9/115/pdf
20. Luo J-L, Tan W, Ricono JM, Korchynskyi O, Zhang M, Gonias SL, et al. Nuclear cytokine-activated IKKα controls prostate cancer metastasis by repressing Maspin. Nature [Internet]. 2007 Apr 18 [cited 2019 Jun 23];446(7136):690–4. Available from: https://www.nature.com/articles/nature05656
21. Sweeney C, Li L, Shanmugam R, Bhat-Nakshatri P, Jayaprakasan V, Baldridge LA, et al. Nuclear Factor-κB Is Constitutively Activated in Prostate Cancer In vitroand Is Overexpressed in Prostatic Intraepithelial Neoplasia and Adenocarcinoma of the Prostate. Clin Cancer Res [Internet]. 2004 Aug 15 [cited 2019 Jun 23];10(16):5501–7. Available from: https://www.ncbi.nlm.nih.gov/pubmed/12114442
22. Nna E, Madukwe J, Egbujo E, Obiorah C, Okolie C, Echejoh G, et al. Gene expression of Aurora kinases in prostate cancer and nodular hyperplasia tissues. Med Princ Pract [Internet]. 2013 [cited 2019 May 23];22(2):138–43. Available from: https://www.ncbi.nlm.nih.gov/pubmed/23075505
23. Zou J, Huang R-Y, Jiang F-N, Chen D-X, Wang C, Han Z-D, et al. Overexpression of TPX2 is associated with progression and prognosis of prostate cancer. Oncol Lett [Internet]. 2018 Sep [cited 2019 May 23];16(3):2823–32. Available from: https://www.ncbi.nlm.nih.gov/pubmed/30127868
24. Van Gijn SE, Wierenga E, Van Den Tempel N, Yannick •, Kok P, Margriet Heijink A, et al. TPX2/Aurora kinase A signaling as a potential therapeutic target in genomically unstable cancer cells. Oncogene [Internet]. 2019 [cited 2019 Jun 23]; Available from: https://doi.org/10.1038/s41388-018-0470-2
25. Alfaro-Aco R, Thawani A, Petry S. Structural analysis of the role of TPX2 in branching microtubule nucleation. J Cell Biol [Internet]. 2017 Apr 3 [cited 2019 May 23];216(4):983–97. Available from: https://www.ncbi.nlm.nih.gov/pubmed/28264915
26. Eckerdt F, Pascreau G, Phistry M, Lewellyn AL, DePaoli-Roach AA, Maller JL. Phosphorylation of TPX2 by Plx1 enhances activation of Aurora A. Cell Cycle [Internet]. 2009 Aug 28 [cited 2019 Jun 23];8(15):2413–9. Available from: https://www.tandfonline.com/doi/abs/10.4161/cc.8.15.9086
27. Li Z, Liu J, Li J, Kong Y, Sandusky G, Rao X, et al. Polo-like kinase 1 (Plk1) overexpression enhances ionizing radiation-induced cancer formation in mice. J Biol Chem. 2017;292(42):17461–72.
28. Garrido G, Vernos I. Non-centrosomal TPX2-Dependent Regulation of the Aurora A Kinase: Functional Implications for Healthy and Pathological Cell Division. Front Oncol [Internet]. 2016 Apr 15 [cited 2019 Jun 23];6:88. Available from: https://journal.frontiersin.org/Article/10.3389/fonc.2016.00088/abstract
29. Ignacio Pérez de Castro I, Malumbres M. Mitotic Stress and Chromosomal Instability in Cancer: The Case for TPX2. Genes Cancer [Internet]. 2013 [cited 2019 Jun 23];3(11–12):721–30. Available from: https://ganc.sagepub.com
30. Zhao B, Smallwood A, Yang J, Koretke K, Nurse K, Calamari A, et al. Modulation of kinase-inhibitor interactions by auxiliary protein binding: crystallography studies on Aurora A interactions with VX-680 and with TPX2. Protein Sci [Internet]. 2008 Oct [cited 2019 May 19];17(10):1791–7. Available from: https://www.ncbi.nlm.nih.gov/pubmed/18662907
31. Tang A, Gao K, Chu L, Zhang R, Yang J, Zheng J. Aurora kinases: novel therapy targets in cancers. Oncotarget [Internet]. 2017 Apr 4 [cited 2019 Jun 23];8(14):23937–54. Available from: https://www.ncbi.nlm.nih.gov/pubmed/28147341
32. Fu J, Bian M, Xin G, Deng Z, Luo J, Guo X, et al. TPX2 phosphorylation maintains metaphase spindle length by regulating microtubule flux. Cell Biol [Internet]. 2015 [cited 2019 Jul 15];210(3):373–83. Available from: www.jcb.org/cgi/doi/10.1083/jcb.201412109
33. Bayliss R, Sardon T, Vernos I, Conti E. Structural basis of Aurora-A activation by TPX2 at the mitotic spindle. Mol Cell [Internet]. 2003 Oct 1 [cited 2019 May 19];12(4):851–62. Available from: https://www.ncbi.nlm.nih.gov/pubmed/14580337
34. Giubettini M, Asteriti IA, Scrofani J, De Luca M, Lindon C, Lavia P, et al. Control of Aurora-A stability through interaction with TPX2. J Cell Sci [Internet]. 2011 Jan 1 [cited 2019 Jun 23];124(Pt 1):113–22. Available from: https://www.ncbi.nlm.nih.gov/pubmed/21147853
35. Seki A, Coppinger JA, Jang C-Y, Yates JR, Fang G, Fang G. Bora and Aurora A Cooperatively Activate Plk1 and Control the Entry into Mitosis. Science [Internet]. 2008 Jun 20 [cited 2019 Jun 24];320(5883):1655–8. Available from: https://www.ncbi.nlm.nih.gov/pubmed/18566290
36. Hutterer A, Berdnik D, Wirtz-Peitz F, Žigman M, Schleiffer A, Knoblich JA. Mitotic Activation of the Kinase Aurora-A Requires Its Binding Partner Bora. Dev Cell. 2006 Aug;11(2):147–57.
37. Katayama H, Sasai K, Kloc M, Brinkley BR, Sen S. Aurora kinase-A regulates kinetochore/chromatin associated microtubule assembly in human cells. Cell Cycle [Internet]. 2008 Sep 1 [cited 2019 Aug 16];7(17):2691–704. Available from: https://www.ncbi.nlm.nih.gov/pubmed/18773538
38. Prajapati S, Yamamoto Y, Gaynor RB, Tu Z. Cell Cycle IKKα Regulates the Mitotic Phase of the Cell Cycle by Modulating Aurora A Phosphorylation. 2006 [cited 2019 May 19]; Available from: https://www.tandfonline.com/action/journalInformation?journalCode=kccy20
39. Irelan JT, Murphy TJ, DeJesus PD, Teo H, Xu D, Gomez-Ferreria MA, et al. A role for IkappaB kinase 2 in bipolar spindle assembly. Proc Natl Acad Sci U S A [Internet]. 2007 Oct 23 [cited 2019 Jul 15];104(43):16940–5. Available from: https://www.ncbi.nlm.nih.gov/pubmed/17939994
40. Ping H, Yang F, Wang M, Niu Y, Xing N. IKK inhibitor suppresses epithelial-mesenchymal transition and induces cell death in prostate cancer. Oncol Rep [Internet]. 2016 Sep 1 [cited 2019 Jun 16];36(3):1658–64. Available from: https://www.spandidos-publications.com/10.3892/or.2016.4915
41. Zhang Y, Lapidus RG, Liu P, Choi EY, Adediran S, Hussain A, et al. Targeting IκB Kinase β/NF-κB Signaling in Human Prostate Cancer by a Novel IκB Kinase β Inhibitor CmpdA. Mol Cancer Ther [Internet]. 2016 [cited 2019 Jun 16];15(7):1504–14. Available from: https://www.ncbi.nlm.nih.gov/pubmed/27196761
42. Shukla S, Kanwal R, Shankar E, Datt M, Chance MR, Fu P, et al. Apigenin blocks IKKα activation and suppresses prostate cancer progression. Oncotarget [Internet]. 2015 Oct 13 [cited 2019 Jun 16];6(31):31216–32. Available from: https://www.ncbi.nlm.nih.gov/pubmed/26435478
43. Meulenbeld HJ, Bleuse JP, Vinci EM, Raymond E, Vitali G, Santoro A, et al. Randomized phase II study of danusertib in patients with metastatic castration-resistant prostate cancer after docetaxel failure. BJU Int [Internet]. 2013 Jan 1 [cited 2019 Jun 23];111(1):44–52. Available from: https://doi.wiley.com/10.1111/j.1464-410X.2012.11404.x
44. Beltran H, Oromendia C, Danila DC, Montgomery B, Hoimes C, Szmulewitz RZ, et al. A Phase II Trial of the Aurora Kinase A Inhibitor Alisertib for Patients with Castration-resistant and Neuroendocrine Prostate Cancer: Efficacy and Biomarkers. Clin Cancer Res [Internet]. 2019 Jan 1 [cited 2019 Aug 16];25(1):43–51. Available from: https://www.ncbi.nlm.nih.gov/pubmed/30232224
45. Guidotti G, Brambilla L, Rossi D. Cell-Penetrating Peptides: From Basic Research to Clinics. Trends Pharmacol Sci [Internet]. 2017 Apr 1 [cited 2019 Jul 21];38(4):406–24. Available from: https://www.ncbi.nlm.nih.gov/pubmed/28209404
46. May MJ, D’Acquisto F, Madge LA, Glöckner J, Pober JS, Ghosh S. Selective inhibition of NF-kappaB activation by a peptide that blocks the interaction of NEMO with the IkappaB kinase complex. Science [Internet]. 2000 Sep 1 [cited 2019 Jun 22];289(5484):1550–4. Available from: https://www.ncbi.nlm.nih.gov/pubmed/10968790
47. Strickland I, Ghosh S. Use of cell permeable NBD peptides for suppression of inflammation. Ann Rheum Dis [Internet]. 2006 Nov [cited 2019 May 19];65 Suppl 3(Suppl 3):iii75-82. Available from: https://www.ncbi.nlm.nih.gov/pubmed/17038479
48. Habineza Ndikuyeze G, Gaurnier-Hausser A, Patel R, Baldwin AS, May MJ, Flood P, et al. A phase I clinical trial of systemically delivered NEMO binding domain peptide in dogs with spontaneous activated B-cell like diffuse large B-cell lymphoma. PLoS One [Internet]. 2014 [cited 2019 Jun 23];9(5):e95404. Available from: https://www.ncbi.nlm.nih.gov/pubmed/24798348
49. Zhao Y, Tan Y, Meng T, Liu X, Zhu Y, Hong Y, et al. Simultaneous targeting therapy for lung metastasis and breast tumor by blocking the NF-κB signaling pathway using Celastrol-loaded micelles. Drug Deliv [Internet]. 2018 Nov [cited 2019 Jun 23];25(1):341–52. Available from: https://www.ncbi.nlm.nih.gov/pubmed/29355035
50. Rodríguez-Gómez A de J, Frias-Vázquez S. Mitosis and its regulation. Acta pediátrica México [Internet]. 2014 [cited 2019 Jul 26];35(1):55–68. Available from: https://www.scielo.org.mx/scielo.php?script=sci_arttext&pid=S0186-23912014000100009
Cite This Work
To export a reference to this article please select a referencing stye below:
Related Services
View all


Related Content
All TagsContent relating to: "Cancer"
Cancer is a disease in which cells grow or reproduce abnormally or uncontrollably. Cancerous cells have the potential to spread to other areas of the body in a process called metastasis.
Related Articles

DMCA / Removal Request
If you are the original writer of this dissertation and no longer wish to have your work published on the UKDiss.com website then please: