Dissertation on Glass Fibre Reinforced Polymer Strength
Info: 17664 words (71 pages) Dissertation
Published: 15th Nov 2021
Tagged: Engineering
Abstract
Throughout the last decade, the research for new and better materials has received great attention from the construction industry. Within this area, Glass Fibre Reinforced Polymers have received a lot of consideration due to their desirable properties. However, knowledge on the material is still limited, especially when considering its behaviour over long term environmental conditions. It is, therefore, necessary to study the material in order to predict its behaviour under service conditions.
The objectives of this thesis, are to record and evaluate the change in shear strength and pin bearing strength of GFRP bolted connections due to accelerated aging. Thermal cycling has been chosen as the technique to age the samples, with temperatures fluctuations between -20°C and +20°C every 30 minutes, to represent cold environmental conditions. Once cycled, the samples are tested at three different temperatures (-20°C, 0°C and +20°C) and the failure load and critical strain recorded. The data is then used to calculate the variation in pin bearing strength and shear strength. The Young’s Modulus is also calculated, to evaluate the change in stiffness and hardness of the material.
Initially, a significant degradation of the polymers mechanical strength is noticed. However, this is followed by a marked recovery, which could be due to stresses being distributed more uniformly in the material. The results find a degree of contradiction with the past literature, mostly with regards to the extent to which the materials strength degrades and then recovers. It is accepted that this could be due to the difference in the type of testing considered (iosipescu versus tensile testing) and the difference in sample choice (strip of material versus bolted plate).
Further testing over a larger number of thermal cycles is recommended to improve this research along with validating it. Techniques such as diamond indentation are recommended, in order to study the internal structure of the polymer and analyse the degree to which the stresses have been redistributed. Moreover, a more accurate production process for the GFRP samples is recommended in order to reduce the error in the results.
Click to expand Table of Contents
Table of Contents
1.0 Notation
1.1 List of Figures
1.2 List of Tables
2.0 Introduction
3.0 Literature Review
3.1 Background to GFRP material
3.2 Hygrothermal Aging
3.3 Thermal cycling
3.4 Sample Testing
3.5 Past Literature Final Remarks
4.0 Material Properties
5.0 Experimental Procedure
5.1 Thermal (Freeze – Thaw) Cycling
5.2 Mechanical Testing
5.3 Aims of the test
5.4 Predictions
6.0 Results
6.1 Plate Geometry
6.2 Issues with testing at negative temperatures
6.3 Effects on shear strength and pin bearing strength
6.4 Effects on the Young’s Modulus
7.0 Discussion
8.0 Conclusion
9.0 References
9.1 Articles
9.2 Images
10.0 Appendix
1.0 Notation
1.1 List of Figures
Figure 3.1: Severn Visitor Centre in England (1992-2009) and Mondial House in London (1975-2006)
Figure 3.2: Chloride resistance of GFRP compared to that of black and stainless steel.
Figure 3.3: Surface degradation of GFRP material due to loss of sealing layer from Keller et al. [1]
Figure 3.4: Arrhenius Plot of time as a function of inverse absolute temperature for various chosen lifetimes and of property retention as a function of inverse absolute temperature for various chosen lifetimes from Bank et al. [2].
Figure 3.5: Loss of Characteristic strength due to Hygrothermal aging, Zafari and Mottram et al. [3].
Figure 3.6: Variation in flexural strength for 0° GFRP specimens from Liao et al. [4].
Figure 3.7: Change in tensile strength properties of due to thermal cycling from Chin et al. [5].
Figure 3.8: Change in Interlaminar shear strength properties due to thermal cycling from Joao et al. [6]
Figure 3.9: Shear strength of unconditioned and saturated samples, from Mathieu et al. [7].
Figure 3.10: Shear strength properties for saturated and dry samples, from Grammatikos et al. [8].
Figure 3.11: Plate geometry notation.
Figure 4.1: Structure of GFRP material considered in investigation.
Figure 4.2: Pillar drill with M10 drill bit and water cooled diamond saw.
Figure 4.3: Samples after cutting with the diamond saw, samples marked up and samples after drilling.
Figure 5.1: Thermal cycling data for the GFRP samples
Figure 5.2: Experimental setup
Figure 6.1: Failure mechanisms of plates considered
Figure 6.2: Load vs Strain relationships for different bolt configurations
Figure 6.3: Effects of thermal cycling on Minimum Shear Strength of GFRP Plates tested at +20°C
Figure 6.4: Degree of bearing failure of 0 and 500 cycled plates at +20°C
Figure 6.5: Effects of thermal cycling on Minimum Shear Strength of GFRP Plates tested at 0°C
Figure 6.6: Degree of bearing failure of 0 and 500 cycled plates at 0°C
Figure 6.7: Effects of Thermal Cycling on resin allignment at 0°C testing
Figure 6.8: Effects of thermal cycling on Minimum Shear Strength of GFRP Plates tested at -20°C
Figure 6.9: Degree of bearing failure of 0 and 500 cycled plates at -20°C
Figure 6.10: Effects of Thermal Cycling on resin allignment at -20°C testing
Figure 6.11: Effects on the Young’s Modulus of cycled samples stored at +20°C prior to testing.
Figure 6.12: Effects on the Young’s Modulus of cycled samples stored at 0°C prior to testing
Figure 6.13: Effects on the Young’s Modulus of cycled samples stored at -20°C prior to testing
1.2 List of Tables
Table 6.1: Initial Shear Strength of GFRP plates at three different temperatures (0°C, +20°C and -20°C)
Table 10.1: Change in Pin Bearing Strength properties due to thermal cycling and testing at +20°C
Table 10.2: Change in Shear Strength properties due to thermal cycling and testing at +20°C
Table 10.3: Change in Pin Bearing Strength properties due to thermal cycling and testing at 0°C
Table 10.4: Change in Shear Strength properties due to thermal cycling and testing at 0°C
Table 10.5: Change in Pin Bearing Strength properties due to thermal cycling and testing at -20°C
Table 10.6: Change in Shear Strength properties due to thermal cycling and testing at -20°C
2.0 Introduction
Throughout the centuries, new and improved engineering techniques and materials have allowed us to shape the world we live in today. From the use of vines and stones we have moved to masonry, casted iron, steel, concrete, reinforced concrete and more. In the last decade attention has shifted onto the use of new technologies in order to render both engineering processes and materials faster, cheaper and of higher quality. Within this context significant leaps have been taken in the development of composite materials, focusing especially on fibre reinforced polymers (or plastics) (FRPs). Therefore, research based on understanding how these materials perform over long periods of time and under various climates has gained much significance.
FRPs are composite materials made out of reinforcing fibres held together by a polymer resin matrix. Therefore, the bond between resin and fibres is key in defining the strength and properties of the material, along with the choice of the fibres and resin used. The most common resins are: epoxy, vinylester or polyester thermosetting plastics. Whilst the most common fibre materials are: glass, carbon, aramid and basalt. Out of the fibres, glass (GFRP) has become the most used across a wide range of engineering areas. This is due to the materials ductility, reduced cost, high strength: weight ratio and resistance to chemical and environmental attacks. Whilst only used as an aesthetic element in the past, due to their high ductility (GFRPs can achieve any shape required). It is only recently that their high strength:weight ratio has been considered and they have been used as structural elements. However still now the composite is mainly used for: reinforcement bars, piping, tendons and to strengthen pre-existing structures.
Even though the use of GFRP in engineering appears to be incredibly beneficial for the construction industry. There are still a lot of unknowns surrounding the composite. Research, up to today, has been broad and relatively limited due to the absence of old enough GFRP structures, which can be studied. Moreover, the absence of design codes and standards for GFRPs don’t allow for a starting point in construction.
Generally, the most uncertainty lies in understanding how the material will behave under long term aging. It is still unknown whether fatigue, along with the relevant environmental and chemical factors, will influence the properties of the composite. One of the main issues is related to the hydrophilic nature of the glass fibres, which could prove critical under wet conditions.
The absence of long standing FRP structures means that laboratory testing has been, up to now, the main tool used to answer the many questions surrounding the material. Testing has been completed under various critical conditions and for extended periods of time. To quicken the process, accelerated aging techniques have often, if not always, been used. These processes involve straining the material under extreme conditions, in order to accelerate the degradation processes, obtaining many years of environmental exposure in hours or days. The most common techniques are hygro-thermal aging and thermal cycling. The first method involves the immersion of samples into water baths at very high temperatures. The second method involves the cycling of the sample at different temperatures for a variable amount of cycles. Following cycling, different types of tests take place to verify the change in mechanical properties and structure of the material.
This thesis will further research the degradation of GFRP materials in relatively cold climates. It will try and prove the effectiveness of such material, not only in the context of aesthetics, but also as a primary structural element.
With this in mind the scope/key objectives of this work will be to understand:
- Whether aging of the samples through temperature cycles will cause deterioration and how the deterioration rate varies depending on the number of cycles.
- Whether tensile testing at varying temperatures brings to different rates of failure, load capacities and failure modes.
- Whether the research supports the statement that GFRP material could be used for connections and other structural elements in the near future.
- Whether the results from previous research can be correlated to the ones in this thesis to formulate a better understanding of the behaviour of GFRPs.
This research paper will analyse the ways a GFRP connection behaves after undergoing thermal cycling. Differently from some of the previous research which focused on strips of the material, this thesis will focus on pinned connections. These are the areas with the highest stresses, moments and forces, resulting in the most probable failure region in structures. The samples will be cycled between -20°C and +20°C, in order to replicate weather in the colder parts of the world. Tensile testing of the connections will then take place at temperatures of -20°C, 0°C and 20°C and will be considered in relation to a baseline of un-cycled specimens in order to analyse the rate of deterioration due to aging.
Some initial remarks with regards to the experimental procedure are related to the limited time available for this project. Considering this restraint, the temperatures at which the samples will be cycled along with the number of cycles will have to be limited. Moreover, soaking of samples will not be possible and therefore one of the main causes of degradation will have to be ignored.
3.0 Literature Review
In an era where developments in the construction industry are reaching new highs, the research for new and improved materials has received a lot of interest. One of the most relevant studies is based on the development of Fibre Reinforced Polymers. These are, in their simplest form, fibres embedded into a resin matrix, which allow for a stiff and strong material defined by the fibres, whilst remaining durable and tough due to the resin. Within this context, we understand the importance of the bond, which becomes key in defining the efficiency of the material. The fibres contained in the FRP can range between different materials with the most common being: carbon, aramid, basalt and glass. Out of these the most used has become glass due to its low costs and high resistance to environmental degradation (Grammatikos 2016). Whilst the material was once used primarily due to its ductility, being able to achieve any shape desirable, GFRP are now starting to be used in more structural situations due to their very high strength:weight ratio, their high durability and their low maintenance requirements. The first structures entirely made of GFRP material have been edified, all of them displaying very high strength with reduced construction times.
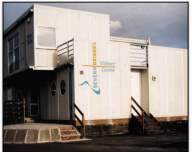

Figure 3.1: On the left the Severn Visitor Centre in England (1992-2009). On the right Mondial House in London (1975-2006). Even if with a limited life span both structures displayed very high strength properties especially during demolition.
However, the main issue associated with this material is the lack of information regarding degradation due to environmental exposure. In fact, all GFRP structures currently have a lifespan of less than 50 years, not enough to analyse their performance.
3.1 Background to GFRP material
One of the most important properties of FRPs is the apparent resistance to very harsh climates stemming from the materials high fatigue and corrosion resistance (Grammatikos 2016) (Figure 3.2).
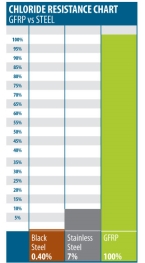
Figure 3.2: Studies from FRP distributors inc. in Canada show the chloride resistance of GFRP compared to that of black and stainless steel.
This has brought to new and promising applications for the material, including its use in offshore structures and in large-scale construction due to its high strength. However, the main problem deriving from FRPs, is linked to their long-term durability. The biggest unknown surrounds the behaviour these composites will have when in contact with elements such as moisture, temperature and UV radiation for long periods of time (Keller 2007). One of the greatest issues related to GFRP regards the hydrophilic properties of the glass fibres and hence the fragility of the bond when moisture enters the matrix structure. In addition to this, the infiltration of water can cause the widening of the polymers pores due to the expansion of water molecules causing a decrease in the strength of the material. Some relatively long term analysis has been performed by Keller et al. [2007], on the Pontresina Bridge in Switzerland. This is a pedestrian bridge built in 1997 and located at a height of 1790 metres where temperatures fluctuates between -20°C and 25°C Degrees. The bridge is temporary as it is kept as a crossing during the winter but then removed between spring and autumn due to the high-water level. The authors removed the bridge in 2005 after 8 years of service and analysed how the GFRP material had responded to the environmental exposure. Several cracks and cuts could be observed on the bridge, as shown in Figure 3.3, most of them related to acts of vandalism or damage done during installation. The authors noticed no losses in stiffness but a decrease between 13%-18% of the materials strength.
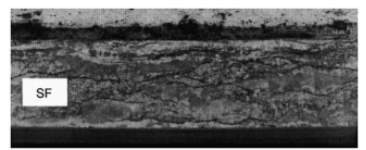
Figure 3.3: Surface degradation of upper cut of GFRP material due to loss of sealing layer from Keller et al. [2007]
This loss was seen as noncritical by the authors due to the high effective safety factors. However, this still suggests uncertainty in the use of GFRP since, if the decrease in strength was to proceed linearly, after 60-80 years the situation could become critical (Keller 2007).
Due to the limited design life of FRP buildings, various attempts have been made in creating prediction models for the life of the material. Some of the most successful techniques are based on the Arrhenius Model. The relationship is based on finding the changes in percentage of a chosen property due to cycling of the material. These values are then plotted on the major Y-axis versus time, plotted in log scale. This allows for the plotting of regression lines, from which vertical lines can be drawn to find the time needed to reach a chosen amount of property retention. These values can then be used in an Arrhenius plot where time can be plotted as a function of inverse absolute temperature for various percentages of property retention. Alternatively, property retention may be plotted as a function of inverse absolute temperature for various chosen lifetimes (Bank 2003). Bank et al. [2003] attempts to create a model based on the Arrhenius relationship to predict the change in material properties of polymer composites undergoing accelerated aging. As shown in Figure 3.4 the authors successfully create an Arrhenius plot to represent the change in % property retention with time and temperature.
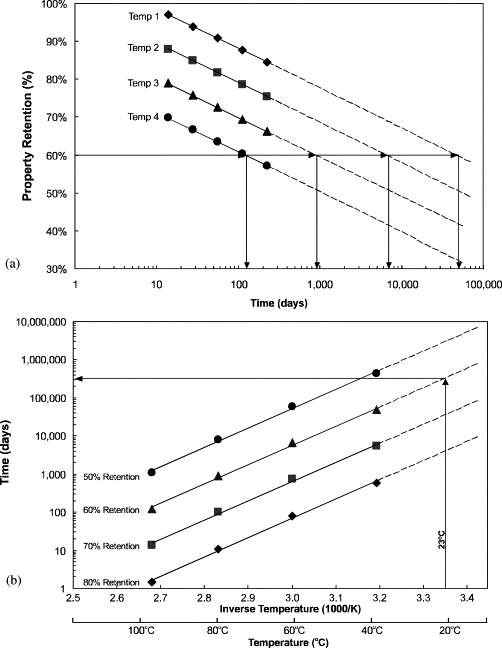
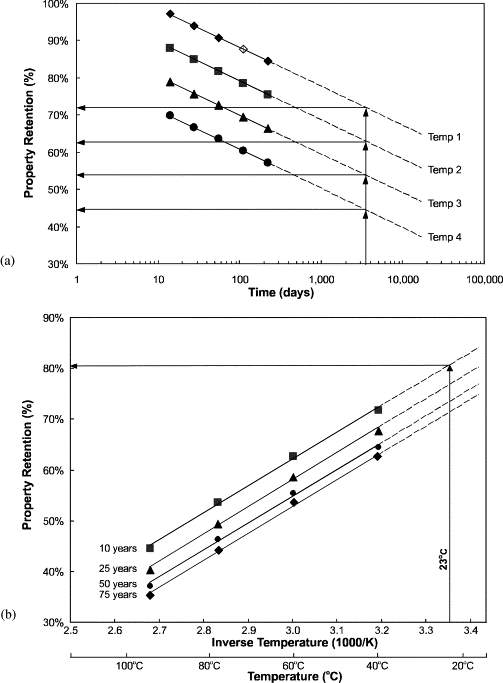
Figure 3.4: On the left an Arrhenius Plot of time as a function of inverse absolute temperature for various chosen lifetimes. On the left Arrhenius Plot of property retention as a function of inverse absolute temperature for various chosen lifetimes, from Bank et al. [2003].
Whilst being an effective and fast method to use, it is limited because it ignores possible changes in the rate of degradation throughout cycling and it does not account for further chemical degradation when reaching very high or sub-zero temperatures. Due to these limitations, the Arrhenius relationship has left space to more practical research techniques, such as accelerated aging. More specifically hygrothermal aging and thermal cycling have achieved most of the attention from the past literature.
3.2 Hygrothermal Aging
Hygrothermal aging involves the exposure of samples to hot-wet conditions for a chosen amount of time, followed by their drying at high temperatures, with this process being cycled as many times as required. Evidence of such research can be seen in Zafari and Mottram et al. [2012], in which samples of polyester polymers from Creative Pultrusions (2011) were tested. The samples underwent Hygrothermal aging by being immersed into water at a constant temperature of 40°C for 3000 h, to represent 1.6 years design life in the UK. In this case, the temperature chosen wasn’t as high because it was theorized that at higher temperatures additional (chemical) degradation processes would take place that would amplify the loss in mechanical properties, leading to unreliable results. Following cycling, a decrease in the characteristic strength of the material was noticed, ranging between 19%-28% of the initial strength (Figure 3.5).
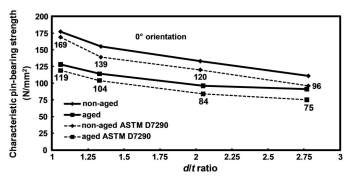
Figure 3.5: Difference in Characteristic strength between aged and non-aged samples with different d/t ratios, from Zafari and Mottram et al. [2012].
The degradation could be related to the infiltration of water into the matrix of the sample. As glass fibres are hydrophilic, they are pushing to form bonds with the water molecules. The prolonged (3000 h) exposure to water could have caused the weakening of the bond between resin and fibre resulting in a reduced shear strength. There is, however, a degree of error in the final results. Suggesting that the effect is not constant and aging occurs at different rates throughout each sample. The authors considered only temperatures of 40°C for the hygrothermal aging of samples, instead of viewing how an array of temperatures would affect the strength properties. This was done more effectively by Liao etal. [1999], in which samples of pultruded E-glass fibre-reinforced vinyl ester composites were tested. The samples were analysed under different conditions including immersion in de-ionized water at 5% and 10% salt solutions. The hygrothermal cycles were completed at room temperature and at 75°C. Samples underwent cycling for a variable amount of time, between a minimum of 1360 hours and a maximum of 9120 hours. The authors noted that the flexural modulus of the samples remained constant, whilst the flexural strength underwent degradation losing between 4.8% and 13% of its initial strength (Figure 3.6).
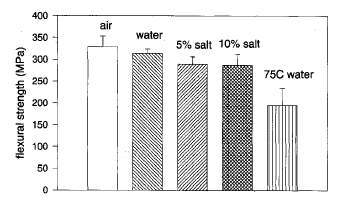
Figure 3.6: Variation in flexural strength for 0° GFRP specimens before (air) and after hygrothermal aging for a variable number of hours, from Liao et al. [1999].
There was also a decrease in the tensile modulus of around 23%, whilst the tensile strength dropped by 29%. Once again, the degradation is initiated by the physical/chemical reactions taking place within the structure of the GFRP. This is due to the hydrophilic properties of the material, in this case accentuated by the bad porosity of the matrix structure. In fact, when water enters the samples it is trapped inside and as it expands over time it causes creeping and cracking inside the polymer decreasing its strength. The variation in degradation of the samples was mostly related to the variation of the bonds in the fibre – resin matrix. An improved matrix to fibre bonding would allow a decrease in the loss of mechanical properties. It was also ascertained by Liao et al. [1999] that the “higher the temperature of the environment and the longer the exposure time, the larger the decrease in strength and modulus of GFRP”. However, this can only be referred to the specific example as changes in the temperature and duration of the aging process could yield different results. The following conclusions were formulated; aging in water and salt solutions leads to degradation in flexural and tensile properties of the material due to the porosity of the matrix and the hydrophilic properties of the fibres. Accelerated aging produces changes in the samples properties at different rates, therefore caution should be used when comparing accelerated and normal aging (Liao 1999). Liao et al. [1999] obtained reliable results for the degradation in tensile strength and tensile modulus with an error in the materials flexural strength of about 9%. This allowed for the formulation of the following statement: “different sorption behaviours for aging in elevated temperatures indicate different aging mechanisms”. This statement supports the claim that accelerated aging processes are very variable and are not always representative of real life aging. The moisture saturation in the above cases caused significant levels of deterioration in the samples. However, GFRP structures in real life applications would rarely be continuously in such hot wet conditions. Suggesting that the process over deteriorates the material. Moreover, it activates chemical reactions in the (hydrophilic) bonds which wouldn’t necessarily take place. It can be argued that a better representation of the aging process can be achieved through thermal cycling.
3.3 Thermal cycling
Thermal cycling involves treating the samples to continuous changes in temperature between a maximum and minimum value. Chin et al. [1997] uses this aging process with samples of epoxy vinyl ester and isophtalic polyester resins. Once aged, the samples were tested for tension failure to analyse the level of deterioration. Samples were firstly soaked for 1300h at ambient temperature in distilled water, salt water and an artificial concrete pore solution. This was done to emulate respectively rainwater, a marine or offshore environment and the interior of a cementitious material for reinforcement bars. The samples were then removed and thermal cycled between 25°C and 180°C. This produced an unreliable loss in tensile strength, due to the large error in the results. Moreover, the very high temperatures meant that the glass fibres reached their transition temperature and a change of state occurred to a more rubber like material. This caused an expansion of the glass fibres, contrasted by the binding effect of the resin bringing to cracking and creeping throughout the sample and weakening of the bond. In addition, the reduction of mechanical properties of the composite could also be related to the hydrophilic attraction between the glass fibres and the water molecules during the soaking process (Figure 3.7).
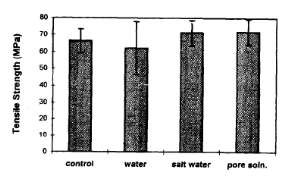
Figure 3.7: Change in tensile strength properties of GFRP samples immersed in different solutions after thermal cycling of soaked samples from Chin et al. [1997].
The authors made the samples undergo cycles of very high temperatures, whilst soaking them in three different liquid solutions. This presented some interesting results in defining the change in properties of GFRPs for different environments. However, the extremely high temperatures allowed the samples to reach their glass transition temperature, creating cracking and losses in mechanical properties. This choice of temperatures is not representative of most realistic temperature fluctuations. Moreover, by avoiding sub-zero temperatures the samples didn’t undergo freezing, excluding the deterioration due to freeze – thaw, one of the most important and common processes. A more realistic series of testing was completed in Sousa et al. [2014]. Thermal cycling was used to age and test the performance of two square tubular sections of “off the shelf” pultruded GFRP profiles with different resins: unsaturated polyester resin (UP) and vinylester resin (VE). Specimens were cut off from the profiles and then subjected to three different number of cycles: 70, 120 and 190 cycles. Each cycle consisted in movement between -5°C and 40°C. The properties of the material were then tested through: flexural, tensile and interlaminar shear tests. All tests showed linear elastic behaviour of the material until rupture for both resin types. A general decrease in tensile strength with the increasing number of thermal cycles is noted for the UP resin. Decreasing to 92% after 70 cycles, 94% after 120 cycles and 87% after 190 cycles. Unexpectedly the VE resin samples underwent an increase in tensile strength of 3%, 4% and 8% after70, 120 and 190 cycles. Whilst the loss in strength of the UP sample is mostly due to the fibre-resin debonding caused by the thermal cycling. The VE resin behaviour is defined as related to the reticulation of the resin bonding due to the high temperatures used (40°C) (Sousa, 2014). More interesting is the change in interlaminar shear strength of the samples, in both cases starting with a decrease followed by an increase. The UP resin moved from 91% to 94% to 89% of the initial interlaminar shear strength for the relative 70, 120 and 190 cycles. Whilst the VE resin for the same number of cycles achieved 95%, 92% and 98% of the initial shear strength (Figure 3.8).
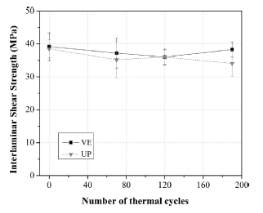
Figure 3.8: Change in Interlaminar shear strength properties due to thermal cycling from Sousa et al. [2014]
The variable number of cycles along with the wide temperature gap allowed the authors to obtain some very useful information on the properties of GFRP. However, the error in the results suggests that further experimentation is needed to formulate more accurate results. The change in the mechanical properties of the polymer can be attributed to the effect of freeze-thaw. When reaching sub-zero temperatures, the bonds became more brittle and when cycling back to the higher temperatures they were forced to expand once more. This continuous expansion and contraction in the polymer matrix would have caused many of the bonds to break and cracks to form in the matrix, weakening the sample. However, the results are still limited by the number of cycles and sub-zero temperatures chosen for testing. It would be more relevant to test the effect of aging over a wider temperature gap and for a larger number of cycles. This was partly achieved by Robert et al. [2010], in which freeze-thaw cycling was used to age samples of sand-coated glass FRP reinforcing bars made of continuous out of plane E-glass fibres. The samples were separated into two groups, unconditioned and conditioned samples. The conditioned samples were saturated in water at a temperature of 50°C. Following preparation all samples underwent thermal cycling under extreme conditions. Sub-zero temperatures including: -100°C, -80°C, -60°C, -40°C and -20°C were used, along with warm temperatures of: 0°C, 50°C, 100°C, 150°C, 200°C, 250°C and 325°C. Following cycling, various test procedures were used to evaluate the change in mechanical properties of the samples. For temperatures, lower than -50°C there was a severe decrease in the mobility of the molecules in the polymer, which caused the bonds in the matrix to become stiffer and more brittle. Above 80°C the high temperatures caused the glass fibres to reach their transition temperature, expanding and creating cracks inside the GFRP matrix, significantly weakening the material and decreasing its mechanical properties (Figure 3.9).
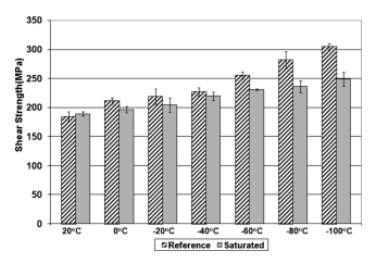
Figure 3.9: Shear strength of unconditioned and saturated samples undergoing different thermal cycles, from Robert et al. [2010].
It was concluded that, as the temperatures decrease the bonds in the polymer become stiffer and more brittle. Furthermore, in the saturated samples, the expansion of water molecules during cycling at sub-zero temperatures caused creep and cracking inside the matrix bringing further degradation to the mechanical properties. At higher temperatures, instead, there was a noticeable reduction in the strength of the samples due to cracking, caused by the expansion of the glass fibres, especially when reaching their transition temperature. The authors managed to obtain an overall view of how GFRPs are affected on a wide spectrum of temperatures. They managed to formulate logical conclusions regarding the behaviour of GFRPs at high and low temperatures. However, the large temperature gap meant that the loss in properties was greatly due to chemical reactions (involving changes of state), which wouldn’t take place under more realistic conditions. A more representative choice in the temperatures for the aging process along with an increased number of cycles would have yielded more valuable results. This was achieved in Grammatikos etal. [2016], in which the authors analysed the response of a 5-layer GFRP flat sheet containing E-CR glass fibres and isophtalic polyester resin. Both dry and wet samples were considered, the wet samples were achieved by immerging the polymer in water at a constant temperature of 25°C for 224 days. The samples were then placed in an environmental chamber and cycled between -20°C and 10°C for 0, 100, 200 and 300 cycles. Following on, various mechanical and structural tests were employed to analyse the degradation in the material. The results displayed a significant error but showed a general decrease in the materials tensile strength for the soaked samples of about 10% countered by an increase in the dry samples strength of 10%. Both dry and wet samples showed a decrease in their shear strength with a loss of around 30% for the wet sample and a loss of just about 3% for the dry sample after 300 cycles. It was concluded from the experimental results that the increase in the dry samples and the decrease in the wet samples tensile strength was negligible due to the high standard deviation. It was probably the changes (degradation for the wet samples) occurring in the polymer matrix, which lead to micro cracking and/or matrix readjustment. There was, instead, a significant degradation in the wet samples shear strength. This was probably due to the expansion of the water molecules in the matrix during thermal cycling, bringing to the formation of micro cracks throughout the specimen’s structure resulting in a minimal loss in mechanical properties for the dry samples (Figure 3.10).
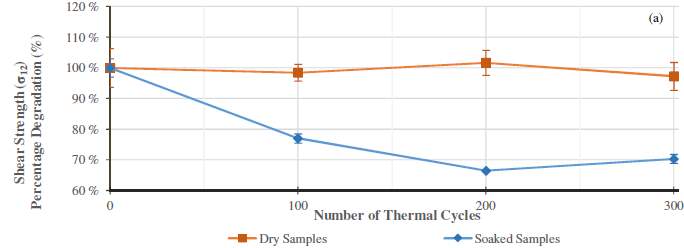
Figure 3.10: Change in shear strength properties for saturated and dry samples after 100, 200 and 300 cycles from Grammatikos et al. [2016].
The authors were able to focus on various properties of the GFRP samples considered. This allowed for a wide range of results, representative of possible real life applications due to the appropriate choices of cycling temperatures. A significant deviation in the percentage mass loss of the samples due to thermal cycling was noted. Suggesting that, following aging, the samples underwent a variable loss in the amount of water content (if soaked) and in the amount of material (fibres/resin). This reflected in the testing of the material properties causing the results to be discontinued. Focusing on one of the properties of the material would render easier the control of variables throughout the testing.
3.4 Sample Testing
Most of the testing on GFRP has been done on sample strips of the material. Whilst this could be seen as reasonable in the context of analysing the material itself, it could be more useful to test the functionality of a GFRP structure in its more critical regions. In most structures, this will probably be at the connections. In fact, whilst most beams would only undergo tension or compression (in standard situations), connections take several forces, stresses and moments combined together. Moreover, they take the above effects from as many sources as the number of members they are connecting. This makes the design of connections very complicated and essential in avoiding global structure failure bringing to their overdesign in most situations. Even so, there are only a limited number of studies based on the analysis of GFRP connections. We can find evidence of testing of GFRP pinned connections in Zafari and Mottram et al. [2012], in which the authors analyse various connection failure mechanisms suggesting that bearing is the most useful mode of failure. Bearing allows for a more ductile breakdown of the polymer, allowing to analyse its behaviour and notice when the material moves form elastic to plastic deformation, when it yields and when it fails (Zafari and Mottram, 2012). Plate geometry ratios are suggested to improve the possibility of obtaining bearing failure, namely e1/d and 2e2/d (Figure 3.11). Stating that they need to be equal to “four or more” (Zafari and Mottram, 2012). The authors confirm the above to be correct in their results, showing areas of plateaus where the material is yielding before eventually failing when using the above ratios.
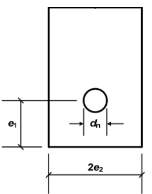
Figure 3.11: Plate geometry notation
The authors also provide a good theoretical background to the requirements of plate geometry in order to obtain the chosen failure mechanism. The study also observes how the geometry affects the characteristic strength and failure mode of the connection.
Aside from plate geometry, torque can be considered when designing pinned connections. In Turvey et al. [2000], the authors analysed the structural performance of joint geometry and bolt torque on single bolted tension joints. Three different torque conditions are considered: the pin bearing condition (0Nm), the lightly clamped condition (3Nm) and the fully torqued condition (30Nm). Each joint consisted of a tight fitting M10 grade 8.8 bolt connected to two steel side plates. The GFRP material tested consisted mostly of E-type glass in a polyester resin. The connection was then pulled until failure at a constant rate of 10kN/min. It was demonstrated that an increase in torque would require a higher value of e1/d and 2e2/d to achieve bearing failure. For a torque of 0Nm, 2e2/d was between 5 and 7 and e/d was between 3 and 4. For a torque of 3Nm, 2e2/d was between 6 and 10 whilst e/d was between 4 and 5. Lastly for a torque of 30Nm, 2e2/d was equal to 10 whilst e/d was equal to 6.5. Even though the bearing failure resistance increased as the torque increased, these results are somewhat unreliable. In fact, as polymers are viscoelastic materials, their resin matrix will get crushed under the torque pressure. This means that the material itself will be weakened as creep develops and the torque itself will be rendered useless. Therefore, it would be most effective to finger tighten the bolts, using a maximum torque of 3Nm.
3.5 Past Literature Final Remarks
It is evident from the past literature that research has focused on understanding the behaviour of GFRP material in different conditions. Various methods have been considered to age the product and then test its performance in harsh situations. This has allowed for a major improvement in the engineering knowledge of GFRPs. However, there are still many unknowns surrounding the material, in some cases enhanced by the research itself, which has provided a great array of results and errors. As anticipated there is a lack of research on GFRP connections, which are actually the most probable failure location in structures. I will therefore test a bolted connection, finger torqued for shear out/pin bearing failure. The variance of past research with regards to the shear strength of the material along with the unexpected increase in the property after aging (Sousa, 2014) make it an area worth studying. Along with the above properties the Young’s Modulus for each sample will also be calculated to view the change of elastic properties of the sample with aging. With regards to accelerated aging, this review has considered two techniques: hygrothermal aging and thermal cycling. Between the two, thermal cycling has been recognized as the most representative of actual design life conditions and has been chosen for this thesis. The temperatures considered in the cycling process will be -20°C and +20°C as this represents a realistic fluctuation the connections could feel during their design life. Testing will occur at three different temperatures (+20°C, 0°C and -20°C), in order to analyse the combined effect of temperature and aging. This research will allow for a better understanding of how the material itself works inside a structural system. This will allow a discussion of whether GFRPs could be a useful alternative or even a substitute for standard structural materials.
4.0 Material Properties
The material considered in this thesis is a 5-layer commercially available pultruded GFRP flat sheet provided by “Creative Pultrusions Inc.”, PA, USA (FS040.101.096A) (Grammatikos 2016). The material is 6.4mm thick with an external face covered by an additional protective polyester non-structural film. The film is composed by 45% of E-CR glass fibres bonded to isophtalic polyester resin which serves as the polymers matrix. Figure 4.1 depicts the structure of the GFRP samples, composed of 3 continuous strand mats (made out of 33.3% glass fibres) and 2 unidirectional roving layers (of which 54.5% are glass fibres).
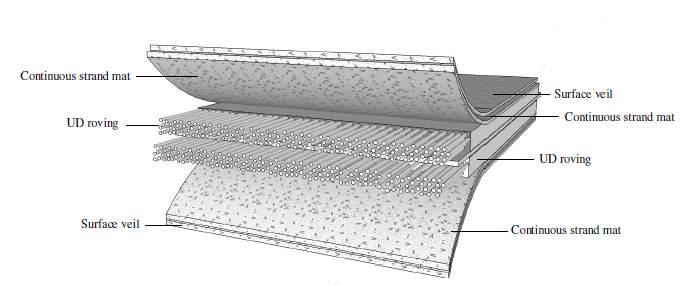
Figure 4.1: Structure of GFRP sample considered composed of 3 continuous strand mats, 2 surface veils and 2 set of UD rovings, from Grammatikos et al. [2016].
All specimens are cut off the same composite flat sheet of material using a water-cooled diamond saw. A total of 36 samples are cut and then divided into four groups of 9 samples each. The first group of samples will be uncycled, the second will undergo 300 cycles, the third 400 cycles and the fourth 500 cycles. In order to choose the correct plate geometry, which would allow for bearing failure, the ratios discussed in Zafari and Mottram et al. [2012] are considered. The following calculations were carried out:
e1d>4 and 2*e2d>4 (e1 and e2 are defined in Figure 1 above)
e1>4d and e2>2d
e1>40mm and e2>20mm
The width (2e2) is therefore assumed to be equal to 55mm (e2=27.5mm). More thought needs to be given to the end distance e1. As discussed earlier the required mode of failure is bearing, however an overdesigned end distance would not allow for a change in failure mode between the uncycled and cycled specimens. Therefore, it is necessary to find the end distance which will just yield bearing failure over shear out and set the end distance of the plate to just above this value. In order to achieve this, the safe end distance of 26mm from the centre of the notch will be used and increase until bearing failure is reached. Once the relevant end distance for the plates is found the holes will be drilled using a pillar drill and an M10 drill bit.
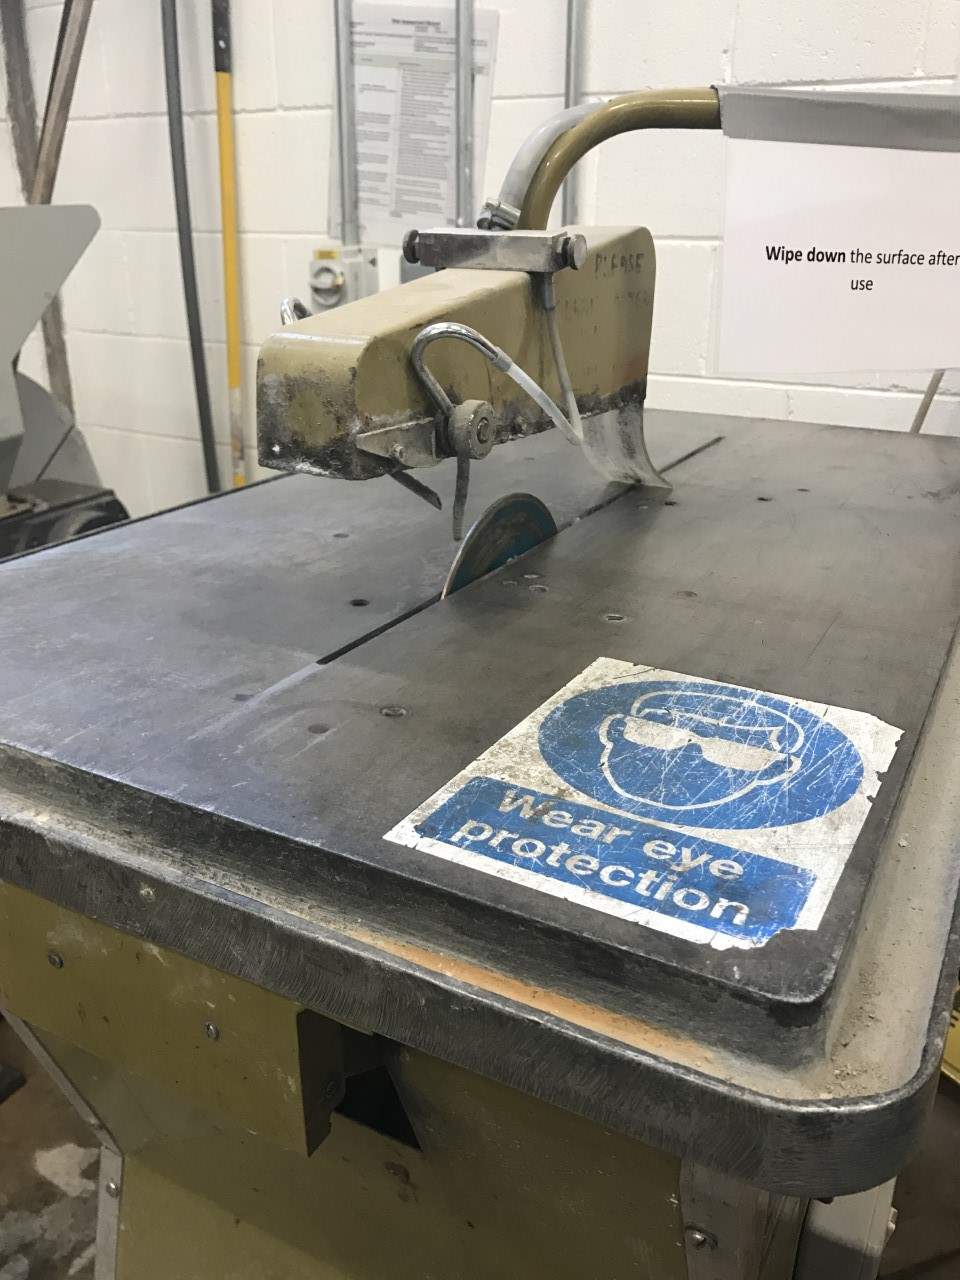
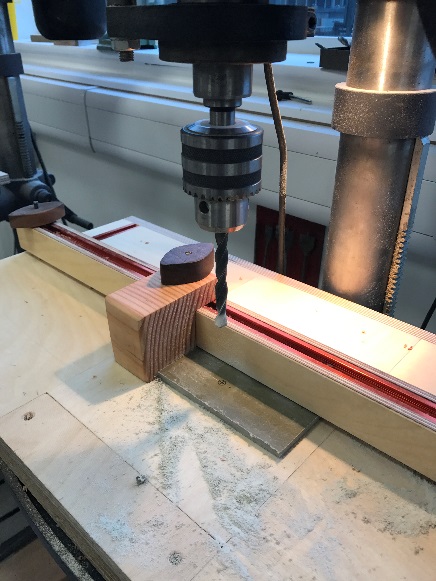
Figure 4.2: On the left water cooled diamond saw used to cut plate from larger mat. On the right Pillar drill with M10 drill bit used to create bolthole.
This will produce the samples as shown in Figure 4.3.
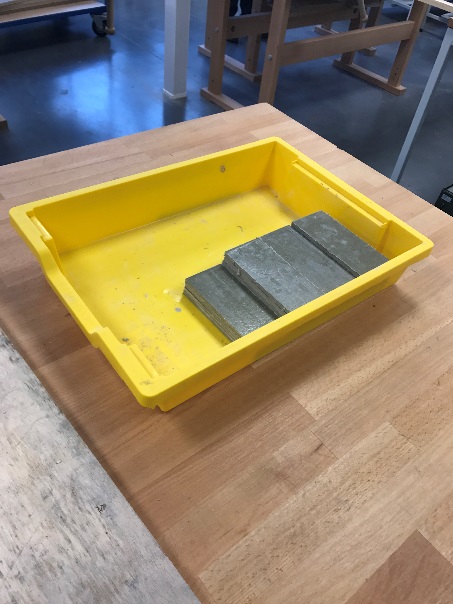
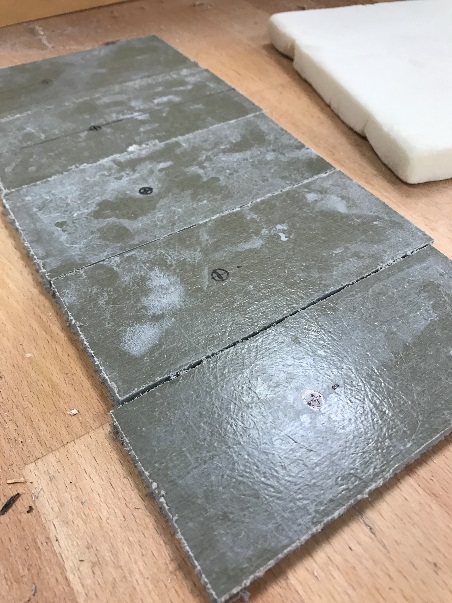
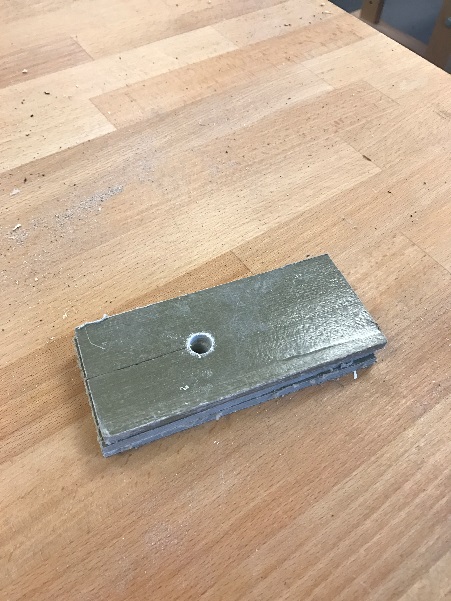
Figure 4.3: On the left samples after cutting with the diamond saw, in the centre samples marked up for drilling and on the right samples after drilling.
All samples will be stored at room temperature in a closed but ventilated environment to avoid any water ingress before thermal cycling.
5.0 Experimental Procedure
5.1 Thermal (Freeze – Thaw) Cycling
Samples are cycled using an Angelantoni Technologies DY110SP environmental chamber supplied by the University of Bath. Each thermal cycle will have a duration of 1 hour, including heating the sample from 0°C to +20°C for 15 minutes, then cooling it to -20°C for 30 minutes and heating it back up to 0 °C for 15 minutes. Thermocouples are applied to samples inside the environmental chamber in order to monitor the functionality of the cyclic temperature inside the machines. In Figure 5.1 we can observe part of the log temperature readings showing the consistency of the change in temperature between -20°C and +20°C. Some difficulty was encountered when cooling the samples to -20°C, as can be seen below, negative temperatures were at a maximum around the -17.5°C mark.
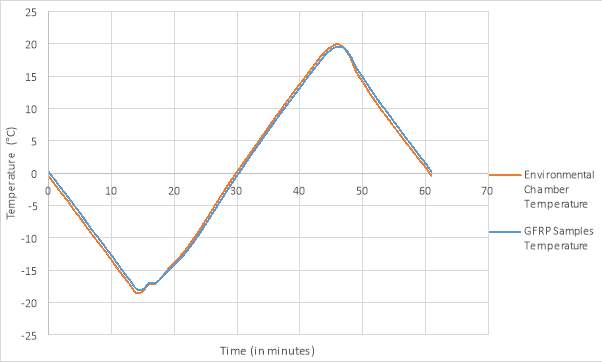
Figure 5.1: Thermal cycling data for the GFRP samples showing both environmental chamber and samples temperature fluctuations.
The temperatures chosen simulate a common continental environment. The upper bound temperature of +20°C falls below the glass transition temperature (+126°C). This is done to avoid the activation of further chemical decomposition in the sample. Similarly, the lower bound temperature of -20°C is above the matrix freezing temperature of glass (-30.4°C). This ensures that brittle failure or/and cracking due to freezing of the resin is avoided.
Once the aging process is complete, the samples in each of the four groups will be divided into three subgroups, each containing three samples. This is done so that each subgroup will be tested at different temperatures of -20°C, 0°C and +20°C.
5.2 Mechanical Testing
Mechanical testing will take place as described in the existing standards for mechanical testing of Fibre Reinforced Plastics, BS EN 13706-2 (E) (British Standards Institution 2002 Annex E), with some minor modifications to achieve the required results.
Firstly, the samples will be checked to be at the correct testing temperature using an infrared thermometer. They will then be single pin bolted (using an M10 8.8 grade bolt) to two S275 steel plates welded together.
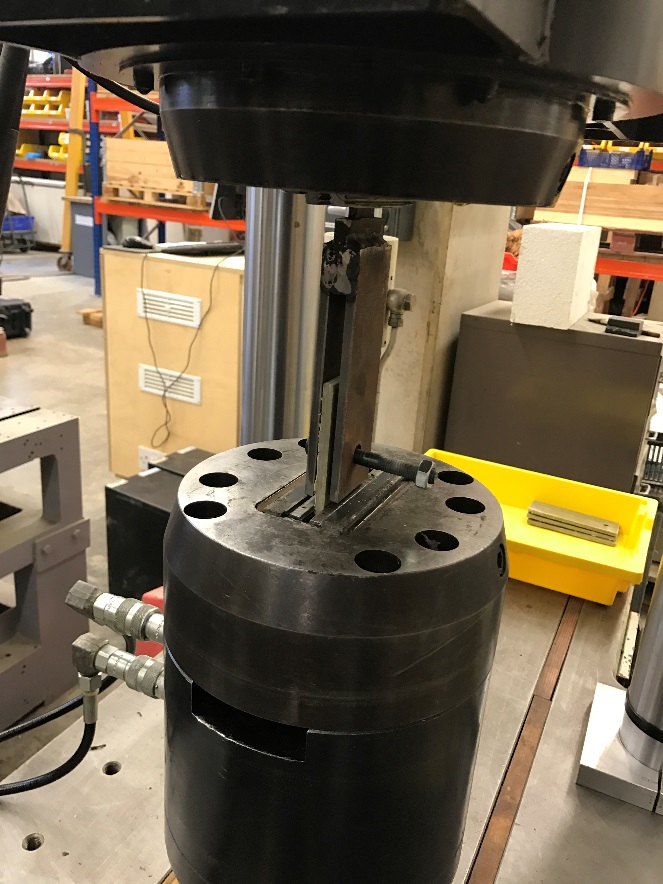
Figure 5.2: Experimental setup, sample plate is single pin bolted to welded plates and inserted in D.H.200 (kN) machine for testing.
The setup will be inserted into a Denison Mayes D.H.200 (kN) machine, supplied by the University of Bath and pulled apart until failure at a constant rate of 1mm/minute (Figure 5.2). Initially a set of uncycled samples will be tested in order to find the critical load and to set a maximum failure load on the machine. Testing will then start with the uncycled samples; these will be pulled to 20% of the critical load, found using the test sample, and held at the load for 30 seconds. The load will then be reduced to 7.5% of the failure load and held for another 30 seconds. Following these two initial steps the samples will be pulled until failure. The choice of an initial loading sequence is related to overcoming any premature cracking before reaching the maximum load capacity. Once failure is reached the samples will still be pulled for a total strain of 7mm in order to view how the material performs following failure. Thermocouples will be used to measure the variation in temperature throughout testing in order to verify whether there is a general temperature at which the samples are more likely to fail. The failure load and the strain applied to the connections will be recorded in order to verify how the use of different number of cycles along with the testing at different temperatures influences the strength and Young’s Modulus of the GFRP samples.
5.3 Aims of the test
The aim of the test is to provide an indication of the extent to which aging in a continental climate causes degradation in GFRPs. The procedure aims to analyse specifically the effects on single pin bolted connections as these represent one, if not the most, critical point in structures. Testing will occur at different temperatures in order to view how colder periods or warmer periods affect the elastic properties of the samples.
5.4 Predictions
By considering the past literature, it can be observed that thermal cycling results are variable and at times unexpected. Grammatikos et al. [2016], recognizes an increase of around 10% in the tensile properties of the dry samples, quite unexpected considering the material had been aged. The shear strength for the dry samples, instead, fluctuated increasing at first and then decreasing by about 3% with a considerable error. These results along with the many more considered earlier, make it difficult to be certain of the behaviour of the material after cycling.
Considering reasonable assumptions and referring to the expected degradation of material properties over time. It can be predicted that as the number of thermal cycles is increased the degradation in the GFRP samples will increase. This is due to the increase in stress and strain taking place in the material caused by the movement between warm and sub-zero temperatures. This continuous change should cause the material to expand and contract, causing creep to develop throughout the structure. Moreover, the different rate of expansion and contraction between fibres and resin, throughout cycling, should cause further cracking in the materials matrix and weakening of the bond.
Testing at different temperatures should also cause a change in the materials properties. When testing at sub-zero temperatures the bonds will become more brittle, resulting in a more abrupt failure at a temporarily higher strength. Instead testing at higher temperatures will mean that the bonds will be more ductile and strain for longer before failing
Generally, it would be expected that as the testing proceeds all mechanical properties will decrease. The extent to which the sample will degrade after 300, 400 and 500 cycles, however, is hard to predict. In order to have a better understanding of the change in properties the work by Keller et al. [2007] is considered. The publication refers to the analysis of the Pontresina Bridge, entirely made out of GFRP, after eight years of environmental exposure. The bridge underwent many thermal cycles with a mean average temperature of 4°C with maximum and minimums ranging between +25°C in the summer and -20°C in the winter. Values very similar to the ones considered in this thesis (-20°C and +20°C temperature cycling). The data collected from the Pontresina Bridge analysis can, therefore, be used to predict the change in properties of the GFRP bolted connections after 500 thermal cycles. The bridge underwent a decrease of between 13%-18% in its strength, this suggests a weakening in the polymer matrix and of the resin to fibre bond due to environmental exposure. It is therefore reasonable to expect similar results in this thesis, once thermal cycling is completed. However, it is important to note that the chosen number of thermal cycles will be representing far more than eight years of exposure. Therefore, the decrease in strength can be expected to be more significant. However, it is also important to note, that the environmental exposure will be different to the one experienced by the Pontresina Bridge. There will be an absence of constant loading and moisture ingress as the material will be aged in a chamber. Moreover, factors like vandalism or cracking due to wrong loading or wrong installation need to be ignored. This reduces the expected degradation of the lab samples which could actually result in higher strength properties than the GFRP material in the Pontresina Bridge.
6.0 Results
6.1 Plate Geometry
To find the correct plate geometry required to obtain the limit between shear and bearing failure, 6 different vertical end distances (e1) were considered (measured from the centre of the bolthole): 26mm, 28mm, 30mm, 32mm, 35mm and 37 mm. These were all tested as per the experimental setup previously defined (see 5.2 Mechanical Testing). The failure load, strain and mechanism were all recorded in order to formulate a decision regarding which geometry would be most effective in achieving the required results in the experimental analysis. Generally, all plates held a similar critical load, which ranged between 13 kN and 19 kN, with most values being around the 16 kN mark. This information will be used to assume a critical load of 20 kN for the actual testing. According to the experimental method introduced earlier (see 5.2 Mechanical Testing), before being pulled to failure the samples will be first pulled to 20% of the failure and held at this load for 30 seconds. Therefore, it is decided that the temporary load at which the samples will be held is 5 kN.
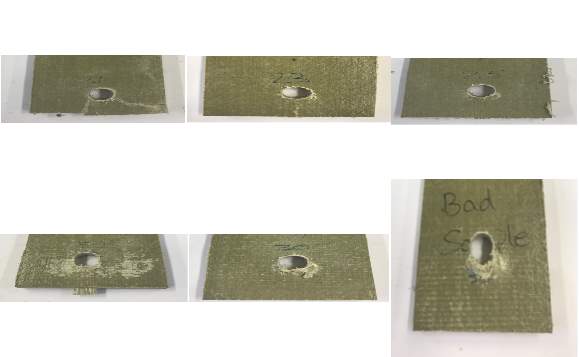
Figure 6.1: Failure mechanisms of plates considered in order to find the optimal vertical end distance (e1) that would yield the bearing/shear out failure limit.
By looking at Figure 6.1, above, it is possible to notice two main failure mechanisms (shear and bearing failure) along with the movement between the two as the end distance (e1) is increased. In Figure 6.1A, an end distance of 26mm is considered, causing a noticeable shear out failure defined by the cracks starting from the bolt hole and terminating at the centre and bottom right hand corner of the plate. A critical load of just over 13 kN is witnessed at failure, after a very limited amount of strain is applied. After failure, an abrupt decrease in the load required to strain the material is noticed, as shown in Figure 6.2.
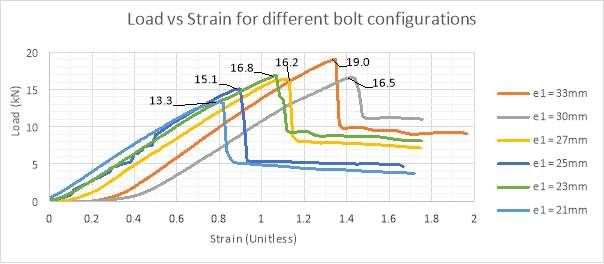
Figure 6.2: Load vs Strain for different bolt configurations.
This suggests that after the critical load, shear out has greatly decreased the materials strength. The data collected following failure becomes a limitation, since strain is minimal before failure. This reduces the information available for analysis of the material. It is, therefore, necessary to change the ratio to obtain a more substantial mode of failure. Figure 6.1B shows a reduction in the amount of shear out of the material, at least on the surface. A crack is present running from the end of the bolthole to the centre of the plate. Some material within the matrix has been pushed out underneath the crack. This suggests that shear out is still occurring inside the material even though the surface veils allow for a higher strength on the exterior. The critical load increases to just under 17 kN and following failure it decreases to 14 kN, 13 kN and finally 9 kN at a steadier pace to sample 6.1a. However once again strain is minimal prior to failure, limiting the available data. In order to achieve relevant information from the experiment it is necessary for the sample to demonstrate a less abrupt failure and more straining. Samples 6.1c and 6.1d demonstrate very similar properties as sample 6.1b with failure loads of 15 kN and 16 kN respectively, followed by an abrupt loss in strength. More relevant results are obtained in samples 6.1e and 6.1f. In both cases, we can observe that bearing is clearly the failure mode, with 6.1f representing the more obvious situation. Bearing failure causes the samples to achieve a failure load of 16.5 kN and 19 kN respectively. A less abrupt loss in strength is witnessed, with the material undergoing a much higher amount of strain before failure and allowing for a more relevant analysis of the material properties. Moreover, after initial failure, load starts building up again, further straining the material and failing once more. Therefore, an end distance (e1) of 35 mm will be used in order to achieve the required bearing failure condition.
6.2 Issues with testing at negative temperatures
Testing at zero and subzero temperatures was not possible due to limitations in the experimental method. Instead, storage of the samples at different temperatures for 24 hours before testing will be considered.
6.3 Effects on shear strength and pin bearing strength
Following thermal cycling and mechanical testing, the load vs strain relationship for each sample is recorded into an Excel Spreadsheet. The data is then analysed to determine the change in the load – strain relationship after 0, 300, 400 and 500 thermal cycles. A total of nine samples is tested for each thermal cycle group, subdivided into three groups due to the testing at three different temperatures. Three scatter graphs will be used to represent the data, each containing the average change in shear strength and pin bearing strength due to aging. Each scatter graph will consider the shear strength tested at one of the testing temperatures (0°C, +20°C and -20°C). In order to create these graphs, the failure collapse load will be read off the load vs strain plots and then used to calculate the Pin Bearing Strength (from CEN 13706 Part 2 Annex E) and the Shear Strength of the chosen sample:
Pin Bearing Strength=Load applied to plate at failureDiameter of plate*thickness of plate=Fbr= PCollapsed0*t
Shear Strength=Load applied to plate at failure2*End distance*thickness of plate=τ= PCollapse2*e1*t
As each subgroup contained three samples, an average failure load is calculated along with the relevant standard deviation. The initial shear strength and pin bearing strength values for the uncycled samples from the three load vs strain relationships, are included in the table below and are used as a baseline:
Table 6.1: Initial Shear Strength of GFRP plates at three different temperatures (0°C, +20°C and -20°C)
| Testing Temperature (°C) | Average Shear Strength (N/mm2) | Average Pin Bearing Strength (N/mm2) |
| -20 | 43.5 | 261.3 |
| 0 | 40.4 | 242.3 |
| +20 | 45.8 | 275.1 |
The same method was used in order to calculate the average shear strength and pin bearing strength for the 300, 400 and 500 thermal cycled samples. This allowed for the calculation of the percentage decrease in shear strength (for values see 10.0 Appendix, tables 10.1-10.6 for values). Once calculated, the percentage property retention values for both, the pin bearing strength and the shear strength, resulted very similar (with a difference of +/- 0.1%). Therefore, to avoid repetition, only the percentage retained shear strength versus the number of cycles has been plotted. Figure 6.3 shows the variation in shear strength of samples stored at +20°C.
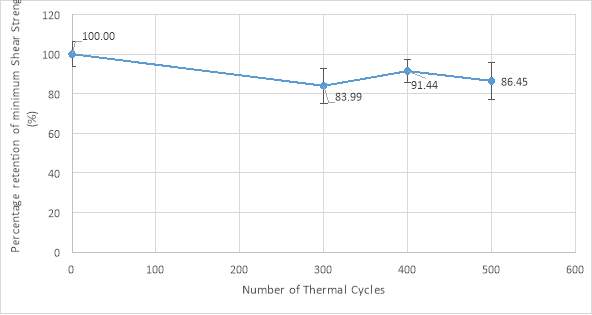
Figure 6.3: Effects of thermal cycling on Minimum Shear Strength of GFRP Plates stored at +20°C
A general decreasing trend is noticed in the average minimum shear strength. This suggests that thermal cycling has caused deterioration to the polymer matrix and therefore a reduction in the materials strength. Throughout the testing process all samples underwent bearing failure instead of shear out. This means that the values calculated above represent the minimum shear strength in the plates, instead of the actual full shear strength of the samples. However, the data can still be used to overview the amount of retained shear strength at failure and hence the effects of thermal cycling. As can be seen, by the magnitude of the error bars, the results for each cycle suffered a degree of error. However the deviation is still small enough to obtain a relevant set of data. A decrease of about 16% in the shear strength of the GFRP material is noticeable after 300 cycles. Followed by an increase of 7.4% after 400 cycles and another decrease of about 5% after 500 cycles. The deterioration of the sample doesn’t seem to be constant as the number of cycles increases. However, if a linear forecast is assumed, with the deterioration continuing at a similar rate, the sample could reach 70% of the initial strength after 1000 thermal cycles. Failure under serviceability conditions would become very probable and critical.
The data suggests a brief increase in properties of the material after 400 cycles of temperature. This suggests some sort of readjustment in the structure of the polymer. The constituent materials (fibre and resin) undergo state changes whilst moving between -20°C and +20°C, continously expanding and contracting. However the rate of strain is different betweent the fibres and the resin pulling and pushing the bonds in the matrix. This could cause a readjustment of the polymer structure, which re-organizes its bonds and the stresses in the matrix. This would explain the initial decrease in shear strength, as the matrix strains and readjusts. It would also define the increase in strength once the bonds and stresses have been redistributed.
As anticipated, during testing all plates underwent bearing, independently of the number of thermal cycles they were subjected to. It is noticeable, however, that with the increase in the number of cycles bearing failure becomes more abrupt. After 500 cycles, samples tested at +20°C failed under a lower load (from 17.605 kN after 0 thermal cycles to 15.219 kN after 500 cycles) and following a reduced amount of strain. The effect of cycling are also viewable In Figure 6.4, in which the bearing failure mode for the 300 cycled samples is more evident compared to the 0 cycled samples.

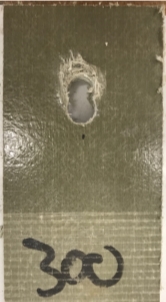
Figure 6.4: On the left bearing failure after 0 thermal cycles. On the right bearing failure after 300 thermal cycles for storage at +20°C
It is noticeable that the 300 cycled sample underwent more bearing failure shown by the width of the failure notch and the greater amount of material piled up towards the end of the bolt hole. The continous variation in temperature caused the resin and fibres to continously expand and contract at different rates. This difference further stressed the polymer as one of the components might have expanded whilst the other was static. After 300 cycles, the material didn’t have time to readjust its matrix and cracking occurred in the material, weakening the bonds.
More unexpected results are reached when testing at 0°C and -20°C. Figure 6.5 shows the change in shear strength properties for samples undergoing storage at 0°C.
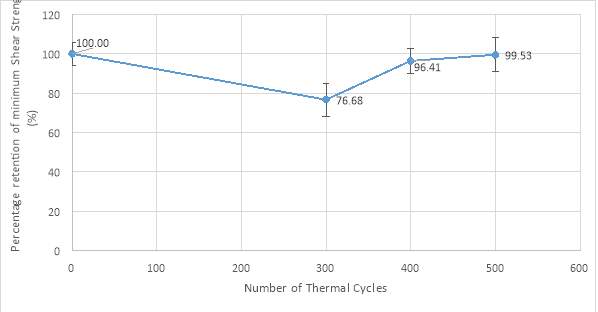
Figure 6.5: Effects of thermal cycling on Minimum Shear Strength of GFRP Plates stored at 0°C
An initial and very significant decrease in the mechanical properties of the polymer is present after 300 cycles of temperature, where the retained shear strength reduces to 76.7%. Unexpectedly, this is then followed by an increase after 400 cycles of about 20%. After 500 cycles, there is a further increase in shear strength ending up just 1% lower than the intial value. Even though the initial decrease and subsequent increase in properties is very significant, the error in the results lying at about +/-8% of the shear strength value suggests a degree of uncertainty, probably related to the randomness of the production process. However, a general trend can still be recognized in the data, with a forecasted average still lower than the initial strength. The decrease in properties, after 300 cycles, could be related to the additional stresses induced through freeze-thawing of the material. These, however, seem to be accentuated by the environmental conditions under which the samples were kept before testing. The increase in strength after 400 and 500 cycles, instead, could be related to the readjustment of the polymer matrix. As mentioned earlier the continuous straining due to thermal cycling of the material, causes the GFRP components to expand and contract, modifying their structure. As expected, this would initially cause cracking, suggesting the initial significant loss in material properties. However, once the system readjusts it could be able to take higher loads and therefore increase its shear strength. However, with an increasing number of thermal cycles, the materials bonds will still undergo large amounts of strain resulting in losses in strength. In Figure 6.5 this is represented by the reduction in shear strength gain after 500 cycles. This suggests that the polymer has restructured its matrix, reached a temporary peak strength and then restarted the degradation process. The shear strength of the polymer after 600 and 700 cycles would have to be analyzed, in order to view whether the trend holds after further aging.
Once again all samples underwent bearing failure. The difference between the 0 cycled samples and the 300 cycles samples is again noticeable. However differently from the samples tested at +20°C, no cracking is visible on the surface layer. On the other hand, bearing still appears more noticeable in the 300 cycled samples (Figure 6.6), where shear testing has caused further degradation in the material and therefore an increase in the material build up at then end of the failure notch.
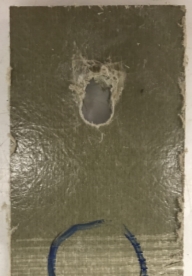
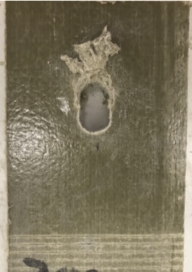
Figure 6.6: On the left bearing failure after 0 thermal cycles. On the right bearing failure after 300 thermal cycles for storage at 0°C
Furthermore it is possible to view the effects on the materials internal structure by observing the samples through their thickness. It is possible to view that the polymer matrix for the 500 cycled sample has deformed significantly in comparison to that of the 0 cycled sample (Figure 6.7). This suggests that whilst bearing occurred on the surface layer, some shearing might have occurred throughout the samples matrix causing cracking in the fibre resin-bond. This also suggests that the polymer matrix has been restructured following cycling, explaining the temporary gain in strength. However, further testing using techniques such as diamond indentation, would be necessary to provide evidence of such matrix degradation.
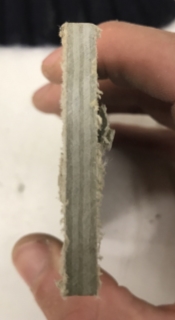
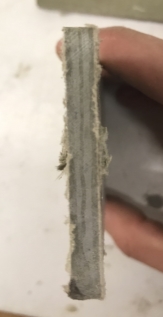
Figure 6.7: On the left resin allignment after testing following 0 thermal cycles. On the right resin allignment after testing following 500 thermal cycles for storage at 0°C
A similar trend to the one experienced by the samples stored at 0°C is viewed in the samples stored at -20°C as shown in Figure 6.8.
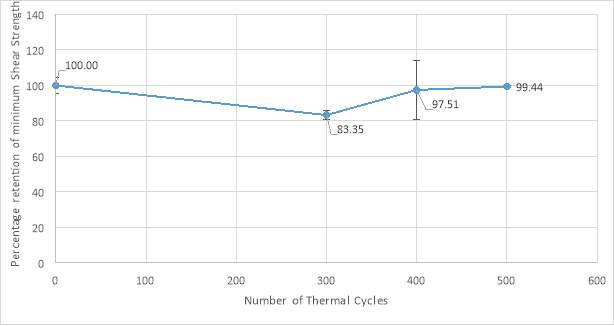
Figure 6.8:Effects of thermal cycling on Minimum Shear Strength of GFRP Plates stored at -20°C
An initial decrease of 16.7% occurs after 300 cycles of temperature. Followed by an increase in the material properties of about 10% after 400 cycles and a further increase to 99.4% of the initial shear strength after 500 cycles. The error in percentage retention for samples undergoing 400 cycles is significant, ranging at +/-17% of the actual value. This identifies one of the great issues with testing of GFRP material, the inconsistency of its matrix structure. Furthermore, the deviation suggests that after 400 cycles of temperature, only some of the GFRP plates were able to restructure their matrix, achieving a higher strength.
In general, a decreasing trend in the shear properties of the material is present, however, once again this is composed of an initial decrease followed by an increase in the properties after 400 and 500 cycles. As discussed earlier the aging of the samples modifies the matrix structure of the polymer changing it to withstand the continuous freeze thawing of the elements in the composite. Following this consideration, however, it is important to remember that this does not mean the sample won’t undergo loss in its properties over time. As shown in in Figure 6.8 the rate of gain in shear strength after 500 cycles is far lower than that after 400 cycles. This suggests that the polymer will soon undergo degradation once more, as was the case for the samples tested at +20°C. This also suggests that the more significant degradation of mechanical properties takes place at the start of the design life of the material.
Once again bearing is the only type of failure undergone by the samples (Figure 6.9), with the amount of bearing increasing slightly between the 0 cycled and 300 cycled plates.
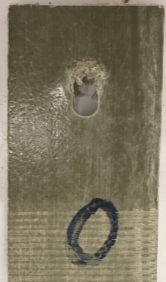
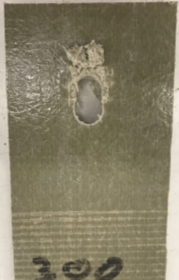
Figure 6.9: On the left bearing failure after 0 thermal cycles. On the right bearing failure after 300 thermal cycles for storage at -20°C
By observing the 500 cycled samples through their thickness, instead, we can observe how the matrix has been reorganized in order to support the continuous expansion and contraction of the polymer (Figure 6.10).
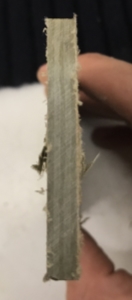
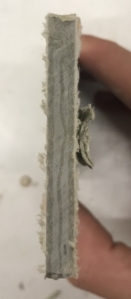
Figure 6.10: On the left resin allignment after testing following 0 thermal cycles. On the right resin allignment after testing following 500 thermal cycles for storage at -20°C
Once again this is proof of the materials ability to reorganize its matrix structure depending on the environmental conditions.
6.4 Effects on the Young’s Modulus
To view the effects of different storage temperatures and thermal cycling on the Young’s Modulus, the scatter graphs of load versus strain for each sample are considered. For each trial the critical load and critical strain are recorded and the shear strength is calculated as shown in “6.2 Effects of Thermal Cycling”. Shear strength and critical strain are used to calculate the Young’s Modulus, E, of each plate. The modulus of elasticity for each trial is then plotted versus the number of thermal cycles for each separate storage temperature. The behaviour of the GFRP plates tested at +20°C will be analysed first. Figure 6.11 depicts the Young’s Modulus versus number of cycles relationship for samples tested at the above-mentioned temperature.
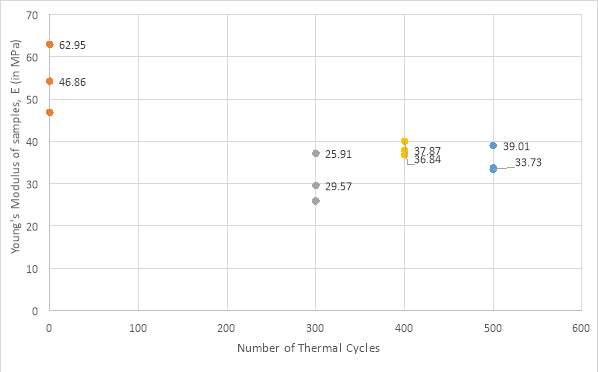
Figure 6.11: Effects on the Young’s Modulus of cycled samples stored at +20°C prior to testing.
As shown above the increasing number of cycles causes the Young’s Modulus of the samples to undergo various changes. An initial drop is noticeable between 0 and 300 cycles from an average of 55 MPa to about 30 MPa. This is followed by an irrelevant increase in the materials stiffness after 400 cycles and another minimal drop at 500 cycles. The error in the results is significant at 0 and 300 cycles, after which results become more consistent. However, a general decreasing trend is noticeable in the material, suggesting that cycling has caused the samples to crack and therefore decrease in strength and in stiffness. Even if limited, the increase in Young’s modulus after 400 cycles of temperature is most interesting. It suggests an increase in the strength of the material along with an increase in stiffness. This could be explained by referring to the deformations that took place inside the polymer matrix during thermal cycling. It is possible, in fact, that these deformations started a process somewhat similar to the annealing process taking place in metals. However, annealing involves heating at very high temperatures the material (to reach its recrystallization temperature) and then cooling it slowly allowing it to remove internal stresses. This is not possible in the case at hand, as the temperatures are relatively low. Instead, the deformations related to the continuous alternating of cold and warm temperatures might have allowed the stresses to be redistributed more uniformly throughout the samples, reducing the difference between minimum and maximum stresses. This would have two effects; on one hand, stresses would increase in the less critical areas. On the other hand, areas of great stress would relax, making the polymer overall more resistant, without areas more prone to failure. Following cycling, the material is stored at room temperature. This should not have further effects on the material properties, as it is not hot enough to increase its ductility or cold enough to make the bonds more brittle. This could, as well, be one of the reasons for which the change in Young’s Modulus is so minimal. Another plausible interpretation of the results would be that the increase in Young’s Modulus after 400 cycles is dependent on the inconsistency of the matrix structure of the polymer. In fact, due to the randomness of the production process, all samples will have a different resin to fibre bonding structure. This results in a minimal but noticeable variance in the Young’s Modulus of the samples. One that could definitely account for the difference in critical load due to the different storage temperatures. Far more interesting are the effects on the Young’s Modulus after storage at -20°C and 0°C
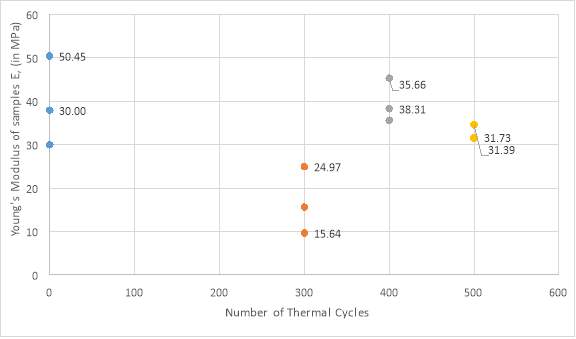
Figure 6.12: Effects on the Young’s Modulus of cycled samples stored at 0°C prior to testing
In Figure 6.12, the effects of storage at 0°C prior to testing is considered. As in Figure 6.11 an initial drop in the Young’s Modulus of the material is noticeable after 300 thermal cycles from an average of 40 MPa to an average of 15 MPa. This suggests a weakening of the samples due to cracking induced by the freeze-thawing of the polymer. However, this is followed by a marked increase in the Young’s Modulus of the samples after 400 cycles, which reach the same region as the 0 cycled samples. This is then followed by a relatively small decrease in the property after 500 cycles. In this situation, the detrimental effects of thermal cycling are noticeable in the first stage of aging (up to 300 cycles). The recovery following 400 cycles of temperature suggests that the deformations induced, due to the extensive aging process, allowed stresses to spread throughout the material. This led to the merging of high and low stresses throughout the polymer, resulting in a more uniform distribution and a marked increase in the materials Young’s Modulus. The increase in the modulus, in this case, is far more relevant than that viewed in the first set of data. This can be linked to the storage temperature at 0°C previous to testing. In this case, the polymer samples harden as the bonds between fibre and resin freeze and become more brittle. This increase in strength, along with the decrease in strain, due the material becoming more brittle, results in a higher value of Young’s Modulus. As anticipated, the marked change in Modulus is followed by a decrease after 500 cycles. This suggests that after 500 cycles of temperature, the forces and stresses acting onto the polymer are high enough to cause permanent damage. Therefore, even though the modulus is still higher than the one measured after 300 cycles, the aging process has caused extensive damage, not recoverable by the stresses becoming more uniform or the hardening of the material. Very similar results are obtained when storing the samples at -20°C as shown in Figure 6.13.
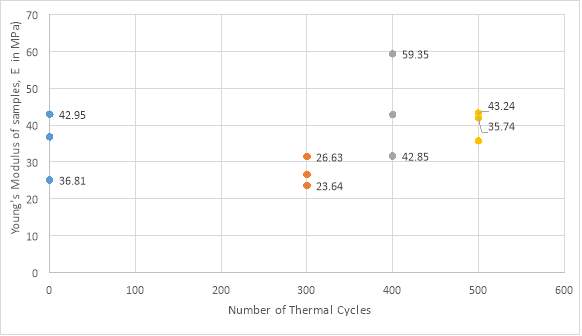
Figure 6.13: Effects on the Young’s Modulus of cycled samples stored at -20°C prior to testing
An initial decrease in the Young’s Modulus of the samples is viewable after 300 cycles of temperature. Differently from the previous results, the reduction is relatively small, moving from an average of 35 MPa to an average of 28 MPa. This is followed by a marked increase in the property of the samples which average higher than the initial modulus value at 42 MPa. This is followed by a minimal decrease in Young’s Modulus after 500 cycles. The effects of the coldest storage temperature are easily noticeable in the results, which can again be explained by referring to the merging of stresses in the material. As anticipated the change in Young’s Modulus after 300 cycles of temperature is far smaller than that recorded when the material was stored at +20°C and 0°C. This suggests that following thermal cycling the material started to deform allowing for stresses to be more evenly distributed throughout the material. Then when stored at -20°C, the material underwent freezing, resulting in a more brittle but at the same time harder material. This brought to an increase in strength and a decrease in strain, explaining the significant change in Young’s Modulus of the polymer. After 500 thermal cycles, a minimal decrease is noticeable, suggesting that even though stresses have been distributed, extensive cracking due to freeze-thawing has caused irreversible deterioration in the structure. In order to view the extent to which further deterioration would affect the mechanical properties of the polymer structure, more testing would be required with a higher number of thermal cycles.
A recognizable trend in the data is presented, relating storage temperature and accelerated aging with the Young’s Modulus of the samples. Thermal cycling causes the material to redistribute stresses throughout its structure, making them more uniform and allowing for an overall stronger material. At warmer temperatures, the GFRPs are let to relax and become more ductile, whilst at colder temperatures, the material undergoes freezing resulting in more brittle and stronger properties.
7.0 Discussion
The results analysed in section 6.0 of this paper, highlight the effects of thermal cycling on the mechanical properties of GFRP single bolted connections. The effects of different storage temperatures, prior to testing, along with their relationship with the elastic properties of the samples were also considered. At +20°C testing, the material performed mostly as expected with an initial reduction in its shear and pin bearing strength of about 16% followed by a temporary increase in its properties of just over 7%. A further decrease in the properties is noticed after 500 cycles which reduced the retained properties of the material to 86%. This suggests that following 300 cycles the material is feeling stresses due to the expansion and contraction of the matrix, when moving from warm to sub-zero temperatures. Cracks start forming and bonds are weakened causing the reduction in strength of the sample plates. Following 400 cycles, however, it is plausible to assume that the forces acting on the material cause deformations throughout the matrix structure. These deformations could bring to a reorganization of stresses in the material. Instead of having separate areas of maximum and minimum stresses in the polymer, due to its inconsistent matrix structure, they are made more uniform removing critical areas more prone to failure. This causes the material to become stronger, until the forces and deformations acting on the polymer, due to thermal aging, are far too high. This leads to high stresses throughout the whole matrix and a uniform reduction in its strength. The effects of warm storage temperatures are considered prior to testing; however, these are quite irrelevant as far hotter conditions would be required to induce a change.
Similar research is presented in Grammatikos et al. [2016], in which the authors observed the change in shear strength of GFRP samples undergoing 100, 200 and 300 cycles, followed by testing at room temperature. This resulted in a minimal loss in property of just under 3% after 300 cycles. The change can be regarded as imperceptible if the error (+/-4.5%) is considered. However, testing was performed on a sample strip of material, instead of a bolted connection. This means that the shearing resistance would be far higher considering the larger shearing region. Moreover, the testing procedure was different from the one considered in this paper. In Grammatikos et al. [2016] iosipescu testing is considered to measure the shear strength of the material. The procedure involves loading a strip of material with compression on four points asymmetrically, in order to obtain shear failure at the centre of the sample. The failure mode differentiates significantly from the one considered in this dissertation and the results appear irrelevant when considering real life applications. It is still possible to recognize a decrease in the materials properties suggesting that in both cases thermal cycling brings to degradation of the material matrix. Far more significant, were the results obtained when testing the saturated samples. These lost just over 30% of their initial shear strength suggesting that the degradation felt by the single bolted GFRP plates in this dissertation could be far more critical if wetted for long periods of time. Whilst saturation in an open environment could happen, it is quite unrealistic for it to reach the extent considered in Grammatikos et al. [2016], in which samples are immersed continuously for 224 days.
Aging under wet conditions can be also identified in Grammatikos et al. [2015], in which GFRP samples are immersed in water at 25°C, 40°C, 60°C and 80°C. Shear strength is then tested after 56, 112, 168 and 224 days. An initial decrease of the property is present in the polymer samples ranging between 15% for water at 25°C and 50% for water at 80°C. Following 224 days of immersion, unexpectedly all samples gained back a significant amount of the lost shear strength. The study focused on the opposite extremes of environmental conditions to this thesis. However, similarities are present in the two studies, considering that in both the strength of the material decreases quite significantly before recovering. In Grammatikos et al. [2015], the authors state that this is due to the washing out of the weaker parts of the polymer and the creation of new, stronger bonds. In this thesis, instead, a similar process to the annealing one happening in crystalline or semi-crystalline materials could be taking place. However, instead of removing stresses by warming up at very high temperatures the material and then slowly cooling it. The continuous movement between sub-zero and room temperatures contracts and expands the polymer. This repetitive process would allow for some of the weaker regions to transfer stresses to stronger/less strained areas. In this way stresses throughout the whole polymer are rendered more uniform and the overall strength of the polymer is increased. The aging process used in Grammatikos et al. [2015] is identified as hot and wet aging, representing environmental conditions of tropical regions such as the Amazon Rainforest. This thesis, instead, focuses on cold and dry testing, representative of high mountaineering climate such as that present in the Andes Mountains. Therefore, it is possible to assume that in more standard environmental conditions the polymer would perform somewhere in between these two reports.
Aside from storage at warm temperatures, this thesis also considered storage at 0°C and -20°C. The change in the Young’s Modulus, under these conditions, is essential in understanding the materials behaviour in colder and harsher climates. At 0°C, the modulus decreases by a significant amount, from 40 MPa to 15 MPa. However, this is mostly recovered after 400 cycles of temperature, when the modulus increases back into the area of the 0 cycled specimens. This suggests that the stresses have been redistributed more uniformly. The recovery is also rendered more significant by storage at 0°C, which causes the polymer bonds to harden and become more brittle. However, the modulus decreases once again after 500 cycles of temperature. This supports the assumption that after a certain number of cycles, extensive damage occurs to the material structure. Ultimately, causing the material to lower its Young’s Modulus, without possibility of recovery. In a similar way, storage at -20°C also causes the material to increase its elastic modulus. This time, reaching higher values than the ones of the 0 cycled specimens. Once again, however, the modulus decreases between 400 and 500 cycles. This would suggest a probable decrease in the Young’s Modulus if more extensive aging is considered. Depending on the rate of deterioration this could become a significant aspect to consider.
Similarly, in P.K. Dutta et al. [1996], the authors recorded the change in Youngs Modulus of GFRP samples due to different storage temperatures (27°C, -5°C, -40°C and -60°C). A general increase in the Young’s Modulus of the material was present with a difference of 6% between the 27°C samples and the -60°C samples. This difference is noticed prior to thermal cycling, suggesting that the freezing temperatures were enough to strengthen the material, making it harder and brittle. In P.K. Dutta et al. [1994], the authors tested the elastic modulus of polymers at 24°C and -48°C. Once again, the low temperatures cause the material to become stiffer and more brittle increasing the Young’s Modulus.
From the above considerations, it is possible to determine that thermal cycling induces deformations in the polymer matrix, resulting in a reorganization of the stresses. Maximum and minimum stress values are standardized around a running average and the material is able to become more uniform. This results in an overall stronger material, especially due to the absence of regions of very high stress more prone to failure. Storage at colder temperature prior to testing allows for higher critical loads as the material hardens, following freezing of its matrix structure. This suggests that the polymer and its fibre-resin bonds become stronger but more brittle. However, after extensive aging, the stresses and relative cracking in the material matrix are far too widespread. This means that even though stresses are uniformly distributed, throughout the matrix structure, they are still far too high causing severe degradation of the polymer.
8.0 Conclusion
Several samples of a 5-layer commercially available pultruded GFRP material were tested in this thesis to investigate the effects of thermal cycling on the mechanical properties of the polymer. The research focused on the shear/pin bearing strength and Young’s Modulus of a GFRP single bolted connection. This allowed for the study of one of the most critical areas of construction. An area in which GFRPs could have a great impact in the future. It was found that the material undergoes an initial loss in strength properties followed by a strong recovery. This is thought to be linked to a process similar to that of annealing of the material. The deformations induced due to thermal cycling of the material, especially when reaching the negative regions of the Celsius scale, enable stresses to be distributed more evenly throughout the matrix structure. This allows for the reduction of stresses in critical areas more prone to failure, making the material stronger overall.
The results obtained do not correlate fully with those obtained from the past literature, especially when considering the extent to which the materials strength deteriorates and then recovers. It has been concluded that the testing parameters considered in this dissertation are different from the one considered in the past literature. Firstly, Iosipescu testing is generally used when investigating shear strength, whilst this thesis focuses on pinned connections. This is because it is believed that Iosipescu testing does not simulate the forces the sample would feel throughout its design life and is more generally a measure of the materials total shear strength. This thesis, instead, analysed the materials behaviour as if it was in service representing a more realistic design situation.
It is also concluded that the thermal cycling technique considered in this investigation does not portray real life conditions as the samples only undergo dry aging, whilst feeling mostly very cold temperatures. However, similarly, hygrothermal aging is also not recognized as an exact representation of in service environmental conditions as it only considers warm temperatures, whilst samples undergo saturation to an unrealistic degree.
The standard deviation of the results was significant, this was probably due to the randomness of the matrix structure of the polymer. This meant that specimens, under the same conditions, portrayed slightly higher or lower strengths. However, it was still possible to notice a decreasing trend after 300 cycles of temperature followed by an increase after 400 cycles of temperature.
The testing temperature also tried to be considered as a variable affecting the strength of the material. However due to limitations in the experimental method it was not possible to maintain the required temperature for testing. Therefore, the storage temperature prior to testing was considered. It was concluded that storage at lower temperatures caused the material to become harder and stiffer, allowing for more strength and brittleness.
The Young’s Modulus was also calculated for each situation. A general decrease was noticed between 0 and 300 cycles, followed by a marked increase in the property after 400 cycles. This was followed by a relatively small decrease in the Young’s Modulus after 500 cycles. This suggested that after significant aging, the extensive cracking of the material overcomes the recovery effect produced by the redistribution of stresses.
The elastic modulus was also compared in terms of the three storage temperatures. It was concluded that at lower temperatures the material underwent more significant recoveries. This suggested that hardening of the material took place due to the freezing of its resin to fibre bonds. Further testing, over a wider range of thermal cycles, is recommended. This would allow to analyse whether, after 500 cycles, deterioration proceeds steadily, without recovery, or whether ulterior processes, at a molecular level, allow for further increases in the mechanical properties of the polymer.
The material promises great possibilities for civil engineering applications, portraying very high strength with minimal weight. However, this thesis proves that it still remains a very unpredictable material, capable of changing its structure depending on the environmental and structural conditions in which it is placed. Therefore, it is still not possible to confirm whether GFRPs will be used in the near future. Instead, more research using more realistic conditions is required in order to verify whether the material has an actual future in the civil engineering world.
Further testing of the samples, such as diamond indentation, is advised in order to view whether the internal structure of the polymer has actually strengthened evenly throughout, spreading the stresses. Moreover, a more accurate production process for the GFRP samples is recommended in order to reduce the error in the results.
9. References
9.1 Articles
Aniskevich, K., Korkhov, V., Faitelsone, J., Jansons, J., 2012., Mechanical properties of pultruded glass fibre reinforced plastic after freeze–thaw cycling., Journal of Reinforced Plastics and Composites., 31(22)., pp. 1554-1563.
Bank, L.C., Russell Gentry, T., Thompson, B.P., Russell, J.S., 2003., A Model Specification for FRP Composites for Civil Engineering Structures., Construction and Building Materials, 17(1), pp. 405-437.
Chin, J. W., Nguyen, T., Aouadi, K., 1997., Effects of environmental exposure on fibre-reinforced plastic (FRP) materials used in construction., Journal of Composites technology and research., 19(4), pp. 205–213.
Dutta, P. K., Hui, D., 1996., Low-temperature and freeze-thaw durability of thick composites., Composites., Part B 27B (1996), pp. 371-379.
Dutta, P.K., 1994., Low-Temperature Compressive Strength of Glass-Fiber-Reinforced Polymer Composites., Journal of offshore mechanics and arctic engineering., 116(1), pp. 167-172.
Grammatikos, S. A., Jones, R. G., Evernden, M., Correia, J. R., 2016., Effects of thermal cycles on the mechanical response of pultruded GFRP profiles used in civil engineering applications., Composite Structures., 153(2016), pp. 297-310
Grammatikos, A.S., Evernden, M., Ball, R. J., 2015, Combined effects of the characterization of the effects of hot/wet aging on a pultruded GFRP plate., 20th International Conference on Composite Materials., 19th-24th July 2015 Copenhagen, BRE centre for Innovatice Construction Materials: University of Bath, pp. 2-8.
Keller, T., Bai, Y., Vallèe, T., 2007., Long-term performance of a glass fibre reinforced polymer truss bridge., Journal of Composites for Construction., 11(1), pp. 99-108.
Liao, K., Schultheisz, C. R., Hunston, D. L., 1999., Effects of environmental aging on the properties of pultruded GFRP., Composites, Part B 30(5), pp. 485–493.
Robert, M., Benmokrane, B., 2010., Behaviour of GFRP Reinforcing Bars Subjected to Extreme Temperatures., Journal of Composite for Construction., 14(4), pp. 353-360.
Sousa, J. M., Correia, J. R., Cabral-Fonseca, S., Diogo, A. C., 2014, Effects of thermal cycles on the mechanical response of pultruded GFRP profiles used in civil engineering applications., Composite Structures., 116(2014)., pp. 720-731.
Turvey, G. J., 2000., Bolted connections in PFRP structures., Prog. Struct. Eng. Mater., 2(2), pp. 146–156.
Zafari, B., Mottram, J. T., 2012., Effect of Hot-Wet Aging on the Pin-Bearing Strength of a Pultruded Material with Polyester Matrix., Journal of Composites for Construction., 16(3), pp. 340-352.
9.2 Images
Figure 3.1:Light Straw, 2006, A unique 1970s building with outdated technology? London: Light Straw, Available from: http://www.lightstraw.co.uk/ate/main/mondial/landmark/design/ [accessed 26th March 2017].
Figure 3.2: FRP distributors, 2010, GFRP Chloride Resistance, Alberta: FRP distributors, Available from: http://www.frpdistributors.com/ [accessed 26th March 2017]
Figure 3.3: Keller et al., 2007, pp. 99-108.
Figure 3.4: Bank et al., 2003, pp. 405-437
Figure 3.5: Zafari and Mottram et al., 2012, pp. 340-352.
Figure 3.6: Liao et al., 1999, pp. 485-493.
Figure 3.7: Chin et al., 1997, pp. 205-213.
Figure 3.8: Sousa et al., 2014, pp. 720-731.
Figure 3.9: Robert et al., 2010, pp. 353-360.
Figure 3.10: Grammatikos et al., 2016, pp. 297-310.
Figure 4.1: Grammatikos et al., 2016, pp. 297-310.
10.0 Appendix
Table 10.1: Change in Shear Strength properties due to thermal cycling and testing at -20°C
| Number of Cycles | Sample Mean Shear Strength (Mpa) | Standard Deviation (Mpa) | Percentage Standard Deviation (%) | Percentage Shear Strength Retention (%) |
| 0 | 43,55 | 2,02 | 4,63 | 100,00 |
| 300 | 36,30 | 0,95 | 2,61 | 83,35 |
| 400 | 42,47 | 7,11 | 16,75 | 97,51 |
| 500 | 43,31 | 0,20 | 0,46 | 99,44 |
Table 10.2: Change in Pin Bearing Strength properties due to thermal cycling and testing at -20°C
| Number of Cycles | Sample Mean Pin Bearing Strength (Mpa) | Standard Deviation (Mpa) | Percentage Standard Deviation (%) | Percentage Pin Bearing Strength Retention (%) |
| 0 | 261,32 | 14,82 | 5,67 | 100,00 |
| 300 | 217,80 | 6,97 | 3,20 | 83,35 |
| 400 | 254,61 | 52,62 | 20,67 | 97,43 |
| 500 | 259,85 | 1,45 | 0,56 | 99,44 |
Table 10.3: Change in Shear Strength properties due to thermal cycling and testing at 0°C
| Number of Cycles | Sample Mean Shear Strength (Mpa) | Standard Deviation (Mpa) | Percentage Standard Deviation (%) | Percentage Shear Strength Retention (%) |
| 0 | 40,39 | 2,38 | 5,90 | 100,00 |
| 300 | 30,97 | 2,62 | 8,47 | 76,68 |
| 400 | 38,94 | 2,44 | 6,26 | 96,41 |
| 500 | 40,20 | 3,50 | 8,72 | 99,53 |
Table 10.4: Change in Pin Bearing Strength properties due to thermal cycling and testing at 0°C
| Number of Cycles | Sample Mean Pin Bearing Strength (Mpa) | Standard Deviation (Mpa) | Percentage Standard Deviation (%) | Percentage Pin Bearing Strength Retention (%) |
| 0 | 242,32 | 17,50 | 7,22 | 100,00 |
| 300 | 185,80 | 19,29 | 10,38 | 76,68 |
| 400 | 233,51 | 17,74 | 7,60 | 96,36 |
| 500 | 240,10 | 26,76 | 11,14 | 99,08 |
Table 10.5: Change in Shear Strength properties due to thermal cycling and testing at +20°C
| Number of Cycles | Sample Mean Shear Strength (Mpa) | Standard Deviation (Mpa) | Percentage Standard Deviation (%) | Percentage Shear Strength Retention (%) |
| 0 | 45,85 | 2,91 | 6,35 | 100,00 |
| 300 | 38,51 | 3,44 | 8,93 | 83,99 |
| 400 | 41,92 | 2,41 | 5,74 | 91,44 |
| 500 | 39,63 | 3,63 | 9,16 | 86,45 |
Table 10.6: Change in Pin Bearing Strength properties due to thermal cycling and testing at +20°C
| Number of Cycles | Sample Mean Pin Bearing Strength (Mpa) | Standard Deviation (Mpa) | Percentage Standard Deviation (%) | Percentage Pin Bearing Strength Retention (%) |
| 0 | 275,07 | 21,40 | 7,78 | 100,00 |
| 300 | 231,04 | 25,27 | 10,94 | 83,99 |
| 400 | 251,52 | 17,69 | 7,03 | 91,44 |
| 500 | 237,80 | 26,69 | 11,22 | 86,45 |
All experimental data regarding load versus strain for each of the tested samples can be retrieved from Dr. Mark Evernden as a Microsoft Office Excel file named Load_Versus_Strain_Thermal_Cycled_GFRP.xlsx.
Cite This Work
To export a reference to this article please select a referencing stye below:
Related Services
View all


Related Content
All TagsContent relating to: "Engineering"
Engineering is the application of scientific principles and mathematics to designing and building of structures, such as bridges or buildings, roads, machines etc. and includes a range of specialised fields.
Related Articles

DMCA / Removal Request
If you are the original writer of this dissertation and no longer wish to have your work published on the UKDiss.com website then please: