Structural Strength Assessment of Civil Infrastructure
Info: 8270 words (33 pages) Dissertation
Published: 10th Dec 2019
Tagged: Engineering
1.Abstract
Structural strength assessment of civil infrastructure is a prior concern to the engineers. This paper presents laboratories study as well as on site study data analysis gathered by many authors, critical review of existing nondestructive testing (NDT) methods.
2.Introduction
Nondestructive evaluation of concrete strength is required in various contexts, such as evaluate whether there is damage developed over time or to know new requirement in structure due to change in regulations or load conditions. NDT techniques offer an indirect approach towards material mechanical properties and helps decision makes regarding maintenance [1, 2]. The highest requirement for assessment of concrete is the quantify mechanical properties like strength and the lowest ones is detect or ranking the damages [3].
Researchers have been devoted to synthesizing the NDT abilities with regarding to given problems [4-7], data processing or development of NDT for better assessment of infrastructure or define the most promising paths for development.
To know the suitability of the proposed NDT techniques, it is advisable to take a feasibility study on the structure for the investigation of structural problems. This procedure is called ‘Desk study’ [8].
There are five major factors that influence the success of an NDT survey [9]:
- Penetration depth into the structure.
- Lateral and vertical resolution for anticipated target problems.
- Comparison of target and its surroundings for physical properties of the structure.
- Signal to noise ratio of the investigated structure for the physical properties measurement
- Historical information of the structure about the construction methods of the structure.
The four major NDE for bride evaluation are ultrasonics, impact echo, impulse radar, and conductivity.
Literature review
3.Non-Destructive methods and application
3.1. Ultrasonic methods
Ultrasonic methods refer to propagation and reflection of ultrasonic wave through a medium. There are five most popular ultrasonic methods: sonic tomography, sonic transmission method, sonic reflection method, sonic resonance method and ultrasonic method.
3.1.1. Sonic transmission method
In this method, a force hammer on one side of the investigated structure with a compressional frequency between 500Hz to 10 kHz and on the opposite side an accelerometer is used to receive the frequency. The resulting wave velocity comes from the average of local velocity along the path as shown in fig. 1(a). This method is called direct transmission modes and it is useful for simple evaluation of the concrete walls of a masonry arch bridge [9].
The indirect transmission method used to detect voids existence, estimate material uniformity, evaluate the depth of crack, calculate compressive strength, and helps in tomographic surveys. Sonic waves become attenuate and take longer time in transit of signal when it propagates through crack, void or delamination at the interface between aggregate and mortar. Fig. 1(b) and 1(c) shows the indirect transmission modes [9].
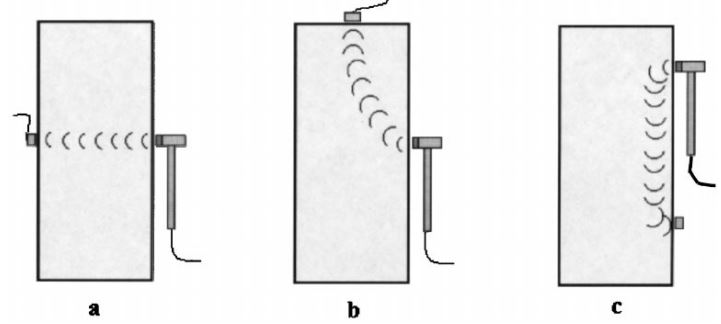
Figure 1: (a) direct sonic wave transmission mode; (b) semidirect transmission mode;
(c) indirect transmission mode [9]
3.1.2. Sonic tomography
Seismic tomography performed in direct mode as well as oblique path along the wall surface. There are ray paths between the sonic source and receiver which crossed the masonry wall in a densely format. Each ray paths represents a specific travel time between receiver and source. There was a Sonic tomographic survey on North Middleton Bridge as shown in fig. 2. The readings data were collected from downstream, upstream and under the arch of the abutment. A total of 142 straight rays were made from 15 stations at level 2m of the grid as shown in fig. 3. The output result as shown in fig. 4 demonstrated that the high velocity areas along the wall represent the stone masonry and medium to low velocity areas towards the center of the plot represents the backfill materials as shown in fig.4. High velocity areas along the upstream and especially downstream areas represents a continuous homogeneous dense material. After endoscopic investigation the densely materials revealed to be cement grouted zones [10].
Tomographic survey associated with ultrasonic give a better understanding of the bridge structure [11].
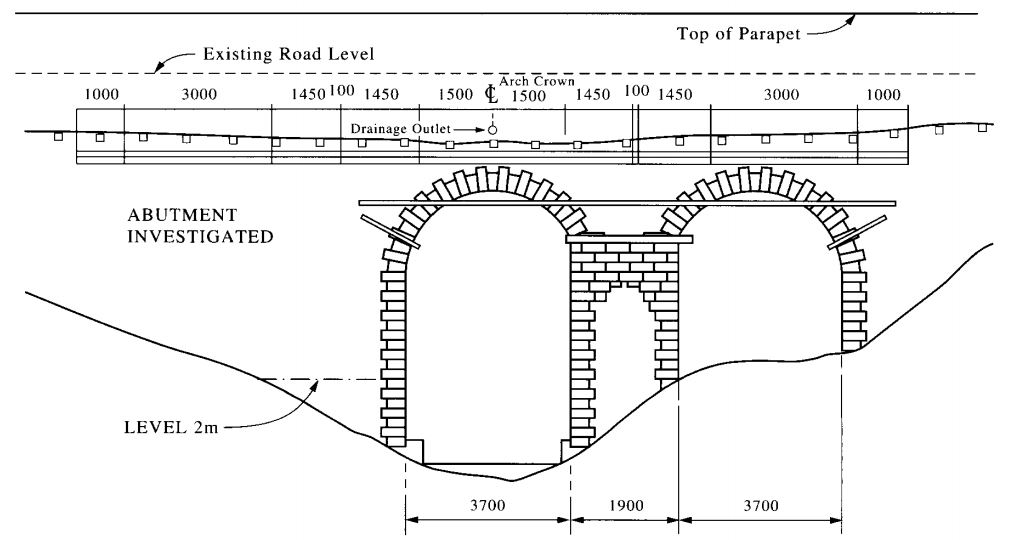
Figure 2: North Middleton bridge [10]
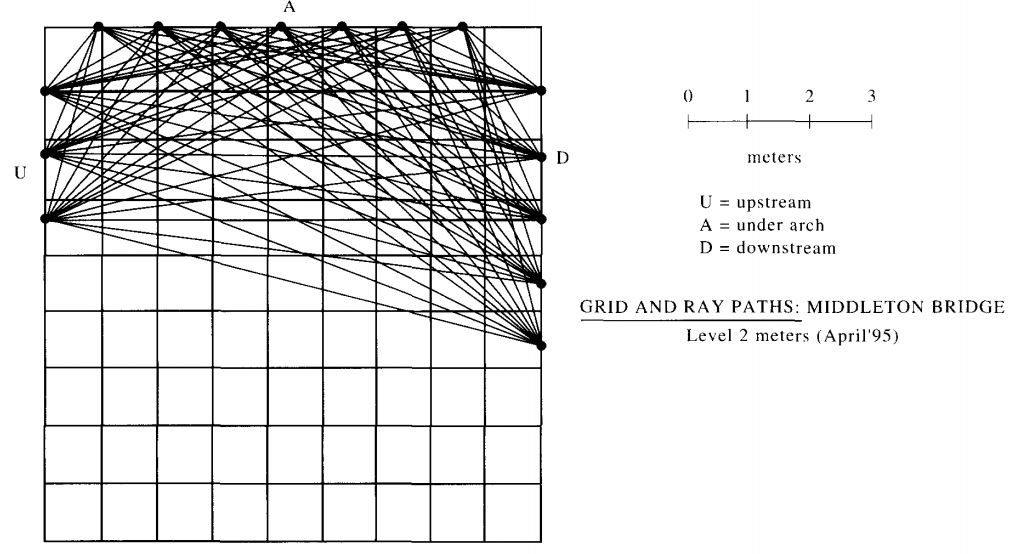
Figure 3: Densely ray paths between the sonic source and receiver [10]
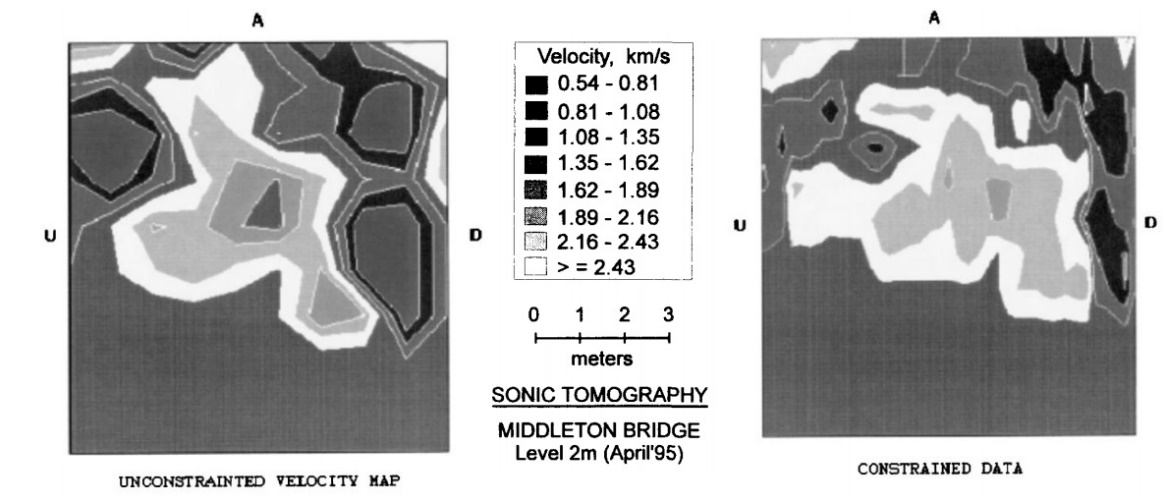
Figure 4: Reconstruction of sonic tomographic [10]
3.1.3. Sonic reflection method
In this method, both sonic wave source and receiver are on the same face of the masonry wall as in case of indirect transmission. The recorded stress wave comes from the reflection of wave from any internal flaws or the rear face of the investigated structures. The velocities come from the rear face or face of a structure indicates the local velocity along the path. The sonic reflection method is useful for the investigation of internal dimensions and shape, type and properties of fill, void within the fill, cracks [12] and void within the fabric of the structure, etc. of retaining walls, wing walls, spandrel walls, harbor deck wall, and road surface. The limitation of the method is that it is often difficult to distinguish reflections from surface wave and refracted arrivals [4, 9, 12].
3.1.4. The impact-echo system
The impact-echo system method measures concrete thickness and integrity from one surface. A small mounted hammer and an accelerometer mounted adjacent to the impact location used to hit the surface of an investigated structure and record the reflected energy respectively as shown in fig. 5. A voltage proportional to displacement is produced by piezoelectric transducer and transfer to a computer memory. Then fast Fourier Transform (FFT) analyze frequency domain signal and a frequency response function (FRF) is calculated from the impulse hammer system. The slab or wall thickness can be found from the depth of reflector. ASTM C 1383 described standard procedure for the impact-echo system.
The impact-echo consists of spherical impactors, analog to digital data acquisition systems, a hand-held transducer unit, a computer, and a software package as shown in fig. 6 (left).
Impact-echo method is successfully used to detect
- Basement wall and marine spun piles honeycombing.
- Prestressed beams and slabs tendon ducts voids.
- Retaining wall thickness.
- Metal and concrete bonds in railways ties.
- Flaws inside the plate-type structure such as garage slabs, plaza deck slabs and foundation walls.
Martin et al. found minimum resolution is half wavelength,  /2 from a investigation of a post-tensioned concrete bridge beams. To identify voided ducts in post-tensioned bridge beams, the resolution concept of
  /2 provides a good correlation between FE models and a laboratory experiment [11].
Davis et al. (1974) first used the FRF in concrete piles [13]. NIST (National Institute for Standards and Technology, USA) and Cornell University make the impact-echo system in modern [14-16].

Figure 5: Back and forth propagation of compression wave generated from a hammer (left) [17]; impact-echo test experimental set up (right) [18].

Figure 6: Impact-echo instruments (left) [19]; impact-echo testing on a slab [20].
3.1.5. Ultrasonic reflection method
Ultrasonic reflection methods are used for locating and identifying flaws in concrete and detecting small defects in concrete wall. A piezoelectric transducer produces above 20 kHz ultrasonic waves that propagates 50 to 100 mm masonry. The method is less effective in higher attenuation characteristics concrete with lot of materials boundary which scatters of both incident and reflected waves. The method is not commonly used for some difficulties such as lack of good coupling of the transducer to the surface, difficult to achieve adequate coupling with some of uneven surface. The coupling agents such as grease or petroleum or temporary adhere limits the scattering of the signal through the materials and makes complexity of return noise. As a result, it makes confusion to the observer between surface wave and compression wave [9].
3.1.6. Sonic resonance method
This method helps to detect defects or cavities behind the linings of tunnels or areas of rendered wall. A lightweight hammer is tapped on the line or rendered wall and the reflective echo from the defects or cavities produce a notable change in the frequency of the wave.
3.2. Ultrasonic pulse velocity method
Ultrasonic pulse velocity method (UPV) and rebound measurement method are most widely used method to concrete strength assessment [21, 22]. The method measures the longitudinal pulse wave (20 to 150 kHz commonly) travel time through the concrete. Between the initial onset and reception of pulse wave, an electronic device measures the required travel time. ASTM C 597 described the standard procedure and apparatus.
Three types of UPV methods: direct transmission (cross probing), semi direct transmission and indirect transmission (surface probing) as shown in fig.7. Fig.6 shows the ultrasonic pulse velocity meter and the schematic diagram of UPV.
Applications of UPV:
- Evaluation of concrete homogeneity and dynamic elastic modulus.
- Inspection of prestressed and precast beams, new and old structure, fire damaged areas, columns, slabs, concrete forms and other structures.
- Detection of voids, honey combs, cracks and other non-homogeneous condition of the concrete.
- PULSONIC model 58-E4900 combined with oscilloscope can do Spectrum analysis by FFT method, evaluation of concrete strength by SonReb method incorporated with concrete hammer.
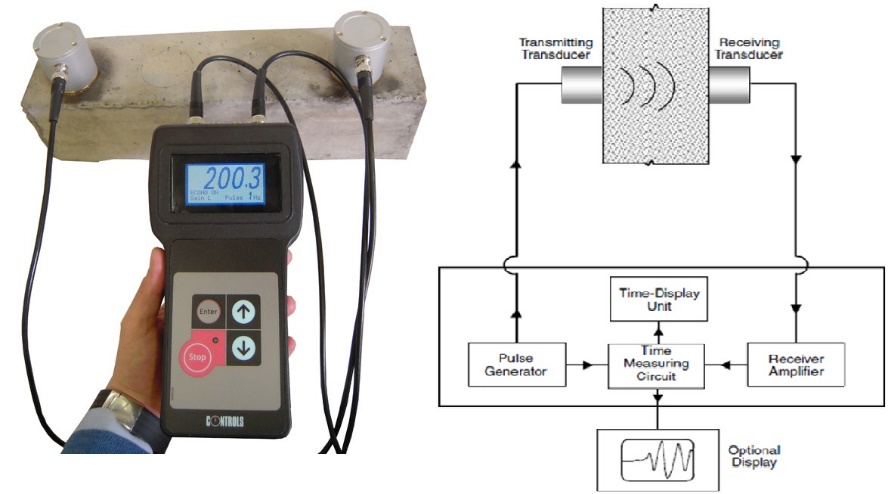
Figure 6: Ultrasonic pulse velocity tester (58-E4800 UPV tester) (left) [23]; pulse velocity test schematic diagram [24]

Figure 7: Different UPV methods and bridge girder testing by direct transmission method [25].
The velocity of ultrasonic waves in concrete shows a significant increase after casting of concrete in first days and this is the basic reason for using UPV in concrete strength assessment. But after 5 to 7 days of casing, sensitivity of UPV to the rate of concrete strength is considerably lower than the first few days [26]. There are other many factors which affects both UPV and concrete strength quantified by many authors [22, 27-34] as described in below.
1. Aggregate percentage and type have high influence and aggregate size has average influence on UPV. Depending on type and density of aggregate in undamaged rocks UPV can vary more than 6000 m/s to less than 4000 m/s and a common change in concrete is 400 m/s [35, 36].
2. Cement percentage and type have moderate influence on UPV. Water cement ration has high influence and fly ash content has average influence on UPV [37].
3. Humidity is another higher influencing factor. Between air and saturated condition of concrete the pulse velocity may increase up to 5% [38].
4. Rebars in concrete offer a higher velocity by proving an easier path for wave propagation. It is recommended that measure UPV where the rebar influence is neglected [37].
5. Between 0̊ c and 30 ̊ c temperature influence is neglected but for hot or cold weather the influence is noted [37].
6. All types of defects, voids and cracks have a higher influence on UPV because wave propagation is affected due to concrete cracks. There is average influence of age on UPV.
The method has following limitations:
- If the factors data as discussed above are not available, assessment of concrete compressive strength by UPV provides 95% confidence level which is 15 to 20% depends on concrete mix design data available.
- For better result of new and old structure, the methods need the incorporation of concrete hammer methods.
3.3. Surface hardness method
Concrete strength is judge by its compressive strength which affects load bearing capacity and durability of concrete structure. The Schmidt rebound hammer is the most widely used portable NDT instruments to measure surface hardness of concrete. Ernst O. Schmidt developed this test hammer at 1950. Schmidt OS-120 hammer is recommended for 1 to 10MPa compressive strength range concrete and for 10 to 100MPa compressive strength concrete Silver Schmidt hammer is recommended. Fig. 6 shows Schmidt OS-120 and Silver Schmidt hammer.
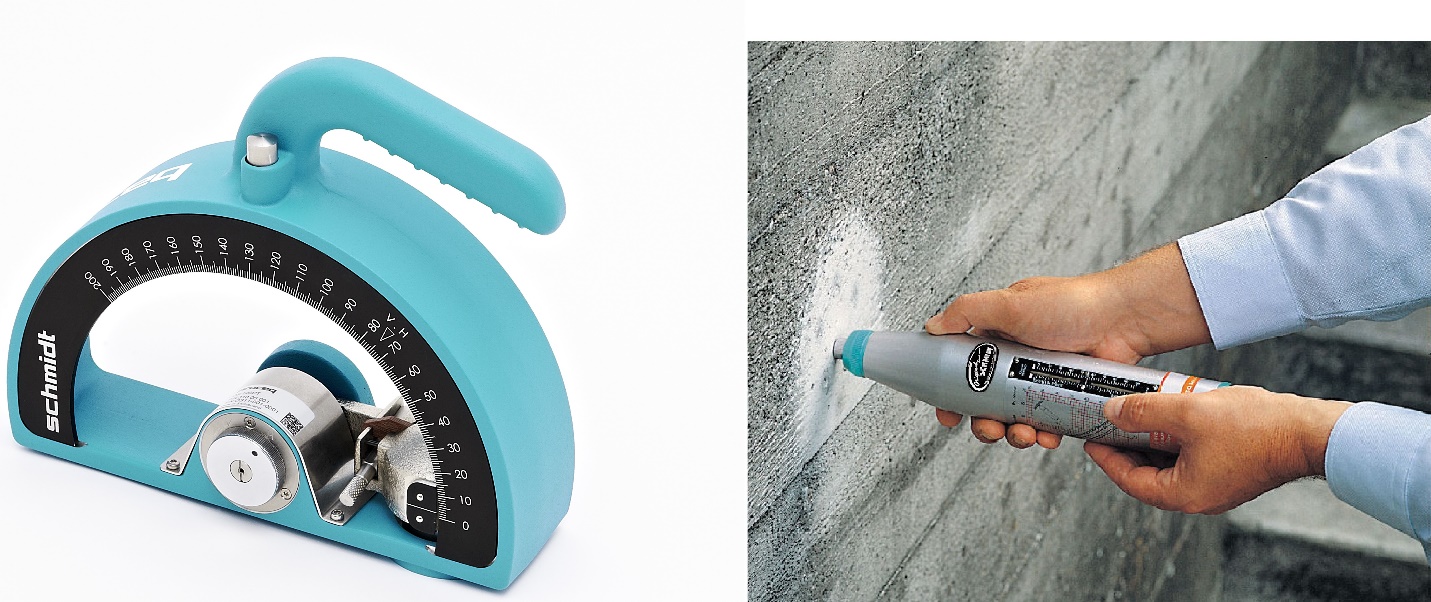
Figure 6: Schmidt OS-120 (left) [39]; Silver Schmidt hammer (right) [40]
First, the extended plunger is placed at the surface of the concrete (fig. 7 (a)). The internal spring is extended when the outer body of the hammer is pressed on the concrete surface (fig. 7(b)). When the spring is fully extended the latch is released and the hammer impacts on the surface of concrete wall (fig. 7(c)). On the plunger the hammer impacts upon and along a guide-scale the spring-controlled mass rebounds taking a ride which provides hammer rebound number (fig. 7(d)). In ASTM C 805 [41], standard procedure for rebound hammer number has been established. HAMMER LINK proceq software offer the rebound number computation platform.
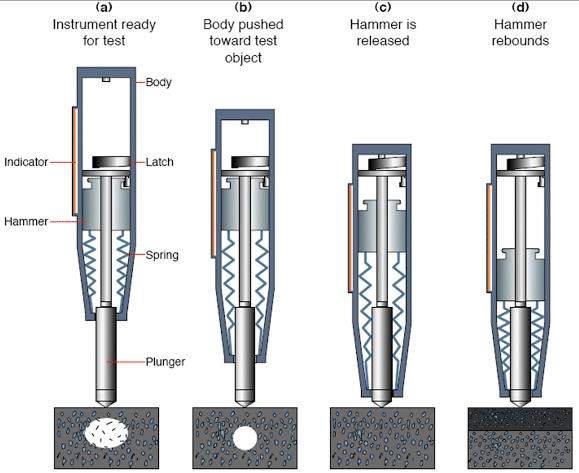
Figure 7: Operation of rebound hammer schematic diagram [42].
Inexpensive, quick and user-friendly hammer surface harness method depends on the following parameters [43]:
- The type and amount of aggregate are a critical issue between the rebound number and strength.
- The strength-rebound calibration is affected by wet surface. There is a lower bound number in wet surface compared with dry surface. Wet surface underestimate up to 20% of concrete strength [38].
- Surface carbonation is hard, and it increases the rebound number. Carbonation is evident in old structure. In carbonated surface, it is recommended that the carbonation layer be removed in a small area and the results obtained from the area be compared with the rest of the structure.
- Location of plunger over a stiff aggregate yield a high bound number while the location of plunger over a large void or a soft aggregate yield a lower bound number. According to ASTM C 805 guideline, 10 measurements should be taken for a test. If a reading is deviated more than 7 units from the average, the reading is disregarded, and the entire measurement is disregarded if there are two measurements more than 7 units deviates from the average.
In practical, it is difficult to make a good correlation between rebound number and strength based on all parameters. A properly calibrated laboratory specimen the accuracy of estimating concrete strength is ±15 to 20 percent and it is ±25 percent for a concrete structure [21].
3.4. Penetration resistant method
The Windsor HP Probe system used to drive a metal rod energized by a sudden charge of powder (explosive). From the depth of penetration, the device estimates the concrete strength. The concrete compressive strength is inversely proportional to the depth of penetration. The Windsor Probe capable of measuring maximum 110MPa concrete compressive strength.
The system consists of three probes of 0.25’’ diameter and length 3.125”, cartridge and other related equipment’s as show in fig 8. The powder when it is fired produce 575 lbs ft energy to drive probe into the concrete.
A 7-inch equilateral triangle locating template is used to position three probes at each corner. The penetration depth is calculated from the exposed length from the surface of the concrete using a calibrated depth gauge as shown in fig. 9. From charts of compressive strength verses penetration for aggregate hardness between 3 – 7 on Moh’s scale, compressive strength of concrete can be evaluated from a field penetration depth as shown in fig. 10. ASTM C 803 described the standard test procedure [44].

Figure 8: Windsor Probe instruments (left) [45]; equilateral triangle locating template used to positioning probes (middle) ; three probes at each corner (right) [46].
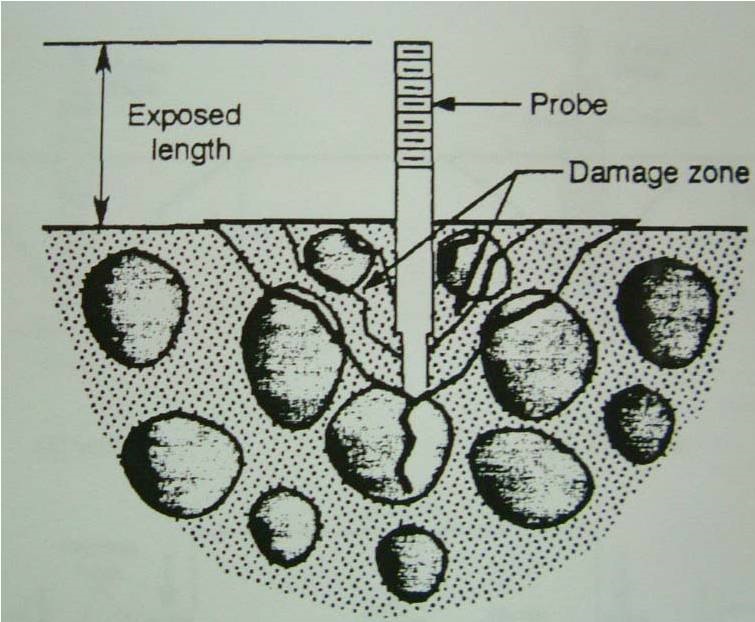
Figure 9: Probe penetration test conical failure [47]
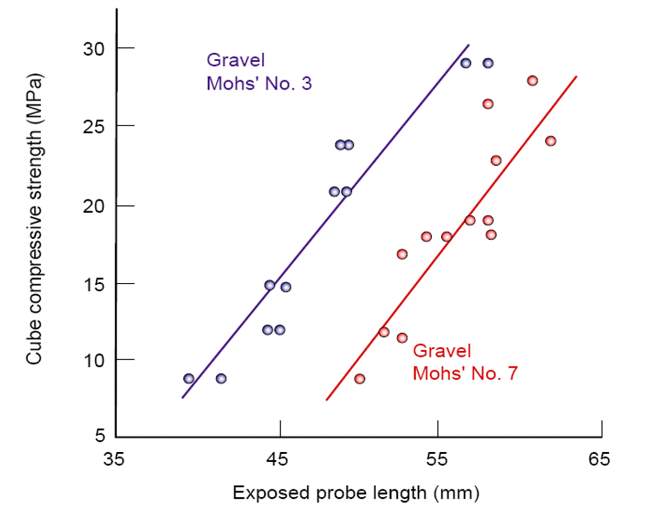
Figure 10: compressive strength verses penetration for aggregate hardness between 3 – 7 on Moh’s scale [47]
Though Windsor Probe test is costly compared to surface hammer test, it is superior to hammer test because it measures not only surface hardness but also concrete inside hardness. It is an excellent method for determining the stripping time for formworks. The type and amount of aggregate play a key role in determining penetration depth. Soft aggregate (lower Mohs’ scale) allows greater penetration than hard aggregate (higher Mohs’ scale). The variation in data in Windsor Probe test is higher than surface hardness method.
3.5. Pullout Test
A pullout test measures the force required to pull out a special steel bar embedded in the fresh concrete. The principal behind the test is that the concrete strength is proportional to the force required to pull out the steel bars. From pull out force vs compressive strength graph (fig. 13), the concrete compressive force is calculated. A complex three-dimensional stress state is developed inside the concrete during the test as shown in fig. 12. The failure criteria include: compressive strength of concrete, interlocking of aggregate around the circumferential of crack, and concrete fracture toughness. The pull-out strength depends on arrangement of the embedded insert, dimension of bearing ring, depth of embedment and type of aggregate in the concrete. ASTM C 900 described the standard test procedure [48].
The test provides practical results for the optimum time of safe form-stripping, determining concrete strength for carrying out post-tensioning, evaluation of curing period based on target strength. As larger volume and greater depth of concrete are involved in this test, this test is superior than hammer and penetration test [49]. But the limitation of this test is that it does not provide statistical procedure to measure other strength properties. The steel rod must be embedded during the pouring of concrete and hence the test cannot be undertaken at later ages. As it pulls out a concrete portion, repair is required after the test.
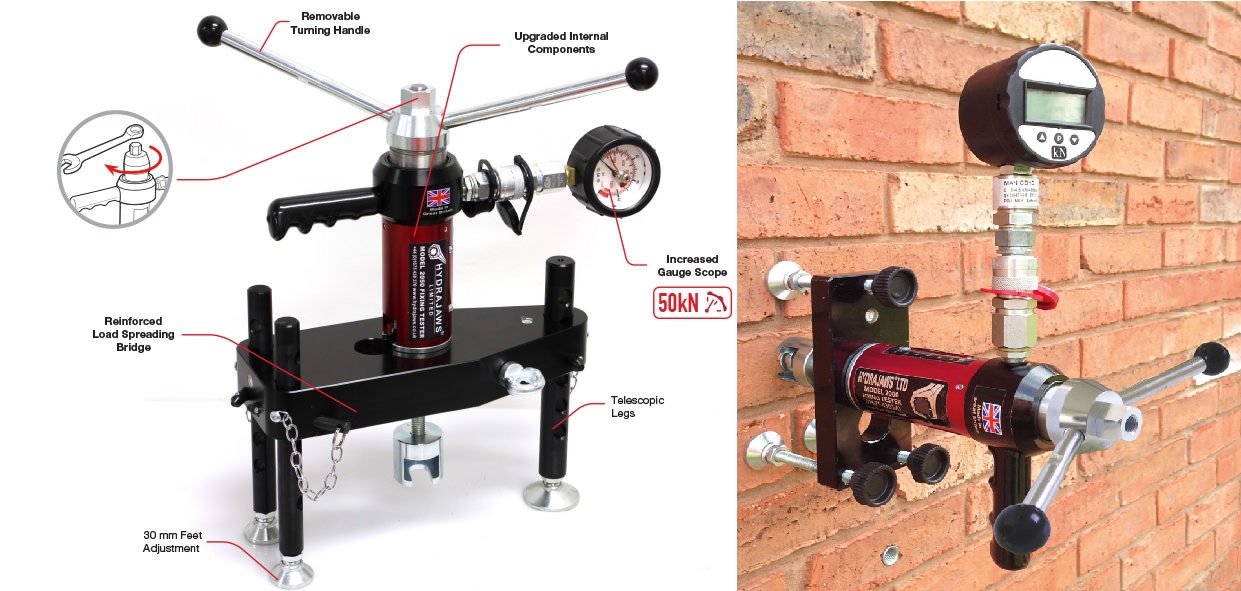
Figure 11: Hydrajaws 2050 Deluxe (left); Hydrajaw Model 2000 Deluxe pull tester with Bluetooth technology (Right) [50].
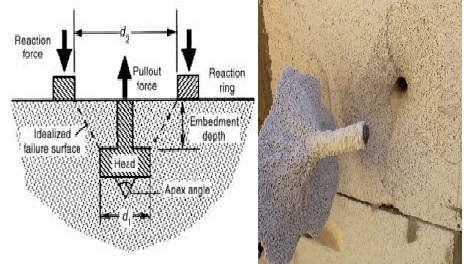
Figure 12:Schemetric diagram of pull out test of concrete (left) [51]; triangular pull out concrete [52]
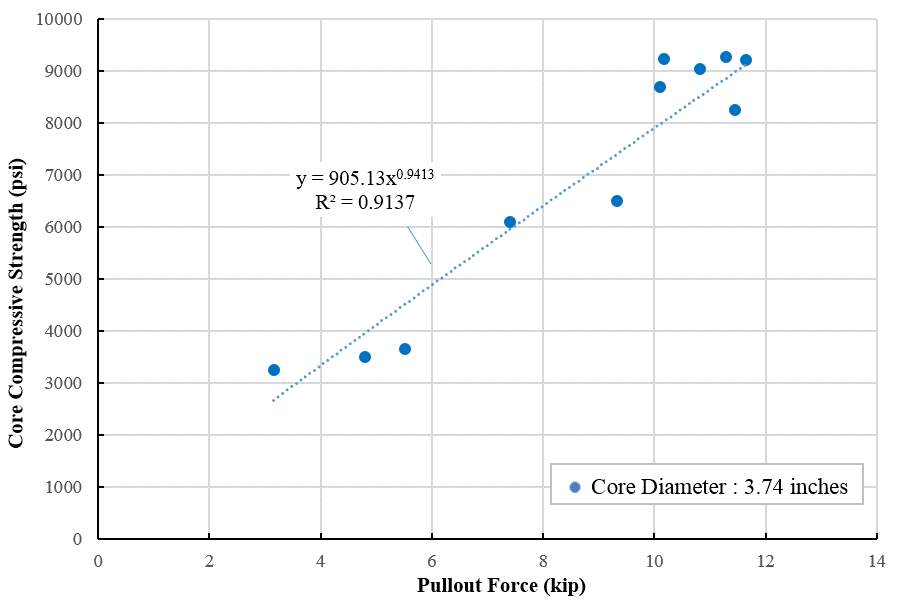
Figure 13: Pull out correlation with concrete compressive strength.
3.6. Maturity Method
The principal of maturity method is based on hydration of cement time and temperature. There are three different concrete maturity index estimation methods: Nurse-Saul (Temperature-Time factor), Arrhenius (Equivalent age), and Weighted maturity. The author discussed in this article only Nurse-Saul method. The Nurse-Saul method assumes that the initial rate of strength gain is a linear function of temperature.
A maturity function M(t) consists of time interval (Δt), average concrete temperature (Ta) and the datum temperature (To). A datum temperature of 0°C or 32°F recommended by ASTM C 1074.

The use of maturity monitoring is: in-situ strength for post-tensioned decks, in-situ strength for form-jumping or cycling, and mass concrete protection or thermal cracking. Fig. 14 shows the concrete maturity meter.
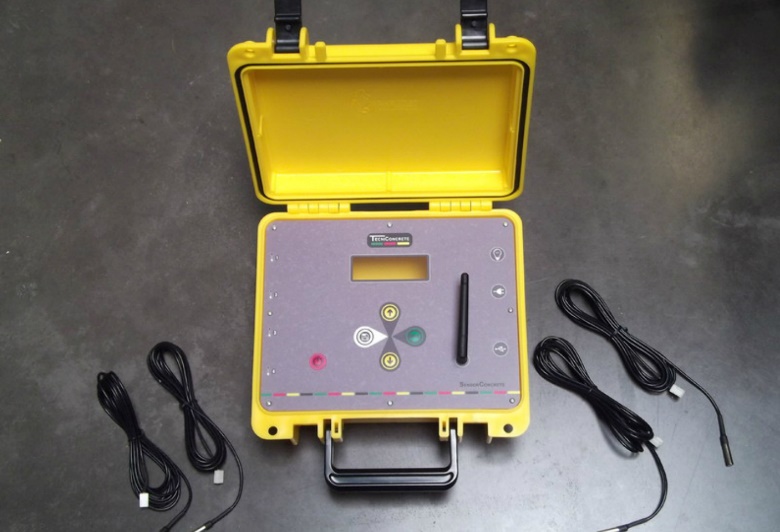
Figure 14: Maturity meter SensorConcrete [53]
3.7. Stress wave propagation method
Deformation in a material caused by waves from impact between materials, explosions and earthquakes etc. is called stress wave. Stress from static loads and dynamic loads has enormous difference. The load application time for static load is long while the load application time for dynamic load is a few seconds with a magnitude higher than static loading. This makes the phenomena complex for analysis and the materials behaves differently than normal. A dangerous large deformation is created when the shock velocity is high, and it creates plastic and elastic deformation in the material.
Common stress waves are:
Longitudinal waves/pressure waves (P-wave)
Transverse waves/shear waves (S-wave)
Rayleigh waves/surface wave
3.7.1. Longitudinal waves (P-wave)
When particles come closer to each other and create compressive stress in the material due to move in the same direction as the incident wave, a longitudinal wave is then created as shown in fig. 15. The wave can change compressive wave to tensile wave depending on the boundary condition.
3.7.2. Transverse wave (S-wave)
The particle movement is perpendicular to the incident wave.
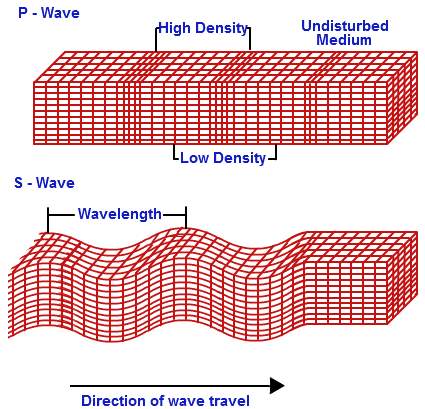
Figure 15: P-wave (upper) and S-wave (lower) [54]
3.7.3. Surface wave
The surface wave has high energy on the surface. It propagates in elliptical counter clockwise way, up and down combined with back and forth motion as shown in fig. 16.
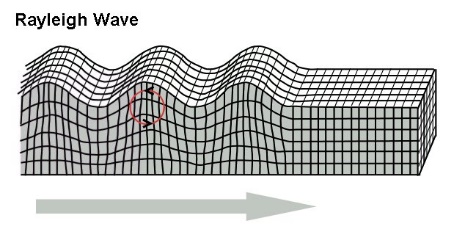
Figure 16: Rayleigh wave or surface wave [55]
Lei et al. (2017) used stress waves along a rock bolt to develop Automatic Extract Algorithm (AEA) method based on the self-correlation analysis and statistical analysis [56]. A large pre-stress force is applied on the rock bolt to minimize the loose movement of the rock [57]. Piezoceramic transducers and Lead Zirconate Titanate (PZT) are used to detect the reflected stress wave and a giant magnetostrictive (GMS) transducer used to generate the stress on the exposed end of the rock bolt [58]. The arrival time of the wave from the end of the rock bolt and the periodicity is then determined. From the interval time the length of rock bolt is calculated. AEA is faster than traditional Phase Analysis Method (PAM).
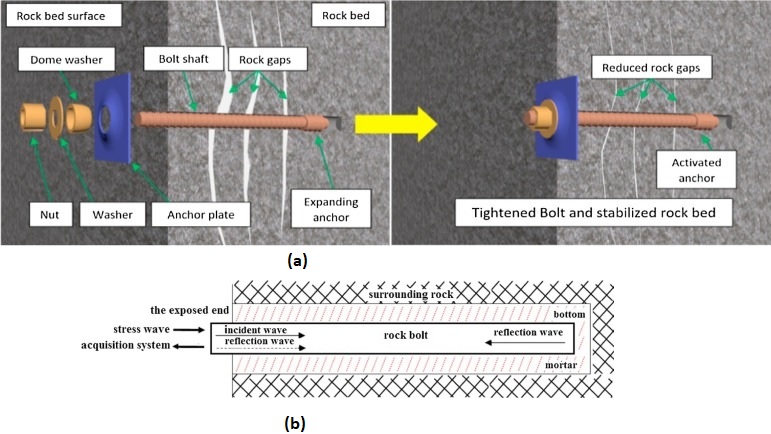
Figure 17: (a) Rock bolt reinforced rock masses; (b) schematic diagram of rock bolt mechanism [56]
3.8. Acoustic emission method
Acoustic method is a nondestructive method that surveillance the existing civil engineering structures for detecting prestressed cable failure and cracks in concrete [59]. Acoustic emission method deployed for bridge health monitoring by many researchers [60-65]. Yu et al. (2011) used acoustic emission method to predict fatigue crack in steel bridge [66]. This method also used for monitoring damage initiation and propagation carbon fiber-reinforced-polymer (CFRP) stay cables in bridge [67, 68]. Colombo et al. (2003) developed ‘b-value’ analysis method for assessing reinforced concrete beam based on acoustic emission method [69].
 Figure 18: Acoustic emission instrumentation [70]
Application of acoustic emission method are [71]
- continuous damage growth monitoring of concrete.
- Fracture type, orientation, size and energy determination.
- Recording failure process of a structure under load condition.
- Detecting rebar corrosion at early stage [72].
- Assessment of the nature of process zone. Process zone is the region of discontinuous crack ahead of visible continuous crack [43].
The limitation of the acoustic emission is that the energy released by this method is smaller than the ultrasonic techniques signal. For this reason, more sensitive sensor, reliable amplifier and pre-amplifier are required. This create problems such as influence of ambient noise, attenuation of signal and sometimes low signal to noise ratio. As a result, sophisticated instruments needs to detect and localize the damage pattern [73].
3.9. Covermeter
Covermeter measures the concrete cover thickness over the reinforcement and locate the rebar location. Commercially available covermeter is Profoscope. It detects rebar by electromagnetic pulse induction (as shown in fig. 19).
Application of covermeter are:
- Rebar location determination.
- Rebar spacing determination.
- Concrete cover determination.
- Bar diameter estimation.
- Mid-point between bars evaluation.
- Bar orientation assessment.
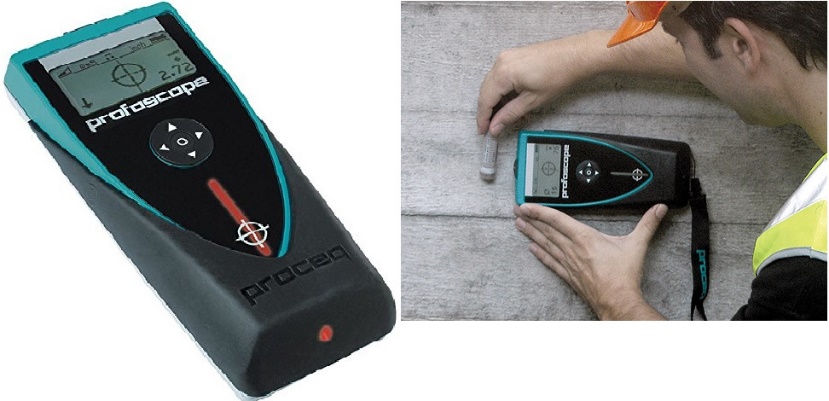
Figure 19: Profoscope to detect rebar location [74, 75]
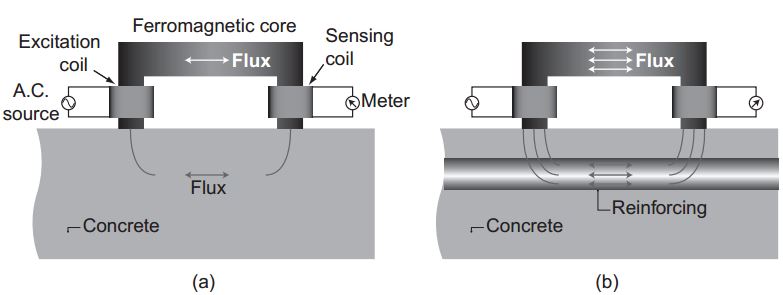
Figure 20: (a) sensing coil produces a small flux when the covermeter is placed on a nonreinforced area; (b) the sensing coil measure a high flux when reinforce is present in the concrete [43]
3.10. Ground penetration radar
Ground penetration radar (GPR) is a nondestructive rapid method use electromagnetic (EM) energy to probe subsurface. GPR antenna transmit EM waves into the structures and GPR receiver receive the subsurface structures reflected signal. A portion of signal travels through the next layer until it diminishes, and rest of the signal reflected from any reflector such as rebar or anomaly and received by antenna. The reflected energy to the surface is a function of the electromagnetic impedance contrast of the two materials; the stronger GPR reflection comes from greater electromagnetic impedance. Ground-coupled and Air-coupled are two implementations of GPR as shown in fig. 21. Air-Coupled GPR suspended typically 1 to 2ft above the ground and some portion of the trace represents the travels of EM through the air. ASTM D6087 – 08 described asphalt-covered concrete bridge decks evaluation standard test by GPR [76].
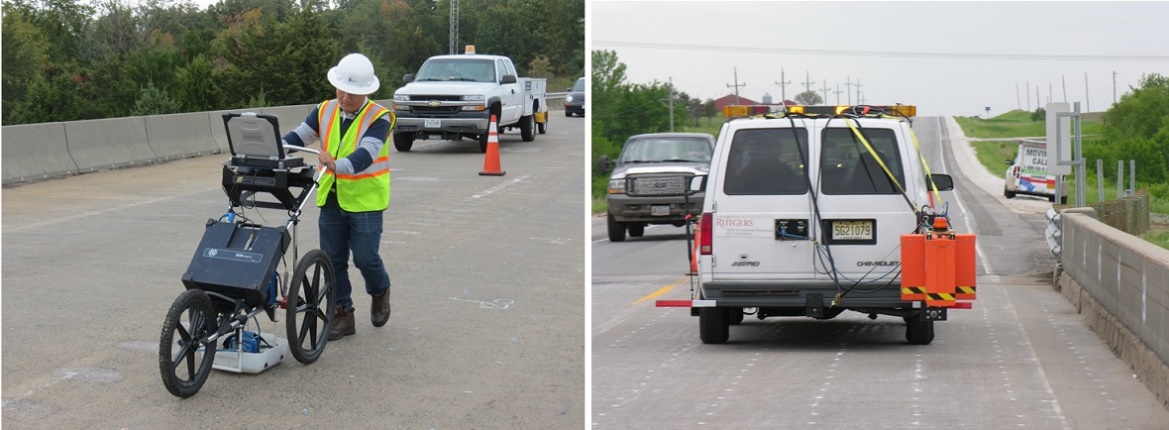
Figure 21: Ground-coupled GPR (left); Air-coupled GPR (right) [4]
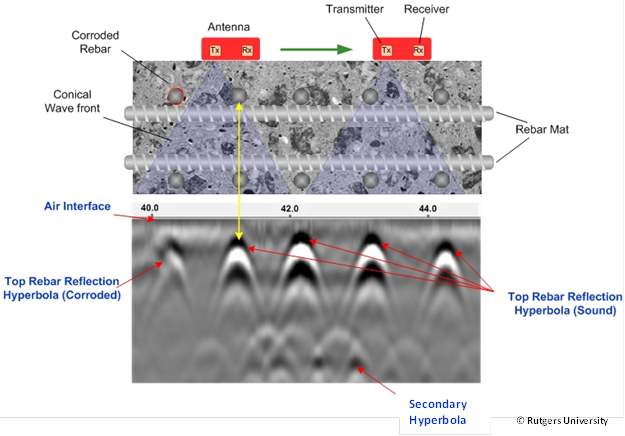
Figure 22: Rebar location by GPR [4]
GPR signal is attenuated in corroded concrete deck, moist and free chloride ions conductive materials. The phase velocity of GPR signal depends on relative dielectric constant of the materials. The dielectric constant for air and water are 1 and 80 respectively. The relative dielectric constant is a function of porosity, water content, temperature, mix proportions, pore fluid solution, and particle shape. For example, moister content in gravel increase the dielectric constant from 5 to 20. When rust is formed over a steel bar or delamination due to steel bar corrosion, electrical conductivity and dielectric properties of corroded rebar changes compared to sound rebar. As a result, velocity and amplitude of reflected wave is changed compared to sound one. Fig. 23 shows GPR radiogram for a partially corroded steel bar.
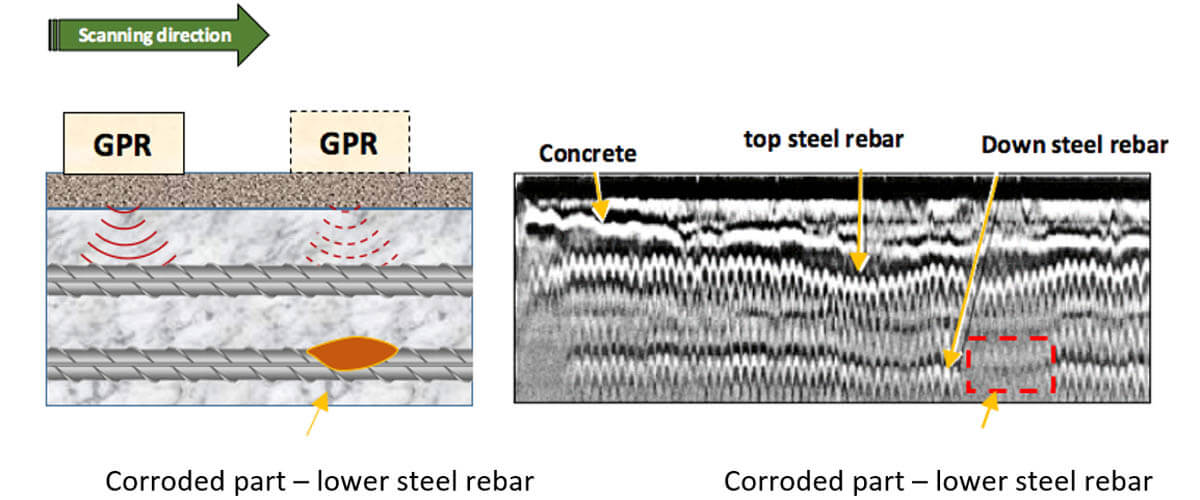
Figure 23: Corrosion detection by GPR [77]
Advantages of GPR over other NDT methods:
- Rapid, reliable, repeatable, and well-established data acquisition method.
- Well correlated between corrosive environment and electrical resistivity.
- The method is popular to detect voids and delamination’s, rebar location and arrangement, material interface changes and pavement thickness.
Limitation of GPR:
- Expert people need to data acquisition, processing and interpretation.
- It is costly when applied for an individual structure.
- Signal penetration is attenuated when de-icing agent is used on the structure.
- In extremely cold condition there is negative data.
- Within the upper half of the deck, GPR can easily identify the corrosive rebar but for lower half it is difficult to detect due to upper half rebar mat.
- Deck delamination cannot assess directly by GPR.
- GPR signal attenuated due to conductive soil, wet clay, salt water saturated water, etc.
3.11. Infrared thermography
3.12. Reinforced concrete topography
3.13. Electrochemical method
3.14. Electrical method
References
[1] Khawwam. (2004). International workshop on preservation of historical structures with FRP composites. Available: https://www.slideshare.net/Khawwam/8-tests-for-concrete
[2] E. Sheils, A. O’Connor, F. Schoefs, and D. Breysse, “Investigation of the effect of the quality of inspection techniques on the optimal inspection interval for structures,” Structure and Infrastructure Engineering, vol. 8, no. 6, pp. 557-568, 2012.
[3] D. Breysse, G. Klysz, X. Dérobert, C. Sirieix, and J. Lataste, “How to combine several non-destructive techniques for a better assessment of concrete structures,” Cement and Concrete Research, vol. 38, no. 6, pp. 783-793, 2008.
[4] (2017). Federal Highway Administration Research and Technology
Nondestructive Evaluation (NDE) GPR Web Manual. Available: https://fhwaapps.fhwa.dot.gov/ndep/DisplayTechnology.aspx?tech_id=25
[5] D. Breysse and O. Abraham, “Guide méthodologique de l’évaluation non destructive des ouvrages en béton armé,” Presses ENPC, Paris, 2005.
[6] J. Bungey, S. Millard, and M. Grantham, “Ultrasonic pulse velocity methods,” Testing of Concrete in Structures, Taylor & Francis, New York, 2006.
[7] T. Uomoto, Non-destructive testing in civil engineering 2000. Elsevier, 2000.
[8] P. Das and M. Hardy, “Specifications for competitive tendering of NDT inspection of bridges,” in BRIDGE MANAGEMENT 4-INSPECTION, MAINTENANCE, ASSESSMENT AND REPAIR, 2000.
[9] D. McCann and M. Forde, “Review of NDT methods in the assessment of concrete and masonry structures,” Ndt & E International, vol. 34, no. 2, pp. 71-84, 2001.
[10] C. Colla, P. Das, D. McCann, and M. Forde, “Sonic, electromagnetic and impulse radar investigation of stone masonry bridges,” Ndt & E International, vol. 30, no. 4, pp. 249-254, 1997.
[11] J. Martin, M. S. Hardy, A. S. Usmani, and M. C. Forde, “Accuracy of NDE in bridge assessment,” Engineering structures, vol. 20, no. 11, pp. 979-984, 1998.
[12] P. McDowell et al., “Geophysics in engineering investigations,” 2002.
[13] A. G. Davis, C. Dunn, and CEBTP, “From theory to field experience with the non-destructive vibration testing of piles,” Proceedings of the Institution of Civil Engineers, vol. 57, no. 4, pp. 571-593, 1974.
[14] N. J. Carino, M. Sansalone, and N. N. Hsu, “A point source-point receiver, pulse-echo technique for flaw detection in concrete,” in Journal Proceedings, 1986, vol. 83, no. 2, pp. 199-208.
[15] C. Cheng and M. Sansalone, “The impact-echo response of concrete plates containing delaminations: numerical, experimental and field studies,” Materials and Structures, vol. 26, no. 5, pp. 274-285, 1993.
[16] M. J. Sansalone and W. B. Streett, “Impact-echo. Nondestructive evaluation of concrete and masonry,” 1997.
[17] J. R. Peter Shaw, Torben Klitt Petersen, Christian Bernstone. (2004). A Pratical Guide to Non Destructive Examination of Concrete. Available: https://www.researchgate.net/publication/305209558_A_Pratical_Guide_to_Non_Destructive_Examination_of_Concrete
[18] A. Kumar, P. Thavasimuthu, P. Kalyanasundaram, and B. Raj, “Structural integrity assessment of ring beam of a pressurized heavy water nuclear reactor using impact echo technique,” in Proceedings of 15th world conference on NDT, Roma, 2000.
[19] (2017). IEI Products Page. Available: http://www.impact-echo.com/Impact-Echo/products.htm
[20] J. Grove, K. Jones, D. Ye, and J. Gudimettla, “Nondestructive Tests of Thickness Measurements for Concrete Pavements: Tests Really Work,” Transportation Research Record: Journal of the Transportation Research Board, no. 2268, pp. 61-67, 2012.
[21] V. MALHOTRA and V. SIVASUNDARAM, “Resonant Frequency Methods. In.: MALHOTRA, VM; CARINO, NJ (Eds.). Handbook on Nondestructive Testing of Concrete. West Conshohocken,” ed: CRC Press LLC (ASTM International), 2004.
[22] A. Monteiro and A. Gonçalves, “Assessment of characteristic compressive strength in structures by the rebound hammer test according to EN 13791: 2007,” ed: NDTCE.
[23] (2017). Ultrasonic pulse velocity tester, Concrete testing equipment, Controls. Available: http://www.controls-group.com/eng/concrete-testing-equipment/ultrasonic-pulse-velocity-tester.php
[24] B. S. Al-Nu’man, B. R. Aziz, S. A. Abdulla, and S. E. Khaleel, “Effect of Aggregate Content on the Concrete Compressive Strength-Ultrasonic Pulse Velocity Relationship,” American Journal of Civil Engineering and Architecture, vol. 4, no. 1, pp. 1-5, 2016.
[25] Designed and w. m. c. Promoted by Maharashtra Industries Directory. (2017). Ultrasonic Pulse Velocity Test, Ultrasonic Pulse Velocity Testing Instruments, Pune, India. Available: http://www.ndtconcrete.com/ultrasonic-pulse-velocity-test.html
[26] A. Samarin and P. Meynink, “Use of combined ultrasonic and rebound hammer method for determining strength of concrete structural members,” Concrete International, vol. 3, no. 03, pp. 25-29, 1981.
[27] I. Facaoaru, “Contribution a l’étude de la relation entre la résistance du béton a la compression et de la vitesse de propagation longitudinale des ultrasons,” RILEM Bull, vol. 12, pp. 125-154, 1961.
[28] R. Hamid, K. Yusof, and M. F. M. Zain, “A combined ultrasound method applied to high performance concrete with silica fume,” Construction and Building Materials, vol. 24, no. 1, pp. 94-98, 2010.
[29] M. Machado, L. Shehata, and I. Shehata, “Correlation curves to characterize concretes used in Rio de Janeiro by means of non destructive tests,” Revista IBRACON de Estruturas e Materiais, vol. 2, no. 2, pp. 100-123, 2009.
[30] M. D. Machado, L. D. Shehata, and I. A. E. M. Shehata, “Curvas de correlação para caracterizar concretos usados no Rio de Janeiro por meio de ensaios não destrutivos,” RIEM-IBRACON Structures and Materials Journal, vol. 2, no. 2, 2009.
[31] E. Proverbio, V. Venturi, and S. Messina, “Reliability of nondestructive tests for on site concrete strength assessment,” 10DBMC, Lyon, France, 2005.
[32] H. Y. Qasrawi, “Concrete strength by combined nondestructive methods simply and reliably predicted,” Cement and concrete research, vol. 30, no. 5, pp. 739-746, 2000.
[33] V. Sturrup, F. Vecchio, and H. Caratin, “Pulse velocity as a measure of concrete compressive strength,” Special Publication, vol. 82, pp. 201-228, 1984.
[34] G. Trtnik, F. Kavčič, and G. Turk, “Prediction of concrete strength using ultrasonic pulse velocity and artificial neural networks,” Ultrasonics, vol. 49, no. 1, pp. 53-60, 2009.
[35] Ö. Arıöz et al., “Use of Combined Non-Destructive Methods to Assess the Strength of Concrete in Structures,” 2009.
[36] K. B. Najim and M. R. Hall, “Mechanical and dynamic properties of self-compacting crumb rubber modified concrete,” Construction and building materials, vol. 27, no. 1, pp. 521-530, 2012.
[37] D. Breysse, “Nondestructive evaluation of concrete strength: An historical review and a new perspective by combining NDT methods,” Construction and Building Materials, vol. 33, pp. 139-163, 2012.
[38] J. H. Bungey, “The testing of concrete in structures / J.H. Bungey – Details,” 1989.
[39] “SAMHITHA INNOVATIONS,” 2017.
[40] (2017). Concrete test hammer – Original Schmidt – Proceq – Videos. Available: http://www.directindustry.com/prod/proceq/product-7242-52715.html
[41] (2017). ASTM C805 / C805M – 13a Standard Test Method for Rebound Number of Hardened Concrete. Available: https://www.astm.org/Standards/C805.htm
[42] A. Castañeda, F. Corvo, J. Howland, R. Marrero, and D. Fernández, “ATMOSPHERIC CORROSION OF STEEL-REINFORCED CONCRETE IN A COASTAL CITY LOCATED ON A TROPICAL ISLAND,” REINFORCED CONCRETE, p. 109.
[43] P. K. Mehta, “Concrete. Structure, properties and materials,” 1986.
[44] (2017). ASTM C803 / C803M – 17 Standard Test Method for Penetration Resistance of Hardened Concrete. Available: https://www.astm.org/Standards/C803.htm
[45] (2017). James Instruments – è¿›å£é‡‡è´. Available: http://www.bpress.cn/im/tag/James-Instruments/
[46] Khawwam. (2017). 8 tests for concrete. Available: https://www.slideshare.net/Khawwam/8-tests-for-concrete
[47] (2017). Engineersdaily | Free engineering database: Penetration Resistance Test (ASTM C 803 ). Available: http://www.engineersdaily.com/2011/04/penetration-resistance-test-astm-c-803.html
[48] (2017). ASTM C900 – 15 Standard Test Method for Pullout Strength of Hardened Concrete. Available: https://www.astm.org/Standards/C900.htm
[49] V. M. Malhotra, “Nondestructive tests,” in Significance of Tests and Properties of Concrete and Concrete-Making Materials: ASTM International, 2006.
[50] (2017). Hydrajaws Model 2000 Digital Bluetooth System Anchor Pull Tester. Available: http://www.abaris.co.uk/prod/anchors/Hydrajaws-Model-2000-Digital-Bluetooth-System-Anchor-Pull-Tester.htm#description
[51] “Engineersdaily | Free engineering database: Pull Out Test of Concrete,” 2017.
[52] Gharpedia. (2017). In-Situ Concrete Pull Out Test for Compressive Strength. Available: https://gharpedia.com/in-situ-concrete-pull-out-test/
[53] (2017). Maturity method Techniconcrete. Available: http://www.techniconcrete.com/equipment-for-sale/maturity-method/
[54] (2017). P Wave, P Wave ECG, P Wave Velocity | Physics@TutorCircle.com. Available: http://physics.tutorcircle.com/waves/p-wave.html
[55] File:Rayleigh wave.jpg – Wikimedia Commons. Available: https://commons.wikimedia.org/wiki/File:Rayleigh_wave.jpg
[56] M. Lei, W. Li, M. Luo, and G. Song, “An automatic extraction algorithm for measurement of installed rock bolt length based on stress wave reflection,” Measurement, 2017.
[57] S. C. M. Ho, W. Li, B. Wang, and G. Song, “A load measuring anchor plate for rock bolt using fiber optic sensor,” Smart Materials and Structures, vol. 26, no. 5, p. 057003, 2017.
[58] M. Luo, W. Li, B. Wang, Q. Fu, and G. Song, “Measurement of the Length of Installed Rock Bolt Based on Stress Wave Reflection by Using a Giant Magnetostrictive (GMS) Actuator and a PZT Sensor,” Sensors, vol. 17, no. 3, p. 444, 2017.
[59] R. Laloux and J. Robert, “ACOUSTIC EMISSION TECHNIQUES APPLIED TO CIVIL ENGINEERING STRUCTURES,” 1986.
[60] K. M. Holford and R. J. Lark, “Acoustic Emission Testing Bridges,” 2005.
[61] A. Nair and C. Cai, “Acoustic emission monitoring of bridges: Review and case studies,” Engineering structures, vol. 32, no. 6, pp. 1704-1714, 2010.
[62] L. Golaski, P. Gebski, and K. Ono, “Diagnostics of reinforced concrete bridges by acoustic emission,” Journal of acoustic emission, vol. 20, no. 2002, pp. 83-89, 2002.
[63] Z. Gong, E. Nyborg, and G. Oommen, “Acoustic emission monitoring of steel railroad bridges,” Materials evaluation, vol. 50, no. 7, 1992.
[64] K. M. Holford, A. Davies, R. Pullin, and D. Carter, “Damage location in steel bridges by acoustic emission,” Journal of intelligent material systems and structures, vol. 12, no. 8, pp. 567-576, 2001.
[65] A. Ghorbanpoor and A. T. Rentmeester, “NDE of steel bridges by acoustic emission,” in Structural Engineering in Natural Hazards Mitigation, 1993, pp. 1008-1013: ASCE.
[66] J. Yu, P. Ziehl, B. Zárate, and J. Caicedo, “Prediction of fatigue crack growth in steel bridge components using acoustic emission,” Journal of Constructional Steel Research, vol. 67, no. 8, pp. 1254-1260, 2011.
[67] P. Rizzo and F. L. di Scalea, “Acoustic emission monitoring of carbon-fiber-reinforced-polymer bridge stay cables in large-scale testing,” Experimental mechanics, vol. 41, no. 3, pp. 282-290, 2001.
[68] S. Yuyama, K. Yokoyama, K. Niitani, M. Ohtsu, and T. Uomoto, “Detection and evaluation of failures in high-strength tendon of prestressed concrete bridges by acoustic emission,” Construction and building materials, vol. 21, no. 3, pp. 491-500, 2007.
[69] I. S. Colombo, I. Main, and M. Forde, “Assessing damage of reinforced concrete beam using “b-value” analysis of acoustic emission signals,” Journal of materials in civil engineering, vol. 15, no. 3, pp. 280-286, 2003.
[70] (2017). Physical Acoustics AE Technology – Overview of Acoustic Emission NDT Technology. Available: http://www.physicalacoustics.com/ae-technology/
[71] C. U. Grosse, H. W. Reinhardt, and F. Finck, “Signal-based acoustic emission techniques in civil engineering,” Journal of materials in civil engineering, vol. 15, no. 3, pp. 274-279, 2003.
[72] A. K. Farid Uddin, M. Ohtsu, K. M. Hossain, and M. Lachemi, “Simulation of reinforcement-corrosion-induced crack propagation in concrete by acoustic emission technique and boundary element method analysis,” Canadian Journal of Civil Engineering, vol. 34, no. 10, pp. 1197-1207, 2007.
[73] C. U. Grosse and M. Ohtsu, Acoustic emission testing. Springer Science & Business Media, 2008.
[74] (2017). Metal rebar locator – max. 180 mm | Profoscope – Proceq – Videos. Available: http://www.directindustry.com/prod/proceq/product-7242-370133.html
[75] Administrator. (2017). ratioTEC Prüfsysteme GmbH – Profoscope. Available: http://www.ratiotec.com/en/85-me-und-prfgerte/bauinstandsetzung/459-profoscope
[76] (2017). ASTM D6087 – 08 Standard Test Method for Evaluating Asphalt-Covered Concrete Bridge Decks Using Ground Penetrating Radar. Available: https://www.astm.org/DATABASE.CART/HISTORICAL/D6087-08.htm
[77] “Challenges in Corrosion Mapping with GPR | FPrimeC Solutions,” 2016-07-25 2016.
Cite This Work
To export a reference to this article please select a referencing stye below:
Related Services
View allRelated Content
All TagsContent relating to: "Engineering"
Engineering is the application of scientific principles and mathematics to designing and building of structures, such as bridges or buildings, roads, machines etc. and includes a range of specialised fields.
Related Articles
DMCA / Removal Request
If you are the original writer of this dissertation and no longer wish to have your work published on the UKDiss.com website then please:


