Wireless Charging of Electric Vehicles
Info: 10395 words (42 pages) Dissertation
Published: 21st Feb 2022
Tagged: TechnologyAutomotive
Comprehensive System for Vehicle Misalignment Measurement and Foreign Object Detection Intended for Dynamic Wireless Charging Applications
Abstract
Electric vehicles (EV) are gradually overcoming their limitations and becoming popular as an environment friendly alternative to conventional gasoline vehicles. To overcome the range limitation associated with electric vehicles, the emerging technology of dynamic wireless charging can be employed. Wireless Power Transfer (WPT) is sensitive to alignment between the transmitter and receiver. An accurate and reliable misalignment detection system is thereby necessary to make the transmitter unit capable of adjusting the power transfer so that the vehicle receives uniform energy irrespective of its misalignment with the transmitter pads. This paper presents a comprehensive study and analysis of different coil structures for an inductive detection algorithm, along with their comparisons. A 3-coil system for vehicle misalignment detection is selected at the end and tested. This detection system also incorporates an image processing-based Foreign Object Detection (FOD) system to recognize hazardous materials placed on the transmitter pad and to turn off the wireless power transfer when necessary. Based on the experimental results found after incorporating the system in a wirelessly charged electric bus, successful operation of the vehicle misalignment and FOD is proved.
Index Terms — Electric vehicles, foreign object detection, wireless power transfer, dynamic charging, vehicle detection techniques.
I. INTRODUCTION
Over the years, Electric Vehicles (EVs) have been getting more and more accepted as an eco-friendly means of transportation. Their popularity is not only a result of environmental concerns but also caused by gasoline price fluctuations and worldwide fossil fuel depletion [1], [2]. It is expected that by 2020 at least one electric model from each major automobile company would be released [3], [4]. Although this is an indication of the gradual market acceptance of EVs, the EV industry still needs to address the range anxiety issue. The United States Department of Energy recently found, in their study, that almost 70 percent of people prefer not to buy an EV because of its limited range [5]. Dynamic Wireless Power Transfer (DWPT) as a method of in-motion EV charging provides an opportunity to alleviate the range anxiety issue by extending the all-electric range of EVs. In addition, it helps reducing the battery size significantly, thereby reducing the overall cost of an EV. High reliability, low maintenance capabilities [3], [4] and above all, eco friendliness makes this technology more suitable for EV applications. High efficiency operation of over 90% is achievable by the usage of inductive wireless charging [6], which makes inductive power transfer (IPT) the most promising means of WPT charging.
WPT is sensitive to alignment of the primary (transmitter) and the secondary (receiver) coils [7]. Increase in misalignment leads to increased magnetic leakage [8], resulting in lack of impedance matching [9] and causing the efficiency to drop significantly. That is the main reason why it is critical to detect the approaching vehicle and activate a WPT system only when there is some substantial alignment between the transmitter and receiver pads. For example, a phase-shift feed-forward controller is proposed in [10] and the power transmission is activated only when there is enough coupling between coils.
The concept of vehicle detection on roadways, however, is not a new one. It existed even before the advent of WPT charging technology on roadways. Primarily, investigation of vehicle detection methods has been focused on traffic management applications. Efficient traffic management calls for an Intelligent Transportation System (ITS) which, in real time, measures and maintains various traffic constraints. Vehicle detection is vitally important in this regard. Those detection methods can be categorized as intrusive and non-intrusive methods. Intrusive methods require the detection system to be installed on/in the road surface, whereas the non-intrusive methods require the system installation to be overhead or at the roadsides. For instance, inductive loop, magnetic sensors etc. are categorized as intrusive detection systems [11]. On the contrary, infrared or ultrasonic sensors are examples of non-intrusive systems. The most widespread vehicle detection system involves the inductive loop method [12]. While comparing with other popular detection methods, inductive loops are better in terms of cost, sensitivity, and average life length [13]. It is also possible to do vehicle classification [14] and speed measurement [15] using inductive loops. However, the disadvantage of this method is that it requires pavement-cutting affecting the pavement’s life.
Magnetic sensors can overcome some of the downsides of the inductive method [16] and it can be as accurate as 90.9%, with advanced algorithms [17]. Magnetic sensing is simple and cost effective, but the detection range is small and it has trouble distinguishing between stationary and moving vehicles [18]. Video/image processing [19], satellite detection [20], infrared detection [21], ultrasonic positioning [22] and machine vision [23] are some of the other methods, each having its respective pros and cons.
Recently, a vehicle alignment detection system has been implemented in stationary WPT applications. It is shown in [24] that only 5% of drivers perfectly align their vehicles with charging pads, which leads to insufficient and inefficient wireless charging. This makes a detection system necessary for stationary EV charging systems. RF positioning method [25] and frequency tracking method [26], for instance, have been employed for EV alignment. The Society of Automotive Engineers (SAE) surveyed the industry representatives offering seven different alignment techniques and based on results identified two as adequate for stationary wireless charging: Low Power Excitation (LPE) and Magnetic Vector (MV) [27]. LPE technique relies on existing magnetic assemblies on the vehicle and in the road, while the MV method uses auxiliary magnetic coil assemblies for generating and sensing magnetic fields. The solution proposed in this article broadly belongs to the MV category, but with numerous modifications necessary to accommodate DWPT.
For DWPT applications, one possible detection method involves using an RF link between the transmitter and receiver pad. However, the signal latency and attenuation of high frequency signal at the receiver make this method difficult. The authors in [28] considered segmenting the transmitter coil itself to make a dynamic WPT detection system. Although it has the upside of not involving any additional sensor coils, the detection information is only available after the vehicle leaves the first coil segment. In addition, only one segment could be energized at a time and the vehicle cannot travel in reverse direction. A three-coil detection system is proposed in [29] where the phase reversal of the induced voltage in the detection coils is used as the detection algorithm.
The objective of the research presented in this article is to study, design, and develop a detection system capable of accurately detecting the vehicle and vehicle misalignment for a wide range of misalignment values. The detection system should be capable of coping with variable vertical offsets caused by different vehicle ground clearances, providing a general solution applicable to different vehicle models. In this paper, a novel detection hardware structure and associated algorithm based on inductively coupled coils and the induced voltage difference between detection coils are discussed for dynamic wireless charging applications. Single-, double- and three-coil systems are investigated in detail, and their advantages and disadvantages are discussed. Successful misalignment detection is observed for double- and three-coil systems, and the three-coil detection system is chosen for the practical implementation. The detection system was successfully implemented along with a Foreign Object Detection (FOD) subsystem on a wirelessly charged 22-foot electric bus system and tested on an outdoor test track. The implementation involves the integration of the detection system in a fully functional dynamic charging environment. The generated detection signal was incorporated in the system that, depending on reported misalignment, adjusts the transmitted power accordingly so that the vehicle receives uniform amount of energy irrespective of its misalignment. The proposed method can operate equally in different types of dynamic charging systems, irrespective of the type of power coils, their shape, layout, etc. Although the proposed method is implemented for dynamic WPT systems, it is equally applicable to stationary WPT applications or as part of a traffic detection system in general.
The paper is organized as follows: first, the design goals are discussed in Section II. A general, system-level block diagram is presented in Section III. An optimization algorithm for three different possible systems, namely single-, double-, and three-coil systems is described in details in Section IV. Finally, simulation results and experimental verification are summarized in Section V and Section VI.
II. PROBLEM FORMULATION & ANALYSIS
For a typical DWPT system, the main power transmitter pad (the primary pad) is embedded in a road or floor. Whereas, the receiver (the secondary pad) is attached underneath the vehicle. Efficient WPT can be achieved only if the primary coil is energized in a timely manner, during the period of high coupling between the two coils. Therefore, the primary controller should be capable of detecting the vehicle before it is on top of the primary coil, and then energizing the primary coil. An ideal detection system should not only work as a vehicle detection sensor, but also have some built-in intelligence to detect the misalignment of the vehicle secondary receiver pad with respect to the primary transmitter pad. The primary controller can use this misalignment information to adjust the transmitted power accordingly. That way, the vehicle would receive uniform power regardless of its misalignment, as long as the misalignment is inside of an acceptable range.
The second important issue that an ideal detection system must successfully overcome is the signal latency. The detection system must sense the vehicle, perform all calculations, and send the sensing and misalignment information to the primary power controller before the power receiver reaches the top of the power transmitter pad. The higher the speed of the vehicle, the less time is available for the operation of the detection system, particularly if the detection system is integrated with the primary pad leaving less time to the power controller to process the misalignment and speed information.
The proposed detection system consists of a primary coil that is mounted on the vehicle. Depending on the detection algorithm, one or multiple secondary detection coils are installed underground to sense the induced voltage(s) when the primary detection coil is above the secondary detection coils. The sensed voltage(s) are then processed to extract the vehicle misalignment information. The objective of the research is to design a detection system capable of detecting the misalignment and at the same time maintain simplicity and low sensitivity to variations in vehicle pad ground clearance. In this paper, we present an approach to optimize the detection system by studying effects such as the vehicle vertical offset, the number and the spacing between secondary detection coils, etc. Extensive simulation results are provided to understand the impact of those parameters on accuracy and detectable misalignment range. The performance of three different configurations of the detection system are investigated and compared to get the best performance.
Since the active part of the detection system (source of the high-frequency signal) is positioned at the vehicle, the vehicle can control its own discoverability and prevent primary charger activation. In the proposed solution, we demonstrate two concurrent methods: i) by the action of the Energy Management System (EMS) on the vehicle, and ii) by the action of the FOD system. When the maximum State of Charge (SoC) of the vehicle’s battery is reached, the EMS turns off the primary of the detection circuit to make the vehicle “magnetically invisible” and prevent further charging. The same could happen when the FOD system detects a hazardous object interfering with the primary pad position. After the critical pad is passed, the FOD would activate again the detection system to resume charging. The operation of both systems is discussed in Section III.
III. SYSTEM OVERVIEW
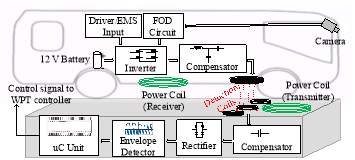
Fig. 1. Detection system block diagram.
The proposed detection system broadly consists of three subsystems: the FOD subsystem, the primary circuitry, and the secondary circuitry. A detailed block diagram is given in Fig. 1. The primary circuitry is mounted on the vehicle and the secondary circuitry is embedded in the road. The primary circuitry is mounted underneath the front part of the vehicle (electric bus in this case) while the secondary system can be positioned in front of, at, or even behind the primary power pad. A detailed system description is given below.
A. Foreign Object Detection (FOD) Subsystem
Foreign objects can absorb energy from the magnetic field resulting in a parasitic heat loss. This type of heating can pose a serious safety threat to WPT applications and environment [30] and significantly reduce the overall efficiency. Therefore, an FOD system is important to prevent power transfer in these situations. Witricity [31] proposes the inductive detection method that senses power, frequency, current, voltage, and phase angle. The construction of overlapped coil structure used in their design is complicated and hard to implement on a PCB. The Power Loss Detection (PLD) method [32] is cost effective and simpler as it does not need additional protection elements like heatsinks or thermocouples. However, this method is only proved effective for low power applications. The quality factor of the secondary coil decreases when there is a foreign metallic object placed on the primary, and this can be used as a measurement for FOD as described in [33]. However, this method is only valid for the stationary charged WPT system. In this paper, high-speed image processing is used to detect the foreign objects from a distance. This subsystem uses image detection algorithm to detect a few most common types of foreign objects on the primary power pads. If the FOD subsystem “sees” an obstacle, the detection system will be turned off, making the vehicle “invisible” to the primary pad. The FOD circuit output and the bus driver/EMS decision signals are incorporated into a logic circuit that determines when to turn ON/OFF the detection system. The logic truth table for different I/O relationships is given in Table I.
Fig. 2 shows the FOD subsystem mounted on a board that was later mounted in the bus beside the driver’s seat. The FOD system is based on computer vision (CV) approach. Fig. 2 shows the FOD system that consists of four Raspberry Pi-3 (RPi) Model B ARMv8 1GB RAM computers. The rightmost one works as master and the other three are designated as clients. The master is attached to a camera board (via the white camera cable shown in Fig. 2), that is mounted on the bus windshield. In principle, FOD accuracy increases with numbers of CPUs in that each CPU can be responsible for detecting specific features in smaller regions. However, higher CPU numbers require more power consumption, heat management, and packaging; they also increase communication overhead. This might lead to smaller FOD packages for different smaller EVs.
TABLE I
Truth table for system i/o
| Battery Fully Charged? | Foreign Object Detected? | Detection System Output |
| No | No | ON |
| No | Yes | OFF |
| Yes | No | OFF |
| Yes | Yes | OFF |
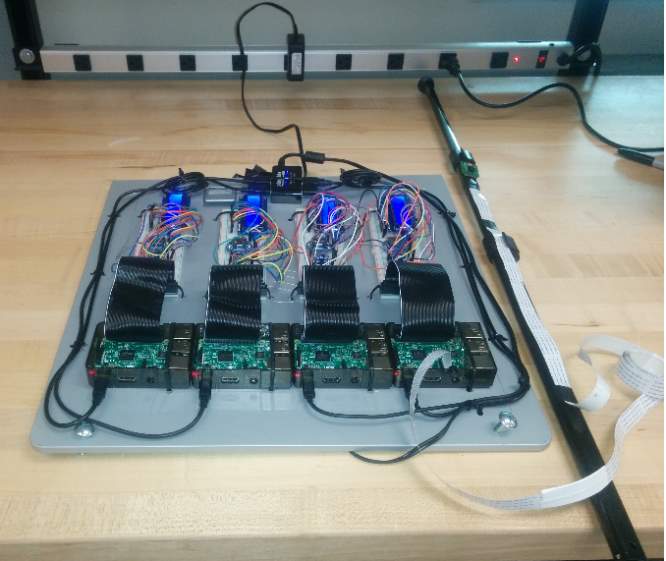
Fig. 2. Foreign Object Detection (FOD) System.
B. Primary Circuitry
Primary circuitry takes its power for operation directly from the vehicle 12-V battery, eliminating the need for an external power source. It consists of an inverter, a compensation tank, and a primary coil, as shown in Fig. 3. The full-bridge inverter operating at fixed 50% duty cycle outputs the maximum voltage at a switching frequency of 95 kHz. The inverter takes two input signals: one is the remote operated input that comes from the EMS and/or driver, which switches on and off the detection system whenever needed. The second input comes from the FOD subsystem logic output, as shown in Fig. 3.
The inverter gate driver generates four gate pulses for the full bridge inverter and is controlled by the PWM signal as well as the logic signals mentioned above. A compensation circuit follows the inverter. The topology of this compensation circuit is important for efficient operation of the system. Different types of series and parallel compensation have been proposed in [34]. In [35], the LCC compensation circuit has been employed. This topology makes the resonant frequency almost independent of the load and mostly unaffected by the coils’ coupling coefficient. This topology results in improved lateral misalignment tolerance [36], which makes the detection range wider and improves the overall WPT efficiency [37]. Zero voltage or current switching is also possible with the LCC structure [35], [38]. The primary detection coil is connected in series with the compensation network, as shown in Fig. 3.
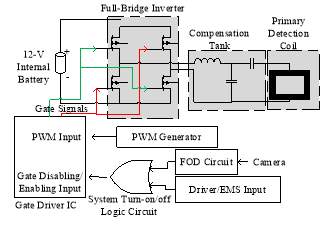
Fig. 3. Primary detection circuit.
The inverter circuitry, the compensation network, and the primary coil complete the primary circuitry. The inverter and the compensation network are contained in a waterproof box. Fig. 4 shows the interior and exterior part of this mounting box. The primary detection coil is shown in Fig. 5. It is sealed in a plastic enclosure and mounted underneath the bus along its central axis.
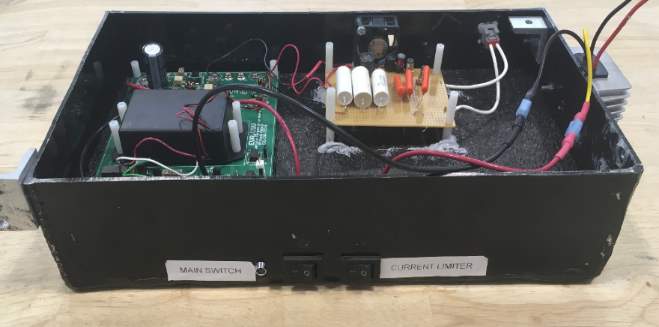
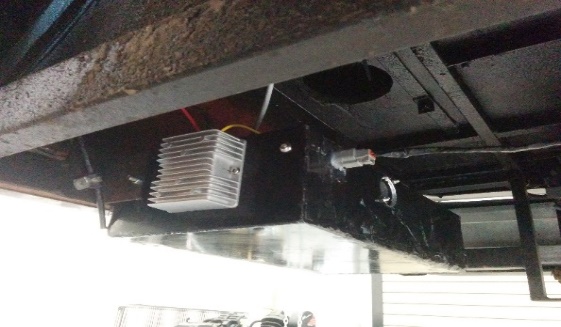
Fig. 4. The interior and exterior view of the box containing inverter circuitry.
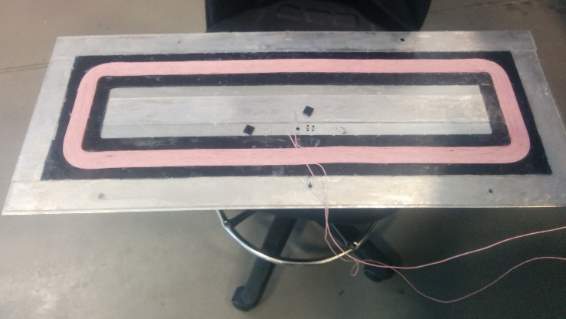
Fig. 5. Primary detection coil.
C. Secondary Circuitry
The secondary receiver circuit is shown in Fig. 6. It consists of the secondary detection coil(s), followed by a series capacitive compensation circuit and a full-bridge rectifier, which converts the high-frequency induced waveform into a DC waveform. Appropriate values of capacitors were placed at each rectifier output to properly capture the waveform envelop and reject the harmonics and noise without introducing much delay. These envelops contain the misalignment information, which is then processed by a microcontroller unit. Finally, this information is sent to the main WPT controller, which controls the power level used to charge the EV battery.
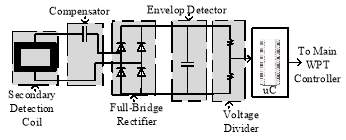
Fig. 6. Secondary detection circuit.
The secondary circuitry is designed to be embedded in the road. Fig. 7 shows the constructed secondary circuitry. Fig. 8 highlights the relative location of main WPT coils with respect to the secondary detection coils. For proper operation, the vehicle should be driven over the detection coil first and then the WPT coils. In order to process the misalignment information and send the final control signal to the WPT coil before the vehicle is above the primary WPT coil, the time taken for the vehicle to move to the WPT coil after crossing the detection coils is vital. Although separated now, the detection coils will be integrated with the primary power pad in the future.
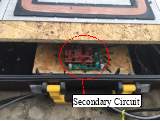
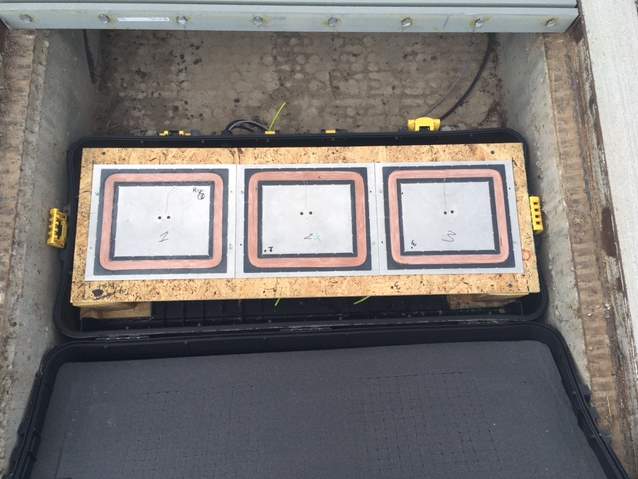
Fig. 7. Secondary detection circuitry and mount board.
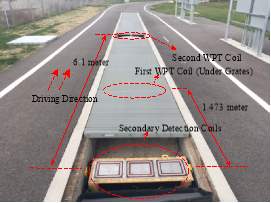
Fig. 8. Secondary detection coil and main WPT coil installed in the road.
IV. DETECTION SYSTEM OPTIMUM DESIGN
In order to optimize the size and complexity of the system, four different layouts of detection coils are investigated. They could be classified as single-coil, double-coil, and three-coil structures. Three coils can be positioned in-line or to form a triangle. The latter layout has the advantage of measuring the vehicle speed at the price of more space occupied in the road. The four configurations (A, B, C, and D) are shown in Fig. 9. Rectangular coil shapes are selected over the circular coils to better fit the available space underneath the bus and in the road.
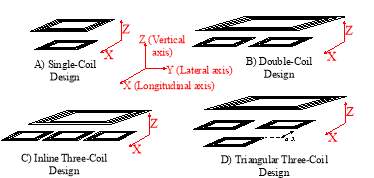
Fig. 9. Four different designs of detection system.
The envelops of the signals induced in the detection coils are used as an input to the detection algorithm. Regardless of the selected design or layout, the detected coil voltage envelop for every coil is a bell-shaped curve along the longitudinal axis (x-axis in Fig. 9) with a maxima reached when the coils are aligned longitudinally. This makes it easier to make the lateral misalignment decision based on the maxima of each signal envelop reached at the longitudinally aligned point.
A. Analysis of a Single-Coil Design
Fig. 10 shows the single detection coil design for which the mutual inductance profile needs to be derived. A common approach to calculate the mutual inductance between two current carrying filaments is by means of Neumann’s formula:
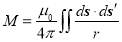
(1)
Here, r is the distance between the line elements ds and ds´, and μ0 is the permeability of empty space. This fundamental formula could be extended to calculate the mutual inductance between two rectangular coils, such as those shown in Fig. 10. The derivation of the mutual inductance expression is presented in Appendix I. Using that method, the coupling profile between the primary and the secondary detection coils was simulated, and the simulation results are shown in Fig. 11.
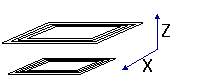
Fig. 10. Single-coil system.
The measured detected voltage is directly proportional to the mutual inductance for a constant primary coil current. Consequently, the mutual inductance profile could be used to develop a misalignment detection algorithm. Depending on the value of mutual inductance, the misalignment could be readily detected. However, if only the individual value of the mutual inductance is used, it might often result in an erroneous misalignment value. The mutual inductance value is sensitive to the vertical offset between the primary and the detection coils. Therefore, if the vehicle ground clearance is varied due to different weight-load conditions, it would change the mutual inductance values that would lead to a wrong result.
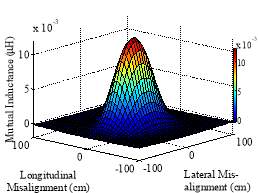
Fig. 11. 3D mutual-inductance profile of a single-coil design.
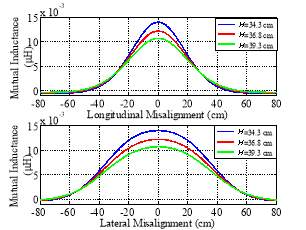
Fig. 12. Mutual inductance profile of a single-coil system for three different clearances.
Fig. 12 shows the mutual inductance profile between the primary and secondary longitudinally aligned coils for three different vertical clearances. The three different levels consist of an average vehicle ground clearance and two other clearances at +/-2.5 cm from that level (which represents overloaded and under-loaded vehicle conditions). It is also evident that the same coupling could be resulted from different clearances, which makes it difficult to accurately measure the misalignment by using a single coil only. Additionally, a single coil could cover only a narrow misalignment detection range. Because of these reasons, the single-coil system is not suitable and thereby the concept of multiple coils is considered. Since the use of single measured value of mutual inductance is prone to produce a misleading detection information, to make the algorithm less sensitive to height variations, the difference between detection signals instead of the actual individual signals is considered.
B. Analysis of a Double-Coil Design
Fig. 13 demonstrates a double-coil system consisting of two identical shaped secondary detection coils. The double-coil system could use the differential voltage between two coils to reduce the effect of height variations and other environmental variations. It could also result in a larger misalignment detection range. Fig. 14 demonstrates the immediate improvement of using the double-coil differential signal over the single-coil individual signal, by showing that the differential signal has less variation than the individual signal.
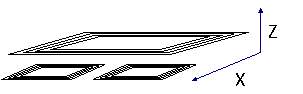
Fig. 13. Double-coil system.
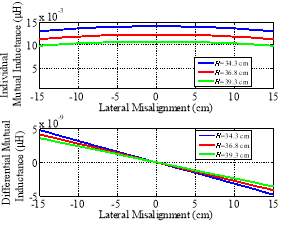
Fig. 14. Comparison between the single-coil individual and the double-coil differential mutual inductance variation with ground clearance.
Finding the optimum distance between the two coils to ensure the best range and accuracy of detection is of paramount importance. Two extreme cases where the coils are too close or too far away are illustrated in Fig. 15. If the coils are too close, the system would effectively behave as a single-coil system and the detection range would be small consequently. If the coils are too far, there would be a “dead zone” with unchanged differential value which cannot be interpreted by the detection algorithm, as there is no change in value with respect to misalignment in the “dead zone”.
Very low induced voltage values (corresponding to less than 10% of the maximum mutual inductance) could be corrupted by noise and might be hard to detect due to voltage drop of the rectification diodes, thereby being prone to error. Thereby, a new variable named Field Width Wf is proposed as shown in Fig.16. Wf represents the detectable region of the mutual inductance curve. By varying the center-to-center distance between the two coils, it was found that if the coil distance is less than Wf, then there would be no “dead zone”. This is used as the highest limit of the center-to-center coils distance. In addition, if the coils are directly placed next to each other, the center-to-center distance is equal to coil’s width, which sets the lower limit of the allowable distance. The optimum value should be searched in between these maximum and minimum allowable distance values.
For finding out the optimum value and detectable range, the following criteria are chosen:
- In the optimum detectable range, the differential value should be unambiguous. That means that there should not be any identical values of the differential for two different misalignments. This condition narrows down the maximum possible detection zone in between the centers of the coils. In addition, as in the Wf explanation, less than 10% of the maximum value cannot be accurately detected. This further narrows the optimum detectable range.
- The differential swing should be maximized on both sides of the misalignment axis. This would ensure that a small change in misalignment would trigger a large change in the differential, resulting in the higher resolution of detection. This optimization could be essentially achieved by varying the coil distance and finding the distance corresponding to the lowest possible minima value of the slope of the differential.
With this criterion, the optimized value of the center-to-center distance was found to be 72 cm, as suggested in Fig. 17. Fig. 18 shows the relative position of the optimum, minimum and maximum center-to-center distances along with the optimum detectable range which was found to be from -21 cm to +21 cm. With respect the size of the detection coil of 27.6 cm width, the optimum center-to-center distance represents about 260% of this width, and the optimum detection range is then approximately 170% of the coil width. These two parameters are scalable with the width of the detection coils, which could be one approach to increase the detection range. Alternatively, an additional detection coil can be used.
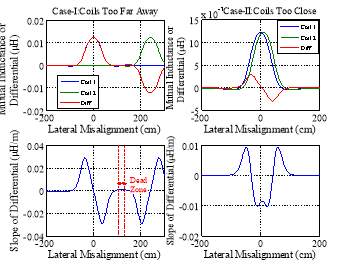
Fig. 15. The effect of distance between two coils of a double-coil design.
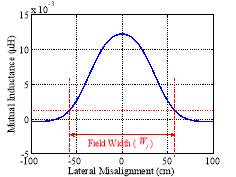
Fig. 16. Determining the effective zone for mutual inductance calculation.
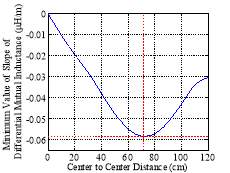
Fig. 17. Optimum operating zone selection for double-coil system.
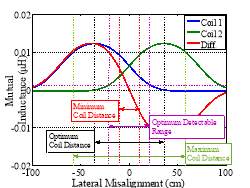
Fig. 18. An optimum operating zone location for a double-coil system.
C. Analysis of a Three-Coil Design
In order to increase the optimum detectable range, a third coil can be used in addition to the aforementioned double-coil system. Fig. 19 and 20 show the two almost identical three-coil systems. The three-coil system could cover a wider area than the two coils so the detection range is higher with better precision. If the center coil is displaced along the longitudinal axis, it could be possible to get information about the differential distance in a differential period, which would result in an additional speed detection capability of the design. A design of this type is shown in Fig. 20.
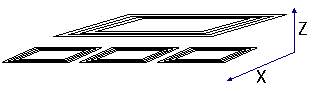
Fig. 19. A three-coil system.
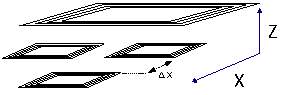
Fig. 20. The three-coil triangular system for additional speed detection.
Fig. 21 demonstrates the mutual inductance profile of a three-coil system similar to the one selected for the experimental validation of detection algorithm. It clearly demonstrates that with a third coil inserted in the middle of the double-coil configuration, it is possible to increase the optimum detectable range in both directions from ±21 cm to ±58 cm. While the lateral misalignment is within ±21 cm, the misalignment can still be determined from Coil 1 and Coil 3. However, when either Coil 1 or Coil 3 drops below 10% of the maximum in the positive or negative direction, Coil 2 can be used to measure misalignment. Thereby, in both directions, the 10% cutoff line of Coil 2 determines the boundary of optimum detection range. That makes the optimum detectable range of the three-coil system equal to Wf of the central coil. Outside the Wf range the measured signals can still be used for misalignment estimation, but they would be prone to error due to variable vertical offset, as explain in the case of singe-coil design.
A detailed Finite Element Analysis (FEA) with precise electromagnetic analysis is provided in Section V for both a double- and a three-coil systems. Additionally, a SIMULINK simulation of the electrical system is conducted and discussed.
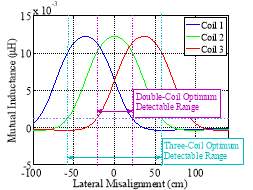
Fig. 21. Lateral mutual inductance profile for three-coil system.
V. SIMULATION RESULTS
After choosing the three-coil configuration for the detection system, an ANSYS-MAXWELL simulation model was built to investigate the system’s electromagnetic profiles more accurately. Fig. 22 shows the simulation model built. The simulation output for the model is shown in Fig. 23 where the lateral mutual inductance profile for zero longitudinal misalignment is plotted. The ANSYS model models all aspects of the final design (adjacent detection coils, shielding metal plate, ferrite plates for field shaping, and real number of turns deposited in a flat pattern) and provides a more realistic view of the system than the single-turn coils used for the analytical study above.
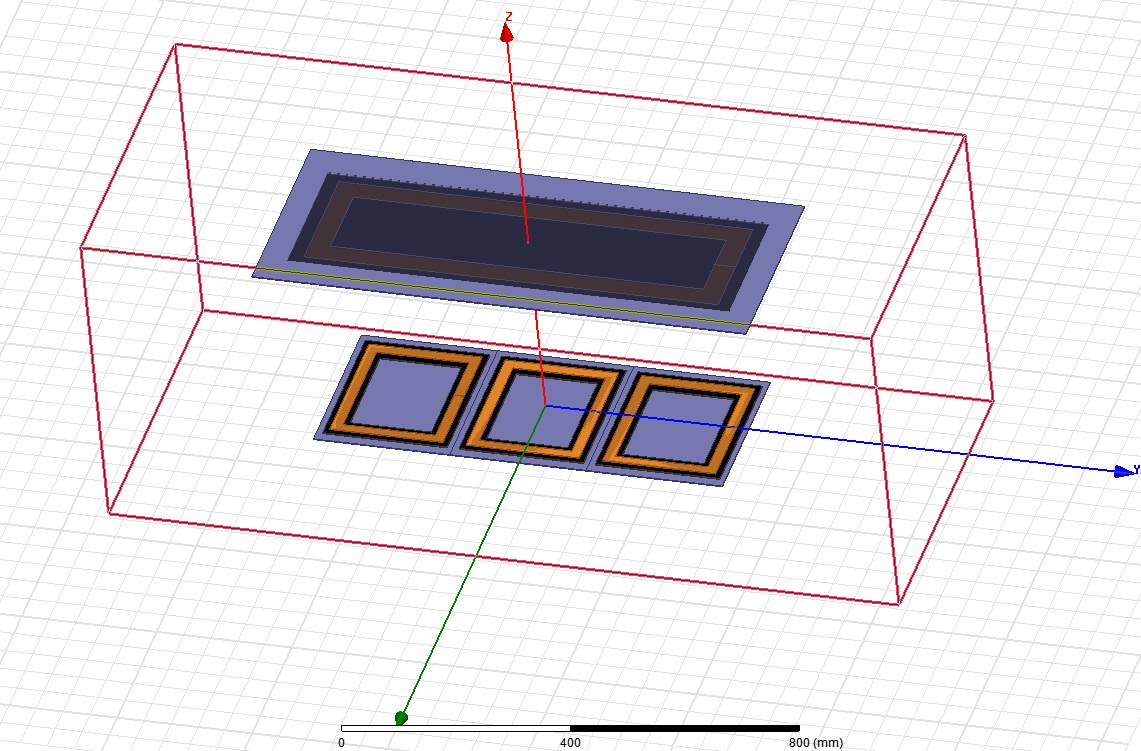
Fig. 22. An FEM simulation model of the three-coil detection system.
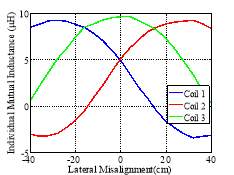
Fig. 23. Lateral axis mutual inductance profile for three-coil system from the Ansys-Maxwell simulation.
Those Maxwell simulation results were further incorporated into a MATLAB/Simulink model to simulate the electrical system in details. For simplification purpose, the simulation was performed for a constant vehicle speed of 40 km/h (similar to the speed used for experimental testing later). Fig. 24 summarizes the three coil voltages. In the practical implementation, these voltage signals are further processed by the microcontroller unit to implement the detection algorithm.
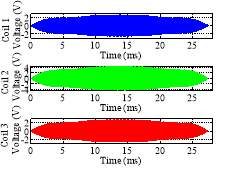
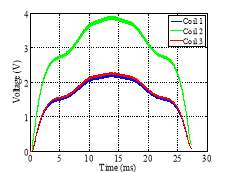
Fig. 24. Simulation outputs showing the detected voltages and envelop voltages at the secondary detection coils.
VI. EXPERIMANTAL VERIFICATION
A. Misalignment Detection
The existing wireless charging system on electric bus operates using 20-kHz operation frequency. A proper selection of the detection system operation frequency is needed for its efficient operation. To avoid interference between the two systems (including the impact of harmonics), the operation frequency of the detection system should be positioned far from the WPT frequency. The frequency sweep characteristics of the primary detection coil shown in Fig. 25 reveals that the coil’s ESR (Equivalent Series Resistance) increases with frequency, causing the coil quality factor to drop eventually. Therefore, to ensure an acceptable efficiency while being reasonably far from the WPT frequency (20 kHz), the detection system operating frequency was chosen to be 95 kHz. This is around 95/20 or at the position of “4.75th” harmonics, so it should not significantly interfere with the WPT system itself.
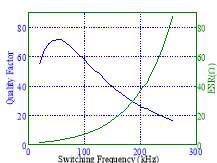
Fig. 25. Primary detection coil characteristics.
After building the hardware setup as discussed in Section III, the characterization of the coils with respect to different misalignment conditions were carried out by measuring the induced coil voltages, which are proportional to the coils mutual inductance. The height clearance H between the primary and secondary coils was kept equal to what would be the actual clearance in road condition when the system with the secondary coils is buried in the road. The interpolated voltage curves of the three-coil system are shown in Fig. 26. The points are measured along the lateral axis, both positive and negative, with zero longitudinal misalignment between primary and secondary coils. As one can see, each coil has a bell-shaped voltage profile with a peak corresponding to the perfect alignment between that coil and the primary coil. Since Coil 2 is perfectly aligned with the primary detection coil at zero lateral misalignment, it has a peak at that point.
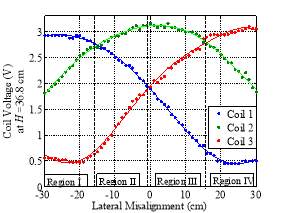
Fig. 26. Lateral voltage profile for the three-coil system obtained experimentally (dots) and interpolated curves (lines) with the resolution of 1 cm.
In order to determine lateral misalignment, the voltage profile is divided in four regions, as shown in Fig. 26. These regions were determined by observing where the voltage curves crossed each other. Now, it could be easily determined which section the system is operating in by simply subtracting the coil voltages from each other. This method allows for faster computation and higher accuracy. Once a region is determined, the voltages are used in order to determine exact lateral misalignment. In order to get high accuracy, the line with the highest and steady slope was used in each region. In Region I, the differential voltage between Coil 2 and Coil 1 is used. Regions II and III use the difference between Coil 1 and 3. In Region IV, the differential voltage between Coil 2 and 3 is used. All characterization results are incorporated into the detection algorithm. The system specifications are summarized in TABLE II.
TABLE II
Detection System Electrical Specifications
| System Parameter | Value |
| Supply voltage | 12 V |
| Operation frequency | 95 kHz |
| Primary coil track current | 1 A (rms) |
| Primary coil Litz wire specification | 5/5/28/40 |
| Primary coil number of turns
Primary coil MLT Primary coil outer dimensions |
20
1.70 m 75 cm X 20 m |
| Secondary coil Litz wire specification
Secondary coil MLT Secondary coil outer dimensions |
20/44
0.914 m 26.7 cm X 21.6 cm |
| Secondary coil number of turns | 45 |
When no foreign object is detected, the voltage in secondary coils is induced, which is used to determine misalignment. An example of the secondary coil envelope voltages received by the microcontroller are shown in Fig. 27. The effect of vehicle height on the detection system was investigated, as well. Fig. 28 shows two different height levels H and the associated induced voltage curves. It is clearly observable that the lower the height, the higher the induced voltage is. However, as we will see below, the detection algorithm is capable of eliminating the impact of the vertical clearance providing accurate misalignment, no matter what the vertical offset is.
Upon installation on the bus and under the roadway, the system was tested. Using a step size of 2 cm, the lateral misalignment was tested for ±30 cm from the centerline. This range was determined to be sufficient for this application. This test was done for different ground clearances (emulated by lifting or lowering the detection coils instead of loading the bus), and the results are summarized in TABLE III. The system reports an average absolute error of 0.0645 cm for nominal clearance. With the mechanical load changes, the clearance also changes. For a 2.5 cm variation of clearance, the error in reported misalignment was roughly restricted within 1 cm.
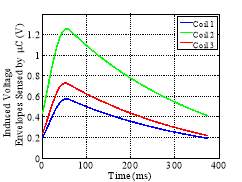
Fig. 27. Voltage at microcontroller as a function of time for the bus is moving at 24 km/h.
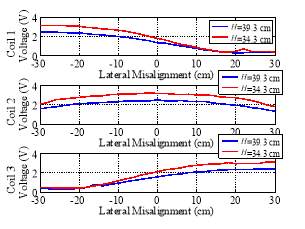
Fig. 28. Effect of different heights H on induced coil voltages.
TABLE III
Experimental Results of Detection System
| Experimented range (cm) | Misalignment
step size (cm) |
Ground clearance (cm) | Mean absolute error (cm) | Reported maximum error (cm) | |||
| -30 to + 30 | 2 | 34.3 | 1.0323 | 2 | |||
| -30 to + 30 | 2 | 36.83 | 0.0645 | 1 | |||
| -30 to + 30 | 2 | 39.37 | 0.6452 | 2 | |||
B. Foreign Object Detection
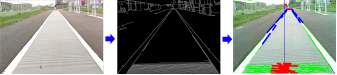
Fig. 29 shows the current software architecture of the FOD system. The master (M) and the three clients (C1, C2, and C3) are configured as an ad hoc sensor network. Communication between the master and the clients is based on Secure File Transfer Protocol (SFTP) over Wi-Fi. The master runs a thread that captures 360 x 240 PNG images. Each camera image is converted to grayscale, convoluted with the Gaussian 7 x 7 blur kernel [39], and then the Canny edge detector is applied [40]. The result of these steps is shown in Fig. 30 b).
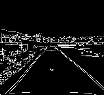
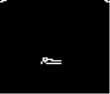
Each image is then split into three strips and each strip is then processed by image processing threads on different clients C1-C3. The probabilistic Hough Transform [41] is applied to detect lines bordering the road or charger area. The lines are filtered to be in the range of ± 45 ± 15 degrees (Fig 30 c)). Foreign objects on road surfaces are detected with 1-D Haar Wavelet Spikes [42-43]. Fig. 31 shows the logical steps of FOD on road surfaces. A Region of Interest (ROI) is selected in the center of the image with detected edges in Fig. 31 a). The ROI is shown in Fig. 31 b). 1-D Ordered Haar Wavelet Transform (HWT) is applied to selected rows and columns of the ROI. The selected rows form a cross pattern in the middle of the ROI, as shown in Fig. 31 c). The length and width of the cross bars are controlled by the input parameters.
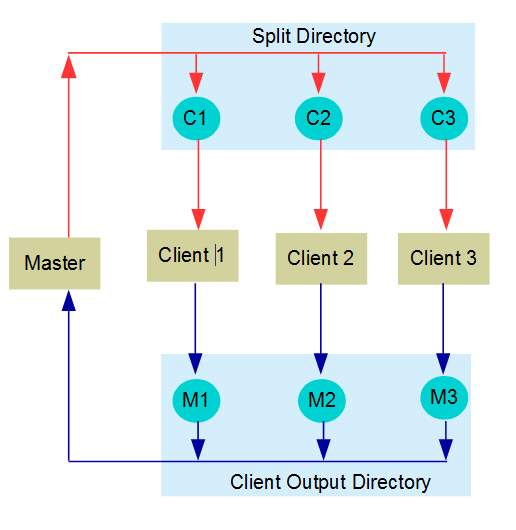
Fig. 29. Software architecture of the FOD system.
(a) (b) (c)
Fig. 30. Process of framing and identifying the region of interest (rimmed by road or charger lines).
Detected spikes in rows or columns signal the presence or absence of foreign objects on road surfaces, as shown in Fig. 31 d). Clients process the strips and transfer their results using an ad hoc coding scheme back to the master. The fusion thread that runs on the master then classifies the results in one of the two categories: ROAD_CLEAR and OBJECT_ON_ROAD. If an object is detected on the road surface, master emits the signal OBJECT_ON_ROAD; otherwise, it emits the signal ROAD_CLEAR. These classifications are passed to the bus control system as ON/OFF voltages on specific GPIO pins. The current architecture processes 10 frames per second.
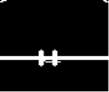
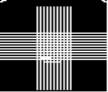
(a) (b) (c) (d)
Fig. 31. FOD identification on road.
The FOD system was successfully tested in sunny and cloudy weather conditions, as shown in Fig. 32. It is important to mention that the designed FOD system can operate only in daytime because of the limited vision capability of the camera used. Infrared cameras could be employed for night-vision, which is to be investigated in future research.
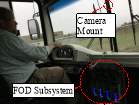

Fig. 32. The FOD system test setup.
The captured oscilloscope snapshots of the FOD system are summarized in Fig. 33. Upon detecting the object, the FOD system outputs a digital pulse (blue), which turns off the primary detection circuit, and the primary coil current (yellow) goes to zero. After passing the object, the digital pulse is removed which enables the circuit again, and the coil current flows again. Since the secondary road-embedded circuitry is passive, the primary coil status alone determines the detection system output status.
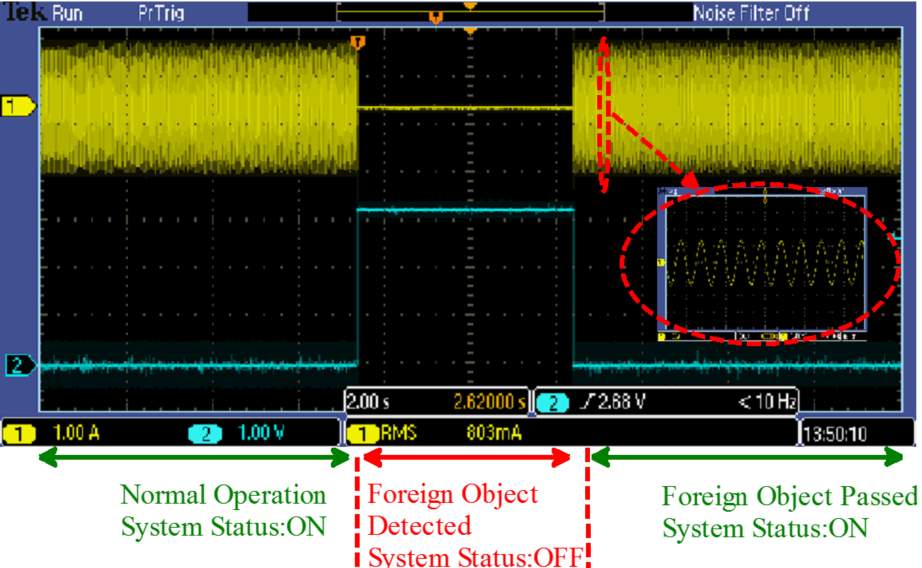
Fig. 33. FOD system output snapshots.
VII. CONCLUSION
In this paper, an inductive detection system for vehicle misalignment detection in wireless charging applications is studied. An optimum number of detection coils as well as the detectable range for a misalignment detection system is determined. In addition, a foreign object detection system and a driver/EMS input for emergency shutdown is employed. An optimized three-coil detection system was implemented, in conjunction with an existing wirelessly charged electric bus. This reported misalignment information can be used to adjust power levels of the dynamic wireless power system in order to compensate for driver misalignment. The system performance, which was evaluated at different mechanical load conditions of the bus, was found to be satisfactory for all cases, with a mean absolute error of less than 1.04 cm. The vehicle misalignment detection can also be incorporated in the Intelligent Transportation System (ITS) as a means of vehicle detection in general, which would help measuring the real-time traffic constraints.
Appendix
Two parallel wire segment are shown in Fig. 34. Distance between segments is D, their axial misalignment is m, and the segment lengths are l1 and l2.
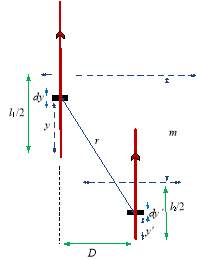
Fig. 31. Mutual inductance calculation for two parallel wire segments.
After replacing the dot product of parallel infinitesimal vectors ds and ds’ by their scalar product dy·dy´, Neumann’s formula (1) results in the double integral:
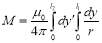
(2)
where:
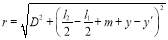
(3)
The solution of (2) can be written as:
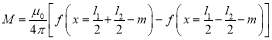
(4)
where:

(5)
Using (4) and (5), the mutual inductances between parallel sides of the two rectangular loops shown in Fig. 32 can be readily found by taking into account the contribution of all parallel segments from different turns. The total mutual inductance could be calculated as an algebraic sum of all the mutual inductances:

(6)
It is important to take into account the direction of current while calculating individual mutual inductances. The same direction of current (e.g., currents in segments 1 and 1’) results in positive mutual inductances, whereas different current directions (e.g., segments 1 and 3´) result in a negative value. Terms in (6) can be obtained by substituting the right combination of parameters l1, l2, D, and m in (4) and (5). For each pair of parallel conductors, these four parameters are listed in TABLE IV.
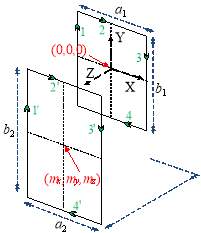
Fig. 35. Two parallel misaligned rectangular coil turns.
TABLE IV
Parameters for Mutual Inductance Calculation of Two Rectangular Coils
| M l1 l2 D m | ||||
| M11´ | b1 | b2 | (mz2+0.5(a1–a2)+mx)0.5 | my |
| M13´ | b1 | b2 | (mz2+0.5(a1+a2)+mx)0.5 | my |
| M22´ | a1 | a2 | (mz2+0.5(-b1+b2)+my)0.5 | mx |
| M24´ | a1 | a2 | (mz2+0.5(-b1–b2)+my)0.5 | mx |
| M31´ | b1 | b2 | (mz2+0.5(-a1-a2)+mx)0.5 | my |
| M33´ | b1 | b2 | (mz2+0.5(-a1+a2)+mx)0.5 | my |
| M42´ | a1 | a2 | (mz2+0.5(b1+b2)+my)0.5 | mx |
| M44´ | a1 | a2 | (mz2+0.5(b1-b2)+my)0.5 | mx |
REFERENCES
G. A. Covic and J. T. Boys, “Modern trends in inductive power transfer for transportation applications,” IEEE J. Emer. Sel. Top. Power Electron. , vol. 1, no. 1, pp. 28-41, March 2013.
T. M. Fisher,K. B. Farley, Y. Gao, H. Bai, and Z. T. Tse, “Electric vehicle wireless charging technology: a state-of-the-art review of magnetic coupling systems,” Wireless Power Tran., vol. 1, no. 2, pp. 87–96, 2014.
R. Johnson, “Bumpy road to EV 2020,” Electron. Eng. Times, vol. 10, no. 1629, pp. 24–29, Oct. 2012.
B. Fleming, “Electric vehicle collaboration–Toyota Motor Corporation and Tesla Motors [Automotive Electronics],” IEEE Veh. Technol. Mag., vol. 8, no. 1, pp. 4–9, Mar. 2013.
U.S. National Energy Technology Laboratory. Assessment of Future Vehicle Transportation Options and Their Impact on the Electric Grid. [Online]. Available: https://www.netl.doe.gov/energy-analyses, accessed Jul. 30, 2016.
S. Kummell, “Standard proposal for resonant inductive charging of electric vehicles,” in Proc. AMAA , Berlin, Germany, May 2012.
Y. Gao, K. B. Farley, and Z. T. H. Tse, “A uniform voltage gain control for alignment robustness in wireless EV charging,” Energies, vol. 8, no. 8, pp. 8355–8370, 2015.
K. Fotopoulou and B. W. Flynn, “Wireless power transfer in loosely coupled Links: coil misalignment model,” IEEE Trans. Magn., vol. 47, no. 2, pp. 416-430, Feb. 2011.
J. L. Villa, J. Sallan, J. F. Sanz Osorio and A. Llombart, “High-misalignment tolerant compensation topology for ICPT systems,” IEEE Trans. Ind. Electron., vol. 59, no. 2, pp. 945-951, Feb. 2012.
N. Hasan, H. Wang, T. Saha and Z. Pantic, “A novel position sensorless power transfer control of lumped coil-based in-motion wireless power transfer systems,” in Proc. IEEE ECCE, Montreal, QC, 2015, pp. 586-593.
D. Desai and S. Somani, “Instinctive traffic control and vehicle detection techniques,” Int. J. Scient. Engr. Research, Vol. 5, issue 1, Jan. 2014.
M. A. G. Clark, “Induction loop vehicle detector,” U.S. Patent 4 568 937, Feb. 4, 1986.
Traffic Detector Handbook, 3rd ed., U.S. Department of Transportation, Federal Highway Administration, vol. 1, pp 1.1-4.61, Oct. 2006.
S. Meta and M. G. Cinsdikici, “Vehicle-classification algorithm based on component analysis for single-loop inductive detector,” IEEE Trans. Veh. Technol., vol. 59, no. 6, pp. 2795-2805, July 2010.
Yong-Kul Ki, Doo-Kwon Baik, “Model for accurate speed measurement using double-loop detectors,” IEEE Trans. Veh. Technol., July 2006, vol- 55, pp. 1094 – 1101.
W. Zhang, G. Tan, N. Ding, “Traffic information detection based on scattered sensor data: model and algorithms,” Ad Hoc Sens. Wireless Net., vol. 18, no. 3, pp. 225-240, 2013.
Q. Wang, J. Zheng, B. Xu and Y. Huang, “Analysis and experiments of vehicle detection with magnetic sensors in urban environments,” in Proc. IEEE CYBER, Shenyang, 2015, pp. 71-75.
D. D. Desai and S. B. Somani, “Evaluation of intrusive vehicle detection and classification technique for traffic management,” in Proc. IEEE INDICON, Pune, 2014, pp. 1-6.
R.M. Tyburski, “A review of road sensor technology for monitoring vehicle traffic,” ITE J., vol. 59, pp. 27-29, issue 8, Aug. 1989.
Xiaoying Jin and C. H. Davis, “Vector-guided vehicle detection from high-resolution satellite imagery,” in Proc. IEEE IGARSS, AK, 2004, pp. 1095-1098.
M. Rivas-López et al., “Vehicle detection using an infrared light emitter and a photodiode as visualization system,” in Proc. IEEE ISIE, Buzios, 2015, pp. 972-975.
C. Medina, J. C. Segura, and ´ A. De la Torre, “Ultrasound indoor positioning system based on a low-power wireless sensor network providing sub-centimeter accuracy,” Sensors, vol. 13, no. 3, pp. 3501–3526, 2013.
G. J. Ho, S. K. Dong, J. Y. Pal, and K. Jaihie, “Parking slot markings recognition for automatic parking assist system,” in Proc. IEEE IVS, Tokyo, 2006, pp. 106–113.
S. A. Birrell, D. Wilson, C. P. Yang, G. Dhadyalla, and P. Jennings, “How driver behaviour and parking alignment affects inductive charging systems for electric vehicles,” Transp. Research Part C: Emer. Tech., vol. 58, pp. 721–731, 2015.
W.Ni, I.Collings, X.Wang et al., “Radio alignment for inductive charging of electric vehicles,” IEEE Trans. Ind. Electron., vol. 11, pp. 427–440, 2015.
Y. Gao, A. Ginart, K. B. Farley and Z. T. H. Tse, “Uniform-gain frequency tracking of wireless EV charging for improving alignment flexibility,” in Proc. IEEE APEC, Long Beach, CA, 2016, pp. 1737-1740.
SAE J2954. Wireless Power Transfer for Light-Duty Plug-In/ Electric Vehicles and Alignment Methodology. [Online]. Available: http://www.sae.org, accessed Jul. 30, 2016.
Q. Deng; J. Liu; D. Czarkowski; M. Bojarski; J. chen; H. Zhou; W. Hu, “Edge position detection of on-line vehicles with segmental wireless power supply,” IEEE Trans. Veh. Technol., vol.PP, no.99, pp.1-1.
G. R. Nagendra, L. Chen, G. A. Covic and J. T. Boys, “Detection of EVs on IPT highways,” IEEE J. Emer. Sel. Top. Power Electron. , vol. 2, no. 3, pp. 584-597, Sept. 2014.
Z. N. Low, J. J. Casanova, P. H. Maier, J. A. Taylor, R. A. Chinga and J. Lin, “Method of load/fault detection for loosely coupled planar wireless power transfer system with power delivery tracking,” IEEE Trans. Ind. Electron., vol. 57, no. 4, pp. 1478-1486, April 2010.
S. Verghese, M. P. Kesler, K. HALL and H. T. Lou, “Foreign object detection in wireless energy transfer systems,” U.S Patent 2013036947, Mar. 15, 2013.
N. Kuyvenhoven, C. Dean, J. Melton, J. Schwannecke and A. E. Umenei, “Development of a foreign object detection and analysis method for wireless power systems,” in Proc. IEEE PSES, San Diego, CA, 2011, pp. 1-6.
S. Fukuda, H. Nakano, Y. Murayama, T. Murakami, O. Kozakai and K. Fujimaki, “A novel metal detector using the quality factor of the secondary coil for wireless power transfer systems,” in Proc. IEEE IMWS, Kyoto, 2012, pp. 241-244.
W. Zhang, S.-C. Wong, C. K. Tse, and Q. Chen, “Analysis and comparison of secondary series-and parallel-compensated inductive power transfer systems operating for optimal efficiency and load independent voltage-transfer ratio,” IEEE Trans. Power Electron., vol. 29, no. 6, pp. 2979-2990, 2014.
S. Li, W. Li, J. Deng, T. D. Nguyen, and C. C. Mi, “A double-sided LCC compensation network and its tuning method for wireless power transfer,” IEEE Trans. Veh. Technol., vol. 64, pp. 2261-2273, 2015.
J. L. Villa, J. Sallan, J. F. S. Osorio, and A. Llombart, “High-misalignment tolerant compensation topology for ICPT systems,” IEEE Trans. Ind. Electron., vol. 59, pp. 945-951, Feb 2012.
C. Linhui, L. Shuo, Z. Yong Chun, and C. Tie Jun, “An optimizable circuit structure for high-efficiency wireless power transfer,” IEEE Trans. Ind. Electron., vol. 60, pp. 339-349, 2013.
Z. Pantic, S. Bai, and S. M. Lukic, “ZCS LCC-compensated resonant inverter for inductive-power-transfer Application,” IEEE Trans. Ind. Electron., vol. 58, pp. 3500-3510, Aug 2011.
R. Laganiere, “OpenCV 2 Computer Vision Application Programming Cookbook”, Packt Publishing LTD, 2011.
J.F. Canny. “A Computational approach to edge detection.” IEEE Trans. on Pat. Anal. And Mach. Intel., vol 8, pp. 679-698, 1986.
R. O. Duda, P. E. Hart. “Use of the Hough transformation to detect lines and curves in pictures.” Comm. ACM, vol. 15, pp. 11–15, Jan. 1972.
A. Jensen, A. Cour-Harbo, “Ripples in mathematics: the discrete wavelet transform,” New York: Springer, 2001.
V. Kulyukin & V. R. Sudini. “Real Time Vision-Based Lane Detection on Raspberry Pi with 1D Haar Wavelet Spikes.” Lecture Notes in Engineering and Computer Science: Proc. of The International Multi Conference of Engineers and Computer Scientists 2017, 15-17 March, 2017, Hong Kong, pp. 75-80.
Cite This Work
To export a reference to this article please select a referencing stye below:
Related Services
View all


Related Content
All TagsContent relating to: "Automotive"
The Automotive industry concerns itself with the design, production, and selling of motor vehicles, such as cars, vans, and motorcycles, and is home to many multi-billion pound companies.
Related Articles

DMCA / Removal Request
If you are the original writer of this dissertation and no longer wish to have your work published on the UKDiss.com website then please: