Water Quality Monitoring System Based on Sensors
Info: 5145 words (21 pages) Dissertation
Published: 18th Jan 2022
Tagged: ElectronicsEnvironmental Science
ABSTRACT
Water pollution is one among the largest fears for the green world. To stop the pollution, initially, we’ve to estimate the water parameters such as PH measurement, Conductivity measurement, Turbidity, Dissolved oxygen, etc. Because the variations within the values of those parameters indicate towards the presence of pollutants. At present time, water parameters are detected by chemical check or laboratory check, wherever the testing equipment are stationary and samples are provided to testing equipment. Thus, the current water quality observation system is done manually with a tedious process and is extremely time-consuming.
To extend and increase the frequency, the testing equipment will be placed in the stream water and detection of pollution will be created remotely. This project proposes a Water Quality Monitoring System that Based on Sensors. The system consists of data monitoring (Observation) nodes, a remote (Control) station. A program is written in machine language, that compares the measured values with standard or required values.
Keywords: Quality, Sensors, Monitoring, Standard, Parameters.
CHAPTER 1 - INTRODUCTION
1.1 - INTRODUCTION
Water Pollution could be a major world issue which needs continuous evaluation and modification of water resource guideline at the levels of international down to individual wells. It has, that water pollution is that the leading reason behind deaths and diseases worldwide. The records show that over 14,000 humans die daily worldwide. In the Republic of India, inevitable 580, die of water pollution related sickness daily. In several developing countries, dirty or contaminated water is getting used for drinking without any correct former treatment. One among the reasons for this happening is that the unawareness of public and administration and also the lack of water quality monitoring system that creates serious health problems. Additionally, natural phenomena like volcanoes, algae tints, rainstorms, and earthquakes also change the quality and ecological status of water.
We know that the water percentage in the earth is about 71% coming from different sources like Sea water, River, Bore well water, springs, Dams. As humans, we need to drink a pure water to make our health better and far away from diseases so we need to make sure that this used water quality is high.
Figure (1.1) The percentage distribution of water in earth
Taking water directly from multiple sources will hurt humans and organisms is largely due to the presence of a lot of impurities in the water and the most prominent of these impurities.
1.1.1 Impurities Present in Water:
a) Dissolved impurities:-
1 - Dissolved salts:- Carbonates ,bicarbonates ,chlorides and sulphates of Ca ,Mg ,Na ,K ,Fe . (Present of this salts make the water hard)
2 - Dissolved gases: C
a= regression coefficient
b= Duan’s bias correction factor
Example
If we assume that we have a water sample with the following data:
Turb=390(FNU), a=0.943, b=0.130
Example
The conductivity of the RO feed is 55000 what is the value of the TDS?
TDS=Cond.0.707(Feed water)
=55000*0.707
=38885 ppm
2.3.5 Results and discussion
The table and chart below for daily report raw water quality :-
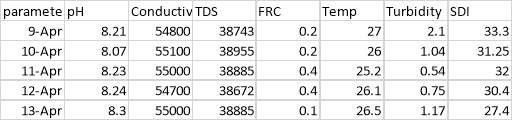
From the results, it is seen that the pH of the raw water intake is in normal increasing in this days measurement since it must be stable from 7.4-8.5 coming to the temperature it is in normal decreasing because the value of it must be between 20-40.Turbidity in a un stable values. Other parameters in stable increasing.
Quality of Intimidate:
From the results, it is seen that the parameters in the micro filtration outlet stage in normal increasing.
Quality of product:
From the results, it is seen that the pH of the potable water outlet is in un stable increasing in this days measurement since it must be between 6-6.8 coming to the temperature it is in un normal decreasing because the value of it must be 28.Turbidity in a stable value which is less than 1. Other parameters in stable increasing.
Quality of product:
From the results, it is seen that the pH of the process water outlet is in un stable increasing in this days measurement since it must be between 6-6.5 coming to the temperature it is in normal state. Turbidity in a stable value which is less than 1. Other parameters in stable increasing.
SUMMARY
A detailed study is carried out on the measurement procedures and equipment in our study area. The major draw backs of manual measurement are pH, Temperature, Turbidity and Total Dissolved Solids. The third chapter provides the information about the development of hardware model for water quality monitoring.
CHAPTER 3 - DESIGN AND DEVELOPMENT OF PROTOTYPE MODEL
3.1 INTRODUCTION
This chapter describes the block diagram and circuit diagram for hardware model implementation.
3.2 BLOCK DIAGRAM
Figure(3.1)Block Diagram of the system
A sensor unit essentially comprises of a few sensors used to identify the established parameters that demonstrate the quality of water. In our project, three sorts of the sensors had been used: pH sensor and Temperature sensor that detects the acidity of it or basicity of the water, a temperature sensor that detects the temperature of the water, turbidity sensor that detects the turbidity level of water in view of phototransistor are utilized and Dissolved Oxygen sensor that senses the quantity of dissolved oxygen. Each of the sensor utilizes a battery for their operation. The data being detected by the sensors is then changed over into electrical signal and afterward, it is passed to a microcontroller that processes it to a readable and understandable value reasonable by people.
The main microcontroller in the module is reconstructed- mable whether to work as an end device, switch or coordinator nodes. As an end device sensor node, it can just communicate with the switch or coordinator to pass the data from the sensor. The sensor node characterized as a switch is in charge of directing data from different switches or end coordinator to the facilitator or to different switches nearer to the coordinator.
It is, for the most part, used to extend the coverage distance of the monitoring system. There can be just a single coordinator for the monitoring system. It is in charge of setting the channel for the network to utilize, appointing a network to deliver to switches and end devices and keeping the routing tables for the network that are important to route data starting with one end device then onto the next in a similar network.
The proposed prototype is the best solution for water quality monitoring systems and it includes metallic grids at the ends of the cell that create a geometry where the electric filed is internal and there is no current spread out from the sensor which helps avoiding any perturbations. The circuit board allows the system conditioning signal circuit and the data board makes it possible for digital signal processing.
It is a movement based on wiring platform produce an easy to use hardware and software which has boards that are capable to read inputs like lighting a sensor and turn it into outputs like turning on an LED. It works by giving instructions to the microcontroller on the board.
Arduino boards are completely an open source which allows building them independently and achieving the particular needs. It has been used in different applications and projects like programming, robotics and designing prototypes. It is very flexible for advanced users.
Arduino offers more advantages than other microcontrollers such as:
- It is inexpensive compared to other microcontrollers.
- The software runs on Windows, Macintosh OSX and Linux systems. Other controllers are limited to Windows.
- It is very simple and clear programming environment.
- It has an open source hardware and software.
Figure(3.2)Arduino
Finally the single chip gets the data and then processes and analyzes them. After that, the data are directly sent to monitoring center by GSM network and then display in the software.
3.3 CIRCUIT DIAGRAM
Figure(3.3)Circuit diagram of the system
The circuit diagram show the circuit of each parameter and with the resistance value of it.
3.4 COMPONENT SELECTION
a comparative analysis has been conducted to select the sensors for hard ware model development. For each sensor selection, three different types of sensors are compared on the basi of economy, speed of response, accuracy, adaptation and reliability. And the best among them is selected for the umplementation. This section describes the selection of sensors for the hard ware model.
3.4.1 Selection of Temperature Sensor:
1. LM35( integrated-circuit temperature sensors)
The LM35 series are accuracy integrated-circuit temperature sensors, whose output voltage is linearly proportional to the Celsius (Centigrade) temperature. The LM35 thus has a feature over linear temperature sensors test in° Kelvin, as the user does not need to subtract a large constant voltage from its output to obtain conveniently Centigrade scaling. The LM35 does not require any external calibration or trimming to provide typically accuracies of ±1⁄4°C at room temperature and ±3⁄4°C over a full −55 to +150°C temperature range.
Features and Specification:
- Calibrated Directly in Celsius (Centigrade)
- Linear + 10-mV/°C Scale Factor
- 0.5°C Ensured Accuracy (at 25°C)
- Rated for Full −55°C to 150°C Range
- Suitable for Remote and faraway distance Applications
- Low-Cost
- Operates from 4 V to 30 V
- Less than 60-μA Current Drain
- Low Self-Heating, 0.08°C in Still Air
- Non-Linearity Only ±¼°C Typical
- Low-resistance Output, 0.1 Ω for 1-mA Load.
Figure(3.4) LM35 series
2. DS18B20( wire digital temperature sensor)
DS18B20 is classified as a wire digital temperature sensor which can reports the degrees in Celsius with 9 to 12-bit precision, from -55 to 125 (+/-0.5). Every sensing element includes a single 64-Bit Serial variety etched into it – permits and let for a large variety of sensors to be used on one data bus. It most to be considered that to let this sensor work it had to be connected to the Ardiuno board.
Features and Specification:
- Unique 1-Wire interface needs just one port pin for communication
- Each device features a distinctive 64-bit serial code hold on in AN aboard fixed storage
- Multidrop capability simplifies distributed temperature sensing applications
- Requires no external parts
- Can be powered from data line.
- Power offer vary is three.0V to 5.5V
- Measures temperatures from –55°C to +125°C (–67°F to +257°F)±0.5°C accuracy from –10°C to +85°C
- Thermometer resolution is user-selectable from nine to twelve bits
- Converts temperature to 12-bit digital word in 750ms (max).
- User-definable non volatilizable (NV) alarm settings
- Alarm search command identifies and addresses devices whose temperature is outside of programmed limits (temperature alarm condition).
- quite accurate, and easy to attach to an Arduino.
- response time of 5-30s which is quite slow but more than fast enough for a weather station.
3. PT100( Resistance Temperature Detector)
Is a temperature sensor classified under RTD (Resistance Temperature Detectors) that include a resistor that changes resistance value as its temperature changes. They have been used for many years to measure temperature in the laboratory and industrial processes, and have developed a reputation for accuracy, repeatability, and stability. pt100 are also relatively free from electrical noise and therefore well suitable for temperature measurement in industrial environments.
- Range from -100 to 250 °C (-145 to 480 °F)
- It can give an exact temperature measurement value
- Excellent long term stability and linearity
- Stainless steel well – suitable and proper for a wide a variety of applications
And for the successful choice between the three devices, which are slightly similar in terms of their advantages, we have chosen the most appropriate by making this evaluation in different grades:
Grade 5
→highest degree
Grade 4
→intermediate
Grade 3
→very good
Crade 2
→good
Grade 1
→weak
Table(3.1) Comparison of temperature Sensors
Based on the above factors we have selected DS18B20 as a temperature sensor for our operation.
3.4.2 Selection of pH Sensor
1. SEN0161(Analog pH Sensor)
It is called Analog pH Sensor SEN0161. This pH sensor is specifically designed for Arduino microcontrollers and it is simple in built. It has many features and specifications that make it a qualified to be used in our proposed online monitoring system.
It has a BNC connector and PH2.0 sensor interface, an LED which works as the Power Indicator. We can pre-programme it to get the pH value easily. Comes with plastic box and foams for better mobile storage. The SEN0161 costs around $ 29.50
Specifications of the SEN0161:
- Module Power : 5.00V
- Module Size : 43mm×32mm
- Measuring Range:0-14PH
- Measuring Temperature :0-60 ℃
- Accuracy : ± 0.1pH (25 ℃)
- Response Time : ≤ 1min
- pH Sensor with BNC Connector
- PH2.0 Interface ( 3 foot patch )
- Power Indicator LED
Figure(3.7) pH Sensor Kit SEN0161 for Arduino
2. KIT-101P( pH sensor for Ardiuno)
The KIT-101P can be used to get accurate readings of pH. Its probe made of silver chloride by Atlas Scientific. It has range from 1 to 14 and its life expectancy is more than 2.5 years. The KIT-101P costs $ 149.15
Features and Specification:
- Single junction
- pH Range: 0-14 (Na+ error at >12.3 pH)
- Operating temperature: 1°C – 99°C
- Max Pressure: 690 kPa (100PSI)
- Max Depth 60 M (197 ft)
- Cable length: 1 Meter
- Weight: 49 grams
- Speed of response: 95% in 1 second
- Isopotential point: pH 7.00 (0 mV)
- Dimensions 12mm X 150mm (1/2″ X 6″)
- BNC connector
Figure(3.8) pH sensor kit KIT-101P
3. SEN0169(sensor kit for Arduino microcontrollers)
The SEN0169 is a sensor kit for Arduino microcontrollers. It can be used to get accurate pH readings. Its expectancy life is more than 1 year, its range from 0 to 14 and it has industrial electrode. The SEN0169 costs around $ 56.95
Features and Specification:
- Module Power : 5.00V
- Module Size : 43mmx32mm(1.70″x1.26″)
- Measuring Range :0-14PH
- Measuring Temperature :0-60 ℃
- Accuracy : ± 0.1pH (25 ℃)
- Response Time : ≤ 1min
- Industry pH Electrode with BNC Connector
- PH2.0 Interface ( 3 foot patch )
- Power Indicator LED
3.4.3 selection of turbidity sensors
1. ITM-3(Relative Turbidity Monitor)
The Anderson ITM-3 combines an established optical backscatter light technology with the most recent generation of electronics to supply associate enlarged feature set and easy interface yielding an extremely adjustable optical sensing device.
Features and Specification:
- Front flush sensor.
- Turbidity measurement in the range of 2000 NTU at least.
- Independent to reflections at small diameters or electro-polished surfaces.
- No color dependency with wavelength of 860 nm.
- High reproducibility
- Switching output (switch point and hysteresis free adjustable).
2. ITM-4 (Beam Turbidity Meter)
ITM-4 meter offers preciseness mensuration of suspended solids through the utilization of infrared emission. Utilizing a 4-beam technology the ITM-4 has multiple emitters and receptors to supply the web, time period mensuration of muddiness which will yield data crucial to each method operate and products quality.
Features and Specification:
- Pollution of glass panes compensated.
- Turbidity measurement in the range of 0
- Compact device, no separate evaluation unit necessary.
- Units are switchable (NTU & EBC)
- Color independent measurement principle with wavelength 860 nm.
3. ITM-4DW (Turbidity Sensor)
The ITM-4DW meter is specially designed for the process- and drinking water applications.
Features and Specification:
- Suitable for process and drinking water applications.
- Turbidity measurement in the range of 0
- Coolant circuit monitoring.
- Can be used for wastewater monitoring.
Figure(3.12) ITM-4DW Turbidity Meter
And for the successful choice between the three devices, which are slightly similar in terms of their advantages, we have chosen the most appropriate by making this
3.5 Program developed
Development of Hardware model:-
To start with, the circuit diagram is modified for pH measurement. The selected pH sensor is interfaced with Arduino controller and pH measurement is conducted. The pH sensor is calibrated using the buffer solutions available in the chemistry lab. Two buffer solutions with pH 4.00 and 7.00 are used for the calibration. A software program is written in Arduino programming language for calibration and it is uploaded in the controller.
The pH value of the buffer solution is displayed in computer by selecting the required baud rate for data transfer. The sensor is calibrated with necessary precautions for accurate pH measurement. A comparative analysis also carried out between a standard pH meter and the proposed project. It is listed in table no.
Table (3.4) pH meter Vs Arduino pH meter
| S.No | pH meter | Arduino pH meter |
| 1. | 8 | 8.33 |
| 2 | 9 | 9.15 |
| 3 | 10 | 10.01 |
From the above table, it is clear that the proposed project has less accuracy for lower pH measurements. When the pH level is increased the accuracy of the proposed system increases.
Connection Diagram:-
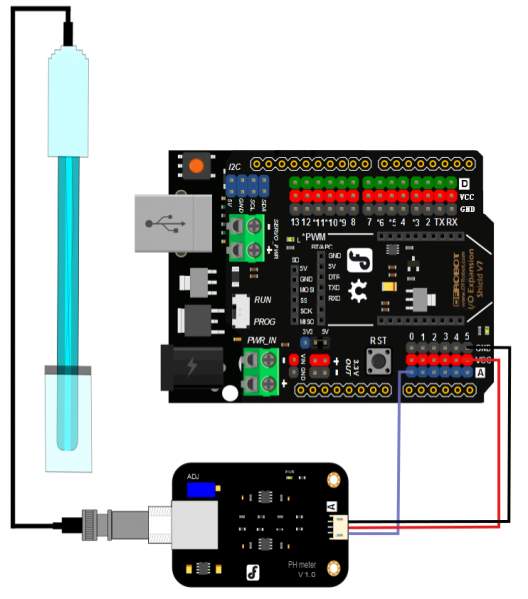
Figure (3.13) Connection Diagram
As shown in the above connection diagram, the pH sensor is connected with Arduino board. The sensor is washed with distilled water before measurement.
3.6 Hardware implementation
The software code used for calibration is as follows:
Software Code:-
/*
# This sample code is used to test the pH meter V1.0.
# Editor : YouYou
# Ver : 1.0
# Product: analog pH meter
# SKU : SEN0161
*/
#define SensorPin A0 //pH meter Analog output to Arduino Analog Input 0
#define Offset 0.00 //deviation compensate
#define LED 13
#define samplingInterval 20
#define printInterval 800
#define ArrayLenth 40 //times of collection
int pHArray[ArrayLenth]; //Store the average value of the sensor feedback
int pHArrayIndex=0;
void setup(void)
{
pinMode(LED,OUTPUT);
Serial.begin(9600);
Serial.println(“pH meter experiment!”); //Test the serial monitor
}
void loop(void)
{
static unsigned long samplingTime = millis();
static unsigned long printTime = millis();
static float pHValue,voltage;
if(millis()-samplingTime > samplingInterval)
{
pHArray[pHArrayIndex++]=analogRead(SensorPin);
if(pHArrayIndex==ArrayLenth)pHArrayIndex=0;
voltage = avergearray(pHArray, ArrayLenth)*5.0/1024;
pHValue = 3.5*voltage+Offset;
samplingTime=millis();
}
if(millis() – printTime > printInterval) //Every 800 milliseconds, print a numerical, convert the state of the LED indicator
{
Serial.print(“Voltage:”);
Serial.print(voltage,2);
Serial.print(” pH value: “);
Serial.println(pHValue,2);
digitalWrite(LED,digitalRead(LED)^1);
printTime=millis();
}
}
double avergearray(int* arr, int number){
int i;
int max,min;
double avg;
long amount=0;
if(number
Serial.println(“Error number for the array to avraging!/n”);
return 0;
}
if(number
for(i=0;i
amount+=arr[i];
}
avg = amount/number;
return avg;
}else{
if(arr[0]
min = arr[0];max=arr[1];
}
else{
min=arr[1];max=arr[0];
}
for(i=2;i
if(arr[i]
amount+=min; //arr
min=arr[i];
}else {
if(arr[i]>max){
amount+=max; //arr>max
max=arr[i];
}else{
amount+=arr[i]; //min
}
}//if
}//for
avg = (double)amount/(number-2);
}//if
return avg;
}
SUMMARY
In this chapter, the block diagram and the sensors unit are discused. Also selection of component and some different types of sensors are discused. A comparsion is conducted to select the best sensors among three suggested sensors based on economy, speed of response, accuracy, adaptation and reliability factors. The four chapter provides the information about the cost estimation of the system and the calculation.
CHAPTER 4 - COST ESTIMATION & PROCESS ECONOMICS
Cost Estimation:
In any project, it is essential to estimate the cost of your components else it is hard to designate the best possible assets! Truth be told, exact cost evaluations are the premise of a sound project management and planningزost Estimation:.
Cost estimation could be a specialized subject and a profession in its claim. the design engineer, however, must be able to build fast, rough, value estimates to come to a decision between different styles and for project analysis. Industries area unit engineered to create a profit, associate degreed an estimate of the investment needed and therefore the value of production area unit required before the profit of a project will be assessed.
Cost estimation in plant involves a combination of main, machine and resources and consequently, a combination of physical processes, engineering resources, and economic laws as well as actions and behavior of people should be taken into consideration. Thus, in cost estimation process, apart from physical and engineering variables, there often exist several subjective criteria, which need to be described qualitatively and linguistically. In addition, there are some probabilistic or random variables including labor fatigue, shortage of resources and materials, failure of machines, unavailability of facilities and so on, which cannot be accurately predicted. Using analytical and mathematical approaches, it is not possible to quantify and transform these imprecise and subjective criteria and random factors into proper input variable in the cost estimation model. Therefore, the state of uncertainty should be considered in cost estimation problem in some ways.
The following calculation shows the purchased cost for the main equipment that had been used in our project:
Table (4.1) Equipment Cost Index
| Cost Index at 2017 | Cost Index at 2013 | Equipment Name |
| 691.8 | 541.2 | Temperature and PH sensor |
| 430.9 | 374.6 | Arduino Mega board |
| 430.9 | 374.6 | GSM shield for Arduino |
| 691.8 | 541.2 | Turbidity sensor |
| 430.9 | 374.6 | Ultrasonic sensor |
1/Temperature and PH sensor:
Purchased Cost of Temperature and PH sensor = Original cost Cost index at 2017Cost index at 2013 × Expected Size previous Size0.6
=$600(
691.8541.2)(
165340)0.6
= $497.02
2/Arduino Mega board:
Purchased Cost of Arduino= Original cost Cost index at 2017Cost index at 2013 × Expected Size previous Size0.6
=$25.95(
430.9374.6) )(
154.8251)0.6
= $58.116
3/GSM shield for Arduino:
Purchased Cost of GSM shield for Arduino= Original cost Cost index at 2017Cost index at 2013 × Expected Size previous Size0.6
=$71.50(
430.9374.6) (
3.57.2)0.6
= $53.35
4/Turbidity sensor:
Purchased Cost of Turbidity Sensor= Original cost Cost index at 2017Cost index at 2013 × Expected Size previous Size0.6
=$153(
691.8541.2) (
62110)0.6
= $138.64
5/Ultrasonic sensor:
Purchased Cost of Ultrasonic sensor= Original cost Cost index at 2017Cost index at 2013 × Expected Size previous Size0.6
=$2(
430.9374.6) (
80110)0.6
= $1.9
Total Purchased Cost:
Table (4.2) Total Purchased Cost
In this part we are assuming and doing the calculation for a whole plant and not considering the project just:
Fixed Investment:
Fixed investment is the investments that are being made in the fixed assets such as buildings, machinery or any other kind of equipment that have a fixed cost.
1 - Direct Costs:
The costs that can be clarified directly, though it refers to the expenses, labor or the materials that are related to the production of a certain product and it is formula is shown below:
Direct cost = percentage × total cost of equipment
Table (4.3) Direct Cost
| Purchased equipment delivered | 100% | =(100/100)×$ 749.026 =$749.026 |
| Purchased-equipment installation | 47% | =(47/100)×$ 749.026 =$352.04 |
| Instrumentation and controls | 36% | =(36/100)×$ 749.026=$269.64 |
| Piping (installed) | 68% | =(68/100)×$ 749.026 =$509.33 |
| Electrical systems (installed) | 11% | =(11/100)×$ 749.026 =$82.39 |
| Buildings (including services) | 18% | =(18/100)×$ 749.026 =$134.82 |
| Yard improvement | 10% | =(10/100)×$ 749.026=$74.9 |
| Service facilities (installed) | 70% | =(70/100)×$ 749.026 =$524.3 |
| Total =$1947.42 | ||
2 - Indirect Costs:
The costs that cannot be identified accurately or directly, it could be the expenses of services such as advertisement, maintenance, security or supervising, cost of depreciation, insurance, power and it is formula is shown below:
Indirect cost = percentage × total cost of equipment
Table (4.4) Indirect Cost
| Engineering and supervision | 33% | =(33/100)×$ 749.026 =$247.17 |
| Construction expenses | 41% | =(41/100)×$ 749.026 =$307.10 |
| Legal expenses | 4% | =(4/100)×$ 749.026 =$29.96 |
| Contractors fee | 22% | =(22/100)×$ 749.026=$164.78 |
| Contingency | 44% | =(44/100)×$ 749.026 =$329.57 |
| Total =$1078.58 | ||
Fixed Capital Calculation:
Fixed Capital = Direct Cost + Indirect Cost
$3026 =$1947.42+$1078.58
Working capital:-
Working capital cost is the extra investment needed to start the plant up and operate it to the point when income is gain.
Working Capital = 0.89 x PEC
= 0.89 × $ 3026
= $2693.14
Total Capital Investment = Fixed capital + Working Capital
= $3026 + $2693.14
= $5719.14/year
SUMMARY
In this chapter, an economics calculation discussed including the purchase cost, direct and indirect cost. Chapter five provides the information about the general environmental impact and how Majis deals with the waste management.
Cite This Work
To export a reference to this article please select a referencing stye below:
Related Services
View all


Related Content
All TagsContent relating to: "Environmental Science"
Environmental science is an interdisciplinary field focused on the study of the physical, chemical, and biological conditions of the environment and environmental effects on organisms, and solutions to environmental issues.
Related Articles

DMCA / Removal Request
If you are the original writer of this dissertation and no longer wish to have your work published on the UKDiss.com website then please: