Weather Forecast on possibility of Rain, Water Utility Data Warehouse Architecture, and Aviation Wildlife Strikes
Info: 9893 words (40 pages) Dissertation
Published: 9th Dec 2019
Tagged: Environmental Studies
Intelligence behind Numbers – Assignment #2
Executive Summary ……..……………..…….………………………….…………… i
- Exploratory Data Driven Analysis – Will it rain tomorrow? …………..… 1
- Findings: Exploratory Data Analysis model building & cross validation 3
- Decision Tree Model – Likelihood of Rain tomorrow …………..… 8
- Weka Logistic Regression Model – Likelihood of Rain tomorrow …………..… 10
- Cross-Validation: Final Decision Tree Model and Final Logistics …………..… 12
Regression Model
- Data Warehousing, Big Data, and Contemporary Issues …………..… 16
- Developing and Designing a Data Warehouse Infrastructure …………..… 18
for a Water Utility Company
- Water Utility Industry – Main components of its data warehouse …………..… 19
architecture design
- Key security, privacy and ethical concerns – Datawarehouse & Big Data 20
- Tableau Desktop Dashboard ……..……………..…….………………………….….. 22
- Tableau View: Impact of Aircraft Wildlife Strikes over time for …………..… 22
a specific origin state.
- Flight phase by time of the day: Wildlife strikes with aircrafts 26
- Comparison: Wildlife species in order of aircraft strike frequency 28
and the chance of damage occurring
- Geo-Map View: State Flights, wildlife strikes and total monetary cost 30
- AWS Dashboard: Tableau views for sub Tasks 3.1, 3.2, 3.3 and 3.4 32
- Conclusion ……..……………..…….………………………….…………… 34
- Reference List ……..……………..…….………………………….…………… 35
- Appendix ……..……………..…….………………………….…………… 37
~o~ LIST OF FIGURES ~o~
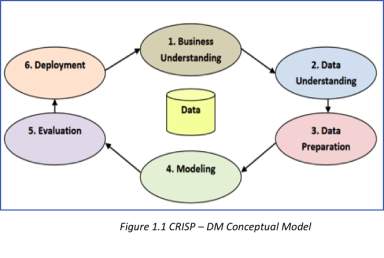
1.1: CRISP – DM Conceptual Model ……….…….…….………. 1
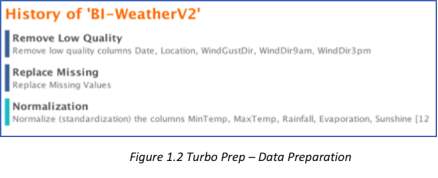
1.2: Turbo Prep – Data Preparation ……….…….…….………. 2
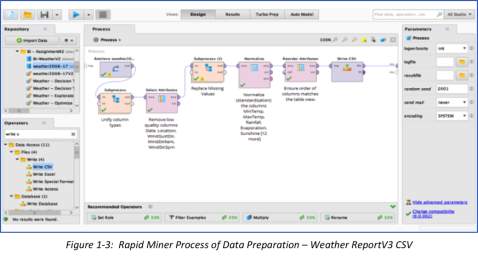
1.3: Rapid Miner Process of Data Preparation – Weather ReportV3 CSV ..………… 2
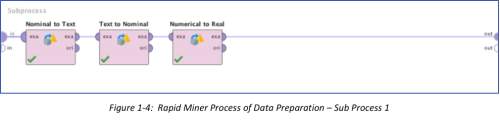
1.4: Rapid Miner Process of Data Preparation – Sub Process 1 ……….…….…….………. 2
1.5: Results of Exploratory Data Analysis for weather2008-17 Data Set ..………… 3
1.6: Weather Data – Correlation Analysis Process ……….…….…….………. 4
1.7: Correlation: Pairwise Table ……….…….…….………. 5
1.8 Logistic Regression Model ……….…….…….………. 6
1.9 Logistic Regression Performance ……….…….…….………. 7
1.10 Logistic Regression Simulator – Most Likely “YES” ……….…….…….………. 7
1.11 Scatterplot – Temp 3PM VS Temp 9AM ……….…….…….………. 7
1.12 Scatterplot – Max Temp VS Temp3PM ……….…….…….………. 7
1.13 Scatterplot – Min Temp VS Temp9AM ……….…….…….………. 7
1.14 Scatterplot – Pressure9AM VS Pressure3PM ……….…….…….………. 7
1.15 Decision Tree Graph ……….…….…….………. 8
1.16 Decision Tree: Will it rain tomorrow? ……….…….…….………. 8
1.17 Decision Tree Description ……….…….…….………. 9
1.17 Weka Process Design ……….…….…….………. 10
1.18 W-Logistic Description ……….…….…….………. 10
1.19 Weka – Performance Vector ……….…….…….………. 11
1.20 Cross Validation Process ……….…….…….………. 12
1.21 Cross Validation Sub Process and Decision Tree ……….…….…….………. 12
1.22: Cross Validation Performance Vector Graph ……….…….…….………. 12
1.23: Cross Validation Performance Vector ……….…….…….………. 12
1.24: Cross Validation Example Set ……….…….…….………. 13
1.25: AUC (optimistic): 0.851 +/- 0.004 (micro average: 0.851) ……….…….…….………. 14
1.26: AUC: 0.823 +/- 0.004 (micro average: 0.823) ……….…….…….………. 14
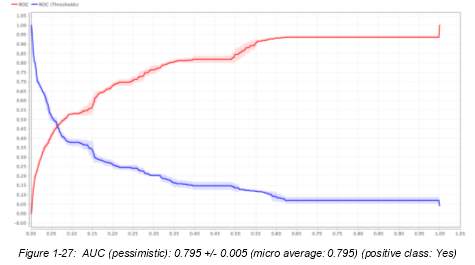
1.27: AUC (pessimistic): 0.795 +/- 0.005 (micro average: 0.795) ……….…….…….………. 14
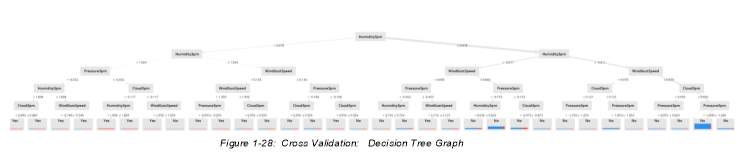
1.28 Cross Validation: Decision Tree Graph ……….…….…….………. 15
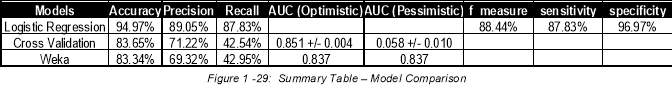
1.29: Summary Table – Model Comparison ……….…….…….………. 15
2.1: Business Intelligence Architecture ……….…….…….………. 16
2.2: Events that led to Data Warehousing Development ……….…….…….………. 17
2.3: Enterprise Systems – Diverse Databases ……….…….…….………. 17
2.4: Data Warehouse Framework and Views ……….…….…….………. 18
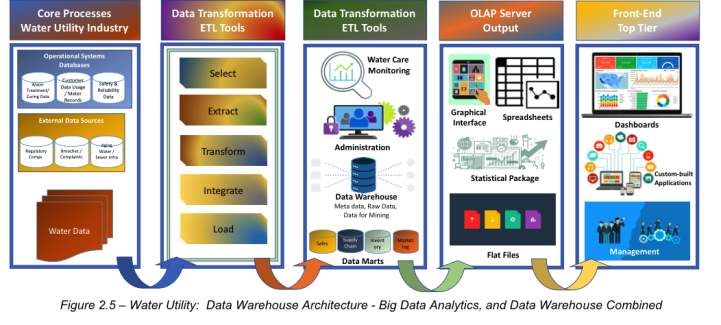
2.5: Water Utility: Data Warehouse Architecture ……….…….…….………. 18
Big Data Analytics & Data Warehouse Combined
2.6: Elastic Architecture for Data Platforms – Modern Banking ……….…….…….………. 20
3.1-1: Aircraft Wildlife Strikes Per Year ……….…….…….………. 22
3.1-2: Types of Wildlife Strikes to Aircraft – Origin State: California……….…….…….………. 24
3.1-3: Wildlife Strikes – Types of Impact and ……….…….…….………. 25
Comparison with Different States
3.2-1: Wildlife Strikes VS Flight Phase by Time of Day ……….…….…….………. 26
3.2-2: Packed Bubbles – Wildlife Strikes VS Flight Phase by Time of Day ..………… 27
3.3-1: Frequency of Aircraft Strike Per Wildlife Species ……….…….…….………. 29
3.3-2: Packed Bubbles- Wildlife Species Aircraft strikes ……….…….…….………. 29
and Associated Total Cost
3.4-1: Geo Map View of flights by origin states: Wildlife Strikes ……….…….…….………. 30
and Total Monetary Costs
3.4-5: Geo Map View of flights: Wildlife Strikes and ……….…….…….………. 31
Total Monetary Costs Over Time
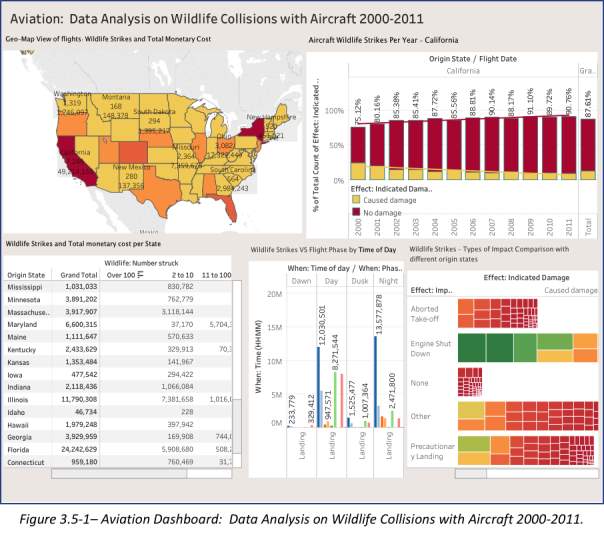
3.5-1: Aviation Dashboard: Data Analysis on Wildlife Collisions ……….…….…….………. 32
with Aircraft 2000-2011
EXECUTIVE SUMMARY
“If we have data, let’s look at data. If we have opinions, let’s go with mine”.
Jim Barksdale, former CEO of Netscape (Malakooti 2012).
Business Intelligence continues to prove that there is always a better way of doing things, and it starts from the very basic step of understanding the facts. This paper encapsulates the crucial process of knowing that the existence of data, and discernment on how to properly use it leads to an objective decision-making process, and calculated results. Through analysis of facts, we become more informed, objective, with prospects that are appropriately linked to better results. Merely understanding and appreciating the framework of Decision-Making Theories in the form of CRISP-DM methodology makes a big impact to the end product – our decisions.
As the story on this paper unfolds, decision-making process will be appreciated further with tools and technology becoming more sophisticated and capable of handling big volume of data. Rapid Miner and Tableau are just few of the modern softwares that complements data analysis. Though use of these tools are not a walk in the park, online and paper guides are available to anyone who nurtures a mind of an active thinker.
Throughout this report, the basic questions on What, When, Where, Why and How will answer the required questions on various topics such as Weather Forecast on possibility of Rain, Water Utility Data Warehouse Architecture, and Aviation Wildlife Strikes.
The ultimate learning is about how we can make best use of data and technology to help us think, choose then act – and most of the time, it will not be easy.
Ronald Coase, winner of Nobel Prize in Economics, puts it beautifully…
“Torture the data, and it will confess to anything.”
i
- Exploratory Data Driven Analysis – Will it rain tomorrow?
The concept of Data Driven decision making using frameworks and theories was discussed in detail at the first assignment. The process of Decision-making has evolved over time and has become more complex depending on how one person looks at it, but ultimately, the end goal remains the same – make better decisions.
In this second assignment, the analysis of weather CSV report will perform tasks to generate exploratory data analysis, model building and cross validation. It will utilize the decision-making framework: CRISP – DM or Cross-Industry Standard Process for Data Mining to achieve the goal of reaching a target attribute. This model involves six (6) steps: Organizational Understanding of the Business, Data Understanding as a Preparatory activity, Data Preparation, Modeling, Evaluation, and Deployment (North 2012).
 To be able to answer these questions, it is crucial that there is awareness of the Weather Forecasting Services industry trends, and the science behind it. The history of weather forecasting can be traced back from the Babylonian era, or 650 B.C., whereby weather conditions were predicted using cloud patterns. It then evolved significantly over time, with philosophers and other intellects developing theories from patterns relating to cloud and rain formation, hail, wind, thunders, lightnings and hurricanes (ManUniCast 2014).
Today, the Weather Forecasting Services industry is a more developed industry that benefits from the necessity of forecasting to the general public. Therefore, industry demand is expected to remain stable over the next couple of years, and industry practitioners are to benefit from the increased usage of smartphones and other mobile technology. In addition, industry players can also generate more revenue through expanded product/service offerings, including weather-risk management consulting and other enterprise solutions, as long as service delivery is communicated through different means like TV, internet and radio.
1
 The weather csv file includes various attributes necessary to determine the end goal, and this is to realize the possibility of raining tomorrow. Part of the review included understanding the existing literary analysis on what really influences occurrence of rain showers. Factors such as temperatures, evaporation, condensation, sunshine, humidity, among other things were thought to be leading to forecasted rain showers on certain days.
Using Rapid Miner, the determination on what factors influence the occurrence of rain will be realized. When report was imported, there were some missing attributes and inconsistencies. Data Preparation was done using the Turbo Prep View with the following actions taken to cleanse the example set:
 Subprocess 1 included 3 operators of Nominal To Text, Text to Nominal, and Numerical to Real.
 Sub Process 2 had 1 process inside which is Replace Missing. Prior to cleansing, the original example set had 138,307 examples, 0 special attribute and 24 regular attributes – with 19 out of 24 attributes contained a total of 304,523 missing entries. After data preparation, the new example set has 138,307 rows and 19 regular attributes (2 nominal and 17 numerical), with 0 missing values and 0 inconsistencies. The new CSV is renamed, saved and imported to RapidMiner for use of succeeding steps like Exploratory analysis, Model Building and Cross Validation. Post this process, the CSV was re-generated, saved and imported to RapidMiner as the new file for use with next level exploratory analysis.
2
- Findings: Exploratory Data Analysis model building & cross validation
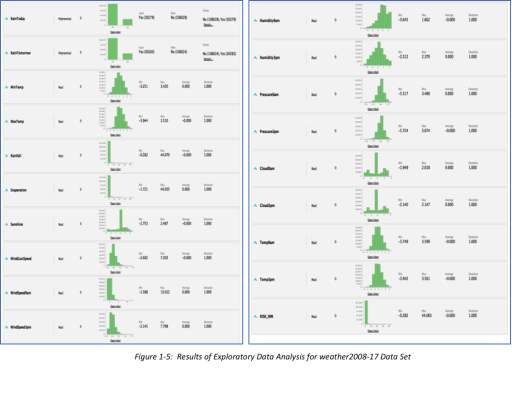
The main goal of this task is to predict the possibility of rainfall for the next day (tomorrow) using the data from today’s weather situations in the 49 locations in Australia. On a different research, part of understanding the topography and Australia’s seasons is to know that it changes every three (3) full months. Summer starts from December 1 until end of February. Autumn or fall comes next from March until May. Winter is from June to August, and Spring settles in from September until November. In addition, Autumn is the season that gets the most rain – March to May (Rivera 2018). Although it was not dictated what season these data points were, this will not be explicitly stated in this analysis, but will just focus on the end goal to determine what top 5 variables are filtered to generate a decision tree and end goal of determining if it will rain tomorrow. Using the correlation matrix operator, we have processed the attributes of the example set using the process as shown in the next figure. Figure below shows the summary of the cleansed data, with example set showing off as this:
3
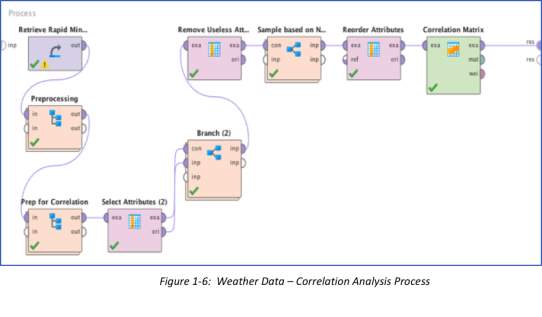
Target Label is set as “Rain Tomorrow”. Attributes selected are all “Nominal”. Nominal Columns that have too many values were removed, while the others were transformed as binary. Finally, the correlation matrix operator utilized all the attributes to finally determine which attributes are most likely to influence the occurrence of rain. The result was a smaller sample set of 50000 examples, 0 special attributes and 17 regular attributes. Random sampling was essential as the original data set is too big for processing. By doing sampling, random entries were analyzed to generate the correlation matrix results shown in the next figure.
4
Finally, the pairwise table shown below was ranked from highest to lowest correlation score in comparison to first and second attribute. The Top attributes that got the highest positive correlation scores are further explained as below:
 Max Temp or high temperature/ heat experienced at 3PM means that more water on earth turns into vapor which rises into the air (Evaporation). As temperature increases, or as heat increases, humidity and the cloud formations and rainfall also becomes apparent (Forsgard 2013).
- Low Pressure area for 9AM and 3PM (same day) means that cooler air forms water droplets which then become clouds (Condensation). Low Pressure of the earth’s surface is triggered by the rising air, while dropping air leads to higher pressure into the area. This leads the wind to circulate quickly inwards/upwards. When this happens, rising air means that clouds and precipitation form (Met Office 2017).
- Min Temp at 9AM means lower temperature in the morning, that leads to cloud formation.
- Max Temp at 9AM means hotter temperature that leads for water to evaporate quickly.
- And lastly, the temperature at 9AM and 3PM will most likely influence the next day’s weather – either it’s sunny or rainy (Met Office 2017).
5
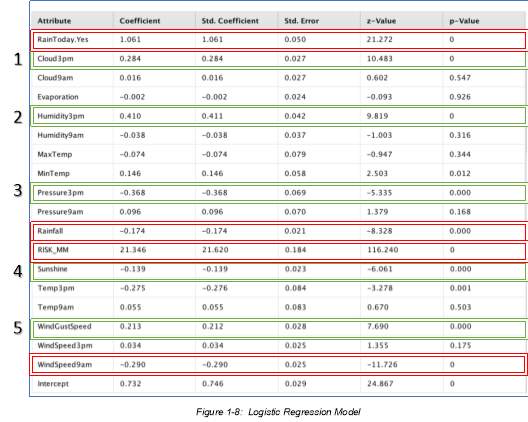 In Logistic Regression Model, probability is explained using the P-Value. It is defined as the likelihood that if the null hypothesis were true, sampling variation would produce an estimate that is further away from the hypothesized value (Petty 2011).
In simple terms, P-value explains how likely it is to get a result if the Null Hypothesis is correct. In this case, we would like to determine what variables are most likely to cause the occurrence of rain the next day. The null hypothesis then is that these variables do influence the possibility of raining tomorrow. Our alternative hypothesis, or H1 / HA, will then prove that these variables are not likely to cause rain from happening tomorrow. If the significance level of P-value 0.05 is observed, null hypothesis is to be rejected. The variables that generated a P-value of less than 0.05 are: (1) Cloud 3PM, (2) Humidity3PM, (3) Pressure3PM, (4) Sunshine, (5) WindGustSpeed.
Although these attributes also had P-value of 0, these will not be considered as part of the Top 5 as these are not very relevant: Rainfall, Risk_ MM, RainToday, Yes, and WindSpeed9AM.
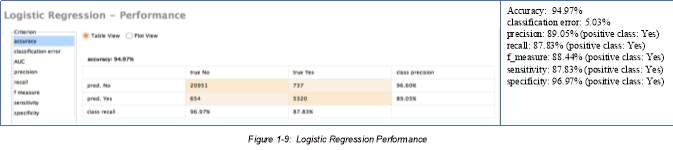
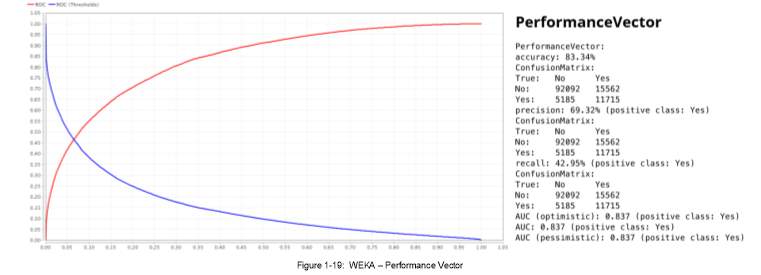
A P-value that is less than 0.05 means that we have an effect, therefore, the variables shown in the table such as: (1) Cloud 3PM, (2) Humidity3PM, (3) Pressure3PM, (4) Sunshine, (5) WindGustSpeed, do have influence to the possibility of rain occurrence the next day. The Logistic Regression Performance are reflected below for additional analysis. It showcases the model’s accuracy of prediction, and other performance criteria depending on the problem’s classification types.
6
Considering Correlation and Logistic Regression Analysis, the variables or attributes that are apparent and linked to “Rain Tomorrow” predictability are almost parallel. To understand visually the relationship of the 5 variables identified using Correlation Matrix, the scatter plot diagrams below were also generated to see if these variables will have impact to target variable of “Rain Tomorrow”. The image results below, and the numerical correlation values shown previously, are consistently showing that the first attribute and the second attribute, when plotted against each other is leading towards the same positive direction.
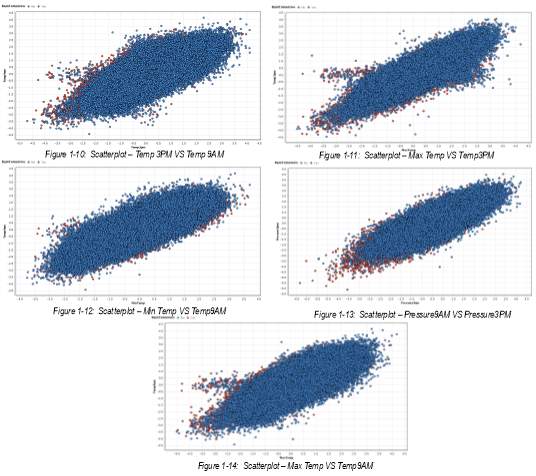
7
- Decision Tree Model – Likelihood of Rain tomorrow
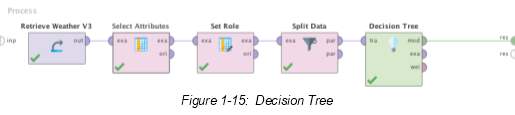
 Decision tree operator, which is used for classification and regression, is utilized in the process shown below. As described in the RapidMiner documentation, a decision tree is a collection of joints with the intent to generate a decision on values that are affiliated to a class or a numerical target value.
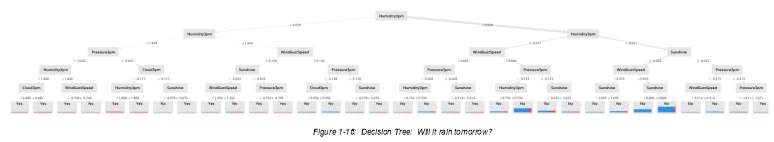
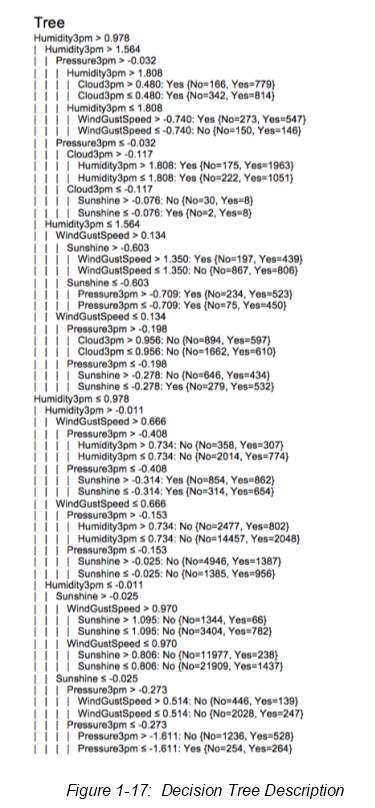
Defined further at the RapidMiner Documentation webpage, “Gini_Index is the measure of inequality between the distributions of label characteristics. Splitting on a chosen Attribute results in a reduction in the average gini index of the resulting subsets” (RapidMiner 2018). In order to optimize and reduce potential error, the criterion gini_index with maximal depth of 6 is utilized. The attributes selected were the 5 chosen variables specified previously: Cloud 3PM, Humidity3PM, Pressure3PM, Sunshine, and WindGustSpeed. This process resulted to the decision tree diagram and description is also laid out respectively.
8
9
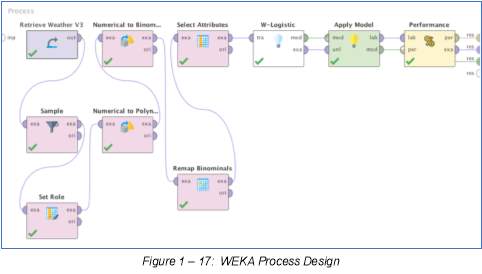
- Weka Logistic Regression Model – Likelihood of Rain tomorrow
In running this process design, the same cleaned file for Weather CSV is retrieved for use in this section. Same role or target is chosen – “Rain tomorrow”, and same attributes were set and fed into the W-Logistic operator.
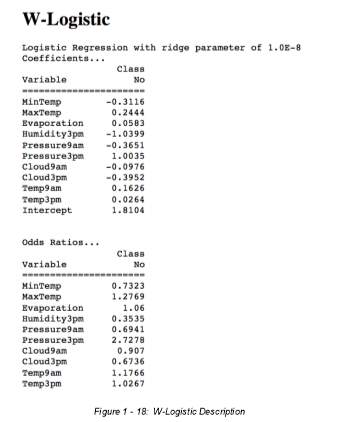
This W-Logistic Result shows the Odd Ratios resulting from the selected attributes. Defined by Magdalena Szumillas, “odds ratio (OR) is a measure of association between an exposure and an outcome. The OR represents the odds that an outcome will occur given a particular exposure, compared to the odds of the outcome occurring in the absence of that exposure. Odds ratios are most commonly used in case-control studies, however they can also be used in cross-sectional and cohort study designs as well (with some modifications and/or assumptions)”. (Szumilas 2010).
These Odds ratios aids in comparing the probabilities of the occurrence of the outcome of interest, which is to “rain tomorrow, with respect to the variable of interest such as the 5 attributes selected. To determine the exposure and its potential outcome, the following score/ranges are used as a reference:
10
- =1 does not affect odds of outcome
- >1 is associated with higher odds of outcome
- <1 is associated with lower odds of outcome
 In this case, based on the Odds Ratios shown on figure 1-18, Variables with >1results or those that have higher odds of outcome are: Evaporation, Max Temperature, Pressure3PM, Temp9AM and Temp3PM. Odd ratios with less than <1 means lower chances of outcome: MinTemp, Pressure9AM, Cloud9AM, and Cloud3PM.
11
- Cross-Validation: Final Decision Tree Model and Final Logistics Regression Model
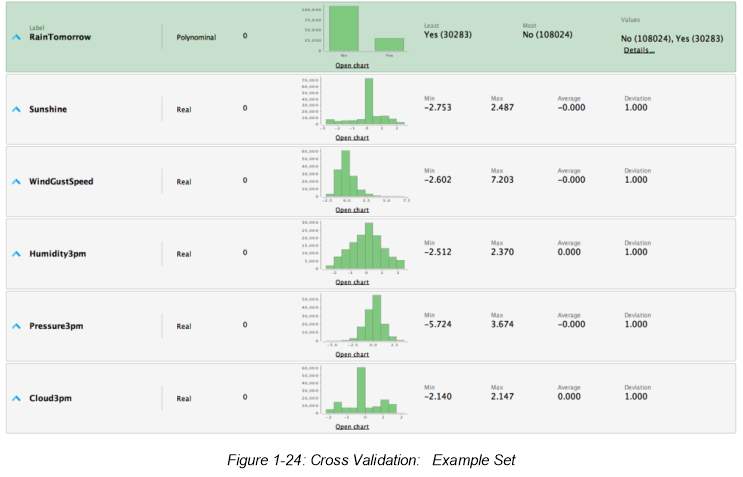
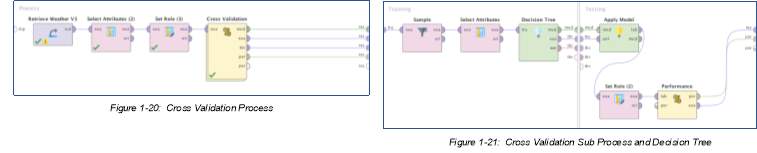 Cross-validation is the operator used for estimating the statistical performance of a learning model. The process design retrieved the cleansed Weather data set and the top 5 attributes or variables were selected, with the target role as “Rain Tomorrow”. This nested operator has 2 subprocesses – Training and Testing. The result from this process design shows new terms and numerical equivalents, such as Accuracy (AC), Precision (P), recall/ TP rate, AUC Optimistic and Pessimistic.
Accuracy (AC) is defined as the fraction of the total number of predictions that were exact or accurate. Formula is defined as:
accuracy = (Correct predictions)/(Number of Examples) = (TP + TN) / (TP + FP + FN + TN)
Precision (P), is the percentage of the predicted positive cases that were correct. Further, the precision formula is set as:
precision = (True positive predictions)/(All positive predictions) = TP / (TP + FP)
The recall or true positive rate (TP) is the share of positive cases that were accurately categorized (RapidMiner GmbH 2018).
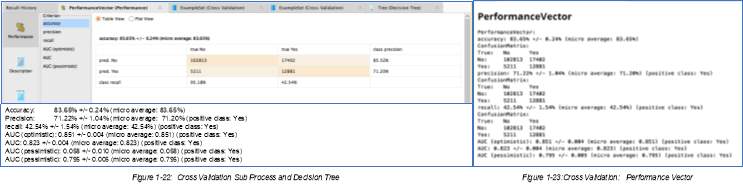 With the process operators used as shown above, the following results were generated:
12
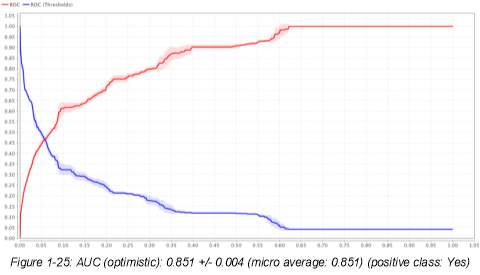
 Example set based on these process design resulted to the below analysis:
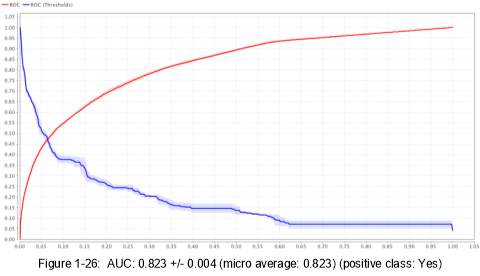
The confusion matrix, also known as the possibility table or the error matrix, denotes the predicted value on the columns, while its rows depict the actual category or classes (Kaiyun Sun1 et al. 2018) . The ROC graphs shows the false positive rate on the X axis and the true positive rate on the Y axis, and is another method to examine the performance of classifiers.
13
14
With the models sampled previously to test the accuracy, precision and other factors considered, the table below shows the summary of all scores.
15
- Data Warehousing, Big Data, and Contemporary Issues
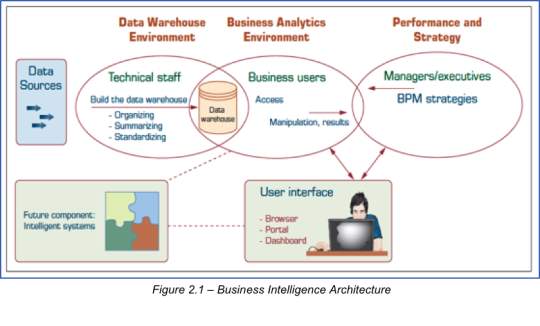 Data Warehouse and Big Data are all part of a bigger picture with the end goal of making a sound business decision. Figure 2.1 explains visually how Data Warehouse, Big Data, Business Analytics and Performance & Strategies link together that eventually leads to users being able to grasp a complex set of numbers which is eventually drawn into a story.
Data warehouse (DW), first coined by Bill Inmom in 1990s, is a pool of data that is produced, cleansed, stored and accessed in a standardized format from a physical repository with the goal to understand business, make sound analysis of information, and make a guided and informed decision based on facts. It is structured in a way that exploration is done based on subject, with other functionalities described as integrated, time-variant, and non-volatile. Additionally, it is styled as web-based, relational, client/server architecture, real-time and includes meta-data. All of these functions link data-warehouse to the end goal of backing-up management’s decision-making activities. Simply put – Data Warehouse is the data’s repository, and Data Warehousing is the end to end process that builds capability to turn business insights into business decisions (Sharda, Delen & Turban 2017). Historically, it can be traced back as early as 1900s, yet its definitive development progressed further in the 1970s and still continues to grow with technology and automation.
16
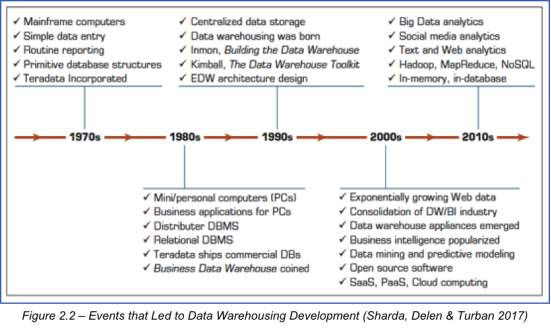 On one hand, Big Data is coined by Doug Laney back in early 2000s in reference to three (3) concepts: Volume, Velocity and Variety. This is all about to large data sets, collected by public or private institutions, that are somehow complex and too big to be processed via traditional means, hence. The intelligence from this large data sets can be further realized if calculations, and more sophisticated tools are utilized to uncover the hidden realities and patterns from these numbers (Grable & Lyons 2018).
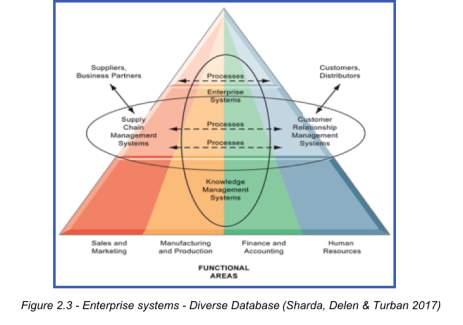 This figure shows how different functions make use of big data and data warehousing in order to link different processes together and generate a result that is meaningful to many – internal and external customers.
However, it’s not all glory and roses for Big Data, Data Warehousing and Analytics. It’s not a perfect world, hence, there are known modern-day issues faced by organizations and people that have a hand on these infrastructures.
17
- Developing and Designing a Data Warehouse Infrastructure for a Water Utility Company
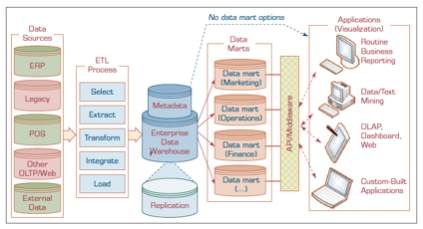 This section aims to display a sample developed high-level data warehouse architecture design for a large state-owned water utility company. The goal is to show how it integrates the structured organizational data from collection, cleansing and processing, storing, and finally – presenting. An architecture of data warehouse shows three main types of data warehouses: data marts (DMs), operational data stores (ODS), and enterprise data warehouses (EDW). These are also depicted as Top Tier Front End Tools, Middle Tier OLAP Server, and Bottom Tier Data Warehouse Server. In attempting to understand the system intricacies that exist in the Water Utility Industry, we refer to the default data warehouse architecture shown at Figure 2.4 to see how a new design can be tailor-fitted for the former’s use. As a supplementary feed, Figure 2.5 is shown to benchmark a sample data warehouse architecture that the Banking industry has.
Figure 2.4 – Data Warehouse Framework and Views (Sharda, Delen & Turban 2017)
18
- Water Utility Industry – Main components of its data warehouse architecture design
The Water Utility Industry with its focus on collection, treatment, and distribution is known to be the oldest and the most indispensable utility service for all its users. However, it remains to be an opportunity for most of us, to understand water system operations, critical functions and metrics, investment opportunities, and the unexploited richness of knowledge that go with this public utility service (Harper 1967). This is a collective opportunity for all – and not just for the government, but also the private sectors, and public consumers, to discover vast operational areas that can still be tapped for further innovation, and development. Shown in Figure 2.5 is a suggested Data Warehouse Architecture for a Water Utility Industry. The goal of this structure is to focus on merging technology with products and services that integrates data from various sources – internal and external, that provides capability to store, retrieve or access, and process data, which in the end – enable the organization to derive data assets to influence sound business decisions (Sharda, Delen & Turban 2017).
The main components of this Data Warehouse would start with its (1) Data Sources – Internal and External. The sources will be water data from different water treatment facilities, customer data usages, safety and reliability data, and other external sources related to government regulatory facts, water related complaints or feedback, and other data about aging water or sewer facts. As these data gets strained further, the (2) ETL tools employed by the water facility company must undergo the rigorous processes of Selecting, Extracting, Transforming, Integrating and Loading data into a more readable and understandable view. The output, which is metadata, or data within a data, will be fed into the enterprise data warehouse, or a comprehensive database that supports data from legacy systems into a revitalized summarized view. These metadata remains pure and accessible with use of webtools that makes searching and indexing still possible. (3) The next component is the OLAP Server Output or Online Analytical Processing Tool which is all about answering ad hoc questions as quickly as possible, through queries involving relational data, data mining and reports creation. Lastly, the (4) Front-end tools enables the provision of an understandable user-interface reports or applications that supports management through data-driven decision making strategies (Sharda, Delen & Turban 2017).
19
- Key security, privacy and ethical concerns – Datawarehouse & Big Data
As perfect as it may seem, Data Warehouse Projects do have issues encompassing security, privacy and ethics. Big volume of data come with opportunities and problems that are not always easy to address. In the past, researchers’ issue was mostly ingrained with the analytical and statistical techniques acceptable and available to analyze data. Although statistical methodologies were developed over time that led big data analytics to where it is today, volume and variety of data collection continues to become more complex and some traditional data analysis methods will no longer be sufficient to manage the incessant information influx. Aside from these challenges, ethical issues on topics relating to data-collection, data privacy and security, data accessibility, and data manipulation will continue to haunt stakeholders. These are all valid concerns and effective security policies must start from the top and communicated stringently down to all individuals within the organization.
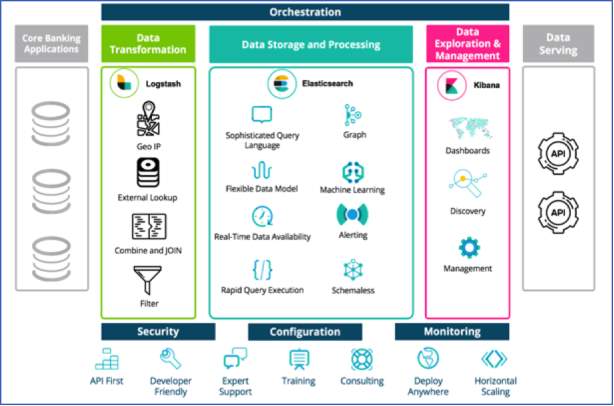 Shown in Figure 2.6 is an example of a Data Warehouse architecture for Modern Banking Process and Analytics. The same framework was used which was described in previous sub tasks of this report.
Figure 2.6 – Elastic Architecture for Data Platforms – Modern Banking (Gool 2017)
20
Specific to banking and finance, the complexity of collected information continued to accelerate.
The ability to analyze big volume of data seems to fulfil the main goal of making a sound decision is not always realized. There is a lot of confusion even when the data is already available and accessible. Colin Rickard once said, “A data warehouse is not in itself a business benefit, and that’s not a reason for the bank to build one. They should build one to better understand risks, to improve the business processes, key performance indicators and margins – unless it does one or more of those things is no reason.” In a nutshell, data quality is a big issue as data continues to change and that means that risks is pictured differently depending on when facts are generated (Bannister 2009). The cost of implementing Data Warehouse projects is also a big consideration. Anat Bird has commented about Data Warehouses being a critical tool that can be used to stretch further an organization’s competitive advantage, however, these infrastructures are not exempted from failing to fulfil post-installation returns on investments (Bird 1999). In addition to these aforementioned issues, the concerns about security and access restriction are never going away – yet. Internal control review process is not fully established for some financial institutions, which creates more problem relative to data privacy and integrity. Other issues faced by this infrastructure are un-met end-user requirements, and latency issues (Sharda, Delen & Turban 2017).
21
- Tableau Desktop Dashboard
As the Tableau Specialist of the Data Analytics Company – New Zealand Based, this section aims to help our client – an Aircraft Manufacturer, US Aviation LLC, to study and analyze the cases of Aircraft Wildlife Strikes (AWS), its causes and impact from period covering 2000 to 2011.
- Tableau View: Impact of Aircraft Wildlife Strikes over time for a specific origin state.
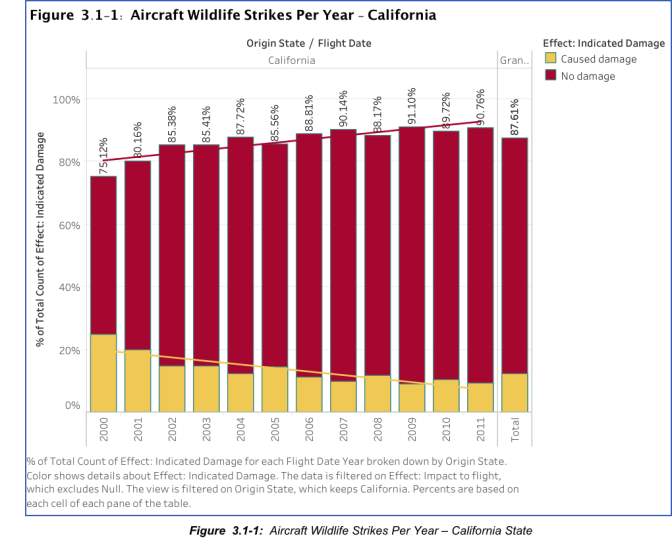 The first task aims to provide a view on the impact of wildlife strikes with aircraft for a specific origin State – California. The data set contains multiple null values that requires handling in Tableau as not doing so can generate invalid results. One option to handle null values is quick filtering, or the use of function [Null is 0]. In this example, the function [Null is 0] is utilized, and additional filter for the state titled “N/A” is also done to avoid any inconsistencies or irrelevant data. The objective of the graph below is to show the impact of Aircraft Wildlife Strikes overtime for California.
22
In analyzing data from California state, below is a quick summary of findings:
- Total recorded flights for all origin states with Impact to flight: 99,404 counts
- Total counts of flights with Indicated damage – California: 7803 counts
- Breakdown: No damage – 7115, and Caused Damage – 688.
- California, the second biggest contributor accounts for 8% of the total of all origin states. The first one – “N/A” is filtered and not included as it does not represent a specific state, thus, including it in the data set will not provide relevance to the analysis.
- Year 2000 has the highest count/percentage of instances when wildlife strike caused damage to the aircraft.
- From 2000 to 2011, percentage of wildlife strikes that “caused damage” (blue) has decreased noticeably, considering that AWS incidents continued to rise year on year.
- In summary, on a 12-year view, not all wildlife strikes caused damage to the aircraft. It can be assumed from the graph that 87.61% of the wildlife strikes did not cause physical damage or dents, and only 12.39% accounts for the recorded physical damage to the aircraft.
- Based on trend line, as number of flights originating from California increases from 2000 to 2011, the incidents of wildlife strikes that caused damage to the aircraft decreased. Meaning, physical damage to aircraft caused by wildlife strikes has lessened over time despite of increase flights.
23
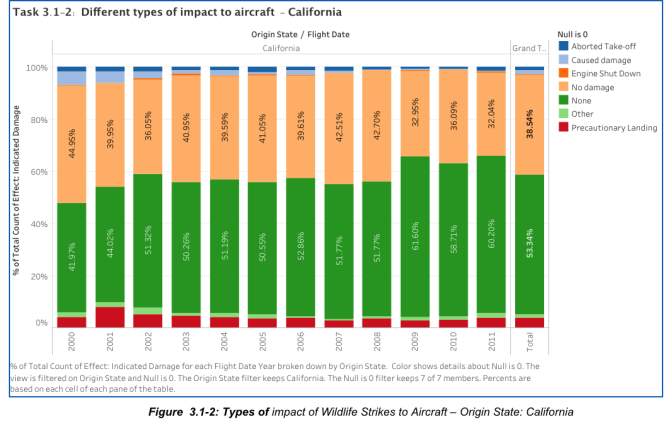 Going further on the analysis, the different types of impact to Aircraft on flights originating from State of California are shown in the next figure.
The previous figure shows the following summary of analysis:
- From 2000 to 2011, Wildlife strike incidents that have “NO” impact to flights is about 89% occurrence.
- Order of Wildlife strike impact based on occurrence:
- None – 89%, Pre-cautionary landing – 7%, Others – 2.24%, Aborted Take-off – 2.13%, and Engine Shutdown – 0.34%.
- For “Precautionary Landing”, which accounts for 7% from the total cases, such calls are made when it is wiser to discontinue the flight rather than proceed knowing that it can create significant stress to all crew and passengers. (Haroon 2013).
- Engine Shutdown, the impact type that has the lowest occurrence, accounts for situations that emergency and precautionary landings are called out.
24
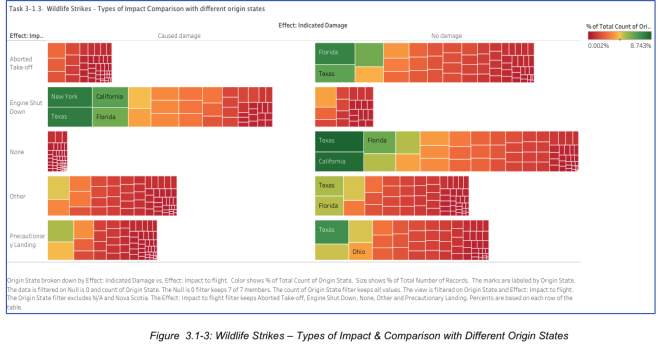

In the figure above, “N/A” is already filtered, and function [Null is 0] is utilized to exclude inconsistent values.
- From 2000 to 2011, a total of 99,404 incidents of wildlife strikes with indicated damage were either tagged as “No Damage” or “Caused Damage”. The types of Impact to flight were “Aborted Take-off, Engine Shutdown, None, Other and Precautionary Landings”.
- With wildlife strikes that caused damage to the aircraft, the most common effect to flight is Engine Shut down. And although this strike does not do much with physically damaging the aircraft, the impact to flights are much worst as the aircraft’s engine leads to a total failure, which would cause flight delays or cancellation, and other emergency landing calls as deemed necessary. This impact is consistent with the top 4 states: New York, California, Texas and Florida.
25
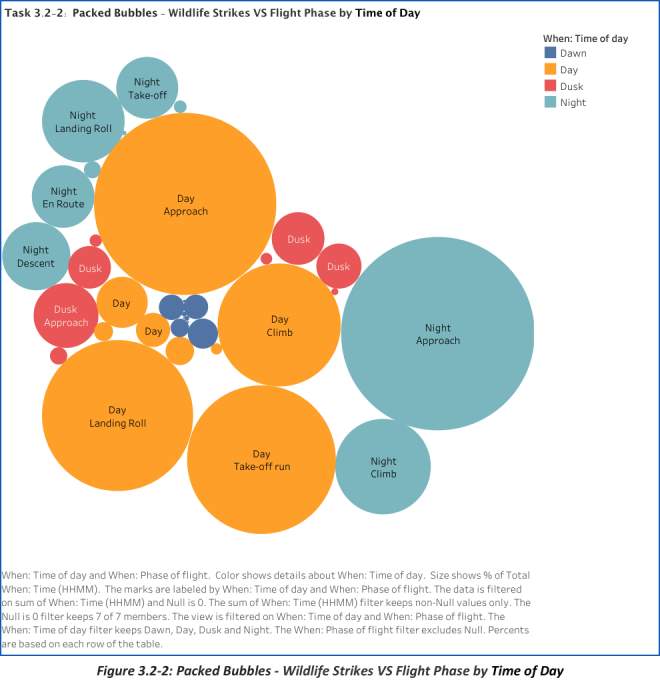
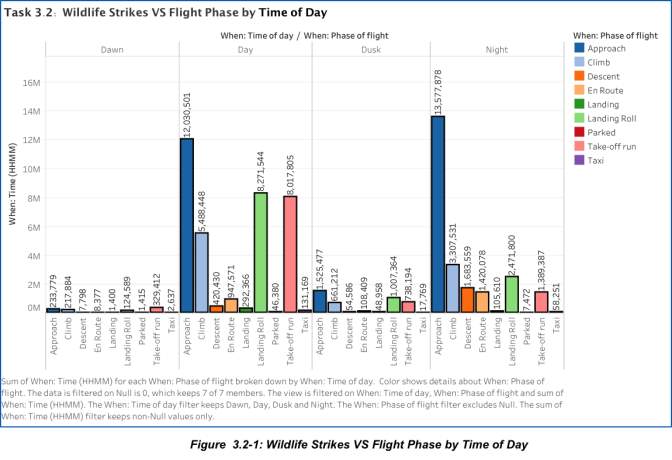 In this task, the end goal is be able to provide a view as to when these wildlife strikes are most likely to happen in relation to the flight phase and the at what time of the day. Similarly, the null values are filtered using the function [Null is 0], and other unknown inconsistencies are excluded from the graphical representation below.


In this data set, it is determined that wildlife strikes against aircrafts are more likely to occur at Night during the plane’s “Approach” or what is often referred to as “Last Leg”. This flight phase is defined as the period when an aircraft descends below 5,000 feet AGL under the control of an able flight crew, with the intention to approach the landing runway / threshold. Based on feedback and actual experiences by aircraft personnel, Approach and Landing is the riskiest phase of flight as accident is very prone to happen at this stage (Skybrary 2017).
26
2
5
1
3
4
Even during the day, “Approach” is still considered the phase of flight that has the highest risk. Consequently, aside from “Night ; Approach” the time of the day that have the highest count of incidents involving wildlife strikes happens mostly during the Day – Approach, Landing Roll, Take-off run, and Climb.
27
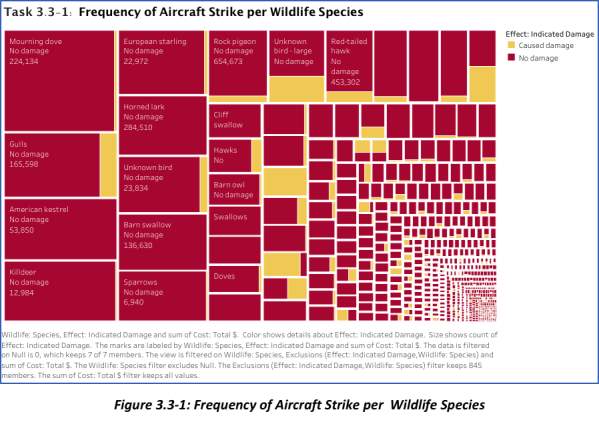
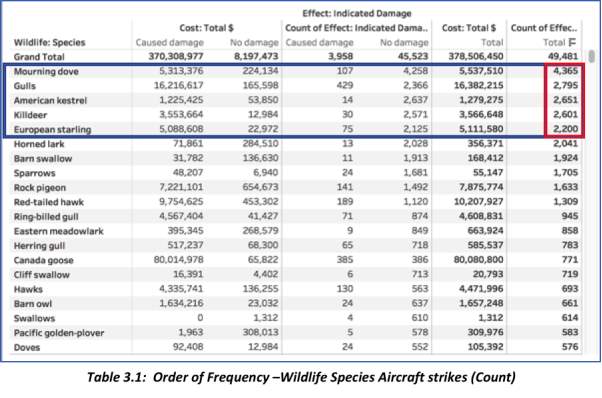
- This section of the report requires a view of the wildlife species ordered based on frequency of aircraft strikes, likelihood of damage, and cost impact when a collision does materializes. In preparing this Tableau view, there are values that were excluded, such as those that do not have a specific category – example: “Unknown bird – small, medium, large, and Unknown mammal ”. All species that are marked as “unknown” are omitted. Function [Null is 0] is actuated with the same intent to remove inconsistencies. Tree Map is chosen so it can better represent the seriousness or magnitude of strike frequency for the particular wildlife species. The size reflects the count of effect: Indicated Damage. The marks are labeled with the name of the species and the total cost incurred for the respective aircraft strike.
- Wildlife Species in Order of Aircraft Strike Frequency & Chance of Damage Occurring:
- After excluding null, N/A, and other inconsistent values, the Top 5 wildlife species that displays the highest frequency of aircraft strikes are ranked in the following order:
- Mourning Dove – 4,365 damages (107 with damage; 4,258 no damage)
- Gulls – 2,795 damages (429 with damage; 2,366 without damage)
- American Kestrel – 2,651 total damages (14 with damage; 2,637 without damage)
- Killdeer – 2,601 damages (30 with damage, 2,571 without damage)
- European starling – 2,200 damages (75 with damage; 2,125 without damage)
- After excluding null, N/A, and other inconsistent values, the Top 5 wildlife species that displays the highest frequency of aircraft strikes are ranked in the following order:
These species are the ones that are always involved in aircraft smacks.
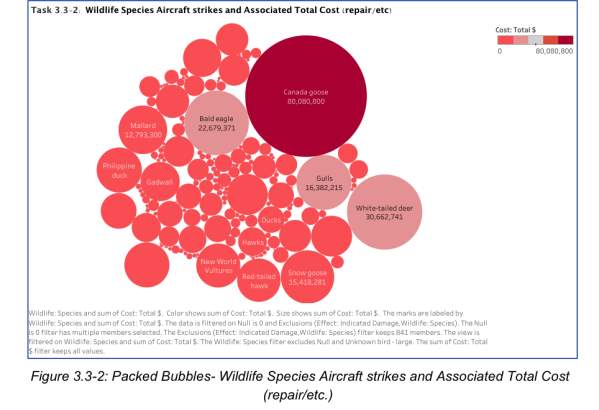
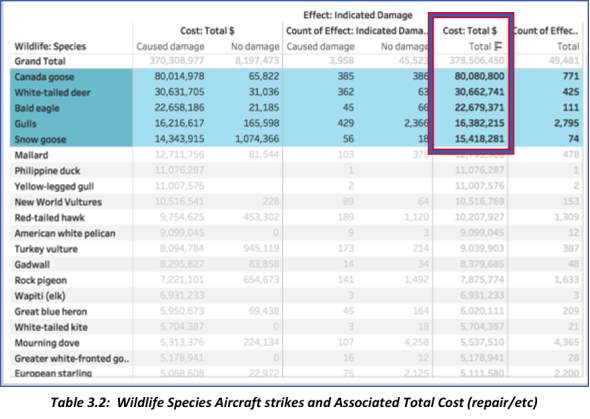
- Wildlife Species that have the highest impact on Total Cost referring to damage due to aircraft strike:
- Canada Goose ($80,080,800)
- White-tailed deer ($30,662,741)
- Bald Eagle ($22,679,371)
- Gulls ($16,382,215)
- Snow Goose ($15,418,281)
Although these wildlife species do not rank highest in terms of incident counts, one instance of aircraft strike proves to have a high effect in terms of costs – repair, etc.
28
29
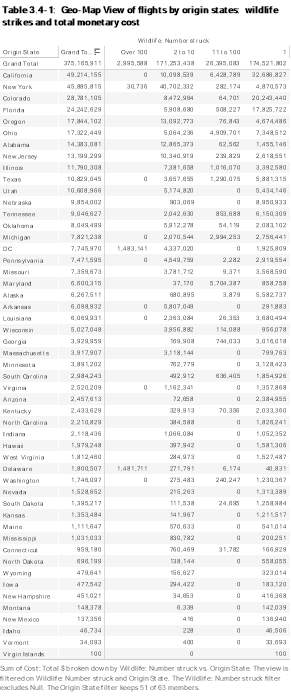
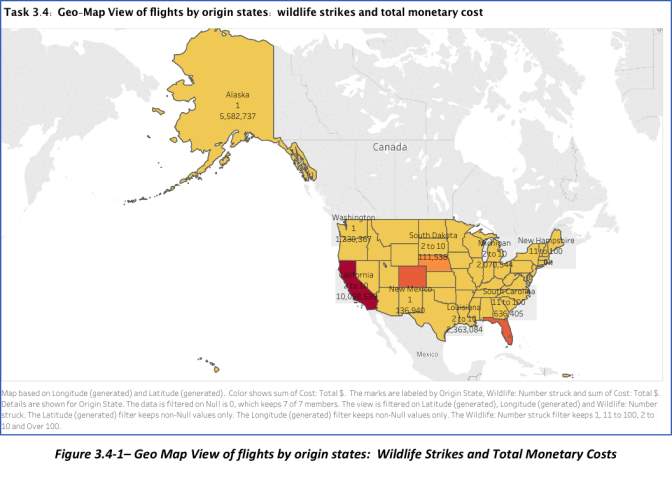 In creating this GeoMap view, the dimensions used were: (1) Origin State, (2) Wildlife: Number struck, and Measure used was Cost: Total$. There were 10 unknown values identified when the origin states were first plotted. These values, origin states based in Canada, were filtered/omitted so the only states shown are those that are from the U.S. Map. 51 out of 63 origin states selected – Longitude and Latitude placed on Columns and Rows respectively. “Null” values were also excluded using the function [Null is 0]. N/A values on Origin States is also removed.
30
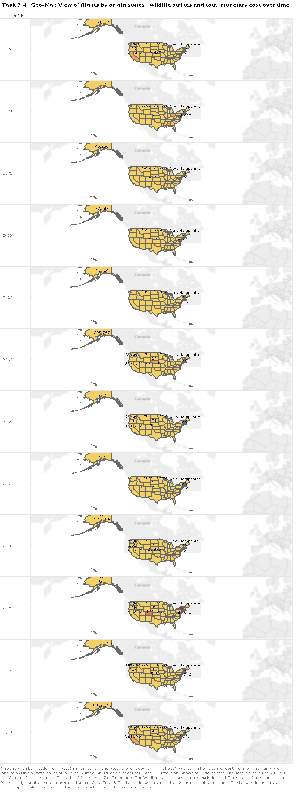 The values plotted were flights by origin states displaying the number of wildlife strikes and total monetary cost for each origin state for different periods of time.
Summary of the findings are shown below:
- The state that has the highest total cost associated with wildlife strike damages is California. In terms of incident count, there was one collision that amounted to a repair cost of $32,686,827, which was 8.7% of the total amount of repair cost with all the other states combined.
- Top 5 states with the highest total amount of cost associated with wildlife collision are: California, New York, Colorado, Florida and Oregon.
- 2009 was the year with the highest total cost for repairs associated with AWS, followed by 2001, 2011, 2005 and 2001.
- The highest amount of Total Cost for Wildlife Strike repair with all states compared was in 2009 – New York State ($38,500,958).
- The state with only 1 recorded wildlife strike incident, and consequently, the one with the lowest total cost for repair is Virgin Island. The first and last incident was recorded in 2011.
- With regards to Wildlife incident counts, the amount of repair varies and is not totally dependent on the number of incidents recorded. Meaning, there are strikes that are just too expensive for repair. With all states considered, flights that have 1 recorded strike accounts for 46.5% of the Total Cost. The bin for 2-10 counts makes up for 45.6%, while 11-100 bin is 7% and some strikes that go over 100 is just 0.8%.
31
 Dashboards provide a unique and powerful means to present information. This was first developed in the 1980s with its original name of “Executive Information Systems” (EIS). Historically, the ultimate goal is to display key financial measures in a very simple format that is Executives can easily understand with its straightforward, and clear-cut design. This eventually leads to the “Less is More”.
As technology continues to advance, dashboards benefits more users with information that becomes easier to “collect, correct, integrate, store and access” (Few 2006). Richard Brath and Michael Peters simply recommended that effective design is a crucial thing for Dashboard. That in itself will communicate the most important information to users and any queries can be easily accessed when data is visually prepared (Brath & Peters 2004).
32
The next figure shows the Aviation Dashboard which is designed to display a high-level information of all the necessary data that aims to answer the basic questions – What, When, Where, Why and How – in relation to the history of Aviation Wildlife Strikes in the United States.
- What are the U.S. states that have records of wildlife strikes and what are the total costs involved (repair, re-structuring, realignment, etc)?
- When are these wildlife collisions most likely to occur?
- At what time of day and at what phase of the aircraft’s flight?
- Where are these wildlife strikes frequently happening?
- What kind of damages do these wildlife collisions have to the aircraft and flight plan?
- What kind of physical damages do these strikes do to the aircraft and how much are the necessary expense for correction and prevention?
33
- Conclusion
This section of the report is a brief summary of insights gained from performing all required actions to complete Tasks 1 to 3. Overall, this endeavor proved to be difficult and thought-provoking. To dissect the course objective, through this paper, applied knowledge of multiple topics that make up Business Intelligence was concurred. The tasks started off with simple and basic review of what Data Driven-Decision making is all about. With the understanding of framework, it created a stable and structured process on how to understand data and how it links to the end goal of making better decisions especially for managers.
Second, Task2 was able to encapsulate the importance of knowing the functions and benefits of Data Warehouse Design, data mining procedures, and data visualization through graphical designs picturing statistical methodologies and summaries for simple and straightforward consumption of data.
The last task successfully addressed the need to understand organizational problems and how to better manage resolutions through research and torture of data.
In a nutshell, this report was able to abridge the need to value data, utilize tools that provide an improved way of looking at facts, and generating quality options to do better ways of making decisions.
34
- Reference List
Bannister, D 2009, ‘Data, captured’, Banking Technology, pp. 26–27.
Bird, A 1999, ‘Dazzled by Data, Banks Getting Lost in Their Warehouses’, American Banker, vol. 164, no. 155, p. 5.
Brath, R & Peters, M 2004, ‘Dashboard Design: Why Design is Important’, , p. 4.
Few, S 2006, Information Dashboard Design – The Effective Visual Communication of Data, accessed from <https://www.thali.ch/files/Shop/Documents/018161_Chapter_1_Clarifying_The_Vision.pdf>.
Forsgard, J 2013, ‘Higher temperatures affect intensive rain showers’, SMHI, p. 1.
Gool, LV 2017, ‘PSD2: Modern Banking API Architectures with the Elastic Stack’, Elastic Blog, accessed October 14, 2018, from <https://www.elastic.co/blog/psd2-architectures-with-the-elastic-stack>.
Grable, JE & Lyons, AC 2018, ‘An Introduction to Big Data’, Journal of Financial Service Professionals, vol. 72, no. 5, pp. 17–20.
Haroon, K 2013, ‘www.TheAirlinePilots.com :: View topic – Precautionary Landing, Emergency Landing and Ditching’, The Airline Pilots Forum and Resource, accessed October 7, 2018, from <https://www.theairlinepilots.com/forum/viewtopic.php?t=1175>.
Harper, AD 1967, ‘Investing in the Water Utility Industry’, Financial Analysts Journal, vol. 23, no. 2, p. 35.
Kaiyun Sun1, Zhiquan Feng1, ise_fengzq@ujn. edu. c., Changsheng Ai1, Yingjun Li1, Jun Wei1, Xiaohui Yang1, Xiaopei Guo1, Hong Liu2, Yanbin Han1, 2 & Yongguo Zhao3 2018, ‘An Intelligent Discovery and Error Correction Algorithm for Misunderstanding Gesture based on Probabilistic Statistics Model’, International Journal of Performability Engineering, vol. 14, no. 1, pp. 89–100.
Malakooti, B, behnam malakooti@caseed 2012, ‘Decision making process: typology, intelligence, and optimization’, Journal of Intelligent Manufacturing, vol. 23, no. 3, pp. 733–746.
ManUniCast 2014, ‘History of Weather Forecasting – TimeMapper – Make Timelines and TimeMaps fast! – from the Open Knowledge Foundation Labs’, accessed October 9, 2018, from <http://timemapper.okfnlabs.org/manunicast/history-of-weather-forecasting#0>.
Met Office 2017, How does atmospheric pressure affect weather?, Crown Copyright 2018, accessed from <https://www.youtube.com/watch?v=4ozwCtUuU_s>.
North, DM 2012, Data Mining for the Masses, Creative Commons Attribution 3.0 License.
35
Petty, N 2011, Understanding the p-value – Statistics Help, Creative Maths includes Statistics Learning Centre, accessed from <https://www.youtube.com/watch?v=eyknGvncKLw>.
RapidMiner, S 2018, ‘Decision Tree – RapidMiner Documentation’, RapidMiner Documentation, accessed September 30, 2018, from <https://docs.rapidminer.com/latest/studio/operators/modeling/predictive/trees/parallel_decision_tree.html>.
RapidMiner GmbH 2018, ‘Cross Validation – RapidMiner Documentation’, accessed October 2, 2018, from <https://docs.rapidminer.com/latest/studio/operators/validation/cross_validation.html>.
Rivera, L 2018, ‘What You Need to Know About the Seasons in Australia’, TripSavvy, accessed September 23, 2018, from <https://www.tripsavvy.com/australian-seasons-1462601>.
Sharda, R, Delen, D & Turban, E 2017, Business Intelligence, Analytics, and Data Science – A Managerial Perspective 4th Edition., Pearson Education Limited KAO Two KAO Park Harlow CM17 9NA United Kingdom, accessed from <www.pearsonglobaleditions.com>.
Skybrary 2017, ‘Approach and Landing Accidents (ALA) – SKYbrary Aviation Safety’, accessed October 10, 2018, from <https://www.skybrary.aero/index.php/Approach_and_Landing_Accidents_(ALA)>.
Szumilas, M 2010, ‘Explaining Odds Ratios’, Journal of the Canadian Academy of Child and Adolescent Psychiatry, vol. 19, no. 3, pp. 227–229.
36
 Appendices
37
38
- End –
39
Cite This Work
To export a reference to this article please select a referencing stye below:
Related Services
View all


Related Content
All TagsContent relating to: "Environmental Studies"
Environmental studies is a broad field of study that combines scientific principles, economics, humanities and social science in the study of human interactions with the environment with the aim of addressing complex environmental issues.
Related Articles

DMCA / Removal Request
If you are the original writer of this dissertation and no longer wish to have your work published on the UKDiss.com website then please: