Level Transmitter Project on Waste Water Tanks
Info: 10042 words (40 pages) Dissertation
Published: 16th Dec 2019
Tagged: Environmental StudiesTechnology
Capstone Project

Contents
3.6 Expected Return on Investment
4.4 Risk, Mitigation and Constraints
4.5a Building a Winning Project Team
Table of Figures
Figure 1: The structure of a lean production system/6 Steps of Kaizen
Figure 2: Typical bubbler-type level transmitter
Figure 7: Current Process Flow Diagram for Level Calibration
Figure 8: Future Process Flow Diagram for Level Calibration
Figure 9: Project Definition Contributions
Table 2: Time Study – existing
Table 3: Time Study – proposed
Figure 14: Force-field analysis
Figure 15: Parallel Communication Tracks
Figure 16: Project Control Cycle
Figure 17: Installed Ultra-Sonic level transmitter
Figure 18: Calibration Costs over time
Appendix Table A1: Risk category clarification
Appendix Figure 1: Transmitter location P&ID’s
2 Introduction
This project was carried out in Astellas pharmaceuticals in Damastown (Dublin) this year.
Like all modern companies, Astellas are always looking for savings and this has been driven across all departments, Astellas are a Japanese company and have embraced the Lean Production culture, this is not only promoted to the Astellas staff, but also to the contracting staff on site. To that end, there is time given in a weekly Continuous Improvement (Kaizen) meeting to offer up any potential waste reduction projects and also to engage with the various stakeholders.
“Lean production means doing more work with fewer resources.” (Groover, 2014, p.480)
This is the aim for Astellas globally, in order to keep costs as low as possible and remain competitive in the pharmaceutical industry. There are a number of Kaizen projects approved every year that are proposed from all people and departments on site. These are all good examples of worker involvement which is a vital component of the Lean Production system as seen below in Figure 1.

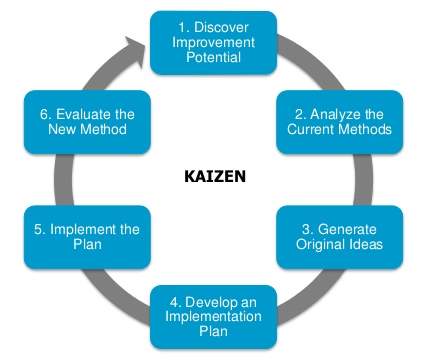
Figure 1: The structure of a lean production system/6 Steps of Kaizen
This project was first proposed at one of the Kaizen meetings and from then it progressed using the six steps of Kaizen as shown in this report.
3 Feasibility Study
3.1 Proposal
Astellas pharmaceuticals manufacture active pharmaceutical ingredients (API), to do this requires a large use of water. This water is stored in eleven tanks outside the production buildings and in the environmental holding area prior to being pumped into the larger treatment tanks.
These storage tanks have their levels monitored by level transmitters that give both a local indication and an indication on the screen in the control room. These level readings are important to keep accurate as they also control pumps that keep the tanks at the required levels and ultimately ensure the correct amount of water ends up in the treatment tank. This is vital to ensure the organic matter in the treatment tank cleans the waste water to the required level to allow it to be sent to the drainage system. To maintain this accuracy the level transmitters require calibration.
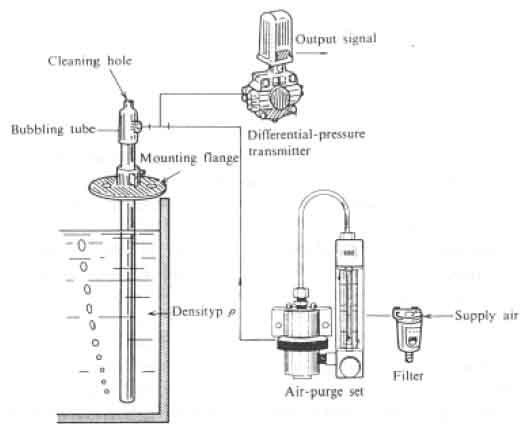
Figure 2: Typical bubbler-type level transmitter
The current level transmitters are a bubbler-type level transmitter (BTLT) which is an older technology that operates by measuring the back pressure created by a head of liquid in a stand-pipe. This system has a lot of parts and is a large system fed by compressed air that can be seen in figure 2, above. The measuring system requires a lot of maintenance and has a lot of parts to it, it is also cumbersome and time consuming to calibrate. The parts in the measuring and transmitting enclosure can be seen below in figure 3.
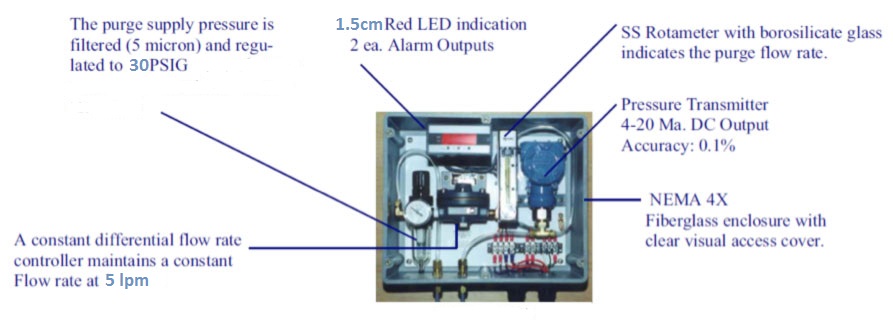
Due to this large number of different parts, there is greater potential for things that can go wrong and a large number of spare parts required to be kept as inventory.
This has led to a number of emergency work orders (or breakdowns) associated with these level transmitters which can be seen further on page 12. Due to theses breakdowns, it was deemed necessary to come up with a solution to reduce or remove the problem. A method study was carried out using the primary (Who, What, When, Where, How) and secondary questions (Who else, What else, When else, Where else, How else) and principles of motion economy; eliminate, combine and reduce, as discussed by Groover (2014).
It was decided to replace one of the existing level transmitters (for relatively small cost) to a different type of level measurement instrument with the aim to reduce or remove the breakdowns. This was found by examining the secondary questions of ‘What else’ and ‘How else’ combined with principles of motion economy by eliminating tasks and reducing movement (as can be seen in the process flow chart on page 13).
Snyder, Adams and Szuhaj (2012) clearly identify that “The viability of new technologies, combined with other factors, creates long-term options with the potential to set companies apart”.
When replacing older type instruments, it is better to look for a new technology that is unlikely to become obsolete anytime soon. This is to ensure availability of spare parts for the foreseeable future. The new type selected was an ultrasonic level transmitter, this is an emerging technology that has no moving parts and requires no air supply.
After installation, it was noted that the new type of transmitter was much quicker to calibrate and also required far less calibrations (less drift). Following on from this it was determined that it was worth spending the time to do a feasibility study on replacing the ten remaining level transmitters.
This also ties into the Plan-Do-Check-Act continuous improvement cycle;
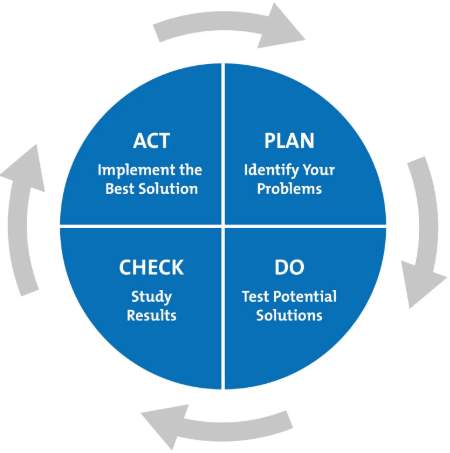
Having identified the problem (Plan) and tested potential solutions (Do), the next steps are to check and study the results and then act upon them.
The analysis of the current state against the proposed future state involves a work study, “work study is the systematic examination of the methods of carrying on activities so as to improve the effective use of resources and to set up standards of performance for the activities being carried out” (Kanawaty, 1992, p.9).
A time study was carried out on the existing and new method of calibration to determine the potential opportunities for savings (these can be seen on pages 18/19). This is the level of information and detail required to bring to the Kaizen meetings to aid in decision making for all the stakeholders.
The potential advantages of this project are savings in labour (less maintenance time per instrument), energy (no air supply requirement) and less risk to production (breakdowns).
It is proposed that this project is to be carried out in one week (40 hours) during a shutdown period – this will ensure that there is availability of the required labour and access to the site instrumentation.
3.2 Scope
As can be seen in figure 5, below, on the Gantt chart there is a list of deliverables and the schedule for them. From this is can be seen that this project will take one week (40 hours) to complete using two employees (60 hours total, distributed as shown). These works will take place during a shutdown period during which no manufacturing takes place. This is an ideal time to replace these instruments as they can all be isolated at the same time without any implications to productivity.
There is a two week lead time for the new instruments, as a precaution these will be ordered 4 weeks in advance and (as per agreement) stored in the local suppliers (Insteco) premises until three days before (Friday 25th May) the scheduled start date of Monday 28th May.
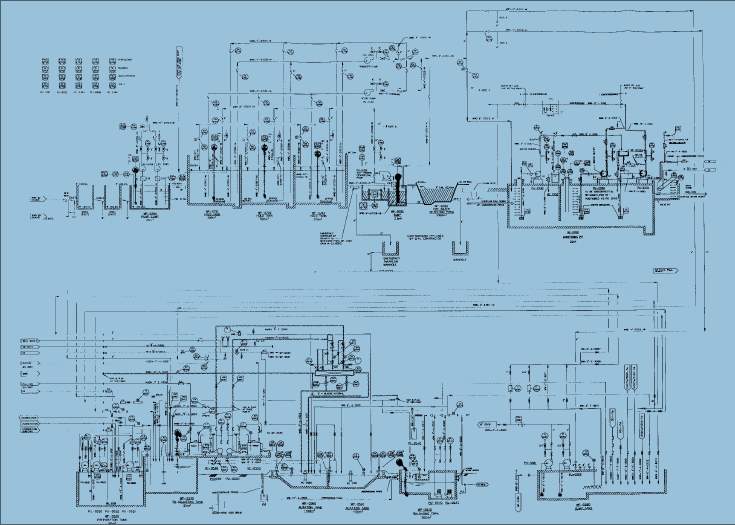
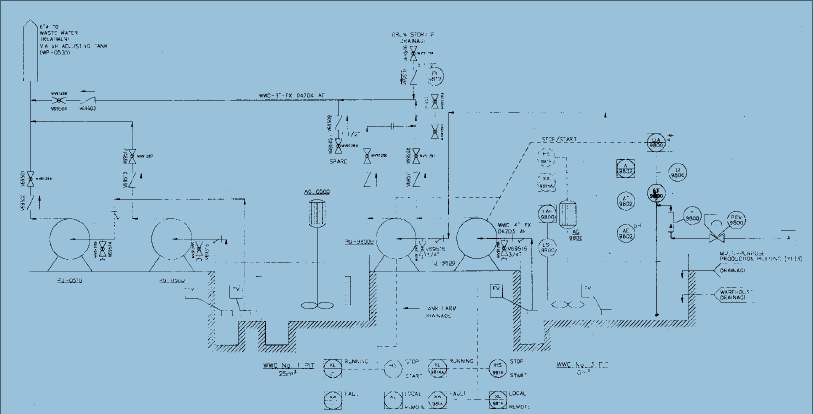
Only the following transmitters are to be replaced; LT0791, LT0792, LT0793, LT0794, LT0795, LT0500, LT0515, LT0530, LT0570, LT9800 (as can be seen on P&ID’s, Appendix Figure 1, page 39).
The removal of the 316 stainless steel from site will be carried out by the scrappage company at a later date and incurs no extra costs once removed and stored. Also the supplier will collect the pressure transmitters from stores at a later date at no extra cost. Further information on both of these recycled items can be seen on pages 14 and 15.
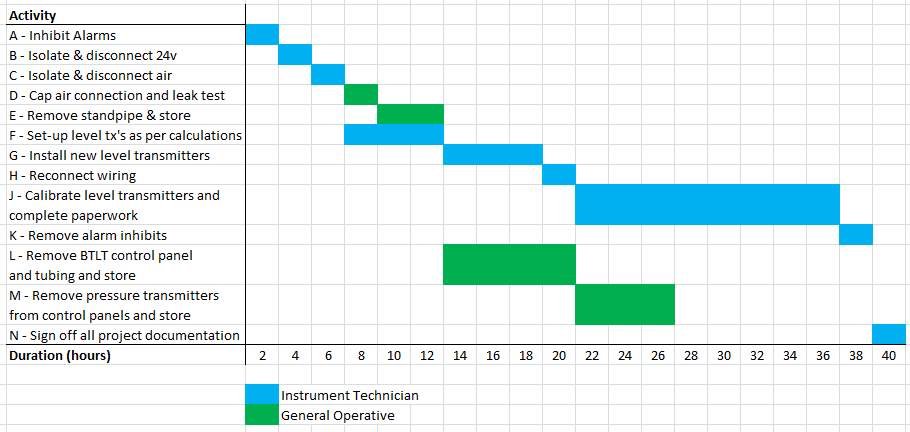
As can be seen from the network diagram (figure 5) below there are three different paths, two of which (in red) are critical;
A, B, C, F, G, H, J, K, N. Critical Path.
A, B, C, D, E, G, H, J, K, N. Critical Path.
A, B, C, D, E, L, M, N. Non-Critical Path.
From this it can be seen that there is a level of time flexibility (slack) on tasks L and M that can be taken advantage of if required.

Further details of the project, including the stakeholders, planning and milestones can be seen on pages 17 and 25.
A risk assessment has been carried out showing the risks to the workers/project, and the associated mitigation to reduce or remove those risks, this is shown on page 22.
3.3 Current State
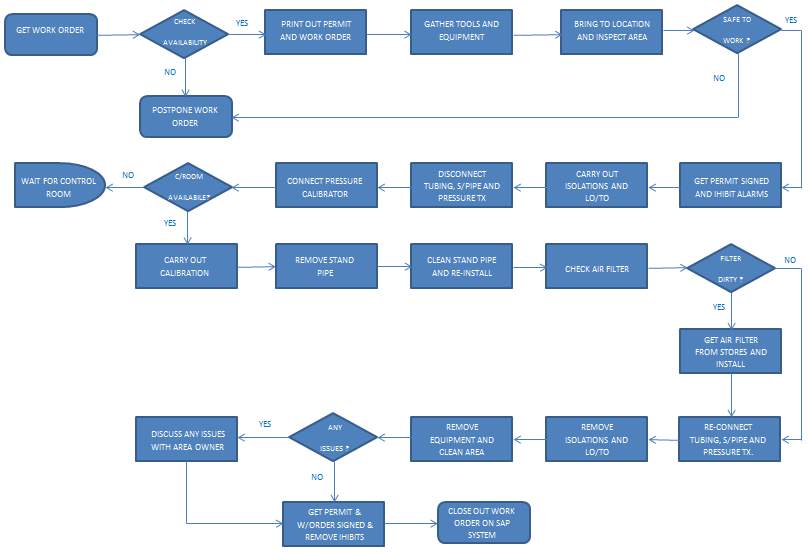
Figure 7: Current Process Flow Diagram for Level Calibration
3.3a Technical
Calibration of these BTLT’s is a time consuming activity. The system has a lot of parts that can, and do, fail. The calibration is carried out four times a year due to previous trending which showed a drift in the calibration over time, this led to the original 26 weekly calibration (when first installed) being reduced to 12 weekly. The current process flow for level calibration can be seen above (figure 7).
Good quality compressed air is required with no particles or moisture, hence the replacing of the filter in the control panel once a year, (or more if required). Also the continued issues with blockages and restrictions in the standpipes led to an additional 8 weekly maintenance task to clear the lines being added. Even this has not stopped breakdowns of these instruments and coupled with the fact that these instruments do not operate when the air compressor is down (for either maintenance or breakdown) they are becoming increasingly troublesome.
3.3b Financial
As it stands the current BTLT’s take 99.80 minutes or 1.66 hours, at standard performance, to calibrate (as can be seen on the time study, page 18). This is carried out every 12 weeks, this adds up to 6.64 hours annually per unit so for 10 BTLT’s it is 66.4 hours. Added to that there is an 8 weekly PM carried out to purge and clean the line, this takes 0.62 hours (obtained via time study) and is done 6.5 times per year per BTLT or 65 times for the 10 BTLT’s which equates to a further 40.3 hours.
Given that the labour cost for an instrumentation technician is €55.75 per hour, this adds up to; (66.4 + 40.3) x 55.75 = €5948.53
Added to that are the average labour costs for breakdowns involving these BTLT’s, the average hours annually associated to all ten of these breaking down is 62 hours (taken from SAP). The cost for these hours adds up to 62 x 55.75 = €3456.50
This adds up to a total labour cost of €9405.03 (5948.53 + 3456.50) to calibrate and maintain these instruments.
The average annual total costs, for spare parts, for the ten existing systems are €92.40 (taken from SAP) and the calculated annual cost for the compressed air is €673.85 (as can be seen on page 20).
When all of these costs are added together the total annual cost for these existing instruments and associated systems is; 9405.03 + 92.40 + 673.85 = €10171.28
3.4 Proposed Future State
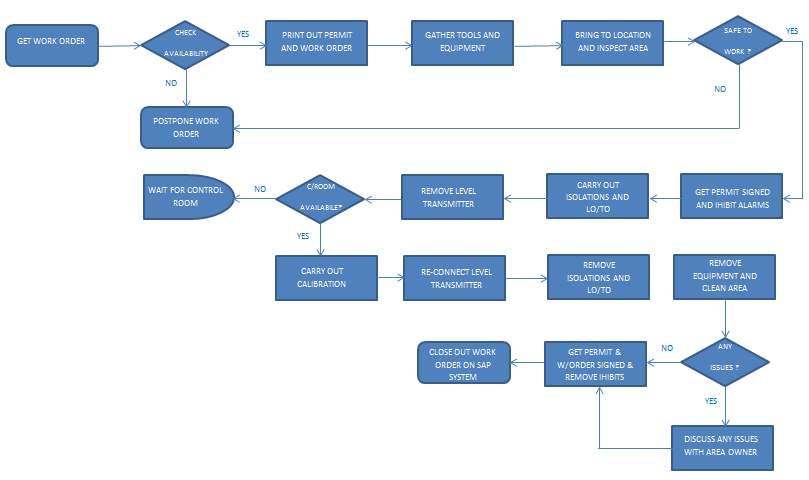
Figure 8: Future Process Flow Diagram for Level Calibration
3.4a Technical
The proposed ultrasonic level transmitters have no moving parts (that can fail) and no external requirements (air) outside of the instrument itself. There is no requirement for external contractors to install these instruments as the technical skills required are already on site. The existing galvanic isolation barriers and wiring can be used to connect to this type of transmitter and they can be connected mechanically to the existing gland without any modification. The proposed instrument has a quick release (1/4 turn) connection and there is only a requirement for a calibrated measuring tape to calibrate the transmitter as opposed to all the required equipment for the BTLT.
There may be an issue in getting the environmental operators to trust the new technology as they are used to the existing type that has been in place for over 20 years.
To try to overcome these initial reactions it is important to engage with the workers involved, “If the people affected by the changes are not convinced by the solution, there are many ways in which they can contribute to its failure.” (Zandin, 2001. p. 26)
This potential issue is further discussed on page 26.
3.4b Financial
Having determined the best method, via a method study (and applying to the SOP), for carrying out the calibration of the proposed ultra-sonic level transmitters – it was measured to take 48.23 minutes, at standard performance (as can be seen from the time study, page 19). The calibration is carried out every 52 weeks.
This adds up to 0.804 hours annually per unit so for 10 BTLT’s it is 8.04 hours. There are no further preventative maintenance requirements.
Given that the labour cost for an instrumentation technician is €55.75 per hour, this adds up to;
8.04 x 55.75 = €448.23
Cost of spare parts = €0
Cost of compressed air = €0
Cost of instruments = €809 per unit, €8090 total (809 x 10).
Discounts = – €809 (10%less bulk discount), – €1000 (less part payment for recycled PT’s). €1809 total discount.
Total cost of instruments = €6281
Labour costs for project can be seen in figure 8, below (see Gantt chart on page 10 for further details).
| Trade | Cost per hour € | Number of hours | Total € |
| Instrument Tech. | 55.75 | 40 | 2230 |
| General Op. | 31.20 | 20 | 624 |
| Combined Total € | |||
| 2854 |
Total cost to install new transmitters = 6281 + 2854 = €9135
Given that there is a large amount of (316) stainless steel in the current BTLT systems, it would be of benefit to scrap it all to redeem some of the costs. Given the scrap value of €1.24 per kg, the sale of scrap 316 stainless steel gives a saving of = (147kg x 1.24) = €182.28
When taken from the previous cost the total cost to install the new transmitters is;
€9135 – €182.28 = €8952.72
3.5 Potential Savings
The labour savings on calibration time, the fact that there is no preventative maintenance required to clean stand pipe inlet, less breakdowns/call-outs (no operators required to monitor).
No requirement for compressed air – energy saving.
Discount on purchase as it’s a bulk purchase (10%).
Part payment for the new transmitters with 10 of the existing PT’s.
Scrapping of 316SS.
Labour savings = €10171.28 – 448.23 = €9723.05
Total savings due to cost of compressed air and spare parts = 92.40 + 673.85 = €766.25
Total savings; 9723.05 + 766.25 = 10489.30
3.6 Expected Return on Investment
The total cost of this project is €8952.72
The total calculated savings per year is €10489.30
The return on investment is; 10489.3 – 8952.72/8952.72 = 0.1716 or 17.16%.
The payback period is; 8952.72/10489.30 = 0.85 years or just over 10 months.
3.7 Recommendation
The recommendation is to approve this project. Upon reading this proposal the Engineering Manager and Production Manger deemed the project worthy for the investment and signed off on the approval. This was sent to the Finance department who allocated the required funds to the project form the yearly Engineering project budget.
”Capital investment decisions are those decisions that involve current outlays in return for a stream of benefits in future years. It is true to say that all of the firm’s expenditures are made in expectation of realizing future benefits. The distinguishing feature between short-term decisions and long-term capital investment (long-term) is time. Generally, we can classify short-term decisions as those that involve a relatively short time horizon, say one year, from the commitment of funds to the receipt of the benefits” (Drury, 2008, p.291).
From this we can say that this is a viable short-term decision.
4 Project Definition
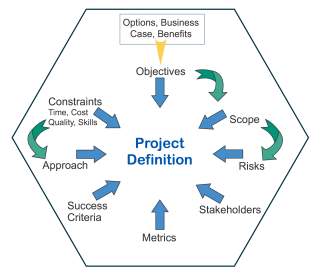
Figure 9: Project Definition Contributions
As can be seen from figure 9 (above) there are a number of different components that contribute to the Project definition. Project definition is also the first step in the DMAIC six-sigma programme which is part of the company culture in Astellas.
Having discussed the objectives and scope components in the feasibility study, this section will touch on these but mainly focus on the other contributing aspects of the project.
4.1 Stakeholders
Campbell (2011, p. 58) defines stakeholders as “someone who has a vested interest in the success of a project.” The stakeholders identified for this project, and their involvement, are as follows;
- Sponsor – Engineering Manager (provides authority to proceed and signs off on financial approval/project completion)
- Core Project team – Instrumentation Technician, General Operative, Control Room Operator (CRO). Providing the skills and expertise to perform the work.
- Customer – Astellas Ireland (Provide finance, review milestones/deliverables and ultimately accept project after completion).
- Functional Managers – Quality Manager (review of project documentation, change control paperwork), Maintenance Manager (Labour), Environmental Manager (Area Owner).
- Vendors – Insteco Ireland (Instrumentation supplier), O’Reilly Recycling Ltd (scrap metal).
This project was discussed in the Kaizen meeting in the weeks leading up to the start date of 28th May to ensure that all the stakeholders involved had a clear and defined understanding of their roles and also to maintain a line of communication to agree the schedule, milestones and to manage expectations.
4.2 Project Goals
The four goals of any project are performance, cost, time and scope (PCTS).
- Performance – The installation and operation of the level transmitters should be of best practice and to a standard acceptable to all stakeholders.
- Cost – Keep the project within budget, as shown in the feasibility study.
- Time – The project should remain on schedule and be completed on time (by Friday 25th May at 5pm).
- Scope – The scope of the project should be as defined in the feasibility study, with no ‘scope creep’. This is linked to the budget as any extra hours of labour will mean additional costs.
4.3 Costs
The project costs have largely been dealt with in the feasibility study but how the input to the existing costs was calculated will be shown here.
4.3a Labour costs
To establish the time value for the current labour cost of calibration outlined on page 12, a time study was carried out which can be seen in Table 2, below.
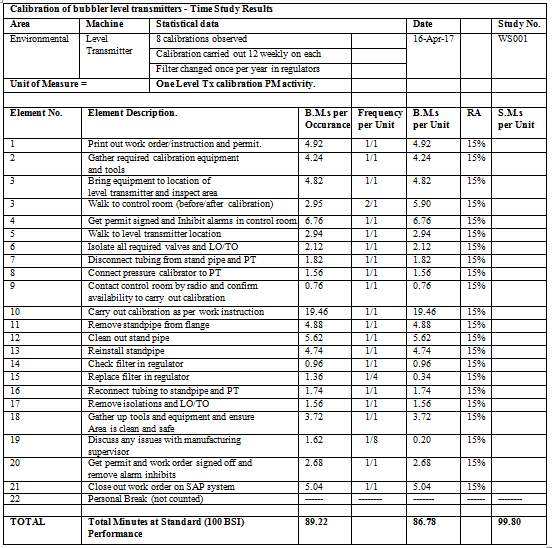
Table 2: Time Study – existing
To establish the time value for the proposed labour cost of calibration outlined on page 14, a time study was carried out which can be seen in Table 3, below.
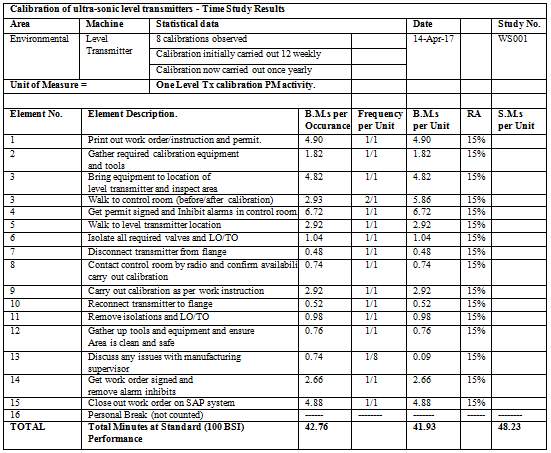
Table 3: Time Study – proposed
A time study was also carried out for the 8 weekly preventative maintenance task (not shown) to obtain the yearly labour time.
The breakdown labour data was taken from SAP system as there is no standard task performed during a breakdown.
4.3a Other costs
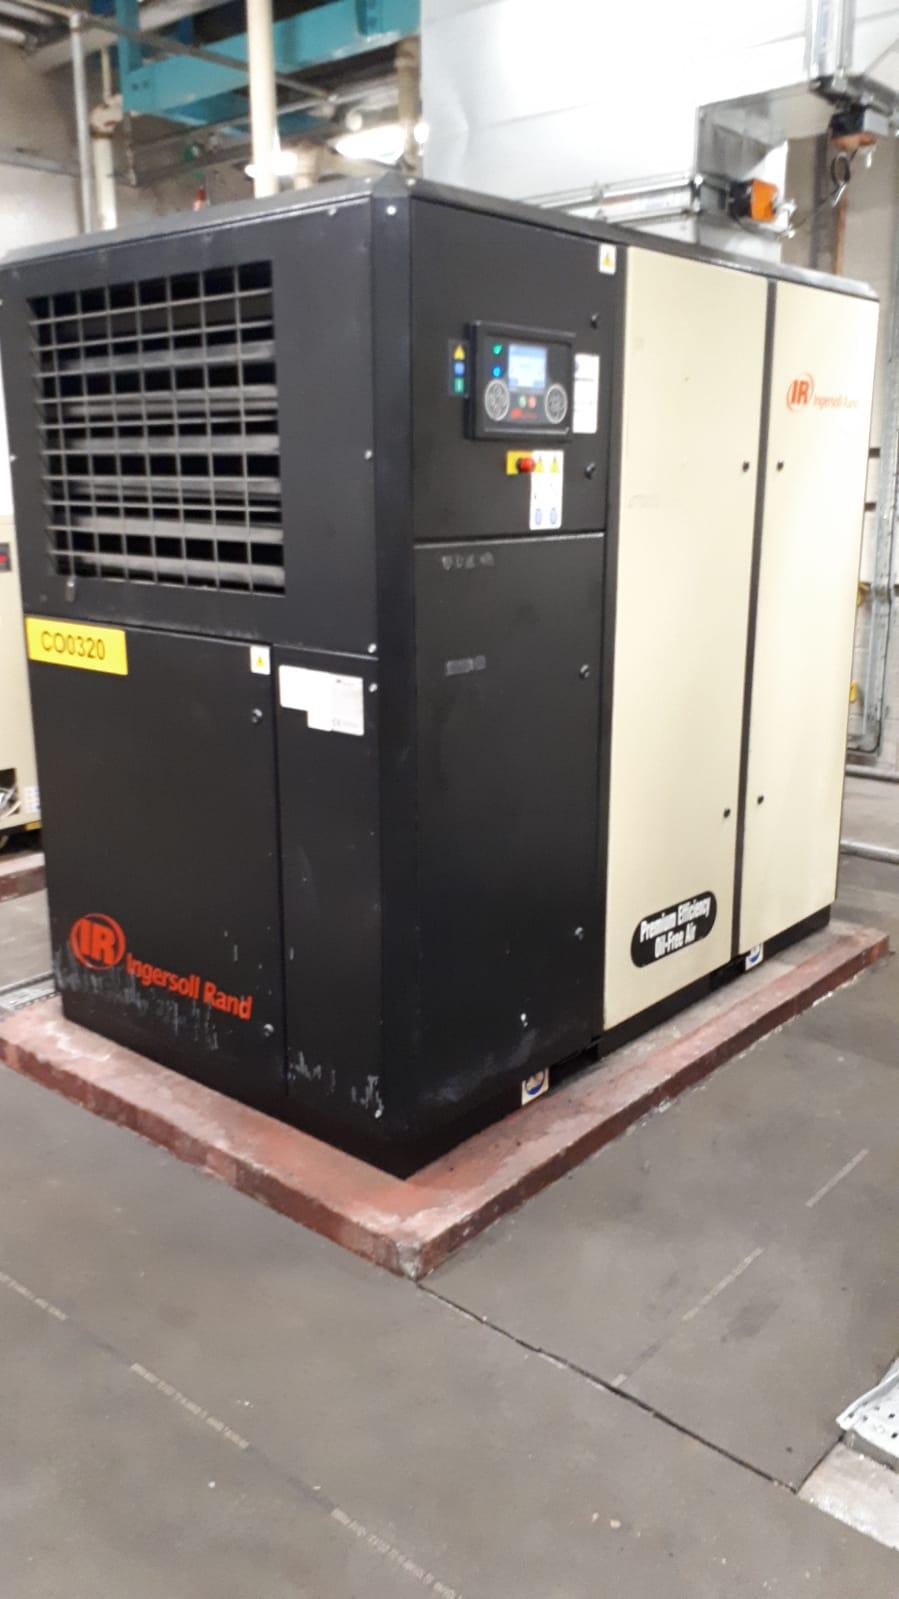
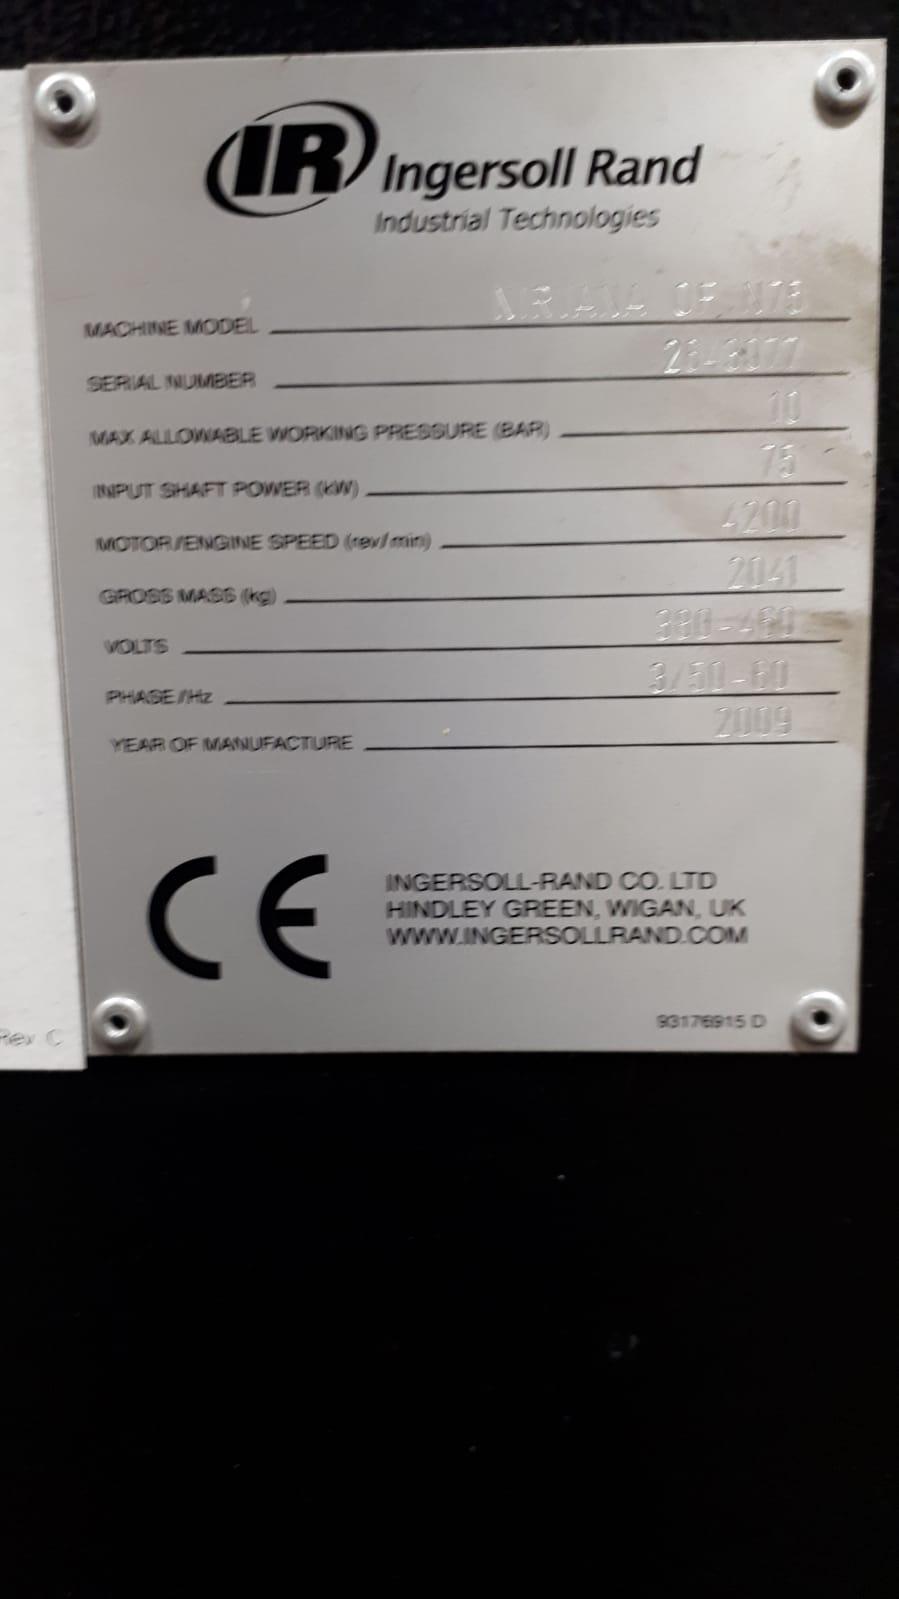
The existing bubbler-type level transmitters in Astellas are fed by an Ingersoll Rand compressor, as shown in figure 10. In order to calculate the cost of the air used by the BTLT’s, the cost of the compressor usage must be calculated;
- Compressor Rating; 75kW
- Loading; 60%, therefore rating for calculation = 45kW
- Cost per kWh; 10.2cent or €0.102
- Compressor usage; 212.4cfm = 6014.5 lpm = 6.014 m3/min = 360.84 m3/hr
Compressor uses 45kWh and produces 360.84 m3/hr; 45/360.84 = 0.1247 kWh/m3. It takes 0.1247 kWh to produce 1m3 of air.
As seen above, the cost per kWh = €0.102, therefore 0.1247 x 0.102 = 0.0127 €/m3. The electricity cost is €0.0127 per m3 of air. The electricity cost of running a compressor is said to be 70% of the total cost of running it (imr.ie), maintenance and spares accounting for the other 30%, therefore the actual cost per m3 of compressed air is; 0.0127/0.7 = 0.0181.
Actual cost per m3 of compressed air = €0.0181
Annual cost of compressed air usage in Astellas = 360.84 x 24 x 365 x 0.0181 = €57358.82
As we know that each of the ten bubblers use 5 LPM then the total usage is 50 LPM, 50 LPM = 3m3/h.
Therefore the calculated cost of the annual compressed air usage of the BTLT’s is calculated as follows; 3 x 34 x 365 x 0.0181 = €673.85
The savings in not using compressed air are not only monetary but also good for the environment.
“We have an energy dilemma in the use of finite energy resources and their effect on the environment, primarily due to the burning of fossil fuels. The first and primary objective of any energy policy must be conservation and efficiency. It is the most economical form for alleviating our energy problems. Conservation means if you do not need it, do not turn it on or use it.” (Nelson, 2009, p.16)
The costs of the spare parts used were taken from the SAP system which list all spare parts used against each individual level transmitter. This includes general maintenance parts such as air filters and breakdown parts which could be any part of the air bubbler system shown in figure 3 (page 7) or the associated pipework and fittings.
4.4 Risk, Mitigation and Constraints
The risk quadrant shown below (Figure 11), shows the relationship between the potential impact of risk and the probability of that risk occurring. These risks can be the risk to people (injury), the project (failure, delays, over budget, reputation), environment or company assets.
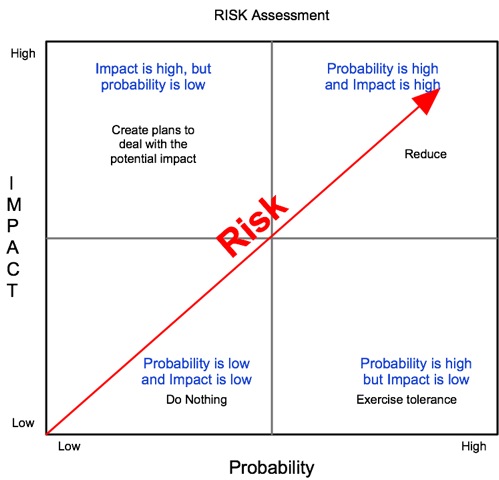
As the probability of the potential problem rises and the impact increases, the risk becomes higher and the necessity to carry out mitigation to reduce or prevent risk is more important.
Below is the matrix used for risk assessment in Astellas Ireland, the severity (impact) is given a number from 0 to 5 and the likelihood (probability) is given a letter from A to E. In this matrix the most dangerous condition is 5E.
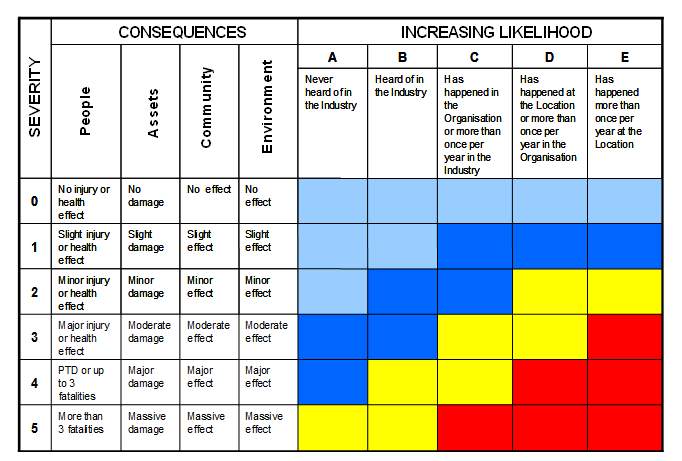
These severities and consequences are more detailed in the risk impact matrix, in Appendix Table A1 (page 37)
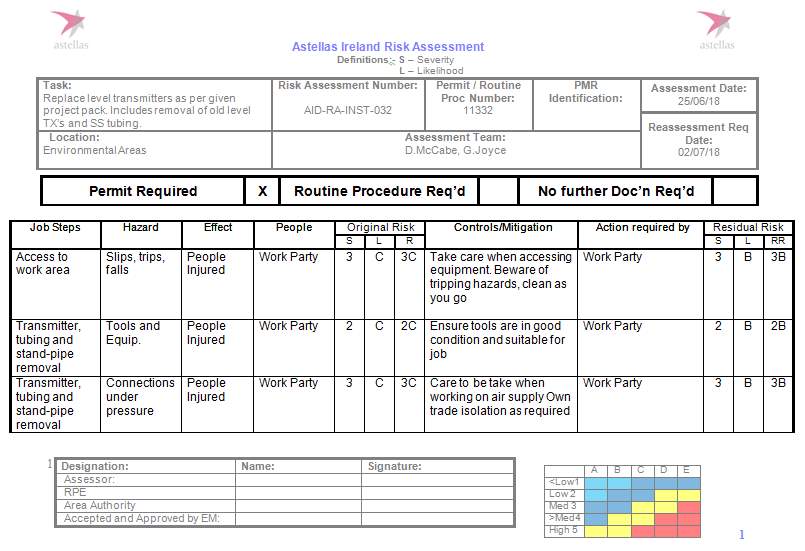
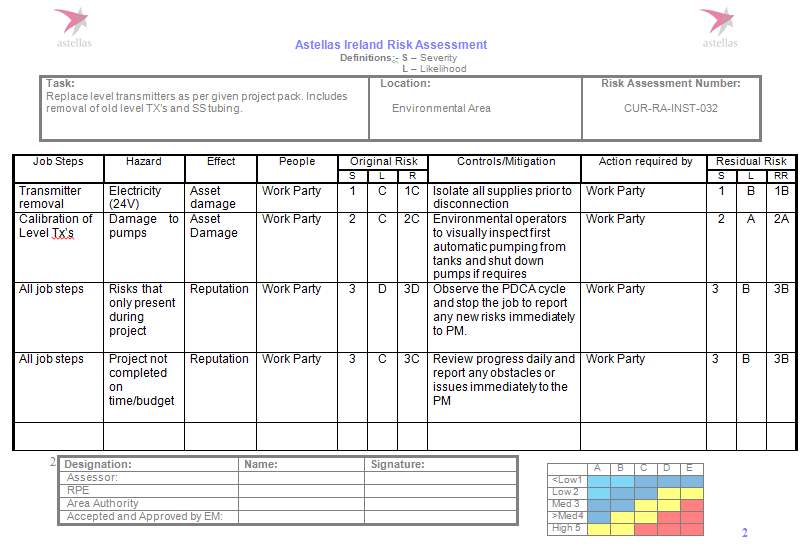
This risk matrix was used to come up with a risk assessment for the project as can be seen below (Figure 13) which also shows the mitigation.
It is not merely enough to carry out a risk assessment and walk away, Stranks (2008) argues that “having carried out the risk assessment an employer must introduce effective systems to ensure the effective planning organisation, control, monitoring and review of the preventative and protective measures arising from the risk assessment”.
In Astellas workers are encouraged to use the Plan-Do-Check-Act (PDCA) cycle, as they work – this can be seen on page 2 of the risk assessment. From the results of the PDCA cycle the work party can anticipate any risks associated with the task as it is ongoing. In the case of this project the work party are instructed to stop the job and notify the PM immediately if a new risk arises.
4.5 Planning
As Kerzner and Saladis (2006, p.119) state, “If a task is well understood prior to being performed, much of the work can be pre-planned. If a task is not understood then during the actual task execution more knowledge is gained that in turn may lead to changes in resource allocation, schedules and priorities. The more uncertain the task, the greater the amount of information that must be processed in order to assure effective performance of the project team members assigned to the task.”
The specific goals and the people responsible for each task can be seen on the Gantt chart and network diagram (on page 9), this schedule is shown in hours. If broken down into days, the agreed upon daily milestones, are as follows;
- Day 1
Complete – Inhibit alarms, Isolate and disconnect 24v, Isolate and disconnect air, Cap air connection and leak test.
Started – Set-up of level transmitters as per calculations (complete 3 on day 1).
- Day 2
Complete – Set-up of level transmitters as per calculations, Remove standpipe and store.
Started – Install of new level transmitters (complete 7 on day 2), Remove BTLT control panel and tubing and store (complete 5 on day 2).
- Day 3
Complete – Install of new level transmitters, Remove BTLT control panel and tubing and store, Reconnect wiring.
Started – Calibrate level transmitters and complete paperwork (complete 3 on day 3), Remove pressure transmitters from control panels and store (complete 7 on day 3).
- Day 4
Complete – Remove pressure transmitters from control panels and store.
Ongoing – Calibrate level transmitters and complete paperwork
(Complete 5 on day 4).
- Day 5
Complete – Calibrate level transmitters and complete paperwork (complete 2 on day 4), Remove alarm inhibits, Sign off all project documentation (work party and stakeholders).
It is important to keep track of these milestones to ensure that the project remains on track for completion on the scheduled date.
4.5a Building a Winning Project Team
This project involves a change to the status quo and change is not always readily accepted and can be opposed by some who do not immediately see the benefits. Until this is dealt with it is difficult to establish a team attitude to build a winning project team.
Kurt Lewin (1951) illustrated this with his notion of the ‘force-field theory’, in this Lewin suggests that all behaviour is due to an equilibrium between two sets of opposing forces. These forces are driving forces and restraining forces, the driving forces are trying to bring about the change and the restraining forces are opposing the change. As the model below shows, the more one side pushes the more the other side resists and nothing happens. In order to reduce the resistance to change Lewin argues that all fears and objections should be listened to and dealt with. This is taken care of during the weekly Kaizen meeting.
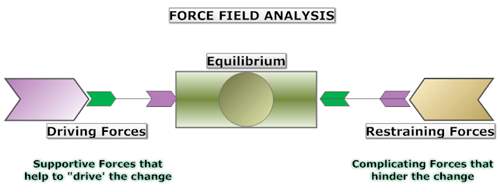
Figure 14: Force-field analysis
The weekly Kaizen meeting uses Kotter’s eight-step change model;
- Establish a sense of urgency
- Create a guiding coalition
- Developing a vision and strategy
- Communicate the change vision
- Empowering employees
- Generate short-term wins
- Consolidating gains and producing more change
- Anchor the new changes in the culture
Kotter (1996) identified these eight steps required to introduce change successfully and this meeting is used to communicate these steps and to answer any questions or alleviate any fears that may lead to people opposing the project.
.Having gone through this process the next step is to set up the project team
When speaking about team roles, Belbin (2010, p. 96) argues that “The skills of the players are important but the strength of the team depends more specifically on how well the players combine”.
There are a number of different personalities in meetings & discussions; introverts and extroverts, some who seem to relish conflict and those who shut-down when conflict occurs and all manner of differing personality traits. Finding the correct balance between these people for a project is important.
This project involves a very small workforce but it required input from a variety of departments in order to be approved in the first place. It is important for the project manager to gain the respect of all the different personalities and to ensure they are all pushing in the same direction.
The actual work involved in this project requires a certain skillset that is available on site in the maintenance department and requires no external workers.
4.5b Procurement
To select the supplier for these new level transmitters, the five supply chain performance objectives, as outlined by Slack, Brandon-Jones and Johnston, (2013) were observed;
- Quality – Siemens brand instruments, proven quality.
- Speed – Local supplier, shorter distance to cover, short lead time.
- Dependability – Long term relationship with company with proven dependability and support for any issues.
- Flexibility – Willing to negotiate discount and take old pressure instruments as part payment (company specialize in instrumentation and refurbish old instruments and re-sell), New instruments stored in the suppliers (Insteco) premises until three days before use (delivered to site Friday 25th May).
- Cost – Best price offered, including 10% bulk discount and part payment deal.
4.6 Implementation
Starting the project off organised and with clear goals for the work party is important.
In this project it means having the instruments on site as per agreement with the supplier (see procurement section above) and having all permits filled out in advance and ready for signature. A brief kick-off meeting is held with a print out of the daily goals given to the work party and a reminder of the importance of safety and communication with the PM when required.
4.6a Communication
Communication is an important part of the project, Burke (2007, p.199) states that “through communication team members share information and exchange ideas and influence attitudes, behaviours and understanding. Communication enables the project manager to develop interpersonal relationships; inspire team members, handle conflict, negotiate with stakeholders, chair meetings and make presentations” (Burke, 2007, p.199).
Having agreed to have a morning and evening meeting with all parties and a daily update by email and the office wallchart, the PM also has to make sure that contact is possible as and when required.
Unscheduled communication is important to ensure that there is no ‘scope creep’. If the work party are aware of what is expected of them they can notify the PM if anything else becomes an added task or is asked of them or by another party. The PM can then resolve the issue to keep things on schedule.
Safety is also an important aspect of this communication. Using the site PDCA cycle the work party can anticipate any risks associated with the task as it is ongoing. In the case of this project the work party are instructed to stop the job and notify the PM immediately if a new risk arises.
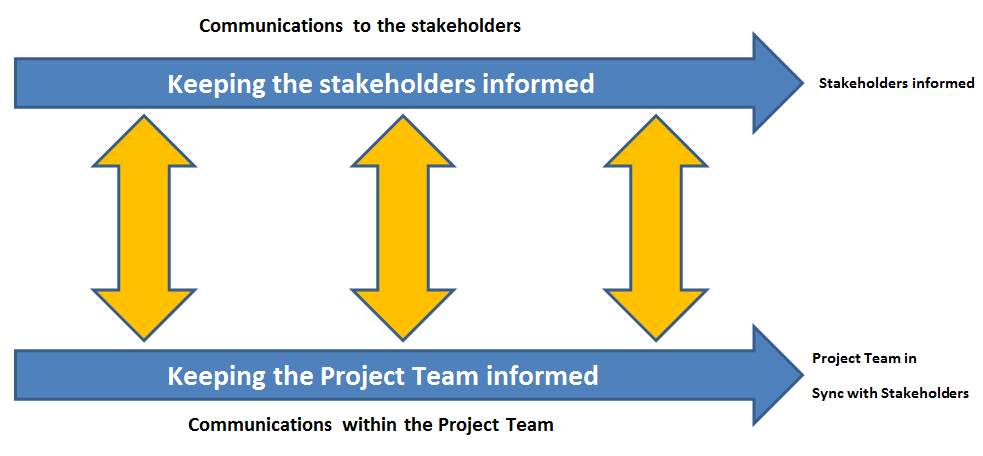
Figure 15: Parallel Communication Tracks
It is also important for the PM to keep in contact with the other stakeholders and keep them informed of the progress and also any issues that they need to be informed of, this is to keep both the work party and the other stakeholders in sync with each other this is known as parallel communication and can be seen in figure 15 (above).
The communication within the maintenance team is also important as the project team are part of the site maintenance team and may be needed elsewhere for other works when not busy. In this case the maintenance manager needed to be notified as soon as the general operative and instrumentation technician are finished their project tasks.
4.6b Control
Developing a plan to keep control of the Project Implementation is an important process.
The plan used for this project can be seen in figure 16 below.
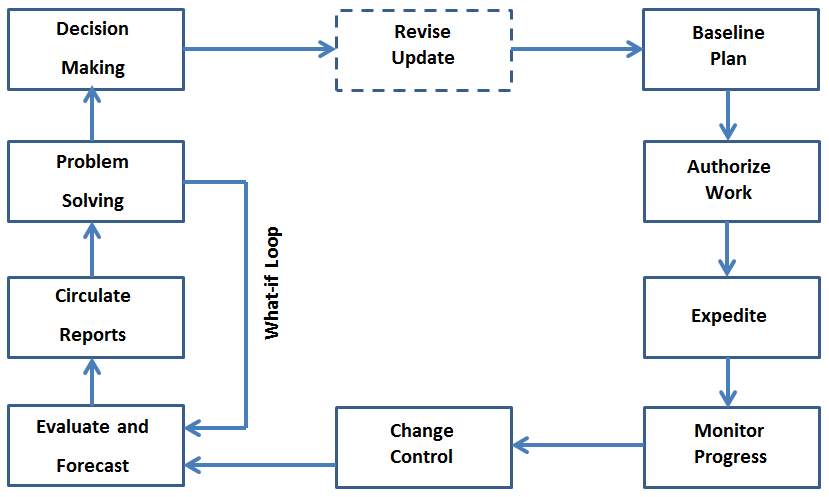
Figure 16: Project Control Cycle
The baseline plan referred to is the plan as shown in the Gantt chart, from this the daily permits are drafted and work is authorized. The new level transmitters are expedited (from the project office) as per the schedule and only as required, this is to ensure they are not left lying around and exposed to damage. The progress is monitored by updating the Gantt chart on the wall after all updates from the project team, if there is any deviation then change control is applied as required. The forecasted progress is evaluated and the daily email is circulated to the project team and stakeholders. If there are problems that need solving all parties have an input that is fed back via the what-if loop to be evaluated and the updated forecast is circulated until all parties are in agreement. The required decisions are made and if a revision is required to the baseline plan it is fed back into the system prior to the next workday being planned for authorisation.
This control cycle continues until the project is completed.
4.7 Performance analysis
Having completed the project it was now important to check the performance compared to the PCTS goals.
- Performance – The installation was of best practice and operation of the level transmitters is to a standard acceptable to all stakeholders. The project team performed well and the communication was excellent between all parties.
- Cost – The project was completed within budget.
- Time – The project was completed on time.
- Scope – The project was completed with no ‘scope creep’.
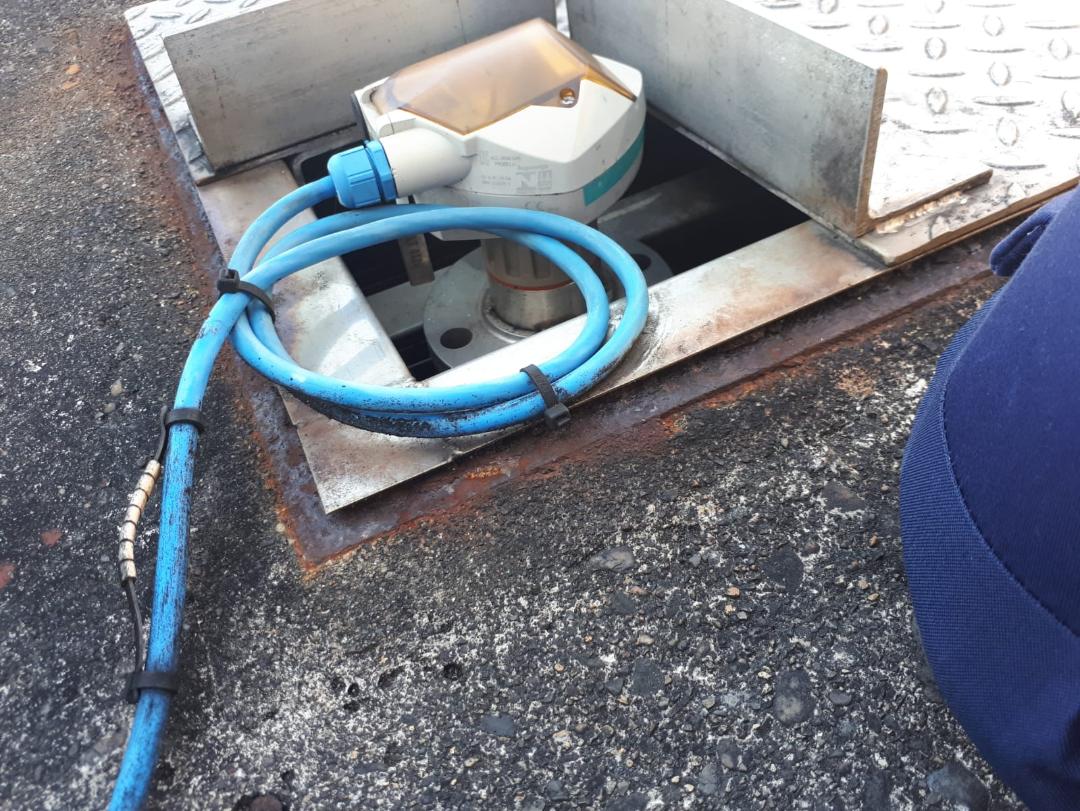
Figure 17: Installed Ultra-Sonic level transmitter
The next step was to check to make sure the desired outcome was achieved.
Having installed all of the level transmitters a check on the actual savings due to removal of the requirement for compressed air was carried out;
The new compressor usage level after the project was completed was 5.9m3/min = 354m3/hr.
Previous annual cost of compressed air usage in Astellas = 360.84 x 24 x 365 x 0.0181 = €57358.82
New annual cost of compressed air usage in Astellas = 354 x 24 x 365 x 0.0181 = €56128.83
Annual savings = 57358.82 – 56128.83 = €1229.99, this is well over the calculated savings of €673.85, this can only be down to leaks in the air lines feeding the BTLT panels. Adding this saving gives us a different return on investment and payback period;
The total cost of this project is €8952.72
The total actual savings per year is €11045.44
The return on investment is; 11045.44 – 8952.72/8952.72 = 0.234 or 23.4%.
The payback period is; 8952.72/11045.44 = 0.81 years or just under 10 months (9.71 months).
The calibration costs of the level transmitters from before the installation of the initial ‘test’ transmitter right through to the predicted ongoing costs can be seen in the graph in figure 16 below.
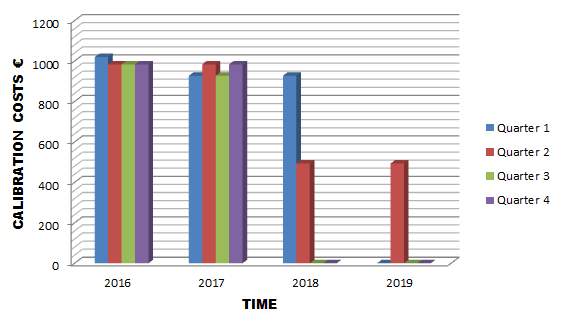
Figure 18: Calibration Costs over time
There is a meeting held at the end of the shutdown period in Astellas for all Project Managers, Teams and Stakeholders, this is to acknowledge people for their contributions to achieving goals and to discuss the individual projects and to share and document any new ideas and learnings. This sharing of ideas and learnings is known as ‘lessons learned’’ and this is necessary “because you as a project manager need to evolve your skills for managing projects, analyse the techniques, processes, and procedures used on a project so you can adapt and improve them in the future” (Campbell, 2011, p354).
When discussing the lessons learned the focus areas are; project management, communications, schedule and budget, quality, safety, human resources and any other issues. An example of the questions asked and answered of one of the focus areas (safety) for this project is shown below;
- How did we do overall?
Only one slight issue that required stopping the job.
- What was done well?
Good communication with PM immediately and issue resolved within minutes.
- What was not done well?
Other work party in close proximity that was not expected.
- What should be improved?
All work parties should be aware of ongoing works in location in case of conflicting work scopes.
- What was learned that can be used in future projects?
Pay attention to other works in area.
- What else was learned?
This other party were carrying out works that could have been carried out elsewhere, PM for their work contacted and work party moved.
- What are the recommended actions?
All PM’s to discuss work locations when planning, a work location board to be mounted in PM office so that a visual display will highlight any potential conflicts prior to authorising work scopes.
The feedback from all of the different parties involved will be from a different point of view of the project and it helps to get a rounded view of any opportunities for improvement.
The documented transfer of responsibilities is also taken care of at this meeting, for example in this project there is scrap metal and pressure transmitters to be collected by external companies, it is important that the PM leaves the responsibility of accommodating this with an appropriate person.
There is also a documented transfer of ownership at the end of the project, the part ownership and safety responsibility of the water storage tanks that had been assumed by the PM at the start of the project goes fully back to the Environmental Manager.
5 Conclusion
This project report is a combined business and academic paper and is the final part of the B.Eng. Industrial Engineering course which covered a number of modules, evidence of the learning from these modules can be seen on the following pages;
- Industrial Engineering Principles – Pages 7, 8, 9, 13, 18, 19.
- Logistics – Pages 9, 28.
- Finance – Page 12, 14, 15, 20, 32.
- Statistics – Pages 18, 19, and 32.
- Continuous Improvement – Pages 5, 7, 11, 13, 14, 16, 26, and 27.
- Emerging Technologies – Page 8, 13 (although the entire project is based around an emerging technology).
- Environment & Sustainability – Pages 10, 14, 15, and 21.
- Professional Practice – Page 27.
- Project Management – Pages 9, 10, 11, 16, 17, 22 – 31, 33, 34
6 Bibliography
Groover, M.P. (2014), Work Systems: The Methods, Measurement, and Management of Work. 1st edition, London: Pearson.
Snyder, G.H., Adams, M. and Szuhaj, M. The Automation Evolution (2012). Available at: https://www2.deloitte.com/insights/us/en/deloitte-review/issue-11/the-automation-evolution-in-manufacturing.html (Accessed: 11 August 2018).
Kanawaty, G. (1992), Introduction to work study. 4th edition. Geneva: International Labour Office.
Zandin, K.B. (2001), Maynard’s Industrial Engineering Handbook. 5th edition. New York: McGraw-Hill.
Drury, C. (2008), Management and Cost Accounting. 7th edition. Andover: Cengage Learning.
Campbell, G.M. (2011), The Complete Idiot’s Guide to Project Management. 5th edition. New York: Penguin Group.
Irish Manufacturing Research – Compressed Air (n.d.). Available at: http://www.imr.ie/project/compressed-air/ (Accessed: 08 August 2018).
Nelson, V. (2009), Wind Energy – Renewable Energy and the Environment. Boca Raton: CRC Press.
Stranks, J. (2008), Health & Safety at Work. 8th edition. London: Kogan Page.
Kerzner, H., Saladis, F.P. (2006), Project Management Workbook and PMP/CAPM Exam Study Guide. 3rd edition. New Jersey: John Wiley & Sons.
Lewin, K. (1951), Field Theory in Social Science. New York: Harper.
Kotter, J. P. (1996), Leading Change. Boston: Harvard Business Review Press.
Belbin, R.M. (2010), Team Roles at Work. 2nd edition. Oxford: Elsevier.
Slack, N., Brandon-Jones, A., Johnston, R. (2013) Operations management. 7th edition. Harrow: Pearson.
Burke, R. (2007), Introduction to Project Management. London: Burke Publishing.
Figure 1: The structure of a lean production system (2014) CourtesyofGroover, M.P., Work Systems: The Methods, Measurement, and Management of Work. 1st edition, London: Pearson.
Figure 1: 6 Steps of Kaizen (n.d.). Available at:http://www.keywordsdoctor.com/NSBzdGVwIGthaXplbiBwcm9jZXNz/ (Accessed: 25 July 2018).
Figure 2: Typical bubbler-type level transmitter (2012). Available at: http://aboutinstrumentation.blogspot.com/2012/02/bubbler-level-measurement-system.html (Accessed: 24 July 2018).
Figure 3: Bubbler Panel (n.d.). Available at: http://kingmech.com/how-bubbler-systems-work-2/ (edited to suit application) (Accessed: 24 July 2018).
Figure 4: Deming Cycle (n.d.). Available at: https://www.mindtools.com/pages/article/newPPM_89.htm (Accessed: 24 July 2018).
Figure 5: Gantt Chart (2018). Courtesy of Astellas Ireland
Figure 6: Network Diagram (2018). Courtesy of Astellas Ireland
Figure 7: Current Process Flow Diagram for Level Calibration (2018). Courtesy of Astellas Ireland
Figure 8: Future Process Flow Diagram for Level Calibration (2018). Courtesy of Astellas Ireland
Table 1: Labour costs (2018). Courtesy of Astellas Ireland
Figure 9: Project Definition Contributions (2012). Available at: http://aboutinstrumentation.blogspot.com/2012/02/bubbler-level-measurement-system.html (Accessed: 24 July 2018).
Table 2: Time Study – existing (n.d.). Courtesy of Astellas Ireland
Table 3: Time Study – proposed (n.d.). Courtesy of Astellas Ireland
Figure 10: Air Compressor (2018). Courtesy of Astellas Ireland
Figure 11: Risk Quadrant (2011). Available at: http://www.movingtoworkofhighervalue.com/2011/11/ (Accessed: 27 July 2018).
Figure 12: Risk Matrix (n.d.). Courtesy of Astellas Ireland
Figure 13: Risk Assessment (n.d.). Courtesy of Astellas Ireland
Figure 14: Force-field analysis (n.d.). Available at: http://www.mspslinfo.com/EHGE/sample-page-2-2/programme-and-project-management/ (Accessed: 02 August 2018).
Figure 15: Parallel Communication Tracks (n.d.). Courtesy of Astellas Ireland
Figure 16: Project Control Cycle (n.d.). Courtesy of Astellas Ireland
Figure 17: Installed Ultra-Sonic level transmitter (2018). Courtesy of Astellas Ireland
Figure 18: Calibration Costs over time (n.d.). Courtesy of Astellas Ireland
Appendix Table A1: Risk category clarification (n.d.). Courtesy of Astellas Ireland
Appendix Figure 1: Transmitter location P&ID’s (n.d.). Courtesy of Astellas Ireland
7 Appendices
Appendix Table A1: Risk category clarification
| Level | People Impact | Asset Impact | Community Impact | Environmental Impact |
| 0 | No injury | No damage | No effect | No effect |
| 1 | Slight injury or health effect – Not affecting work performance and not affecting Daily Life Activities (i.e. First Aid – Medical Treatment Case | Slight damage
Costs less than US $10,000 |
Slight effect – indicated by:
Infrequent slight nuisance. (Nuisance to include interference with reasonable comforts and enjoyments of life, general inconvenience relating to day to day activities or enjoyment of land). No observable adverse or perceived effect on livelihood, social and cultural assets, community security, community health, vulnerable or Indigenous People. Local public awareness but no discernible concern. |
Slight effect – Slight environmental damage, contained within the premises |
| 2 | Minor injury or health effect – Affecting work performance, such as restriction to work activities or need to take up to 5 days to fully recover. Or affecting Daily Life Activities for up to 5 days. Or reversible health effects (i.e. Modified Duty / Restricted Work Case – LTI | Minor damage
Costs between US $10,000 and US $100,000 |
Minor effect – indicated by:
Limited short term nuisance Limited effects on livelihood and/or social or cultural assets, community health. No observable adverse effect on community security, vulnerable or Indigenous Peoples. Local public concern. |
Minor effect – Minor environmental damage, but no lasting effect. |
| 3 | Moderate impact Major injury or health effect – Affecting work performance in the longer term, such as absence from work for more than 5 days. Or affecting Daily Life Activities for more than 5 days. Or irreversible damage to health. | Moderate damage
Costs between US $100,000 and US $1 million |
Moderate effect – indicated by:
Persistent nuisance. Effects on livelihood and/or social and cultural assets, community health. Limited observable effects on community security, vulnerable or Indigenous Peoples. Local or Regional public concern. Local stakeholders, e.g. community, NGO, industry and government, are aware. |
Moderate effect – limited environmental damage that will persist or require cleaning up. |
| 4 | Major Impact Permanent total disability or up to three fatalities – resulting from injury or occupational illness. | Major damage
Costs between US $1 million and US $10 million |
Major effect – indicated by:
Persistent effects on livelihood and/or social and cultural assets, community health. Effects on community security, vulnerable or Peoples and/or human rights infringements, that are serious and/or at a community level. Mitigation is complex or protracted. National public concern. National government body involvement. Impact on local and national stakeholder relations. |
Major effect – Severe environmental damage that will require extensive measures to restore beneficial uses of the environment. |
| 5 | Massive Impact More than three fatalities – resulting from injury or occupational illness. | Massive damage
Costs in excess of US $10 million |
Massive effect – indicated by:
Persistent, severe impact on livelihood, social and cultural assets, community security, community health, vulnerable or Indigenous Peoples and/or human rights infringements. Impact may affect a large geographic area or population. Mitigation is complex or protracted, and of limited effectiveness. International public concern. High level of concern and action(s) by government bodies. |
Massive effect – Persistent severe environmental damage that will lead to loss of commercial, recreational use or loss of natural resources over a wide area. |
Appendix Figure 1: Transmitter location P&ID’s
Cite This Work
To export a reference to this article please select a referencing stye below:
Related Services
View allRelated Content
All TagsContent relating to: "Technology"
Technology can be described as the use of scientific and advanced knowledge to meet the requirements of humans. Technology is continuously developing, and is used in almost all aspects of life.
Related Articles
DMCA / Removal Request
If you are the original writer of this dissertation and no longer wish to have your work published on the UKDiss.com website then please:


