Web-based IQ Test Design
Info: 13601 words (54 pages) Dissertation
Published: 8th Sep 2021
Tagged: Information Technology
Abstract
The main aim of this project is to design and create a web-based IQ test, with a secondary aim of exploring the relationship between question difficulty and the amount of information in a question. The web-based IQ test will be implemented using HTML, CSS and JavaScript while following standard software development practices.
Table of Contents
2.2 The Evolution of Intelligence Tests
2.3 IQ Test Reliability and Validity
2.4 Motivation for Measuring IQ
3. Question Difficulty and Information
4.1 Project Deliverable: Web-based IQ Test
4.3 The Single Statement of Need
4.5.2 Non-functional Requirements
4.5.3 Justification of Requirements
7.1.1 Score Distribution and IQ Mapping
7.1.2 Question Difficulty Distribution
Figures
Figure 1 Carroll’s Three-Stratum Hierarchy [8]………………………………….
Figure 2. Example Question from Raven’s Progressive Matrices [14]……………………
Figure 3. Theoretical curve of growth of intelligence, as adapted by Eysenck, from N. Bailey’s Development of mental abilities [4]
Figure 4. Gaussian curve distribution of IQs, showing the expected…………………….
Figure 5. A fluid intelligence question, with a maximum Shannon entropy of 4 bits…………..
Figure 6. Example of a question in the test…………………………………….
Figure 7. The range of question difficulties…………………………………….
Figure 8. State diagram of the web app……………………………………….
Figure 9. Layout of the wireframe home page…………………………………..
Figure 10. Home page view………………………………………………
Figure 11. Results view…………………………………………………
Figure 12. Questions view……………………………………………….
Figure 13. Submit answers prompt………………………………………….
Figure 14. The spec file (test.spec.js) which contains the tests for the test controller (test.js)……..
Figure 15. Karma terminal output showing the unit tests and their status………………….
Figure 16. Version 1 test score distribution…………………………………….
Figure 17. Question difficulty distribution for version 1 of the test……………………..
Figure 18. Question difficulty distribution for Version 2 of the test……………………..
Figure 19. Split halves comparison of score distribution…………………………….
Figure 20. A graph showing the relationship between the information in a question and the percentage of people who answered it correctly
1. Introduction
This project is concerned with the creation of a web-based IQ test. The software engineering aspects of the project are of foremost importance, however standard psychometric practices shall be taken in the aim of making the IQ test valid and reliable.
Intelligence has been of interest to people for thousands of years, however the formal measurement of it is a relatively new practice. It’s difficult to put a definitive definition on what intelligence is. The Oxford Dictionary of English succinctly defines intelligence as “the ability to acquire and apply knowledge and skills” [1]. However, this definition abstracts away the intricacies of human knowledge and skill. Differing opinions in psychological research have led to different definitions of intelligence. David Wechsler, a leading psychologist, gave what is regarded by many to be a good definition of human intelligence: “The aggregate or global capacity of the individual to act purposefully, to think rationally, and to deal effectively with his environment” [2]. Even though intelligence can be defined, there is debate over what constitutes to things like acting purposefully or thinking rationally. This then makes it hard to decide what makes a good intelligence test. A widely accepted model of intelligence is the Cattell-Horn-Carroll theory (CHC) [3]. It defines intelligence as a hierarchy of factors; ten broad abilities, each consisting of many narrow abilities, contribute to g (general intelligence). The CHC model will be used to inform decisions about the IQ test’s design and implementation.
A widely accepted measure of intelligence is that of an intelligence quotient (IQ). IQ is a standardised measurement of intelligence. An ideal test over the population would theoretically display a normal distribution of IQ scores, with mean score of 100 and standard deviations of 15 points [4]. Someone’s IQ score makes it possible to get an idea of their intelligence in comparison with the overall population. There are many methods of measuring IQ from arithmetic problems to vocabulary tests. It is debated what areas of the human psyche need to be tested to get the most accurate IQ for a person. The most commonly used tests ask questions which aim to assess different facets of g, to hopefully give a more accurate IQ score. In line with the objectives of this project, it has been decided that the test will only use a measurement of fluid intelligence (Gf in the CHC model) to provide the participant with an IQ score. This is because of the nature of web-based testing and the scale of this project; a test which covered more areas of intelligence would take considerably more time, not just to produce but also to complete.
1.1 Project Objectives
This project has two interlinked objectives. These objectives shall influence the entire project and shall be used to evaluate it.
1.1.1 Web-based IQ Test
The first objective of this project is to produce a web-based IQ test. This involves designing and drawing a set of questions, before building a website which allows participants to answer them. The website shall be built using standard web based technologies while following a structured software development lifecycle. Results of the IQ test shall be collected in a database for analysis, with the aim of assessing if the test is a reliable measure of IQ.
1.1.2 Hypothesis
The second objective of this project is to explore the hypothesis:
“Harder fluid intelligence questions contain more information (measured in bits).”
This hypothesis was created early on it the project when I began research into IQ test question design. A question’s suitability for a test is usually decided by collecting a large sample of people’s answers and using this information to classify the question difficulty. The hypothesis was born from the idea that there should be fundamental ‘building blocks’ which can be used to design a question, with its difficulty in mind, from the start. To test the hypothesis, questions will be designed in such a way so that the amount of information in the question can be easily approximated. The test results will then be analysed to see if there is any correlation between the amount of information a question contains and the question difficulty.
1.2 Project Report
This report shall start by discussing intelligence testing and explore the calculation of IQ in depth. A discussion about information, it’s measurement, and how it may potentially relate to question difficulty will follow. The report shall then explain the development process behind the production the IQ test, from requirements and design, through to implementation. After this, the report shall discuss the results gathered from participants of the test and evaluates to what extent the project has met the set objectives. Finally, the report suggests further work and provides a conclusion of the project. A reference list can be found at the end of the report, followed by an appendix.
2. Literature Review
In this section, intelligence and the development of IQ tests will be discussed in more depth, through the review of relevant literature.
2.1 Intelligence
As mentioned earlier, it is difficult to define intelligence with consensus from everybody. Psychological researchers are generally in agreement that intelligence is made up of many factors. There have been many models of intelligence given, including:
Guildford’s Structure of Intellect [5] – describes intelligence as a combination of three dimensions: content, products and operations; each of which has sub categories which can then be used to define more specific cognitive abilities that can be measured through testing.
Planning, Attention-Arousal, Simultaneous and Successive (PASS) Theory of Intelligence [6] – proposes that intelligence is a combination of four cognitive processes (planning, attention, simultaneous, successive). This theory is closely linked to neuroimaging research, specifically, to findings that the brain is made up separate interdependent systems [7].
Both models have been popular with researchers of intelligence, however we shall be using, possibly, the most widely accepted model for intelligence, CHC [3]. This is because this project is less about disputing which model of intelligence is best and more about the creation of an intelligence test. The CHC model is well suited for this project; many of the most notable IQ tests use the model and it describes intelligence as distinct testable factors. The CHC theory model of intelligence can be visualised in Carroll’s three-stratum hierarchy, which can be seen in Figure 1.
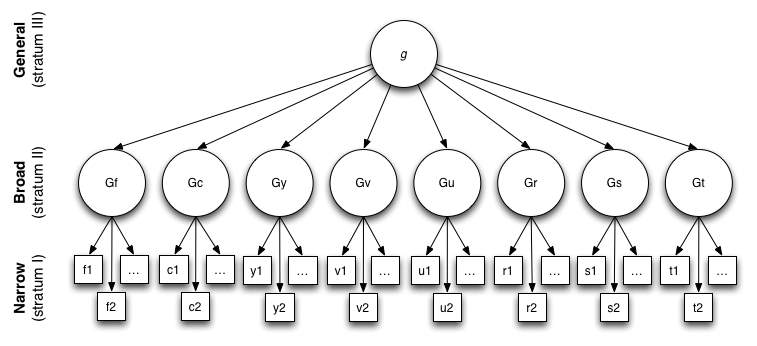
Figure 1 Carroll’s Three-Stratum Hierarchy [8]
General intelligence (g) is at the top of the hierarchy and is made up of multiple ‘broad’ cognitive abilities such as crystallised intelligence (Gc), visual processing (Gv) and reaction time (Gt). These abilities are interconnected to different extents but all make up general intelligence. They are in turn made up of ‘narrow’ abilities, that can be tested. IQ is essentially an attempt to quantify g. To get the most accurate IQ for a person, we would aim to test all the sub-components that make up g, however this would be very time consuming. Tests need to be short enough to be done in a reasonable amount of time and so most omit testing every single sub-stratum of intelligence. This practice it considered acceptable as tests in these different areas of intelligence show positive associations, meaning that if someone is good at one type of test they are often good at the others [9]. Tests such as the Stanford-Binet [10] and the Weschler Adult Intelligent Scales (WAIS) [11] only test certain subsets of g. This project is of such size and scope that testing only fluid intelligence (Gf) is acceptable.
Fluid intelligence is the subset of intelligence “concerned with basic processes of reasoning and other mental activities that depend only minimally on learning and acculturation.” [12] In other words when testing fluid intelligence, we are purposefully trying not to test abilities that have been learnt through things like schooling or life experience. Fluid intelligence includes mental abilities such as identifying relations, problem solving and transforming information [13]. Questions that test fluid intelligence are nonverbal and usually require the examinee to deduce, from a given sequence of geometric designs, a pattern. Raven’s Progressive Matrices (RPM) is a popular fluid intelligence test. Figure2 shows a question from a RPM test, and is a good example of what a question that tests fluid intelligence might look like.
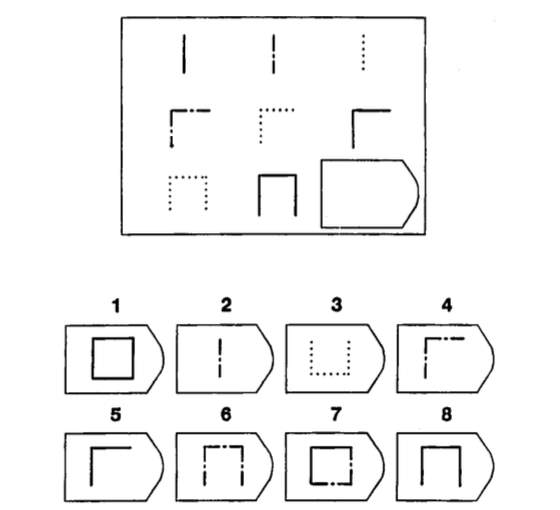
Figure 2. Example Question from Raven’s Progressive Matrices [14]
2.2 The Evolution of Intelligence Tests
The first formal intelligence test was created by Alfred Binet in the early 1900s; he was commissioned, by the French government, to identify children who needed educational assistance in school [15]. The measure of intelligence in his tests was not an intelligence quotient, but a mental age scale. This meant that children would answer a series of questions which got increasingly harder. The level of these questions was determined by the average age at which children first pass the question. The point at which a child started to fail questions on the test is their mental age (given by the level). So, for example, a five-year-old’s mental age may exceed his chronological age by a year if he passes all the age six level questions but no age seven questions. The difference between a child’s chronological and mental age was then used to determine their relative brightness. This was not an ideal way of measuring intelligence as the difference in age is a larger fraction for younger children (i.e. one year’s difference between chronological and mental age is a larger fraction for a three-year-old verses a twelve-year-old). Binet’s tests did prove to be useful for assessing children’s intelligence, despite issues with the intelligence scale used. [4]
After the foundations of measuring intelligence had been laid by Binet, other psychologists proposed other scales for intelligence. Lewis Terman, a psychologist at Stanford University, adapted Binet’s original test and standardised it using a sample of American participants. This test, known as the Stanford-Binet Intelligence Scale, was the first test to use an intelligence quotient as a way of classifying scores. IQ’s given by this test were calculated by dividing the participants mental age by their chronological age, then multiplying by 100. For example, a child with a mental age of ten and a chronological age of eight would be given an IQ of 125 (10 8 100).
These tests were effective for assessing children however they faced shortcomings when it came to measuring the intelligence of adults as, generally, intelligence growth slows around the age of sixteen which can be seen in Figure 3.
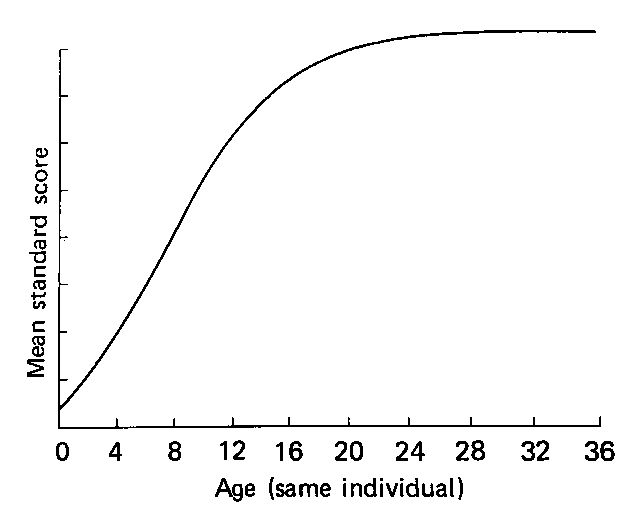
Figure 3. Theoretical curve of growth of intelligence, as adapted by Eysenck, from N. Bailey’s Development of mental abilities [4]
In 1955, David Wechsler published a new intelligence test known as the Wechsler Adult Intelligence Scale (WAIS) [11]. The test addressed the limitations of the Stanford-Binet test and changed the way IQs were calculated; instead of calculating IQ using a person’s mental and chronological ages, the WAIS compares a participant’s score with the score of others in the same age group. The average score is set at 100 with a standard deviation of 15. Figure 4 illustrates what the ideal IQ distribution of a population would look like. For this project’s test, IQ’s will be calculated by comparing peoples scores regardless of age group. This is because it is not likely to gather enough data to form accurate Gaussian curves for a segregated sample.
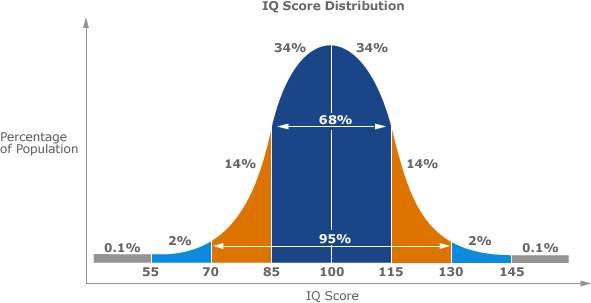
Figure 4. Gaussian curve distribution of IQs, showing the expected percentage of the population to gain certain scores [16]
Today the WAIS is in its fourth edition (WAIS-IV), published in 2008 [16]. The WAIS-IV is one of the most used and reliable intelligence tests at the moment. The WAIS-IV has elven subtests that have different formats to test different areas of intelligence. Using multiple subtests allows for a more accurate IQ estimate. These subtests have been refined over decades of carrying out the WAIS allowing them to be accurate measures of types of intelligence. The scale of this project will not likely allow for the collection of enough data to make more than one subtest of acceptable accuracy.
Despite the numerous different IQ tests out there, they all aim to measure g. While their IQ scores may differ slightly between tests, for any one individual, it can be shown that scores for these tests correlate (how strongly performance on one test indicates performance on another test). This indicates towards the existence of g and that all the tests measure it to a certain extent. This practice of calculating how closely tests correlate between each other, and with g is called factor analysis [17].
2.3 IQ Test Reliability and Validity
Test reliability involves trying to identify how consistent an IQ test is at measuring intelligence. Test validity is essentially asking whether the test is measuring intelligence, or something else altogether. A test cannot be valid without being reliable first, however reliability does not imply validity. Established IQ tests like the WAIS-IV are considered valid and reliable measures of intelligence.
Test reliability is defined by the National Council on Measurement in Education as:
“The characteristic of a set of test scores that relates to the amount of random error from the measurement process that might be embedded in the scores. Scores that are highly reliable are accurate, reproducible, and consistent from one testing occasion to another. That is, if the testing process were repeated with a group of test takers, essentially the same results would be obtained. Various kinds of reliability coefficients, with values ranging between 0.00 (much error) and 1.00 (no error), are usually used to indicate the amount of error in the scores.” [18]
A reliability coefficient can be calculated through several different methods [19], of which notable ones are:
- Parallel-forms: creating one or more alternate tests that are technically equivalent, then using the correlation between the scores on each test to estimate test reliability.
- Test-retest: administering the test to a group of participants, then re-administering the test again to the same group of participants. The correlation between the scores on each test is used to estimate the test reliability.
- Split-halves: like the parallel-forms method, however an alternate test is not explicitly created. Instead one test is given, then the test is split in half (often between the odd and even indexed questions) and the correlation between participants’ scores on each half of the test is used to estimate the reliability.
Each method has some drawbacks; it is hard to make sure the separate tests in the parallel-forms method are the same and in the test-retest method, we must get participants to do the test twice. The split-half method will be used in this project, as it provides a good compromise between these two methods; it saves time as two tests do not need to be created (useful as the project is very time limited) and participants do not need to redo the test (useful as participants are anonymous and unlikely to redo the test).
Evaluating if a test measures intelligence is not straightforward. Some sort of external validation needs to be given, to help show that the test is measuring intelligence. In traditional test theory, there are three different ways to measure validity – concurrent validity, predictive validity and construct validity [20]. Concurrent and predictive validity are of most interest when looking at IQ tests, as essentially, they compare test scores with some external criteria to calculate a correlation between the two factors. Concurrent validity measures the correlation between test scores and an independent measure taken at the same time. On the other hand, predictive validity is the correlation between IQ test scores and some independent measure taken at some time in the future. There are countless external criteria that could be argued show intelligence, and so should be compared to test scores for validation. It would be impractical to try and use all of them for validation and so there is two external criteria which have often been used in the validation of IQ tests. Eminence and achievement is one possible criterion of intelligence (e.g. people with certain professions, such as judges or politicians, and that have successful careers are likely to be intelligent). The other generally accepted criterion for intelligence is performance in examinations and education. From calculating test validities against these external indicators, it has been shown that there is some correlation between IQ and success in them [21]. However, it must be said that these indicators are also influenced by many factors other than intelligence, such as personality [22] or hard work, which themselves can be affected by other factors.
2.4 Motivation for Measuring IQ
Intelligence is, at least, a contributing factor to things like academic success and success in professional life, but not the only one. Some intelligent individuals may end up a ‘failure’, and some less intelligence a ‘success’. The idea that intelligence could be used to possibly indicate whether an individual will likely be suited to a job, or to predict future achievement in education is a good motivation for IQ testing. Many companies use some sort of psychometric testing as part of their recruitment processes, as a way of filtering candidates [23]. IQ tests can also be used to help identify people with learning disabilities, in order to provide them with suitable support (Binet’s intention for his original test [15]).
Intelligence can be a sensitive topic, especially when talking about its use as a predictor for things like financial income, job performance or even involvement in crime. The Bell Curve: Intelligence and Class Structure in American Life [24] is a book, published in 1994, in which the authors discuss the intelligence and its predictive capabilities. It was controversial, sparking debate about its claims around intelligence [25] [26]. This project is not intended to add to any debate surrounding intelligence due to it being primarily about software engineering. If taken light heartedly, IQ tests can just be considered fun – this is good enough motivation for the creation of a test.
2.5 Online Tests
When the first IQ tests were being developed, there were no computers and so all tests were administered by pencil-and-paper. It was not until the 1970’s, when computers started being used in education, that computer based testing could become a reality. Computers revolutionised psychometric testing as the process of administering, scoring, and analysing results from paper based IQ tests was labour intensive [27]. Computers allow for the analysis of large sets of data, ideal for the study of test scores. The World Wide Web further revolutionised the process of administering tests, by allowing for tests to be potentially distributed to anyone connected to the Internet. Despite the benefits of using web-based tests, research suggests that results may be affected by differences in format (web-based versus pencil-and-paper) [28]. Tests such as the WAIS are designed to be administered by psychologists and doctors so that some form of invigilation is given. Invigilation is usually needed when testing the mental ability of patients or when testing potential members of high intelligence societies [29]. Web-based tests are suitable for the purpose of entertainment or to predict performance on a professionally administered test.
3. Question Difficulty and Information
Question difficulty in tests is traditionally determined through statistical models such as item response theory [30]. These models essentially classify a question’s difficulty by looking at the relationship of how many people got it right to how many got it wrong (i.e. if 100% got a question right, that would equate to it being very easy, versus a question in which only 50% of people got right). The hypothesis of the project came about due to the question difficulty classification being determined after results collection; I questioned if there was something which intrinsically made a question hard, that could be used to design a question of a specific difficulty from the start. The hypothesis born from this idea is:
“Harder fluid intelligence questions contain more information (measured in bits).”
This chapter of the report will discuss what information is and how it could possibly relate to IQ test question difficulty.
3.1 Measuring Information
In information theory, information is defined as “a mathematical quantity expressing the probability of occurrence of a particular sequence of symbols, impulses, etc., as against that of alternative sequences” [31]. This means that for a symbol in a sequence, with probability of it occurring given by
p, the information it adds to the whole sequence can be expressed using
-log2p. Shannon entropy [33] is a measure of the amount of information that is in the entire sequence of symbols. Shannon entropy, H, is calculated using the formula:
H= -∑ipilog2pi
Where
piis the probability of symbol
iappearing in the sequence. The unit of measurement for Shannon entropy is the bit. The Shannon entropy of a sequence is maximal if all the symbols have the same probability of occurring and can be calculated by using
H= log2n, where
nis the total number of possible symbols. The Shannon entropy is also the minimum number of bits required to encode a sequence of symbols.
3.2 Information in Questions
The Shannon entropy can be calculated for fluid intelligence questions, as the questions have the form of a sequence of symbols.

Figure 5. A fluid intelligence question, with a maximum Shannon entropy of 4 bits
Figure 5 is a question that is in this IQ test, and shall be used to help explain how the information in a question is calculated. Each separate, large, square is treated as a symbol in the sequence. It can be deduced from the question, that there are 16 possible symbols (square layouts). This is because the star can appear in any of the 4 corners and the circle can appear in the 4 squares in the bottom right (4 × 4 =16). Some questions’ minimum Shannon entropy could be calculated, however because this is not the case for all questions the maximum entropy shall be used for the approximation of a question’s information. So, for the question in Figure 5 the maximum Shannon entropy is
log216=4bits.
It could be said that there are more possible states, however the number needs to be finite. As the question designer, I can calculate all the possible symbols following the limited transformation and rotation rules. This allows for a limit to be imposed on the possible number of states when calculating the Shannon entropy.
The hypothesis is essentially saying that the more possible states there are in a question, the harder the question is to answer.
3.3 Testing the Hypothesis
To test the hypothesis of the project, two sets of information needs to be known: the amount of information in each question on the test and the percentage of correct answers for each question (a measure of question difficulty). The calculations performed to calculate the maximum Shannon entropy for Figure 5 shall be done for all the questions on the test. The test shall then collect the data relating to question difficulty. Once the results have been collected, the amount of information in a question shall then be plotted against the correct rate of the question. The plot should show a negative correlation if the hypothesis is true. The results section of the report shall discuss the findings of the project.
4. Project Requirements
This section of the report gives an overview of what goes into creating a web-based IQ test before detailing the constraints of the project. A formal list of requirements is then defined. The aim is to fulfil these requirements upon the test’s creation. The requirements are, therefore, a crucial influence on the design and implementation of the test.
4.1 Project Deliverable: Web-based IQ Test
The first deliverable of this project, as stated previously, is a web-based IQ test. Web-based applications (web apps) are pieces of software which are accessed through the World Wide Web. Web apps are usually made using HTML, CSS and JavaScript. Other technologies, such as web application frameworks, can also be used in the creation of web apps. Different technologies will be considered for the creation of the test, with judgement on which are most appropriate for use being made in the design section (this will be influenced by the requirements specified in this section of the report).
The content of the web app is an IQ test. Theory discussed in the literature review will be used to formulate the requirements and guide the development of the test. The results and evaluation section of this report will analyse whether the test fulfils the requirements relating to the test content.
4.2 Project Constraints
The delivery of this project is subject to certain constraints, which need to be considered throughout its development. The constraints on the project are:
Economic
This is an unfunded project, so the technologies used either need to be free or paid for by the developer.
Ethical
The web app must conform to the code of practice and principles for good ethical governance set by the University of York [32]. In regards to the web-based IQ test, this means that the collected data must not harm the welfare of participants.
Legal
Legal regulations must not be violated by the project. It must be considered that if any personal data is to be collected, it must not violate the Data Protection Act 1998 [33].
Time
The web-based IQ test and report must be finished by the set deadline. The project deadline is fixed and cannot be extended.
4.3 The Single Statement of Need
To create a web-based IQ test which measures fluid intelligence, while gathering participants results to test the hypothesis.
4.4 User Requirements
The web-based IQ test is intended to be used solely by participants. Analysis of results shall be performed using tools separate from the web-based application.
The following, is the list of the user requirements to be met by the test:
- The participant must be able to access the test via the World Wide Web.
- The participant must be given enough information about the test so they can make an informed choice about whether they participate or not.
- The participant should be given instructions of how to take the test.
- The participant must be given an IQ on completion of the test.
- The participant should be given a warning that their given IQ may not be accurate due to the test being a work in progress.
The user requirements were originally created with the following in mind:
- The given criteria for the project (UR1, UR4)
- The ethical constraints (UR 2)
- Theory behind IQ tests (UR3, UR4 and UR5).
For the initial version of this test, these user requirements should be acceptable. Only a small number of stakeholders were involved in the elicitation of these user requirements and so they could possibly be expanded by discussing with more potential users what they would expect from the IQ test.
4.5 System Requirements
The system requirements are specified in two separate lists: functional and non-functional requirements, both of which specify how the system will fulfil the user’s needs.
4.5.1 Functional Requirements
- The test must be publishable to the World Wide Web.
- The participant must agree to the terms of participation before starting the test.
- The IQ of the participant must be calculated and displayed upon completion of the test.
- The participant’s given answers must be recorded in a database in a format that allows for them to be appropriately analysed.
- The participant should be able to navigate to between any two questions.
- The test should have a time limit.
4.5.2 Non-functional Requirements
- The web app should be straight forward to navigate.
- There should be safeguarding against a participant’s accidental submission of answers.
- It should be clear which question the participant is answering at any one time.
- The code should be well organised, with meaningful names for functions and appropriate comments.
- The code should be backed up appropriately.
4.5.3 Justification of Requirements
SR1 places a restriction on what technologies can be used for the creation of the test, as to ensure that UR1 is fulfilled. SR2 needs to be in place to ensure that the user has been given the appropriate information before the test, in order to fulfil UR2 and UR3. UR4 and UR5 are addressed by SR3 as the app must generate the participants IQ. UR4 and UR5 are further addressed by SR4 as it specifies support for the analysis of IQ estimates, which could possibly lead to their improvement. SR5 and SR6 allows for a test to be completed appropriately. The test is to have a time limit so that participants do not spend too long doing the test; it should be long enough for the comfortable completion of all the questions.
The non-functional requirements address the quality of the web app. SR7, SR8 and SR9 specify the features needed for a good, streamlined user experience; the user should be able to concentrate on the test at hand. SR10 and SR11 are requirements relating to the development of the test. The test may need to be updated and so keeping the code organised will help allow for changes to be made easily. This web app is an important piece of software and so it would be wise to have at least one backup in case part, or all of it gets lost. Using a source code repository would be one suitable way to backup the web app as it would also aid development with change tracking.
5. Design
The design of the IQ test is made up of two parts: the design of the test content and the design of the web app. The design of the test content draws from the wealth of research discussed in the literature review. The design of the web app will be greatly influenced by the requirements specified in the previous chapter.
5.1 Test Design
The test aims to measure fluid intelligence. As stated before, fluid intelligence is “concerned with basic processes of reasoning and other mental activities that depend only minimally on learning and acculturation.” [12] Therefore, the test was designed to not include any questions which tested learned knowledge, for example arithmetic or comprehension. The questions on the test take inspiration from prominent fluid intelligence tests, such as the RPM, where participants must identify the most appropriate missing piece in a pattern by using relational reasoning.
Each question consists of a series of five squares, the first four of which make up a sequence to be completed. The final square in the sequence must be deduced from the ones preceding it. The participant will have a selection of four possible answers to choose from, of which only one is correct. Figure 5 shows the format of questions in the test; the square with filled with ‘?’ is the square which shall be replaced with the participant’s chosen answer. All the questions have the same layout, so that displaying them on a web page is predictable and straightforward.

Figure 6. Example of a question in the test
The hypothesis considering the amount of information in a question influenced the design of the questions. To test the hypothesis, the questions needed to be designed in such a way that the amount of information that they contained could be quantified relatively easily. This meant varying the amount of information in each question. Estimating the information in a question is done by using the equation
log2n, where
nis the number of possible states a square in the sequence could take. For example, in figure 5, there are two possible states (arrow pointing up, or arrow pointing down), that can be described by using 1 bit (log22) of information. This calculation was done on all the questions in the test. The questions are designed to be appropriate for a fluid intelligence test even if the hypothesis does not hold.
The test is comprised of 30 questions that appear to each participant in the same order. The questions were designed to be laid out in order of increasing difficulty. This is so that participants do not get disheartened early in the test with hard questions, which could cause them to quit. Analysing the results should give an indication as to whether the question order is correct (e.g. if many people get an early question wrong, it may be harder than first thought). To increase the difficulty and information in the questions, the number of segments and shapes they contain is increased. All the squares in any given question contain the same number of segments. Figure 6 shows the different number of segments possible across the questions, with the easiest on the left through to the hardest on the right. Squares with a higher number of segments can have more possible states, which equates to them having higher maximum Shannon entropy.


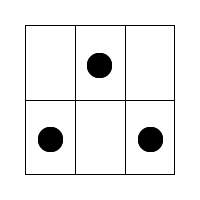
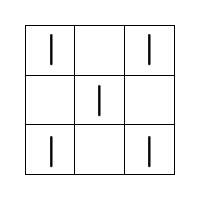
Figure 7. The range of question difficulties
In reality, designing and drawing the questions with information in mind was very time consuming. I became concerned about whether I could complete the designs within the tight time constraint, and so part way through the process I began designing questions without calculating their information. I still tried to create them in difficulty order, just using my intuition. However, this is not a sound scientific approach. Once the test was released, some participants expressed that they thought the question order was not correct, in terms of difficulty. On analysis of the results this can be confirmed (see7. Results and Evaluation). The question order can be changed, and so on later versions of the test this shortcoming is addressed. After data collection, the amount of information was calculated for the questions which I had missed. Analysis of question information and question difficulty will be examined in the results section of the report.
The aim was to make the test possible to complete within 30 minutes, however after initial alpha testing it was decided that the time limit would be set at 45 minutes. This is because some participants felt rushed, which is not the purpose of the timer. The time limit is in place to prompt the participants to actively complete the test.

Figure 8. Answer selection layout
The possible answers are laid out in a 2×2 grid (see Figure 8. Answer selection layout) and only one of them is correct. The position of the correct answer is determined by an index (0 to 3). A random number generator [36] was used to generate the list of correct-answer indexes. As well as being used to layout the answers, this list of indexes was used to mark the test.
5.2 Web App Design
There are several components that need to be considered when designing the web app; the way it looks, how it will work and the database design.
It was decided that the test would be designed as a single page web app, using the Model-View-Controller (MVC) web pattern [34]. This design pattern was chosen in the aim that the code would be better organised and therefore more maintainable. The model is where the applications data is stored and this can only be accessed by the controller. The controller makes changes to the view when the model changes and vice versa. The view is what is displayed to the user. The words view and page will be used interchangeably through the rest of the report when referring to the visual design of the app.
5.2.1 App Structure
The first thing that was designed was the web app structure, which details how a user will navigate around it. The web app layout was designed to be as simple as possible as to meet SR7 and to keep development time within the time constraint given. Figure 7 is a state diagram which shows how a user will navigate around the web app. The boxes are the different views that will be displayed to the user and the arrows represent the buttons which will be used to navigate the app. As can be seen in figure 7, the app will be simple with a minimal number of views and simple navigation links.
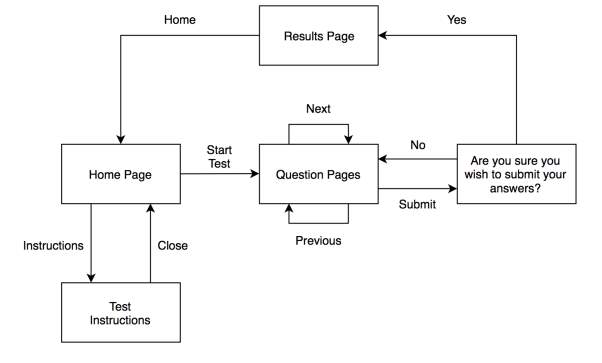
Figure 9. State diagram of the web app
5.2.2 Page Designs
Next, the layout of each view had to be designed. Initially the designs were drawn using pencil and paper, from which wireframe mock-ups were created using Adobe Illustrator. The layout of each view is very simple due to the small number of buttons required and the very specific purpose of the app. Figure 8 shows the wireframe mockup of the home page which was used to guide the creation of the final page.
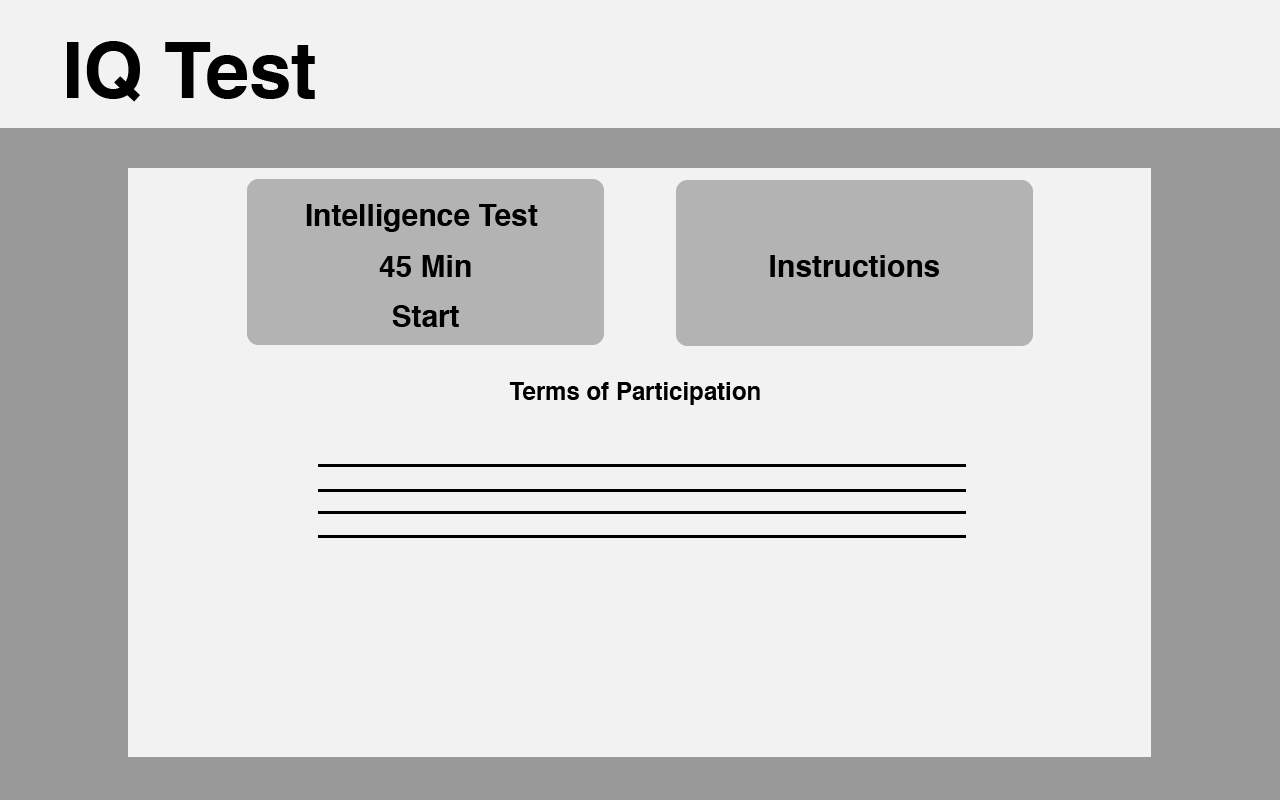
Figure 10. Layout of the wireframe home page
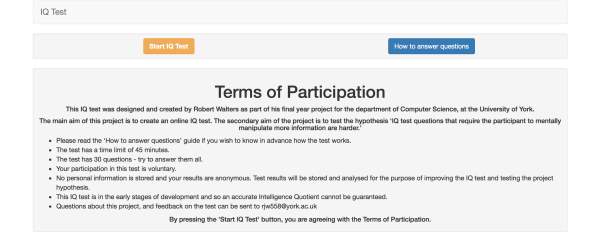
The home page was designed to display the terms of participation to the user in the hope that they would read all the information needed to make an informed decision about whether to partake in the test. It was done in this way to edit
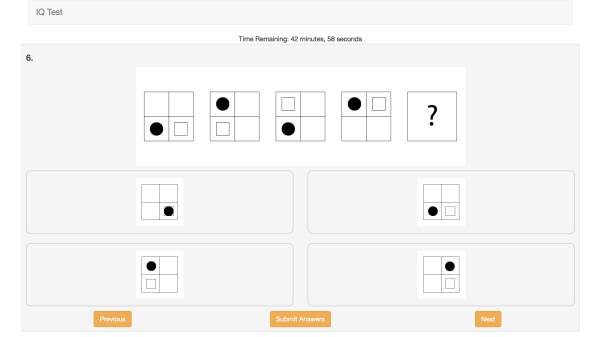
Each question and all of its possible answers are displayed on its own page. The layout of each of these pages is designed so that the question and answers are visible without having to scroll. This design choice was made with the requirement SR9 in mind. The next and previous buttons are placed directly below the answers so that they are easy to find. If the user scrolls down on the page they can see a progress section. This consists of 30 colour coded buttons which relate to each question in the test. When a button is red, it means that the question has not yet been answered, and when one is blue it means that the question has been answered. There is a legend which explains this to the participant. These features have been included to fulfil the requirements SR5 (a participant should be able to navigate between any two questions) and SR7 (the web app should be straight forward to navigate).
5.2.3 Function Design
After designing the layout of the web app, the functions had to be planned. The functional requirements were looked at carefully, while stepping logically through the flow diagram in figure 7, to create the following list of general functions:
Navigation buttons – navigation buttons need to be in place so the user can move between different pages. The buttons may also need to call specific functions, such as starting the test timer.
Timer – a timer function needs to be implemented to fulfil SR6. The timer will need to start counting down from 45 minutes from the moment the start test button is clicked. If the timer runs out, the test should end and the user should be notified about it, before being taken to the results screen.
Question Selection – being able to navigate between any two questions, as specified by SR5, requires the current question index to be stored and allow for it to be changed to any other index.
Test Marking – a function that marks the test and returns a IQ needs to be created. This is to satisfy SR3.
Results Saving – a function which saves the test results to a database needs to be created. The format of the data which is to be sent is dependent on the database design.
5.2.4 Database Design
The database design was dependent on what information I decided to collect. Psychological researchers often collect metadata such as participants’ age and gender in order to test hypothesis’ relating to that information. This type of metadata is usually classed as sensitive, personal data, therefore careful consideration about the legal and ethical constraints needs to be taken. For this project, it was decided that personal data would not be collected as the test and the hypothesis are only dependent on participants scores. This meant the implications of the legal and ethical constraints was lessened; implementing the correct security for the data would have created work which would have been difficult to fit within the strict time constraint of the project. A non-relational database (Amazon DynamoDB) was chosen to store the results. This is because it stores the data in a JSON file which means the data from the web app (which uses the same format) can easily be stored in it. The database has three fields:
id – a uniquely generated ID so that each set of participant’s results can be differentiated.
date – a Unix timestamp recording the time when the results were submitted.
results – a list of numbers. Each number is the index of the chosen answer. The index of the number in this list relates to the question number.
6. Implementation
Implementing the test required following the design decisions made previously, while still considering the requirements. As specified in the requirements, the app needed to be accessible on the World Wide Web, and so web based technologies were chosen to be used. This section of the report first introduces the technologies which were used before giving an account of what was involved in the implementation of the test.
6.1 Technologies Used
The development was mainly done on a MacBook Pro, which meant it was easy to work on the project almost anywhere. The risk of physically losing the work was increased however, and so suitable backups were required. Backups were made using an external hard drive and the Time Machine software that is built into macOS. Other backups were made using online Git repositories and Apple’s iCloud storage.
A list of the other technologies used and the reasoning why they were chosen is given below.
IntelliJ IDEA – an integrated development environment used for the creation of the app. It was chosen as it has built in tools, to aid development, for all the web technologies that have been chosen.
HTML – Hypertext Markup Language is the standard markup language for creating web pages.
CSS – Cascading Style Sheets are used in conjunction with HTML to provide styling to the web pages. Styling includes things like fonts and colour schemes.
JavaScript – a programming language used in web development to add dynamic functionality to web sites. For example, in this web app a timer is needed and this functionality can only be added using a language like JavaScript.
Bootstrap – an open-source, front-end web development framework. It has been chosen as it provides HTML and CSS templates for things like buttons and navigation components, which helped reduce development time.
AngularJS – an open-source, front-end web development framework which is based on JavaScript. It was developed with the aim of making single page web app development simpler and is intended to be used in conjunction with the MVC design pattern. For this reason, it was chosen to be used in the development of this test. I was also familiar with AngularJS, so that too was a contributing factor as to why it was chosen.
NodeJS – an open-source, back-end web development framework which is based on JavaScript. It has been chosen to implement the REST (representational state transfer) features of the web app. REST is a standard web service for data transfer using HTTP and was chosen as it allows for the fast transfer of JSON files (which are used in the database). NodeJS was chosen as it is based on JavaScript, which was to be used elsewhere in the project, and because it well supported, with lots of documentation.
Jasmine – an open-source, testing framework for JavaScript. Jasmine was chosen to be used as it is recommended in the AngularJS documentation because it provides functions that help with the structuring of tests. It was also chosen because it supports tests written for both AngularJS and NodeJS.
Karma – an open-source, command line tool which can be used to launch a web server hosting the app and then execute the tests (written using Jasmine).
Amazon AWS (Amazon Web Services) – the free tier was chosen to host the website and the database because it allowed for all the separate sections of the app to be managed in the same environment. I also had previous experience in using it. In hindsight, many of the features available with AWS could be considered as ‘overkill’ for this type of small scale web app and a simpler hosting service could have been used.
Amazon DynamoDB – a non-relation database provided by AWS. This was chosen for the reason discussed in the database design section. Other non-relational databases which support the JSON file format were available, however seeing as AWS servers were chosen to host the site it made sense to have the database hosted within the same service.
Adobe Fireworks – software used for creating art assets for the web. This software was used for drawing the questions and answers.
Python – a scripting language used to analyse and plot the results. The scripts written in Python are not part of the web app and run locally on my personal computer. Python was chosen as JSON files (from the database) can easily be imported and analysed using extensions like Plotly [36] and SciPy [37].
Git and Bitbucket – used for version control. Using Git meant that there could always be a working version of the app, and changes that caused issues could be reversed. Bitbucket allowed for the codebase to be worked on from other computers and provided another backup of the code.
6.2 Implementation Process
During the implementation, an agile style development methodology was used. This was not a traditional agile approach as it was an individual development project, meaning things like SCRUMs (regular meetings of the development team to discuss issues) could not, technically, take place. At the start of development, I broke down the project into small manageable tasks, which were prioritised and worked on in this order of priority.
6.2.1 HTML and CSS
The website’s development involved writing HTML and CSS with the aim of making the final version look like the wire frame mockups, that were previously designed. A simple colour scheme for the site was chosen, with grey elements on a white background. Different coloured buttons were used as to highlight app functionality. Figures 9, 10 and 11 show the finished views of app. The HTML was written in one file, as the website is relatively small and is a single page app. If the app was of a larger scale, it likely would have been better to split up the HTML into separate files for better management of the code.
6.2.2 AngularJS
JavaScript provides the main functionality of the web app. Following the MVC design pattern and standard AngularJS practices, the JavaScript files were split into separate files for controllers and services. Controllers provide communication between the view (HTML and CSS) and the services, which provide and manipulate the data the app uses. In the HTML, the controllers are referenced using the “ng-controller” directive, which links certain HTML elements to the specified controller. The app has three controllers and two services.
intro.js – this controls the home page view, shown in Figure 11. It has one function, activateTest(), which starts the timer and changes the state of the app to ‘test active’. This function is run when the start button in pressed.
results.js – this controls the results view, shown in Figure 12. It has one function, reset(), which resets the web app. This means the user is taken back to the home page view, the timer is reset, and all the selected answers are cleared. This function is run when the user clicks the ‘Go Back To The Home Page’ button.
test.js – this controls the questions view, shown in Figure 13. the current question index is stored in the variable activeQuestion. The functions nextQuestion(), prevQuestion() and setActiveQuestion() are used to change the activeQuestion variable and display the appropriate question. They are run when the navigation buttons are pressed in the view.


testService.js – this service contains two functions which manipulate data to do with the test. The function changeState() is used to change which view is currently being displayed. The function markTest() iterates through the answers, given by the participant, to update their total score so that it can be displayed in the results view. markTest() is called when the user submits their answers when prompted as shown in Figure 14. This prompt is in place to fulfil requirement SR8 (there should be safeguarding against a participant’s accidental submission of answers). In a few cases the ‘Submit Answers’ button actually caused participants to submit their tests on the very first question. From the feedback which they gave me, they said that they thought it was to submit the answer for the question they were on. This is an issue, as it means false results are accidently being created. In future versions of the app, I would need to address this issue with clearer instructions to the participant.
dataService.js – this service contains variables that store data such as a participant’s score and IQ. The service contains two functions. makeTestQuestions() generates a list of question objects that represents the test. This is done using indexes to reference the art assets which are loaded into the web app, so that the order of the questions can be changed by modifying the question names and not the code. It was implemented in this way so that the question order can be changed easily if it appears to be incorrect. The second function, saveTest(), saves a user’s submitted answers (list of the selected answers’ indexes) to the database using a POST request.
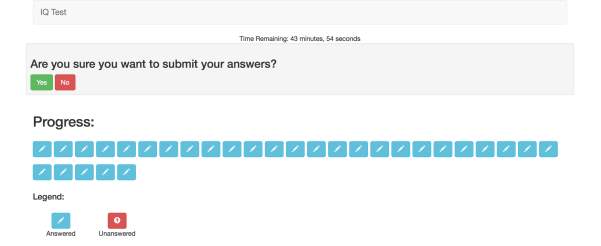
Figure 14. Submit answers prompt
6.2.3 NodeJS
The app contains one JavaScript file which uses the NodeJS framework. This file, app.js, is used to configure the application programming interface (API) with the database. This is so that data can be sent and, therefore, stored in the database. The file specifies URL’s for certain database requests; in the case of the app, the database URL is appended with ‘/save’, in order to make POST requests (transfer data via parameter in the URL). The app.js file is the back end of the web app.
6.2.4 Python Scripts
When building the back end of the application, I encountered a problem where I could not make GET requests to the database. Performing GET requests on the database would have allowed for the implementation of data analysis within the web app itself. This was not a requirement or a high priority feature of the app and so was abandoned. This choice was made with the knowledge that I could manually download the JSON data from the database and analyse it using Python. For this small-scale application, this was a suitable workaround. However, in a future version of the test I would try to resolve the GET request problems and implement in app data analysis.
Python scripts were written that import the database JSON file and then analyse the data contained in it. The Python scripts made use of the NumPy, SciPy and Plotly libraries. NumPy and SciPy provide mathematical functions which aid in the statistical analysis of the data. Plotly is a graphing library which allows for the creation of publication-quality graphs. Data analysis was performed locally using Python scripts. A benefit of doing this locally was that it allowed for the quick modification of statistical tests and graph layouts, as it was not needed to be published online. On the other hand, implementing a data analysis feature in the web app would help by keeping all the functionality, for both participant and tester in one place.
6.2.5 Unit Tests
Using the testing tools Jasmine and Karma, unit tests were written for the web app. The unit tests are in place to make sure the logic of all the individual parts of the app are working correctly. This is done by making spec.js files for each JavaScript file. Within these spec.js files, mock versions of the controllers and services are created so that their functionality can be tested. Assertions are then made about what values should be changed and or returned by individual functions. Figure 15 shows the test.spec.js file which holds the tests for the test controller (test.js). The beforeEach() function is called before each test in the suite. In test.spec.js, the beforeEach() function is instantiating a mock version of the controller to be tested. The describe() function is used so that tests of a single function can be grouped together. The it() function is used to specify separate tests within the describe() function. Karma is a useful tool, as it runs all the tests every time any changes are made to a file. This was meant that I could see when any modifications I made to the code broke the functionality of the app. Figure 16 shows what the Karma terminal output for test tracking looks like.
6.2.6 Compatibility Testing
The web app needed to work in most web browsers and on across a range of devices. Karma allows for the tests to be run on a list of specified browsers and so all the unit tests were run using a range of browsers (Chrome, Firefox and Safari). The Bootstrap framework allowed for the application to be displayed correctly on different size screens. To test this, I manually visited the site on different devices to verify that it worked and displayed correctly.
6.2.7 App Versions
Over the course of the project, the web app had three different release versions:
The first release of the app was a closed beta which was used to identify the time limit to use for the test. The beta had a time limit of 30 minutes for the test. Feedback collected from participants indicated that the release version of the test should have a longer time limit, and so it was changed to 45 minutes.
The first release version of the test collected results from 53 participants. These results were used to modify the test in the hope of improving it. These changes were included in Release Version 2.
From the results collected by the test in Release Version 1, it was clear that the questions were not in difficulty order. The questions were reordered by difficulty in Version 2. The calculation of IQ was also revised. This is because when the test was released, the distribution of scores was unknown and so the IQ estimate was very inaccurate. Using the score distribution of the participants from Version 1, the IQ calculation was changed and implemented in Version 2.
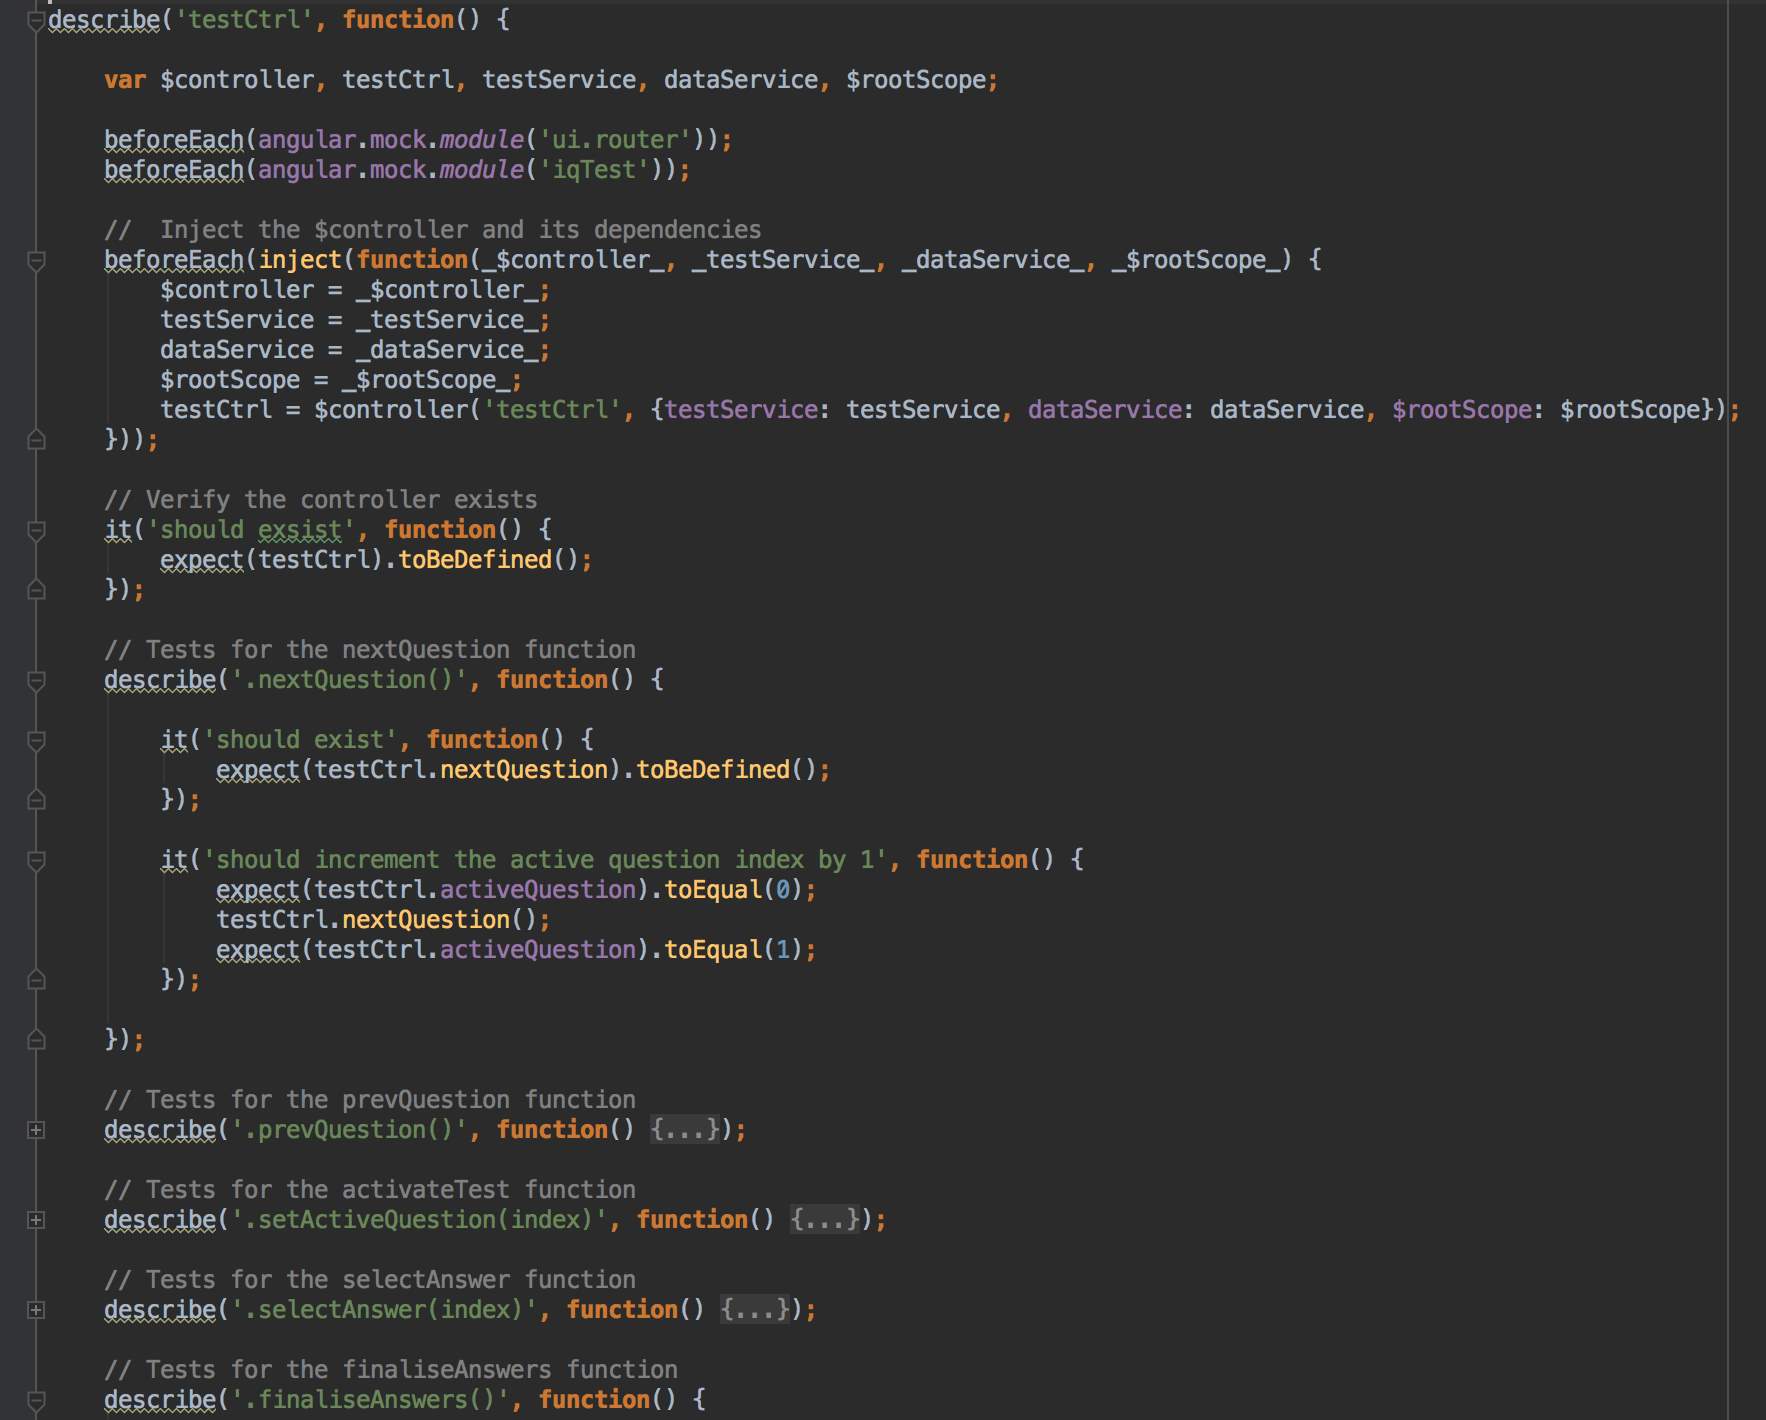
Figure 15. The spec file (test.spec.js) which contains the tests for the test controller (test.js)
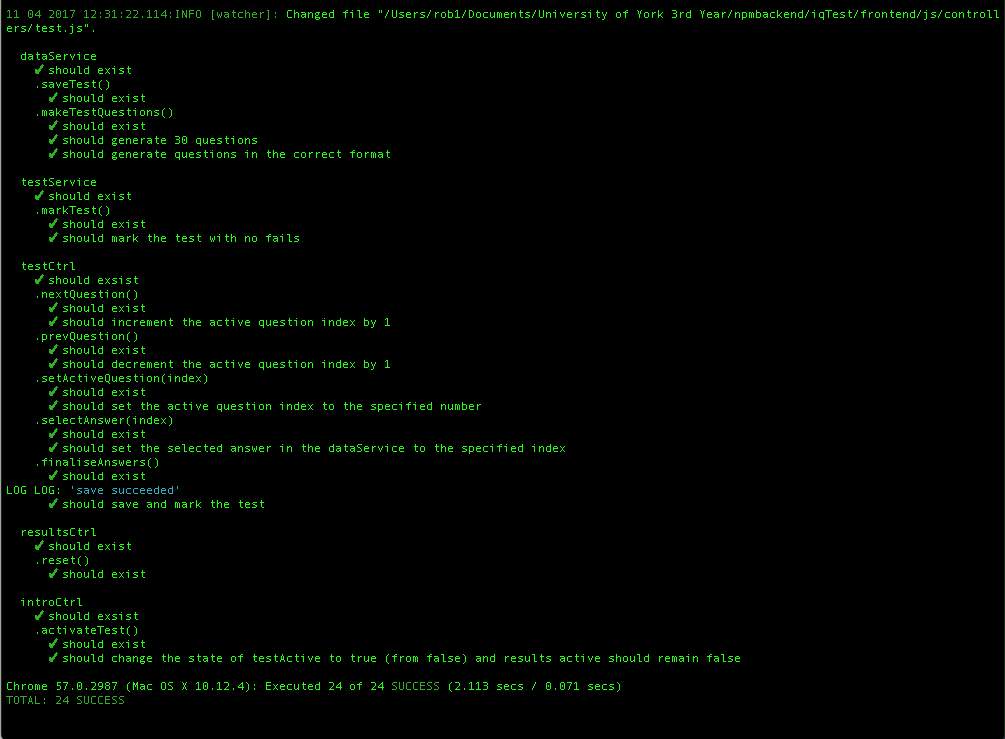
Figure 16. Karma terminal output showing the unit tests and their status
7. Results and Evaluation
The data gathered from the test allows for the evaluation of the project. Separate data sets were collected from each released version of the test. There were 52 participants in the sample from the first released version of the test and x from the second released version. The results from the first sample were analysed before the release of the second version of the test. The process of that analysis shall be explained in 7.1 Version 1 – Data Analysis. The data collected from all the samples shall then be used to review the test’s reliability, before being used to test the hypothesis of the project. In total, there were (52+x) participants. This sample size is not very large and so inferences from the analysis of the results may not be accurate. Ideally, given more time, a larger sample of results would have been collected.
After the results have been analysed, an evaluation of the IQ test software shall be given.
7.1 Version 1 – Data Analysis
Results gathered from Version 1 of the test were used to inform the changes which were made in Version 2, in the hope that a more accurate IQ could be given to participants. Two sets of data analysis were performed for this.
7.1.1 Score Distribution and IQ Mapping
Participants of Version 1 were given an IQ that was not calculated by comparing their scores against the rest of the population and so was not reliable. For Version 2, the IQ calculation could be done properly, as IQs could be mapped to scores using the results gathered from Version 1. Figure 17 shows the distribution of scores for the entire sample of Version 1 participants. The distribution is almost normal; it appears to be slightly skewed toward higher scores however. The distribution is close enough to a normal distribution that IQ’s can be mapped to discrete test scores. The standard deviation () of the distribution is 6 and the mean score is 19. These values are used to map IQ values to corresponding test scores, with an IQ of 100 corresponding to the mean score of 19 and each standard deviation corresponding to 15 IQ points (e.g. a score of 25 equates to an IQ of 115 and a score of 13 equates to an IQ of 85). The score mapping derived from these results was used to calculate the IQ’s for participants of Version 2 of the test.
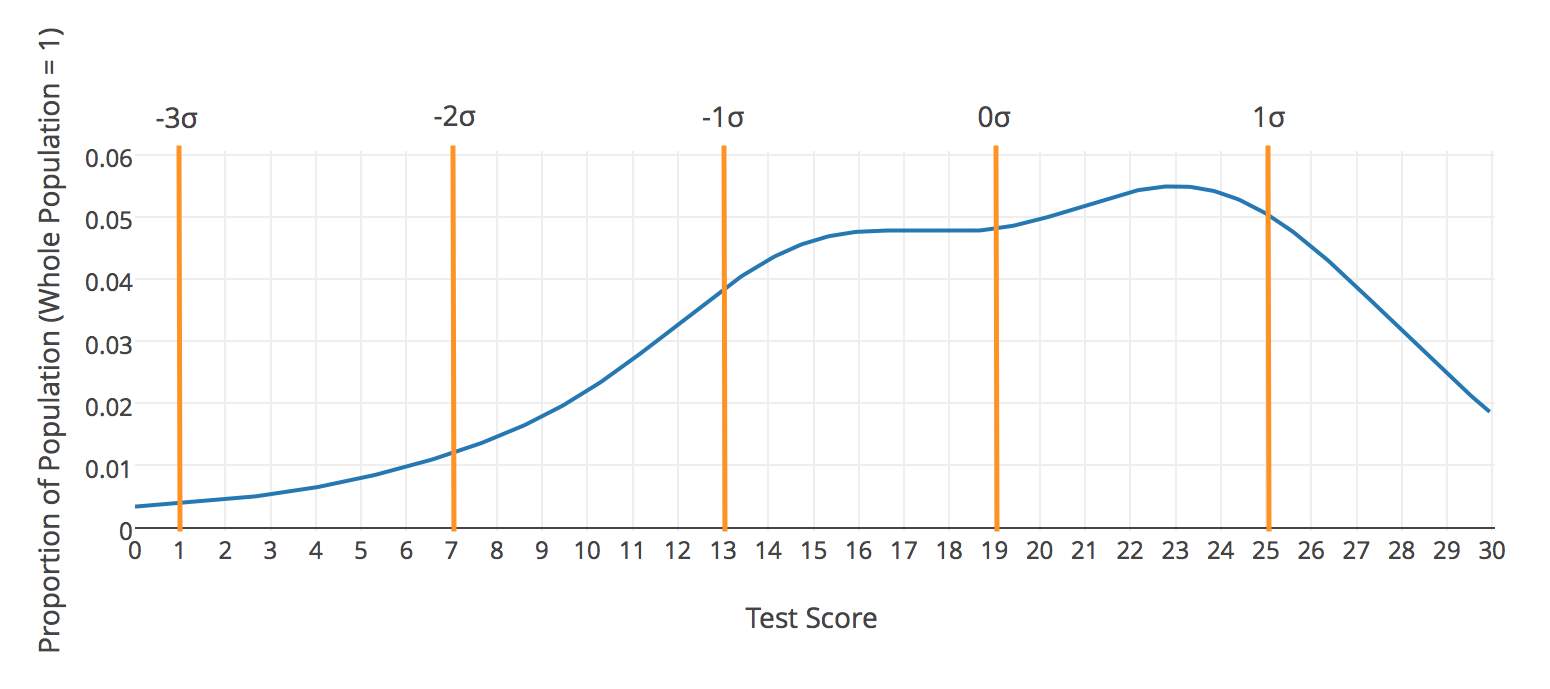
Figure 17. Version 1 test score distribution
The skewing of the score distribution may be due to the demographics of the sample; the people who were directly asked to participate in the test were generally university students or professors. This means that statistically, from previous research, they are likely to have higher IQ than the rest of the population [40]. The fact that the test was web-based also restricted the demographic of participants to those who have access to a computer and the internet. These factors mean that the distribution shown in Figure 17 may not be representative of the whole population.
7.1.2 Question Difficulty Distribution
The IQ questions are intended to get harder further into the test. Using the results from Version 1, the question difficulty distribution can be plotted and reviewed. Question difficulty was calculated using the percentage of people who got the question right (the higher the percentage of correct answers, the easier the question). Figure 18 shows the difficulty of each question on the test.
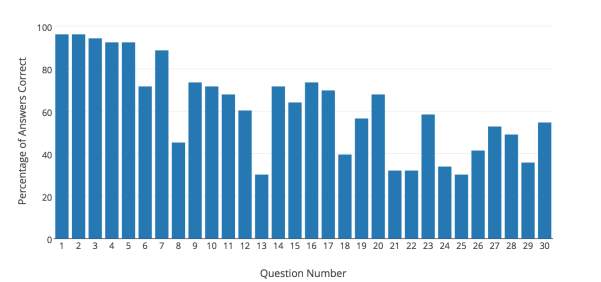
Figure 18. Question difficulty distribution for version 1 of the test
The distribution in Figure 18 was rearranged by difficulty to give the new order of the questions which was used in Version 2 of the test. Figure 19 shows the difficulty of each question in Version 2 of the test.
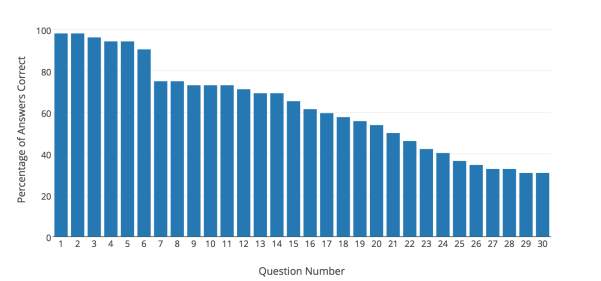
Figure 19. Question difficulty distribution for Version 2 of the test
7.2 Test Reliability
To review the reliability of the test, the split halves method shall be used. This involves splitting the test questions in two, calculating the scores for each half, and then calculating a correlation coefficient between scores on each half. The correlation coefficient that shall be used is Pearson’s r; it is a measure of the linear relationship between two variables [41]. Generally, a value of r closer to 1 suggests the test is reliable. The results have been split by in half by using odd and even indexed questions.
Figure 20 is a plot of score distributions for the odd indexed questions and the even indexed questions. The two distributions have a moderate correlation coefficient (r = xx). It can be concluded that the tests reliability is acceptable for the purpose of this project.
It should be noted that it is has not been possible to calculate the tests validity, as it would have required the participants to complete other, external tests. This was not possible given the limited time and resources. In a project of larger scope, I would calculate the test’s validity by comparing participants’ scores on this test against their scores on other, established, IQ tests.
7.3 Testing the Hypothesis
To test the project hypothesis, the amount of information in a question, and the question difficulty needs to be know. Question difficulty, as before, shall be defined by the percentage of people who answer it correctly. The amount of information in each question was calculated when they were designed. The amount of information a question contains is plotted against the percentage of people who got it right. A correlation between these variables would suggest that the hypothesis could be true.
Figure 21 shows how question information relates to question difficulty. The regression line has been drawn on to highlight the emergent correlation. On initial observation of the graph, there appears to be a strong negative linear relationship between the two factors. A Pearson’s r correlation coefficient of -0.77 was calculated, which confirms this observation. A p-value was also calculated to determine the significance of this result. It’s p-value is 0.0000007, which is very low suggesting that the hypothesis should not be dismissed.
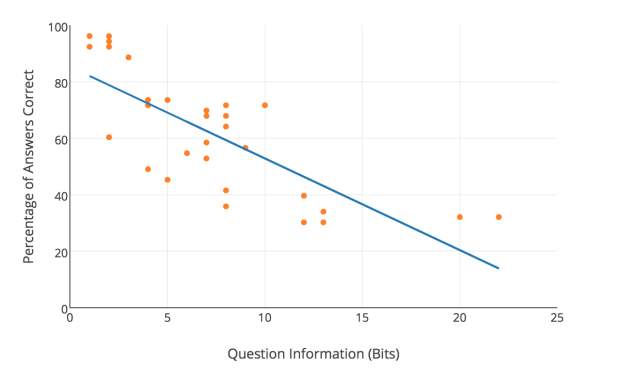
Figure 21. A graph showing the relationship between the information in a question and the percentage of people who answered it correctly
Seeing as there appears to be a correlation between question information and question difficulty, it would be a good idea to investigate this hypothesis further. Details of further work shall be discussed in the next section.
7.4 Project Evaluation
The project had two objectives to fulfil. This section shall evaluate the extent to which these objectives have been met.
7.4.1 Web-based IQ Test
The software had to fulfil the list of specified requirements. The project did fulfil these requirements and so against this criterion it could be considered a success. However, it could be argued that the requirements were not updated to reflect stakeholder feedback, and so the software did not reach its full potential. In the next chapter, future improvements of the software shall be discussed.
The tests that were carried out on the software all passed for the final release version. This indicates that a certain level of quality was achieved with the app, however it is likely that some important tests may have been missed. To further improve the test coverage, input from other stakeholders would be useful.
7.4.2 Hypothesis Evaluation
The web-based IQ test collected enough data for the hypothesis to be tested. The results show that the hypothesis should not be dismissed and that future work should be done to further investigate it. The hypothesis may be sound, but it should be considered that the IQ test, designed to investigate it, may not be of suitable quality to stand up to scientific scrutiny. In any case, future work has been warranted through the formulation and initial investigation of the hypothesis.
8. Future Work
This chapter of the report suggests what further work could be done to improve the IQ test made in the project. It also suggests further work relating to the testing of the hypothesis, which would not necessarily require using the test created in this project.
8.1 Further Web App Versions
Feedback gathered from Version 2 of the test has indicated that 45 minutes is now too long a time limit, given the reordering of the test questions. Version 3 would therefore have a time limit of 30 minutes. For future versions, the requirements list should be updated. I would strongly suggest that the stakeholders’ (participants) feedback is given more consideration when updating the requirements. This could be done by implementing some sort of feedback submission form within the web app. Participants themselves may also want some more feedback about their performance on the test. This could be done by implementing a statistics page, which displays things like the results graphs in the previous chapter. The test could also be designed to collect more data, such as age and gender, to allow for other relationships with IQ to be analysed. The ethical and legal implications of collecting this extra data would need to be considered.
8.2 Testing the Hypothesis
Future work exploring the hypothesis, defined in this project, should aim to tighten the scientific soundness of the results and their analysis. A good starting point for this would be to collect data from more participants. It would also be a good idea to try and get a more varied demographic of participants, for the skewing reason mentioned in the previous chapter.
The process of designing the questions, in future work, could be done better. The spread of questions for each discrete information amount should be more evenly distributed and determined beforehand (e.g. in this test there was four questions with 6 bits of information and only one question with 20 bits). Also, the drawing of the questions should follow a stricter process, where the information estimate can be more accurately calculated. The test design could potentially benefit from the input of a qualified psychologist, who has experience in the area of psychological testing. They would hopefully be able to guide decisions relating to the IQ test’s design and implementation.
9. Conclusion
This report has established that intelligence testing is important; whether it’s used for identifying cognitive impairments or just used as a form of entertainment. The project has highlighted the procedures that are involved in the development of a web-based IQ test.
Cite This Work
To export a reference to this article please select a referencing stye below:
Related Services
View allRelated Content
All TagsContent relating to: "Information Technology"
Information Technology refers to the use or study of computers to receive, store, and send data. Information Technology is a term that is usually used in a business context, with members of the IT team providing effective solutions that contribute to the success of the business.
Related Articles
DMCA / Removal Request
If you are the original writer of this dissertation and no longer wish to have your work published on the UKDiss.com website then please:


