Base Isolation Devices for Seismic Isolation
Info: 32649 words (131 pages) Dissertation
Published: 11th Dec 2019
Tagged: Environmental StudiesTechnology
Index
CANDIDATE’S DECLARATION ……………………………………………………..….. i
ACKNOWLEDGEMENT……………………………………………………..………..…ii
index ……………………………………………………………………………..……..iii
List of figures …………………………………………………………….………… vi
List of tables …………………………………………………………………….…. ix
List of abbrivation ………………………………………………………………. xi
abstract …………………………………………………………………..…………. xi
1.2.3 Friction pendulum bearing
1.3 advantages of base isolation
1.4 Goals of seismic isolation
1.5 Fundamental CONCEPTS OF base isolation
1.9 Origination of Dissertation
2.2 Design of Base Isolation Parameters
2.3 Analysis of base isolation buildings
2.4 Effect of soil condition on the seismic response of base isolation structures
2.5 Optimization of Base Isolation Parameters
3 VALIDATION OF RESEARCH PAPER
3.2 Case study of hospital building
3.2.1 Building Details Used for Analysis
3.2.2 Comparative Analysis of Fixed Base & Isolated Base models
4 Design and Analysis of isolated base structures
4.2 The Design and properties of LRB devices
4.3 Modelling & Analysis of Base Isolation structures
4.5 Modeling & Analysis of fixed base and isolated base buildings
4.5.4 Time History Plot-Fixed Base
4.5.5 Pseudo-Spectral Acceleration, PSA
5 effect of soil condition on seismic response of base isolation buildings
5.2 Response Spectrum Analysis (RSA)
5.4 Modeling and analysis of soil condition effect in fixed & isolated base buildings
5.4.2 Sectional & Material Properties
5.4.3 Support and boundary condition
5.5 Analysis Specification and Results
5.5.1 Matched Response spectrum -Time History Function
5.5.5 Time history base shear- FX
5.5.6 Spectral Acceleration at Roof
5.5.7 Spectral Displacement at Roof
6 Optimization of base isolation parameters Using genetic algorithm
6.2 develpoment the model of base isolation buildings
6.3 using Genetic Algorithm for optimiztion study
6.4 Optimization of base isolation parameters
6.5 Optimum parameters and performance analysis of base isolation buildin
7.2.1 Design and Analysis of Isolated Base Structures
7.2.2 Effect of Soil condition on Seismic Response of Base Isolation Buildings
7.2.3 Optimization of Base Isolation Parameters Using Genetic Algorithm
List of figures
Figure 1.1 Principle of Base Isolation
Figure 1.2 Base Isolation Devices (T.Soong, 2007)
Figure 1.4 Conventional & Seismic Isolator Buildings (G. Mondal, 2005)
Figure 1.5 Shifted Period in Base Isolated Structures (R. S. Jangid, 2007)
Figure 3.1 Geometric of Building
Figure 3.2 Elevation & 3D view of The Building
Figure 4.1 Hysteresis Loop (www.dis.inc.com)
Figure 4.2 Plan of the structure
Figure 4.3 3-D view of the structure
Figure 4.4 Story Maximum Displacements of Fixed and Isolated Bases
Figure 4.5 Story Drifts of Fixed Base& Isolated Base Buildings
Figure 4.6 Modal Periods for Fixed Base & Isolated Base Buildings
Figure 4.7 Time History Plot Verse Fixed Base
Figure 4.8 Pseudo Spectral Acceleration, PSA
Figure 5.1 Response Spectrum Function in Various Types of Soil
Figure 5.2 Plane of the Fixed and Isolated Base Model
Figure 5.3 Elevation and 3-D View of the Fixed and Isolated Base model
Figure 5.4 Matched Response Spectrum-Time History Function (El Centro 1940)-Hard Soil
Figure 5.5 Matched Response Spectrum-Time History Function (El Centro 1940)-Medium Soil
Figure 5.6 Matched Response Spectrum-Time History Function (El Centro 1940)-Soft Soil
Figure 5.16 Time History Base Shear in Various Types of Soil
Figure 6.1 Flowchart for the optimization of seismic isolation systems via Genetic Algorithm Method
Figure 6.2 Isolated Base Model
Figure 6.3 Geometric of the Isolated Base Structure for Optimization Study
Figure 6.4 Story Displacements in Different Types of Soil with and Without Optimum Parameters
Figure 6.5 Story Drifts in Different Types of Soil with and Without Optimum Parameters-Linear Graph
Figure 6.6 Story Drifts in Different Types of Soil with and Without Optimum Parameters-Log Graph
Figure 6.7 Story Forces in Different Types of Soil with and Without Optimum Parameters
Figure 6.12 Time History Base Shear In Various Types of Soil With and Without Optimum Parameters
Figure 7.1 Summary Layout of Thesis and how it Meets the Research Objectives
list of tables
Table 3.1 Properties of Materials and Modeling Details
Table 3.2 Isolator Properties
Table 3.3 Seismic Response Results of Fixed-Base & Isolated-Base Models
Table 4.1: Characteristics of design LRB isolator
Table 4.2 Input date of the structure
Table 4.3 Comparison of Story Maximum Displacements
Table 4.4 Comparison of Story Drifts
Table 4.5 Modal Periods of Fixed Base & Isolated Base Buildings
Table 5.1 Response Spectrum Function – IS 1893:2002
Table 6.2 Optimum Isolation System Parameters of the Different Cases Investigated
Table 6.4 Comparison of the Story Drifts Results before and After Using Optimum Parameters (m)
Table 6.5 Comparison of the Story Forces Results before and After Using Optimum Parameters (kN)
Table 6.6 Comparison of the Spectral Acceleration before and After Using Optimum Parameters
Table 6.7 Comparison of the Spectral Displacement before and After Using Optimum Values (mm)
List of abbreviations
| ABBREVIATION | DESCRIPTION |
| BI | Base Isolation |
| DOF | Degree Of Freedom |
| EC | Europe Code |
| ED | Energy Dissipated |
| EDC | Energy Dissipated Per Cycle |
| FB | Fixed Base |
| FPB | Friction Pendulum Bearing |
| FPS | Friction Pendulum System |
| GA | Genetic Algorithm |
| HLDR | High Lead Damping Rubber |
| HS | Hard Soil |
| IB | Isolated Base |
| IS | Isolated System |
| LRB | Lead Rubber Bearing |
| MS | Medium Soil |
| PFD | Piezoelectric Friction Dampers |
| PGA | Peak Ground Acceleration |
| PRA | Peak Roof Acceleration |
| RCC | Reinforced Concrete Construction |
| RSA | Response Spectrum Analysis |
| SA | Spectral Acceleration |
| SD | Spectral Displacement |
| SS | Soft Soil |
| SSI | Soil-Structure Interaction |
| THA | Time History Analysis |
ABSTRACT
The aim of the seismic design is to protect the important building such as museums, hospitals, official buildings etc.., and reduce the damages after the seismic events. Many researchers have done a lot of researches to get the best solutions to resist earthquakes and protect survival. One of those solutions is base isolation, the main goal of seismic isolation is to shift the fundamental frequency of a structure away from the dominant frequencies of earthquake ground motion, and the other purpose of an isolation system is to provide an additional means of energy dissipation, thereby reducing the transmitted acceleration into the superstructure. The present study shows that the model of base isolation reduces meaningfully the moment and shear produced for the same mode, the results also show that the modal period increases in the isolated base model subsequently, displacement is higher in this model than fixed base model because of the flexibility of base isolation.
The effect of soil flexibility also is considered in the current study to examine the differences in seismic response. Performance analysis of the buildings fitted with isolation devices is carried out to choose the appropriate type of soil. The Study that the spectral acceleration (SA) and spectral displacement (SD) are higher in soft soil condition, which means that the response spectral of a structure is associated with soil condition. The study is also concluded that the hard soil and medium soil are suitable for base isolation building as compared to soft soil condition.
In this research also, the optimization of base isolation system parameters using GA optimization has been done for isolated base buildings. The objective was to find a set of isolation system parameters that minimizes the acceleration response at the roof of the isolated structure in various soil conditions. Time history analyses were repeated for the model parameters and the results proved that the parameters determined via genetic algorithm (GA) method were true optima. Finally, the optimum values of base isolation system calculated by GA method show the best performances and sufficiently reducing the seismic response. It is also shown that the optimum isolation system parameters determined by GA method are effective not only on objective function of optimization which was minimizing the acceleration at roof, but also on other dynamic response such as, story displacements, story drifts, story forces and base shear, proving the robustness of the proposed optimization method with respect to the variation in the characteristics of the soil condition.
CHAPTER 1
1 INTRODUCTION
1.1 General
Earthquake is one of the challenges which the structural engineers faced, as they should be more careful during design. The aim of seismic designing to protect the important building such as museums, hospitals, and official buildings…etc., and reduce the damages after seismic. Many researchers have been done a lot of research to get the best solutions to resist earthquakes and protect survivals. The idea of base isolation has been found in historical buildings in some active regions of the world where they used multi-layer stones which exhibit a less friction during earthquakes and ability to move in all directions without damages[1],[2].
One of the examples of base isolation buildings is found in some monuments of ancient Persia which back to 2500 years ago[3]. The other example of this kind is found in Dry-stone walls of Machu Picchu temple of the sun, in Peru (data back to the 15th century). In Japan, used a passive control system in the twelfth century for a five-story temple. Former Emperor Palace in Beijing, China has been constructed on the type of base isolation, because its foundation is constructed on boiled glutinous rice and lime, so the artificial ground has high damping and viscosity. A base-isolated structure was suggested by Kawai. His construction has rollers at its footings mat of logs put on different steps by lengthwise and crosswise mutually[3]. In early 20th century, a similar proposal was made in Italy in 1909 by the Commission that was given the task of making suggestions for rebuilding the area destroyed by the Messina earthquake of 1908. In 1928, Oka proposed and designed a special kind of Fudo Bank buildings in Japan. In 1968 a structure in Macedonia was constructed on hard rubber blocks. Soon after that, 1969 a primary school in Yugoslavia was constructed on rubber bearings as an isolated base for strong ground excitations. Steel rubber-laminated bearing was made at the same time in Japan. During that period, the concept of Base Isolation with utilizing rubber bearing became more a practical issue for engineers. Progressive research led to the invention a new kind of bearing named lead rubber bearing (LRB) in the 1970s. These types of bearing were stiff under vertical forces and very flexible under horizontal loads. In the early 1980s developments in isolators devices technology drives to new rubber compounds which were termed high lead damping rubber (HLDR). Friction pendulum system (FPS) was presented by Zazas in 1986, and it is another kind of base-isolating system which uses friction principles for shifting the fundamental period of the structure to a greater one and away from the destructive period range of ground motion. It is composed of dense chrome over steel concave surface in connection with an articulated friction slider and free to slide during horizontal displacements[3].
1.2 BASE ISOLATION DEVICES
Structures respond to ground motions in different ways. When the forces on a building or the displacement of the building exceed certain limits, the damage is incurred in different forms and in different extents. If a stiff structure is designed to respond elastically with no ductility, it may fail when the earthquake induces a force that is more severe than the building strength. Moreover, if the structure is designed with ductility, it will be damaged but it will still be able to weather severe ground shaking without failure[4]. As mentioned above, some alternatives to avoid significant damage in buildings in strong ground shaking are to:
- Provide the structure with unreasonably high strength (which may not be economically justified).
- Design the structure to have a normal (economically justifiable) strength following damage resistant principles; in this case despite the seismic force being larger than the building strength damage will be minimal and restricted only to easily replace sacrificial components.
- Alter the building’s characteristics through an external intervention such that even in strong ground shaking the demand is less than the design strength of the building and its components.
1.2.1 Isolated Base
Since the ground shaking is vibrational in nature, the term of vibration isolation can be utilized to withstand a structure (i.e., it is decoupled from the horizontal components of the ground motion by mounting lead rubber bearings between the structure and its foundation). Such a system not only offers safety to the structures but also to its occupants and contents [5],[6].
Isolated-base technique defined as a passive structural control where a group of structural members is used to substantially decouple a structure from its foundations resting on the earthquake, thus protective the building’s structural integrity. The top in base isolation systems is New Zealand[4].Base isolation can be utilized both for new structural design and seismic repair (e.g., San Francisco City Hall, Pasadena City Hall) have been retrofitted using Base Isolation Systems.

Figure 1.1 Principle of Base Isolation
The term of the isolated base is defined through an example building resting on frictionless rollers; as shown in Figure 1.4 (b). The rollers freely moved during ground motions, however, the mass or structure above does not vibrate. Therefore, no force is transferred to the structure due to the horizontal motion of the ground; basically, the building does not experience the earthquake. Now, if the same structure is located on flexible pads that provide resistance against horizontal movements Figure 1.4(c), then some influence of the ground shaking will be transferred to the top of the structure. If the flexible pads are appropriately selected, the forces induced by earthquakes can be much less than that introduced by a fixed base structure constructed directly on the ground (see Figure 1.4(a)). Figure 1.4(c) shows that the flexible pads which are called isolators, while the buildings protected by means of these devices are called base isolation buildings[7].The main character of the base isolation technology is that it provides flexibility into the connection between the building or structure and the foundation[8]. There are two basic types of base isolation systems; sliding systems and elastomeric bearings.
1.2.2 Elastomeric bearings
The system of the base isolation that has been used most commonly in recent years is typified by the use of elastomeric bearings, where the elastomer is made of either natural rubber or neoprene[9]. Lead-rubber bearings are generally used for this purpose; a standard lead-rubber bearing is shown in Figure 1.5(a). A rubber-bearing typically consists of alternating laminations of steel plates (shims) and thin rubber layers, attached together to offer vertical rigidity and lateral flexibility[10]. These bearings are commonly used for the bridge’s support. On top and bottom, the bearing is fitted with steel plates which are used to attach the bearing to the structure and foundation. The bearing is very strong and stiff in the vertical direction, but also flexible in the lateral direction. Vertical rigidity ensures the isolator will support the structure’s weight, while horizontal flexibility transforms destructive horizontal shaking into gentle movement. A slightly modified form of a solid lead “plug” in the middle to dissipate energy and add damping is called a lead-rubber bearing which is very common in seismic isolation of structures, as shown in figure 1.5(b).
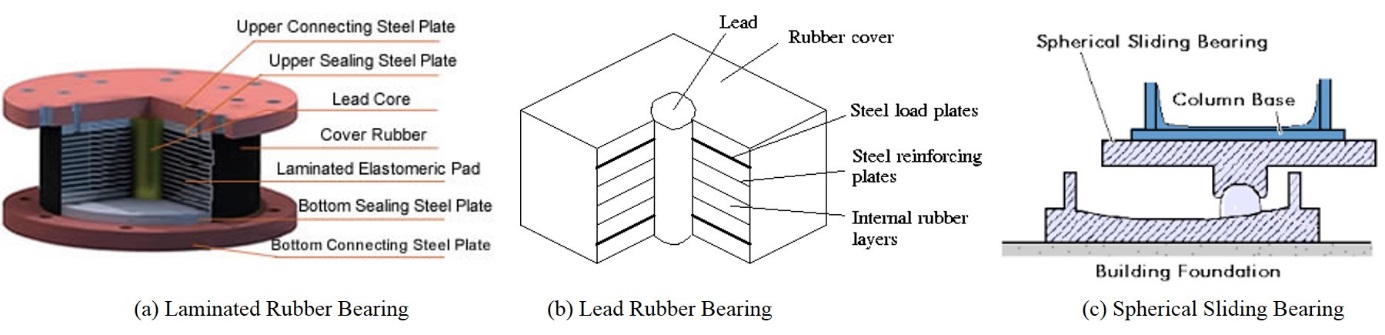
Figure 1.2 Base Isolation Devices (T.Soong, 2007)
The second basic type of base isolation system is typified by the sliding system. This works by limiting the transfer of shear across the isolation interface. Many sliding systems have been proposed and some have been used. One commonly used sliding system called “spherical sliding bearing” is shown in Figure 1.5(c). In this system, the building is supported by bearing pads that have a curved surface and low friction. During the ground motion, the structure is free to slide on the bearings. Since the bearings have a curved surface, the structure slides both vertically and horizontally. The forces needed to move the structure slightly upwards place a limit on the lateral or horizontal forces[11].
1.2.3 Friction pendulum bearing
A similar system is the Friction Pendulum Bearing (FPB), another name of Friction Pendulum System (FPS). It is based on three aspects: an articulated friction slider, a spherical concave sliding surface, and an enclosing cylinder for lateral displacement restraint [7]. Figure 1.6 shows an example of three-story residential construction on base-isolated ground-floor slab, as part of the reconstruction after the 2009 L’Aquila earthquake in Italy (Calvi, 2010), using “friction pendulum” devices[4][11].
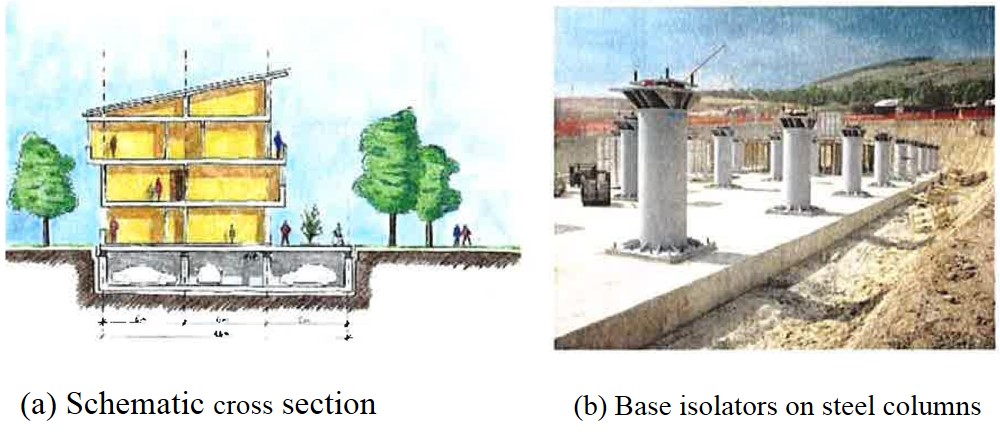
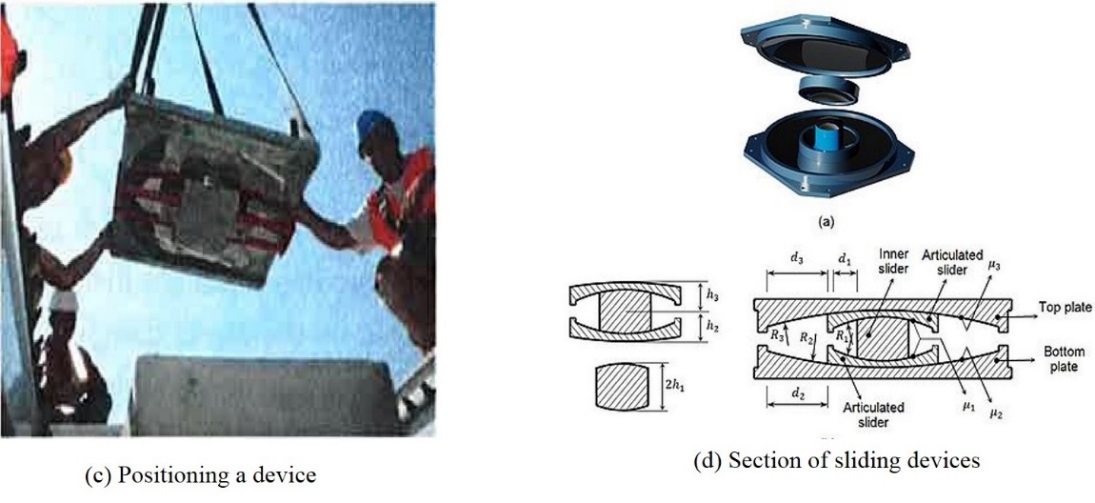
Figure 1.3 Three-Story Residential Construction on the Base-Isolated Ground-Floor slab (Calvi, 2010)
1.3 advantages of base isolation
Elements of non-structural are those which are included to or housed in the building system, but they are not part of the main load-resisting structural system of the building. These can be of three types, specifically: (i) Mechanical components, for example, boilers, storage tanks, fire protection systems, piping systems, (ii) Architectural elements, for example, parapets, ornamentations, penthouses and appendages, veneer, cladding systems, sign boards, suspended ceiling, etc., and (iii) Electrical components, for example, light fixtures, electric motors, computers, etc. Figure 1.1 shows that the effect of ground motions on non-structural elements and contents of buildings in both of the buildings, conventional buildings, and base isolation buildings, as can see the damages in non-structural component considerably is higher in conventional buildings than buildings with seismic isolators. Non-structural components are one of the sensitive elements-structure which should be considered during analysis and design of the buildings under seismic loads because they are sensitive to large floor acceleration, velocities, and displacements. In conventional buildings, when the building is subjected to earthquake motion, the building amplifies acceleration such that the result peak floor acceleration (PFAs) is higher than the peak ground acceleration (PGA) that causes a severe damage to non-structural components. The design of non-structural components to stand up after the earthquake is important factor for safety and reducing the damages
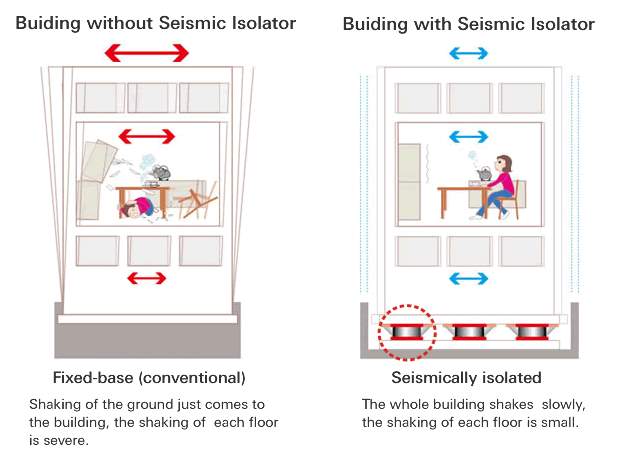
Figure 1.4 Conventional & Seismic Isolator Buildings (G. Mondal, 2005)
. In view of the isolated base structures, the energy due to an earthquake is dissipated by isolators before traveling through the structure from base to roof. Thus, the lateral force resulting the earthquake which is applied on structural elements including non-structural elements is less in base isolation system as compared with the conventional system adopted in construction. Subsequently, the chance of structural components to still stand up after seismic is higher[12],[2].
1.4 Goals of seismic isolation
One of the goals of seismic isolation is to shift the fundamental frequency of a structure away from the dominant frequencies of earthquake ground motion and the fundamental frequency of the fixed base superstructure[13],[14].Seismic isolation devices are most effective when used in structures on stiff soil and structures with a low fundamental period (low-rise building). Particularly, stiff structures are well-suited to base isolation, since they move from the high acceleration region of the design spectrum to the low acceleration region. In addition, for high stiff structures, the excitation of higher mode response is inhibited, since the superstructure higher mode periods may be much less than the fundamental period associated with the base isolation system.
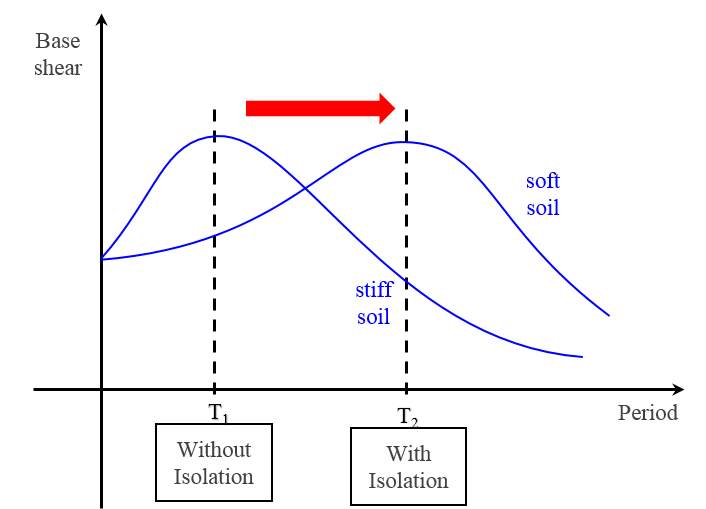
Figure 1.5 Shifted Period in Base Isolated Structures (R. S. Jangid, 2007)
The other purpose of an isolation system is to offer an additional means of energy absorption, thereby reducing the transmitted acceleration from the base into the superstructure. The aim of isolators is to isolate the superstructure from the supporting ground in order to reduce the transmission of the earthquake motion to the structure. Thus, base isolation decouples the structure from the ground during seismic. The other purpose of an isolation system is dissipated the seismic energy[13],[15].
1.5 Fundamental CONCEPTS OF base isolation
Seismic isolation is a technique for reducing the seismic risks in different types of structures, like buildings and bridges. The goal for using seismic isolation is to modify the global response and improve the structural performance. This section summarizes some of the most important concepts[16].
1.5.1 Response Regularization
Isolation is a design method to regularize the response and to modify the relative effective stiffness and strength in the structure. The isolation system affects the global structural behavior because it is an additional element providing stiffness in series with respect to the superstructure with its stiffness. The isolation layer is more flexible than the rest of the structure, hence it absorbs a large part of the displacement demand. If the isolators are designed in a correct way, providing enough displacement capacity, we can take advantage of this in the protection of the superstructure. Since the displacement demand of the superstructure is small, we can assure its elastic response. Moreover, if nonlinear isolation system devices are used, the maximum base shear transmitted to the superstructure is limited and capacity design can be performed. In this way, all the nonlinear and dissipating phenomena will occur at the isolation level, and brittle failure mode will be avoided[17],[18].
1.5.2 Period Shift
A change in global structure stiffness shifts the fundamental period of vibration. Since the isolation layer is more flexible than the superstructure, the fundamental period of the isolated structure is increased with respect to the one in the non-isolated condition, inferring to either the displacement or the acceleration demand. Thus, the isolation system affects strongly the properties of the first mode of vibration. In the isolated base structure, the fundamental mode is very different from all the other modes and it is even more important than the non-isolated case. The vertical profile of the horizontal displacements is approximately rectangular, with equal motions for all the masses. Furthermore, fundamental mode is characterized by a large participating mass, almost equal to the total mass. Therefore, the isolation system determines the first period and damping of an isolated structure, and these, in their turn, control the structural seismic response[17],[19].
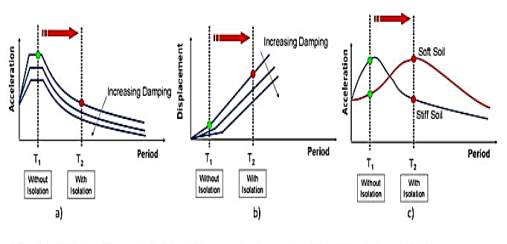
Figure 1.6 Effects Of Isolation: A) on Spectral Acceleration, B) on Lateral Displacement, C) for Different Soil Condition (F. Chatzidaki, 2011)
A building that is perfectly rigid would have a zero-second natural period. The acceleration in the structure induced when the ground moves are equal to ground acceleration, and there is zero relative displacement between the structure and ground. A structure that is ideally flexible has an infinite natural period. For this type of structure, when the ground beneath the structure moves there is no acceleration induced in the structure and the relative displacement between the structure and the ground is equal to the ground displacement. Every real structure is neither ideally rigid nor perfectly flexible and so the response to the ground motion[20].
Strong earthquakes may produce considerable negative effects on structures so that seismic isolation is used to protect both bridges and buildings. The devices are interposed between the source of motion and the primary mass of the structure. These flexible bearings isolate a building from its foundations or the superstructure of a bridge from its pier[21],[22].
1.5.3 Energy Dissipation
The presence of isolation system increases the capacity of energy dissipation of the structure. This helps to reduce the displacement demand as shown in Figure 3.b. usually we refer to the assumption according to which different structural elements contribute to the overall energy dissipation as a function of their displacements. Hence if the structural displacement demand is all localized in the isolation system and the superstructure is rigid, the isolation devices determine the energy dissipation; otherwise, if superstructure deforms, the energy is dissipated according to the isolation and to the structure dissipation contributions[15],[24].
1.6 Problem Statement
Ground motions are one of the most destructive forces of structures. Since the beginning of civilization, they have destroyed what man has built. Only recently, engineers and researchers have understood these forces sufficiently to combat them. For years, structures have been designed to withstand the most powerful earthquakes, preventing collapse or harm to occupants. This step was the most important in structural design. The safety of the inhabitants is always the most important consideration when designing a structure. In the past, the engineers were able to keep buildings upright during an earthquake, making our world a safer place.
However, seismic loading can do more damage than harming people in and around buildings. Damages of one structure worth millions of dollars, even if collapse is prevented. The stresses, fatigue and plastic deformations that are induced through seismic loads are enough to make structures unfit for use. Though structures may not collapse, earthquakes have damaged buildings to the point where even repair and renovation are not viable options. Millions of dollars have been spent on tearing down and rebuilding structures after they have been damaged. In the last century, a very important amount of money and time has been spent developing approaches to reduce the dynamic response of the isolated base structures inducing by seismic loading.
Increased flexibility has been considered by designers in order to reduce the permanent damage applied to buildings. But this allows for greater motion in the building and can be a safety hazard for those inside the building due to the falling debris during a ground motion. Additionally, the structure sways noticeably during seismic loadings or high wind if the lateral stiffness is too low and could lead to terrible failure. Although this design may be viable for some seismic applications, it does not contain a mechanism for dissipation of energy and consequently does not reduce the damage potential.
Many have applied damping devices to structures in order to reduce the vibrational response during seismic loading. This method involves a damping mass that is allowed to move in order to reduce the response. This damping mass dissipates energy by changing the momentum of the overall system and forcing seismic energy to push the extra mass rather than shaking the structure.
Another method of mitigating ground motion excitation is decoupling the motion of the superstructure from its foundation. The largest moment and shear forces in a building are most often found near the building’s base. The method described is called “base isolation”. This method includes isolating the structure from the ground or foundation. Preferably, the structure’s inertia attempts to keep the building at rest while the ground moves beneath it under seismic loading. Realistically, the building must remain on the foundation. Bearings Anchors, or pendulum sloped plates are used to bring the building back into place after the motion has stopped. Thus, an optimal design of base isolation parameters must be developed to effectively and practically dissipate energy during large earthquake events while being simple to construct and cost effective to repair. Components of base isolation theories are utilized by isolating base of the structure. This is tested to meet the goals of this thesis.
1.7 Scope of the work
Seismic isolation is an innovative seismic design approach aiming at protecting structures against damage from earthquakes by limiting the earthquake attack rather than resisting it. Although the design approach for seismic resistance has been widely used, it is not suitable for some important buildings, such as museum, historical and hospital buildings with very expensive decoration and sensitive equipment. In this research, the optimization of base isolation building parameters, such as stiffness and damping system, has been studied. For this purpose, a genetic algorithm technique (GA) has been considered to optimize the parameters of base isolation structure. However, before the optimization work, we should understand the dynamic response of base isolation as compared with conventional or fixed base buildings, so the comparison analysis of fixed base and isolated base buildings have been investigated.
1.8 Objective of the work
Seismic isolation is a technique for reducing the seismic risks in different types of structures, like buildings and bridges. The goal for using seismic isolation is to modify the global response and improve the structural performance. A few research papers published in this field, most of those researchers have done the design of base isolation and behavior the building after provided by isolators. For many purposes, it is important to optimize the component of base isolation to get the best and economical solution. So the objectives of the research are as follows:
- Investigate the efficiency of base isolation to resist an earthquake after providing the buildings by isolators comparing with conventional buildings.
- Study the effect of soil condition on the dynamic response of isolated base & fixed base structures.
- Optimize the base isolation parameters such as stiffness, damping ratio, nature frequency using Genetic Algorithm (GA) method.
- Study the efficiency of base isolation before and after using the optimum parameters.
1.9 Origination of Dissertation
Chapter-1 deals & discusses with the description about an introduction to the base isolation building, advantages, fundamental concepts and types of base isolation.
Chapter-2 discusses some of the literature and previous work on the analysis of base isolation buildings and optimization of their parameters.
Chapter-3 discusses the validation of research paper on performance analysis of isolated base & fixed base buildings.
Chapter-4 provides the design procedure of lead rubber bearing (LRB) characteristics and performance analysis of base isolation and fixed base buildings.
Chapter-5 investigates the effect of soil condition on the dynamic response of base isolation structures and comparison the results with conventional (Fixed-base) structures.
Chapter-6 in this chapter, the development of the equations of motion in seismically base isolation system, and using genetic algorithm method for optimizing the parameters of the base isolation system. It also provides the comparison of seismic response for base isolation system before u sing the optimum parameters and after using the optimum parameters.
Chapter-7 Summarizes the work accomplished and proposed future work.
CHAPTER 2
2 LITERATURE REVIEW
2.1 General
The current section presents a literature review on the effect of base isolation on the structure, the properties of isolators, the criteria for isolators design and the method of isolator design. The effect of different percentages of damping ratio displacement limitation has been investigated. Some studies concentrated on the effects of the flexibility of base isolation on the seismically behavior and structure response such as spectral acceleration, spectral displacement, story drift, story force and base shear…etc. whereas some modern researchers mainly focused on the optimization of isolator types used on multistory buildings. Some research papers listed down investigated on the isolator design differences between various seismic codes.
2.2 Design of Base Isolation Parameters
Nakashima & Chusilp (2003) [25], have investigated that a partial view of Japanese Post-Kobe Seismic Design. In Kobe earthquake, the ground motion in some regions was considerably larger than that considered in the Japan seismic design code. It leads to substantial evolution in Japanese design and construction practices. Where two limit states design (life safety and damage limitation) demonstrated with the two levels; level 1 the structure should remain elastic in small to moderate earthquakes and in level 2 sustain some yielding and plastification in some structural members in a large earthquake stipulated in 1981, Japan seismic design code, but are distinguished because of two new features. Finally, it has concluded that the Japanese seismic design code is to be revised towards more performance- based engineering.
Romallo & Johnson (1999) [26], have investigated the effects of using controllable semi-active dampers, such as magnetorheological fluid dampers, in a base isolation system. A two degree of freedom model of a base isolated building was used. The fundamental concept is to isolate a structure from ground, especially in the frequency range where the building is most affected. The goal of research is reducing in inter-story drifts and floor accelerations to limit damage in the structure and its contents in a cost-effective manner. This paper investigates the improvements that may be achieved by replacing supplemental linear viscous damping devices in base isolation with semi-active dampers. A linear, two degree of freedom (2DOF), lumped mass model of a base-isolated building is used as the test bed for this study. The system model used in this test is a single degree of freedom model that has mass and fundamental modal frequency and damping ratio. In this study, passive linear viscous damper, active damper, and semi-active damper have been used. Generalized semi-active, as well as magnetorheological fluid dampers were used in the seismic protection system.
Authors have concluded that the semi-active dampers are able to accomplish nearly as much as the fully active damper. With the semi-active damper, the peak base drifts were decreased as compared to the optimal passive linear damper. This study suggests that semi-active dampers, such as magnetorheological fluid dampers, show significant promise for using in base isolation applications with greatly reduced power requirements as compared to the active systems.
Ramallo et al. (2002) [27], have presented an innovative base isolation strategy and showed how it can effectively protect the structures against extreme earthquakes without sacrificing performance during more frequent and moderate seismic events. This innovative concept includes base isolation system with semi-active or controllable passive dampers for seismic response mitigation. In this method, the structure is modeled as a single degree-of-freedom system representing the fundamental mode. When the isolation layer is added, the augmented model is a two degree-of-freedom system. This investigation has been shown experimentally that the linear behavior of low-damping rubber bearings can extend to shear strains above 100%. Rubber bearings are considered as the baseline against which the smart damping strategies are compared. The lead rubber isolation in these two systems is identical. The several ground excitations are used for modal excitation.
A family of controllers that decreases base drift and absolute accelerations (compared to the LRB) is obtained for a controllable smart damper. The base isolation system, comprised of low-damping elastomeric bearings, and controllable semi-active dampers, was shown to have superior performance compared to several passive base isolation designs using lead-rubber bearings.
Wen & Baifeng (2008) [28], have presented the design of base isolation building. Two stages design method for the isolated base structures were put forward. In the first stage, the assessment of isolation layer, and only a few basic data of building was required. In the second stage, detail design along with the step-by-step time history analysis was carried out for determination of foundation, superstructure and base isolation device. Computer software based on above procedure with the user-friendly interface, pre-processor, and post-processor was developed for practical engineering design of superstructure and foundation. The main content of isolated base building design consists of two parts: the first part, is a design of the isolated-base devices, and the second part, is a design of the structural elements above the isolation layer. The study shows that in first step design method, base isolation device lengthens the natural period of structure, in which the dynamic characteristic of the structure has been changed to achieve the goal of reducing the earthquake influence on the superstructure. After the first step, base isolation device has tentatively selected depend upon the total lateral stiffness of isolation layer. In the second step design method for seismic isolation structure is used to determine earthquake resistant capacity of the base isolation building and optimize parameters and arrangement of base isolation device.
It has been concluded that the calculation result of two-step design method is practical and simple, and its concept is easy and clear for further expansion and application. The method is valuable to improve design quality and reduce the period of design. The simplified method is suitable for multi-story isolation building. With the increase of the layer number, effect of higher modes increased. The method is not adapted for high-rise isolation building.
2.3 Analysis of base isolation buildings
Sayani & Ryan (2009) [29], have been investigated that comparative evaluation of base-isolated and fixed-base Buildings using a comprehensive response index based on response history analysis to a suite of motions, constant ductility spectra are generated for fixed-base and isolated buildings. Both superstructure force _base shear_ and deformation demands in base-isolated buildings are lower than in fixed-base buildings responding with identical deformation ductility. To compare the performance of many systems or to estimate the best system to accomplish a specified performance objective, a response index is developed and utilized for rapid prototyping of response as a function of system characteristics. When estimated for a life safety performance objective, the superstructure design base shear of an isolated building is competitive with that of a fixed-base building with the corresponding ductility, and the isolated base building generally has enhanced response. Isolated base buildings can meet a moderate ductility immediate-occupancy objective at low design strengths, while comparable ductility fixed-base buildings fail to meet the objective. The possibility of allowing the superstructures of isolated base buildings to response elastically, with deformation ductility comparable to those of fixed-base buildings has been investigated. Time history analysis results have demonstrated that for given comparable ductility, force reduction factors R in base isolation buildings are smaller than in fixed-base buildings, but superstructure design forces in isolated base buildings can still be reduced significantly.
Providakis (2008) [30], has studied the effect of lead rubber bearing isolators (LRBs) and supplemental viscous dampers under earthquakes with large velocity pulses on base isolation buildings, to examine the isolated buildings under critical ground motions. The author used nonlinear time history analysis to examine the response of isolated building under a critical case. The analysis has been done by using commercial structural analysis software package to read the effect of isolation damping ratio on base and drift of superstructure. The effectiveness of providing supplemental viscous damping for reducing the isolator’s displacement while keeping the substructure forces in reasonable ranges is also investigated.
It concluded that the high values of drifts produced at higher levels of supplemental damping are greater than those produced in near-fault ground motions. This implies that beyond some levels of supplemental damping, the isolated buildings still remain vulnerable to damage if drifts are not controlled carefully. More extensive and detailed analyses are needed to verify the findings reported. The extension of this study to different structural and base-isolation systems under near-fault and far-fault excitations should be performed. Furthermore, the evaluation of a structure’s response in terms of floor accelerations could also lead to important results.
Salic et al. (2008) [31], have demonstrated the effect of the dynamic response of the seven-story residential building under the earthquake ground motions. Natural frequencies, mode shapes, and damping ratios of the existing fixed-base building are obtained by Ambient Response Testing and Modal Identification Software (ARTeMIS). Dynamic analyses of both models (The fixed base model and isolated base model) has been performed by ETABS software. The seismic responses of FB & IB models calculated for four types of real earthquake time histories of various frequency characteristics whose value is determined based on the detailed site response analysis.
The authors have shown that increase of the natural period of the building increases the flexibility of the same building. In the isolated base model, base shear force is extremely reduced. Increased flexibility of the system led to increasing of the total displacements due to the elasticity of the existing isolation. Implementation of the base isolation system resulted in the reduction of the story drifts. Analysis of seismically isolated base model has shown significant reduction of the spectral accelerations.
Kilar & Koren (2008) [32] have investigated four-story RCC building designed according to Euro Code 8 for seismic analysis and performance evaluation (N2 method). Various sets of base isolation devices are considered for the study. The first case is the use of normal rubber bearing and the second one is the use of hard lead rubber bearing as an isolated base system. For the study of each system, a soft, simple and hard rubber stiffness with altered damping values were used. Nonlinear pushover analysis was performed on SAP 2000 software.
In this investigation, it is showed that the stiffer isolators with higher damping give smaller target base displacements as compared to softer one with lower damping. It can also be seen that the displacement of the superstructure is smaller if the softer isolators are used. The smallest displacement can be expected with the use of softer isolators with higher damping. If the used isolators are too stiff, it cannot protect the superstructure. For the analyzed test building, the damage obtained by the pushover analysis was recorded only for the isolators with hard lead rubber bearing and for the normal rubber with very low damping.
Saiful Islam et al. (2011) [33], have analyzed a soft story building for seismic loading by creating a building model having a lot of open spaces. The soft story creates the major weak point during the earthquakes which means that during the event when soft story collapses, it can make the whole building down. It causes very extreme structural damage and structure becomes unusable.
This research includes the placement of two types of isolators, the first is lead rubber bearing (LRB) and the second one is high damping lead rubber bearing (HDRB). Each story is provided by isolators and its consequences were studied for different damping values. Finally, the study reveals that use of isolators is the most beneficial tool to protect soft story buildings under strong earthquake ground motions. Provision of normal lead rubber bearing is more effective than high damping lead rubber bearing because as time period increases in high damping lead rubber bearing, acceleration also increases which is undesirable to protect structure during ground shaking. This condition is exactly reverse in case of lead rubber bearing. It has been also demonstrated the response of isolated base building and arrangement of bearing in the building. As damping offers sufficient resistance to building against service loading, different damping values are taken into consideration for this investigation. This study also deals with the basic requirement for installation of isolators. Finally, it has concluded that the damping, flexibility and resistance to service loads are the basic parameters which affect for practical isolation system to be incorporated in structures. Additional requirements such as cost, durability, ease of installation and specific project requirements effects device selection; but all practical systems should content these essential elements.
Sarno (2007) [34], has presented the structural analysis of the complex irregular multi-story RC frame used for the hospital building. It was carried out by means of modal analysis with response spectrum. The structure exhibits large mass eccentricity due to its irregularity in shape. The structure is provided by circular shape high lead damping rubber bearing as per required diameter in accordance with Euro Code 8 to performance as a base isolation system. The main objective of this work is to enhance the seismic resistant design approach by studying the properties like lateral flexibility to increase structural period and reduce the transfer of seismic energy from the foundation to the superstructure; second property is the dissipation of energy (due to relatively high viscous damping) to reduce horizontal displacements; and the last one is the provision of sufficient stiffness at slight displacements to provide proper rigidity to the structure. This case study shows that base isolation technique is an effective strategy to enhance the seismic performance for relatively flexible framed structures at serviceability point of view.
It also concluded that the relatively high lateral flexibility of the superstructure apparently reduces the advantageous effects of the base isolation system. It is shown that although the base isolation and the fixed base buildings may undergo the same maximum accelerations the structural and non-structural damage are prevented in the frame resting on rubber devices. Savings of about 40% were predictable for the percentage of steel reinforcement to be used for the beams and columns of the base isolated building.
2.4 Effect of soil condition on the seismic response of base isolation structures
Jayalekshmi & Chinmayi (2016) [35], have been studied that the effect of different soil conditions by considering the conventional structures, assuming as a fixed supported in the base the soil beneath the base changed for modeling according to IS 1893 code and Euro Code 8. The models for analysis considering multi-story reinforced concrete framed buildings, with and without shear wall placed at core and all four corners of the exterior frames of building considering, the influence of soil condition is considered to study the response of each model under specific cases, such as spectral acceleration, modal period, story drift, base shear obtained following the seismic provisions of European code and Indian standard code IS 1893. The paper concluded that the value of base shear obtained for the symmetric geometric building is less in the buildings with the shear wall at all the four corners and fundamental natural periods of the soil-structure system are more than the corresponding values of the same building with fixed-base. It increases with increase in flexibility of soil and increase in height of the building and decreases with the addition of shear wall. It also concluded that Significant differences are observed between the base shear values evaluated using the IS and EC8 codes. EC8 provisions give a higher value of base shear for buildings than the IS code.
Mr. Magade & Prof. Patankar (2008) [36], have studied the dynamic response of buildings with the influence of soil interaction. A common design practice for seismic loading assumes the structure to be fixed at their bases. In reality the supporting soil medium allows movement to some extent due to its characteristics to deform. This may possibly decrease the total stiffness of the structural system and hence may increase the natural periods of the system, such effect of partial fixity of structures at base level due to soil flexibility intern alters the response. Such an interdependent manners of soil and structure regulating the total response is attribute to as soil structure interaction. The soil flexibility effect is proposed to be accounted through consideration of springs of specified stiffness. Therefore the change in the natural period due to the influence of soil structure interaction may be the main issue from the viewpoint of design considerations.
The authors show that consideration of various parameters such as soil-structure interaction, soil condition, the stiffness of shear walls, and position of walls influence on time period, displacement and base shear of building considerably. Hence it is important to consider to all these parameters in the analysis of structures. It also concluded that shear walls located in the central part of the multistory building produce less displacement and extra base shear compared to other configurations.
Gjorgjiev (2012) [37],has demonstrated the effects of medium soil on performance analysis of isolated buildings. In conventional modeling of structures, soil-structure interaction is often not taken into consideration. This leads to differences in the response of the structure. Base isolation is aimed at uncoupling the superstructure from the foundation, reducing hence the structural internal forces. For the three decades later, there have been done a lot of researches to prove the efficiency of base-isolation on the seismic response. The approach for design and analysis of base isolation buildings is usually based on the fixed base assumption where soil-structure interaction (SSI) effects are not taken into account. The presented study was aimed at analyzing the effects of SSI on base isolation buildings. The effect of SSI on the dynamic response was shown by analysis of the results obtained for two models: the first model represented a base isolated building, whereas the second model included the effect of the soil medium. In the presented study, three types of soil were taken into account, specifically hard, medium and soft soils, as mentioned in Euro-code 8. The sub-soil profiles are represented four layers which rest on the bedrock by 30m thick soil in each layer. The model of finite element boundaries was composed of newly programmed infinite elements to eliminate the reflection of the seismic waves back to the model. The base isolated building was supported by four high damping rubber bearings (HDRB). The horizontal behavior of HDRB was considered as bilinear. The results from the performed 2D nonlinear dynamic analysis show that, in addition to the soil medium considered in the analysis, the structural properties and soil characteristics play a considerable role in the dynamic response of base isolation buildings. Attention should be paid in case of base isolation buildings founded in soft soil conditions because the soil flexibility can considerably increase the internal structural forces.
Hatami (2015) [38], has studied the effects of Soil-Structure Interaction on the seismic response of base isolation in high-rise buildings. In this investigation, 10-story base isolation structure, designed according to IBC, 2009 guidelines, is selected as a case study. A semi-infinite cone model has been used to estimate base soil properties of structures embedded in layered flexible half space. Three various soil types are selected according to soil classifications in the code. The analysis has been achieved using Loma Prieta and Northridge’s time history earthquakes considering the Soil-Structure Interaction (SSI) effects or base isolation system. The comparison of base shear, natural period, and overall relative displacements of the structure has been realized rely on analytical models. Numerical results demonstrate that Soil-Structure Interaction has negligible effects on the ratios of base shear of this type of buildings on the very stiff soil. As well, Damped periods of base isolation buildings resting on the soft soils, have been increased regardless of the height of the building or shear-wave velocity.
Alam & Bhuiyan (2013) [22], have discussed the influence of soil interaction on seismic response of isolated highway bridge pier, this paper is dedicated to conducting the seismic performance evaluation of a seismically isolated highway bridge pier incorporating the soil-interaction, subjected to low to medium far-fault earthquake ground accelerations. Lead rubber bearings (LRB), manufactured using high damping rubber material, are used in the seismic isolation of the bridge pier. In seismic performance evaluation of the pier, using a standard direct time integration method of nonlinear time history analysis has been achieved by incorporating the nonlinear mechanical behavior of the isolation bearing, pier and footing-soil. A viscous-elastoplastic rheology model of LRB, a bilinear force-displacement relationship for pier and an equivalent linear model for footing-soil interaction are employed in the analysis for realizing their mechanical behavior under seismic excitations. For understanding the soil-structure interaction, the equivalent model is used between foundations and its surrounding soil comprises linear translational spring and dashpot components. The dynamic responses of the bridge pier considered in the performance evaluation are pier displacement, foundation displacement, bearing displacement and deck displacement. The analyses outcomes have presented that soil-structure interaction effects may be neglected in the dynamic analysis of seismic-isolated bridges constructed on stiff/very hard soil; however, the soil structure interaction effects need to be carefully considered for bridge structures in soft soil conditions.
2.5 Optimization of Base Isolation Parameters
Pourzeynali & Zarif (2008) [1], have been studied the dynamic response of tall building, supported on the base by lead-rubber isolators is achieved with both linear and nonlinear behavior, the isolated base modeled as a flexible in (X, Y) horizontal directions, and as a stiffness in (Z) vertical direction. The aim of the study is to optimize the base isolation parameters, such as stiffness, mass and damping ratio to minimize the displacement of the building at roof using genetic algorithms technique (GA). Furthermore, in order to solve the undesirable horizontal displacement of the lead-rubber bearings, a new method called the ‘‘independent story’’ (IS) system is suggested in this investigation. This system works as a big tuned mass damper. The optimum values of the base isolation parameters, specifically: their stiffness, mass, and damping ratio are calculated using the GAs by taking into consideration the nonlinearity of the isolator bearings to minimize the objective functions (TMD) system, without using any additional damping or stiffness devices except those of the structure itself. Either one full story of the building or even a part of one story can be considered the IS system. For a numerical example, a 10-story frame structure located in Mashhad, Iran is chosen. From the numerical study, the elitist non-dominated sorting genetic algorithm NSGA-II method was found to be powerfully effective in evaluating the optimum values of the parameters of the isolator bearings and minimizing the structural responses. From the results of Study, it is concluded that:
Multi-objective optimization using the NSGA-II approach is a powerful method to design the parameters of the base isolators to make the isolation system more effective.
- By calculating the parameters of the linear base-isolation system using GAs, a reduction of 64.5% is obtained for the ensemble average value (calculated for 18 worldwide earthquakes) of the building’s top story horizontal displacement response.
- By considering the nonlinearity of the lead-rubber bearings and optimizing their parameters using genetic algorithm method, further reduction can be obtained for the building’s top story displacement. However, due to the lead-rubber bearings’ plastic deformation, the horizontal displacement of the base system increases.
- In order to overcome the drawback of the bilinear isolators mentioned directly above, a new ‘‘IS’’ system is proposed. By combining this new system with the linear base-isolation system, the horizontal displacement is reduced by 82.1% for the building’s top story, while the base displacement also remains in a reasonable range.
Nigdeli et al. (2014) [39], have been studied the optimization of isolation building parameters using the harmony search (HS) optimization method. Buildings in seismic regions subjected to both near-fault and far-fault earthquakes is studied, in this research. Using Matlab with employing the HS algorithm developed an optimization program to find out optimal values of isolation building parameters. The objective was to obtain an isolation system parameters within a defined range that minimize the acceleration response of a seismically isolated structure subjected to various earthquakes without exceeding a peak isolation system displacement limit. The proposed optimization approach is applicable to linear isolation systems.
It observed that the optimum isolation systems determined via HS show the best performances taken into account the possibility of the system being subjected to earthquakes with both near-fault and far-fault characteristics. It is also revealed that the optimal isolation system parameters calculated via the proposed optimization method are effective not only under the earthquakes used in the HS but also under other earthquakes with near-fault and far-fault characteristics, proving the robustness of the proposed optimization method with respect to the variation in the characteristics of the earthquakes. In this study, linear isolation systems and low-rise base isolation buildings are taken into consideration. Medium/high-rise buildings and nonlinear isolation systems will be the subject of a future study.
Baratta & Corbi (2004) [40], have been studied, some theoretical and practical features relevant to the problem of appropriately approaching the design of an isolated base device for suitable calibration of structural isolator devices should be sensibly approached taking into consideration both the dynamical properties of the superstructure and the frequency content of the expected disturbance . The proposed procedure, developed on the basis of the knowledge of soil properties, is shown to be effective and flexible.
It concluded that the influence of sub-soil mechanical characteristics on the performance analysis of isolated base systems is studied; one also approaches by means of stochastic tools the problem of properly calibrating structural isolator devices on the basis either of the dynamical properties of the superstructure or of the subsoil filtering capacity. Properly defined energetic quantities allow to set up an optimal problem, whose solution yields the values of isolator parameters that minimize structural seismic effects at the specific site.
Etedali et al. (2013) [41], have studied the optimization of PD/PID control of smart base isolated structures equipped with piezoelectric friction dampers. The objective of this study was to develop optimum PD/PID controllers for semi-active control of isolated building equipped with PFD. Long-period pulses in near-field earthquakes lead to large displacements in the isolated base buildings. Therefore, using a semi-active control to absorb energy in isolated base structure, piezoelectric friction dampers (PFD) can be adopted. The performance analysis of a PFD is highly dependent on the strategy applied to adjust its contact force. In this investigation, the seismic control of a benchmark isolated base building equipped with PFD using PD/PID controllers is developed. Using genetic algorithms, these controllers are optimized to construct a balance between the performance and robustness of the closed-loop structural system. One of the advantages of this technique is that the controller forces can easily be evaluated. In addition, the structure is equipped with only a single sensor at the base floor to measure the base displacement. Considering seven pairs of ground motions and nine performance indices, the performance analysis of the closed-loop system is estimated. Then, the results are compared with those given by two well-known methods: LQG controllers and the maximum passive operation of piezoelectric friction dampers. The simulation outcomes show that the adopted controllers perform better than the others in terms of simultaneous reduction of spectral acceleration and maximum story displacements of the isolator. Furthermore, they are able to reduce the story displacement of the isolator systems for different ground motions without losing the advantages of isolation.
2.6 GAP of THE STUDY:
After studying various papers and investigations undertaken on dynamic response of base isolation buildings, and to optimize the parameters isolators, such as stiffness and damping system, it is found out that modelling of base isolation structures are rarely done by considering optimal parameters of base isolation to get the best solution for earthquake resistant and for protection of the buildings from several damages. This study aims to find out the seismic response of base isolation building before and after optimization via Genetic Algorithm (GA) technique with respect various types of soil, according IS code, in order to get the best and economical solution for the protection of structures, especially that which are containing valuable and sensitive equipment, like museums and hospitals.
CHAPTER 3
3 VALIDATION OF RESEARCH PAPER
3.1 Introduction
Hospital facilities must withstand safely after the ground shaking, for providing routine medical services and to save the life of human beings. Hence, to relieve the response of seismic on the structure many engineers and architects are trying to find out the best applicable method to reduce the seismic response given to structures by ground motion. Base isolation is one of the best alternatives for this challenge. During an earthquake, the conventional buildings without seismic isolation are subjected to substantial story drifts, which may produce to damage or even collapse of the structure. While the isolated base structure moves almost as a single body with large displacement due to the presence of isolators at the base of structures. In the base isolation technique, the flexible interface is presented between the superstructure and its foundation from ground motion thereby increasing the fundamental time period of the structure[42].
3.2 Case study of hospital building
(G+12) RCC hospital structure is considered for the case study and it is proposed to be located in IV zone as per IS: 1893-2002. It is modeled in SAP2000-7 software and analyzed for the fixed base model and isolated base model. High-density rubber bearing (HDRB) and friction pendulum system (FPS) isolator at the base are adopted as isolator devices in the base of models. The non-linear time history analysis is performed by considering El-Centro earthquake. Comparison results of the fixed base model and the base isolated model are studied. The parameters of both models; such as base shear, time periods, story displacements, story drifts and story acceleration are compared after reading the results of analysis [42].
3.2.1 Building Details Used for Analysis
The plan and 3D view of the 13-stories hospital building which taken as a model in this case of study are as shown in Figure 3.1 and Figure 3.2 respectively[42].
The structural details such as grade of concrete, grade of steel, beam sizes, column sizes and all the other parameters are assumed as per Table 3.1. Properties of base isolators used for the analysis is as shown in Table 3.2.
Table 3.1 Properties of Materials and Modeling Details
| Grade of concrete | Grade of steel | Story height | Plinth height | Parapet height | Slab thickness | External wall | Internal wall |
| M 40 | Fe 415 | 3 m | 1 m | 1.2 m | 150 mm | 230 mm | 150 mm |
| Columns | Beams | Live load | |||||
| 450 × 450 mm | 300 × 500 mm | 3 KN/m2 | |||||
Table 3.2 Isolator Properties
| Properties of Isolator | HDRB |
| Vertical stiffness (U1) | 2812845.46 KN/m |
| Linear stiffness (U2&U3) | 2454 KN/m |
| Non-Linear stiffness (U2&U3) | 2069.24 KN/m |
| Yield strength (Qd) | 130.14 KN |
| Damping (β) | 0.10 |
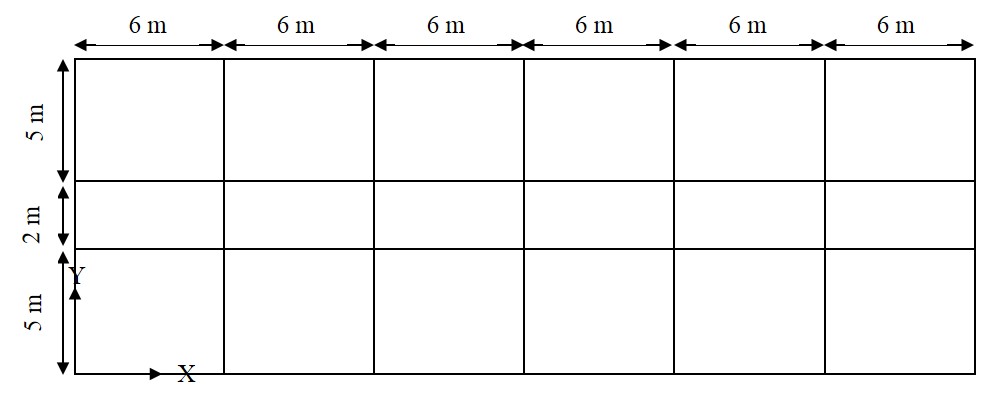
Figure 3.1 Geometric of Building
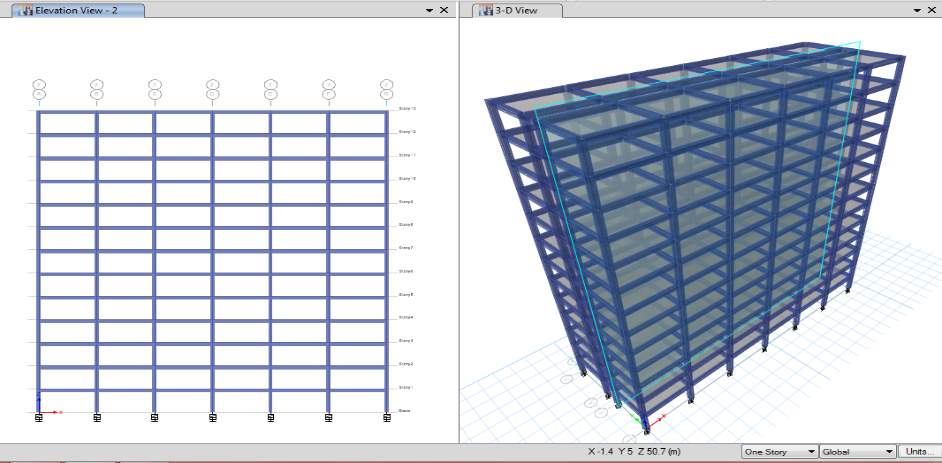
Figure 3.2 Elevation & 3D view of The Building
3.2.2 Comparative Analysis of Fixed Base & Isolated Base models
The analysis of models shows that the investigated isolation model has the unique modal feature to isolate the buildings to control effectively. Specifically, the response of isolated base clearly demonstrates a far different time period of response compared to the fixed base model. As can see in Table 3.3, the fundamental period of the isolated base model is 2.94sec, and 2sec in the fixed base case, that attribute to the flexibility of isolation base model which introduced by isolators devices.
The results also shows the maximum of base shear in both models, Table 3.3 report the maximum values of base shear in both cases; where the fixed base model produced 13000kN, while the case of isolation base produced 3950kN with approximately 70% difference, which gives us evidence that the base isolation model more flexible than fixed base model.
The most important of seismic response in the structures is the spectral acceleration introduced due to ground motion. The analysis of models shows that the spectral acceleration at the roof is 4.52m/sec2 in the fixed base model and 1.45m/sec2 in the isolated base case. (See Table 3.3), the acceleration reduction in isolated base model because of the seismic energy dissipated most of its energy by isolated devices in the base. The following results show that comparing between fixed base and base isolation by using high damping bearing rubber (HDBR) isolators
Table 3.3 Seismic Response Results of Fixed-Base & Isolated-Base Models
| Case | Paper Results | Calculated Results |
Diff % |
||
| Fixed Base | HDBR Isolator | Fixed Base | HDBR Isolator | ||
| Time period (sec) | 2 | 2.94 | 1.986 | 2.939 | 32.43 |
| Base shear (kN) | 13000 | 3950 | 12935 | 3972 | 69.30 |
| Displacement (m) | 0.14 | 0.21 | 0.13958 | 0.208 | 32.89 |
| Acceleration at roof (m/s2) | 4.52 | 1.45 | 4.479 | 1.4384 | 67.92 |
3.2.3 Conclusion
- Base isolation model has proved to be a suitable method of earthquake resistant design.
- The results of the models show that the response of the structure can be reduced by using of high-density rubber bearing (HDRB) isolators.
- The maximum of base shear in X-direction is reduced by 70% in the isolated base model as compared with the fixed base model.
- The fundamental period of the base isolated structure i.e. HDR increases as compared to the fixed base structure with 32% percentage.
- The story displacement is more in both directions, in the case of the isolated base structure using HDRB with 33% difference.
- Results show that the story acceleration considerably reduced by using base isolation devices over the conventional structure with 68% difference.
Chapter 4
4 Design and Analysis of isolated base structures
4.1 introduction
The design of base isolation devices is a repeated procedure similar to the other common design methods. The procedure of the design steps can be conducted simply by either using spreadsheets or developing own design software programs. The design of seismic base isolation systems begins with a preliminary design step on which the structural mass and vertical loads on the isolators are calculated. After the target period of the isolated structure is assumed, the required horizontal stiffness is determined. Then, the maximum lateral displacement that the isolator should satisfy is computed. Finally, a seismically isolated base system is designed in accordance with the parameters of vertical load capacity, required horizontal stiffness, target period, horizontal displacement limit, and stability of the isolation base system. The code provisions of elastomeric isolators and mechanical properties are presented in the following sections of the chapter [20],[19].
4.2 The Design and properties of LRB devices
LRBs are consisting of a standard elastomeric laminated rubber bearing. The rubber compound can be of chloroprene rubber or natural rubber. The shape can be either rectangular or round. For this testing, a circle shape is chosen. The LRBs are usually made with low-damping (unfilled) elastomers with shear modules of 0.4 −1.2N /mm2 and lead cores with diameters ranging 15% and 33% of the bonded bearing diameter for circle bearings. The minimum of shear modulus 0.4N /mm2 is taken for the testing performed. The elastomer offers the isolation and recanting, while the lead core provides the damping component or the necessary dissipation of energy. The maximum shear strain value is normally between 125% and 200%. The inner steel layers do not only grant for good load capacity, however for a suitable confinement of the lead core as well. The yield stress of the lead core is depending on the temperature: 18MPa at 35°C, 10MPa at 75°C, 7MPa at 125°C and 4MPa at 225°C. Consequently, after one load cycle it can be assumed that the yield stress is 13MPa and after three cycles are 11MPa. The yield stress value of 11MPa is assumed for the testing [43],[44].
The calculation of a LRB is carried out in following steps:
- Deciding the minimum bearing rubber diameter depending on vertical loads: the maximum admissible stress on LRBs is considered to be 15MPa. Every bearing is supporting a weight of 75kN which is due to the facilities mass, but in the whole-4thfloor case, there are bearing supporting also 150kN.
- Setting the target period
Keff(2 seconds appears to be the desired one) and the effective damping β, which are related respectively to the structure modes and with the bearing typology (from 15% to 30%, depending on the lead-core size);
- Reading the spectral acceleration (Sa) from the response spectrum graph in relation to the desired period.
- Getting the spectral displacement, that is the design displacement which is calculated as:
dbd=Teff2πSa (4.1)
- The required stiffness to provide a
Keffperiod is the effective stiffness, calculated as:
Keff=2πTeff2Wig (4.2)
Where
Wiis the weight on the isolator;
- The global energy dissipated per cycle is calculated by:
ED=2πKeffdbd2β (4.3)
- The relationship of these quantities to the two lead-plug bearing parameters
F0and
Kris:
Keff=Kr+F0dbd (4.4)
And
ED=4F0dbd-dy (4.5)
Where
dy=F0Ke-Kp (4.6)
And as an approximate rule of thumb
Ke≈10Kp;
- Neglecting
dy, a first approximation of
F0can be found:
F0=ED4dbd (4.7)
- The post-elastic tangent stiffness can be found as follows:
Kp=Keff-F0dbd (4.8)
- A correction can be made on the F0 value with:
dy=F09Kp (4.9)
F0=ED4dbd-dy (4.10)
- The lead yield stress of the is
σpb=11MPa, so that the lead-plug diameter needed is:
F0=πDpb24σpb⇒Dpb=4F0πσpb (4.11)
- It can define the
Kpcontribute with:
Kp=F0dbd (4.12)
- The total rubber thickness can be now defined with:
Kr=Keff-Kpb (4.13)
Kr=GπDbearing24tr⇒tr=GπDbearing24Kr (4.14)
Where G is the shear module (varying from 0.4 to 1.1 MPa);
- The response force is resulting, with b v as the displacement, in:
F=Kpνb+σpbπ4Dbearing2-Dpb2 (4.15)
- Some useful parameters are the first and second shape factors and the shear strain:
S=Dbearing4t (4.16)
S’=Dbearingtr (4.17)
Where t is the single layer rubber thickness.
After following all these steps the characteristics calculation of design LRB isolator is as shown in Table 4.1.
Table 4.1: Characteristics of design LRB isolator
| Design period [s] | Teff | 1.384 |
| Effective damping | b | 5.0 % |
| Design displacement [m] | dbd | 0.2163 |
| Rubber shear modulus [MPa] | G | 0.40 |
| Axial load on the LRB [kN] | Wi | 1964 |
| Effective stiffness [kN/m] | Keff | 1975.93 |
| Dissipated energy per cycle [kNm] | ED | 29.04 |
| Short term yield force [kN] | F0 | 33.56 |
| Post-elastic tangent stiffness [kN/m] | Kp | 115.35 |
| Elastic stiffness [kN/m] | Ke | 1153.5 |
| Stiffness ratio | Ke/Kp | 0.1 |
| Yield displacement [m] | dy | 0.01 |
| Yield force [kN] | Fy | 11.249 |
| Total bearing diameter [mm] | Dbearing | 457 |
| Lead-plug diameter [mm] | Dpd | 62.33 |
| Lead-plug stiffness [kN/m] | Kpd | 155.2 |
| Total rubber stiffness [kN/m] | Kr | 1820 |
| Single layer rubber thickness [mm] | t | 10 |
| Number of rubber layers | n | 20 |
| Steel plates thickness [mm] | ts | 3 |
| Top & bottom steel plates thickness [mm] | ts.ext | 30 |
| Cross sectional area of the rubber [mm²] | Ar | 147 |
| Total rubber thickness [mm] | tr | 144 |
| Shape factor | S | 10.7 |
| Second shape factor | S’ | 1.12 |
| Shear Modulus [kN/m²] | G | 1000 |
4.3 Modelling & Analysis of Base Isolation structures
Isolators can be modelled in analysis software such as SAP2000, ETABS and LARSA. When software does not support to model isolator element, a short column or a spring element may be used to simulate the isolator. The behavior of a lead rubber bearing is modelled as a bilinear hysteretic element, with an initial stiffness
Ke, secondary stiffness (
K2or
Kd), yield force (
Fy) and For response spectrum analysis, the effective stiffness (
Keff) and the equivalent viscous damping which is obtained from the isolator’s EDC (energy Dissipated per Cycle) are required[13].
For nonlinear time-history analysis, the bilinear characteristics of the isolator (initial stiffness
Ke, the secondary stiffness
K2and yield force
Fy,) are taken. The vertical stiffness of the isolators is also required as part of the element description. An interesting characteristic of elastomeric isolators is that the compression stiffness is about 100 times the tensile stiffness. Care must be taken in modelling the vertical stiffness to ensure the accuracy of the analytical results[45].
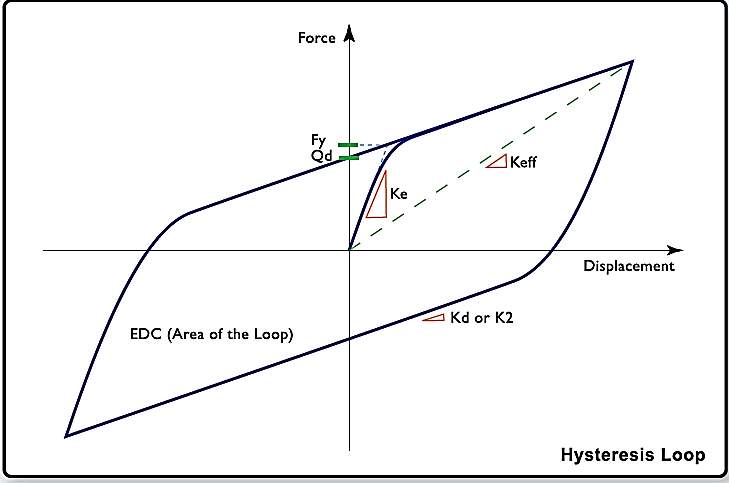
Figure 4.1 Hysteresis Loop (www.dis.inc.com)
4.4 Structure details
This section provides model geometry information, including items such as No. of stories, load cases, and type of analysis carried out.
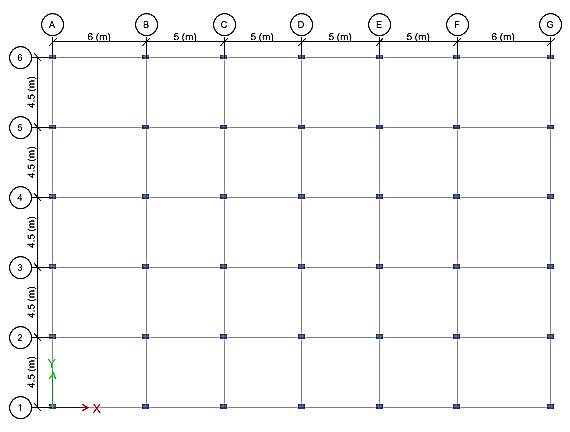
Figure 4.2 Plan of the structure
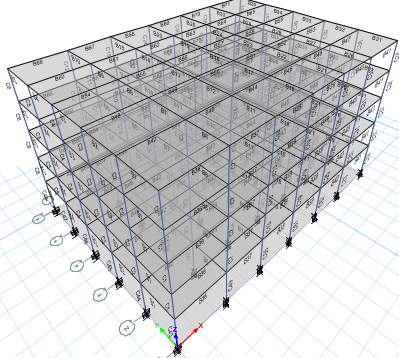
Figure 4.3 3-D view of the structure
The (G+4) RCC building is taken for the case study and its structural details such as grade of concrete, grade of steel, beam sizes, column sizes and all the other parameters are assumed as per Table 4.2.
Table 4.2 Input date of the structure
| Grade of concrete | M 25 | Seismic Zone (Z) | 0.36 |
| Grade of steel | Fe 415 | Response Reduction Factor (R) | 5.0 |
| Floor to floor height | 3.5 m | Importance Factor (I) | 1.0 |
| Ground floor height | 4.5m | Site Type | II |
| Dead load | 1.5 m2 | ECC. Ratio (e) | 0.05 |
| Slab thickness | 150 mm | Effective stiffness (Keff) | 1975.9 KN/m |
| Wall partition on beams | 2 KN/m | Force at 0 displacement (F0) | 33.56 KN/m |
| Internal wall | 150 mm | Stiffness of rubber in LBR (Kr) | 1820.74 KN/m |
| Columns | 300× 450 mm | bearing horizontal stiffness(Kb) | 436.2 KN/m |
| Beams | 300 × 600 mm | Total bearing vertical stiffness(kv) | 223199.95 KN/m |
| Live load on all floors | 3 kN/m2 |
4.5 Modeling & Analysis of fixed base and isolated base buildings
Analysis of fixed base and isolated base buildings has been carried out by linear time history and response spectrum analyses. To conduct time history analysis, Lucerne ground motion is used[46]. Using ETABS software the fixed base and isolated base symmetric buildings are analyzed. The main objective of the work is to study the dynamic response of the base isolation structure and effect the isolators on the seismic response by comparing that with the dynamic response of the fixed base structure. Thus from above design of lead rubber bearing data a base isolated symmetric building model is created and analyzed by using ETABS software. The assumed preliminary data required for analysis of structure is shown in Table 4.2.
4.5.1 Story Displacement
Table 4.3 shows the maximum displacement for both cases; base isolated and fixed base cases. The results show that at top floor the base isolation produces 32.4mm as compared to fixed base 18.5mm. This gives us an evidence that the base isolation buildings are more flexible than fixed base buildings.
Table 4.3 Comparison of Story Maximum Displacements
| TABLE: Story Max Displacements | |||||
| Story | Load Case | Direction | Base Isolation | Fixed-base | Diff |
| mm | mm | ||||
| Base | Time history | X | 0 | 0 | 0 |
| Story1 | Time history | X | 27.9 | 7.3 | 73.83% |
| Story2 | Time history | X | 29.8 | 11.5 | 61.41% |
| Story3 | Time history | X | 31.1 | 14.4 | 53.69% |
| Story4 | Time history | X | 32 | 16.9 | 47.18% |
| Story5 | Time history | X | 32.4 | 18.5 | 42.90% |
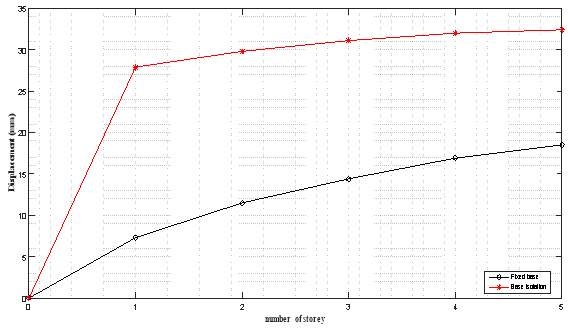
Figure 4.4 Story Maximum Displacements of Fixed and Isolated Bases
4.5.2 Story Drifts
The floor level verse story drifts graph models of the fixed base and the base isolated building are as shown in Table 4.4. In Figure 4.6 is observed that the story drifts at all stories expect story 1, in isolated base building, are significantly reduced as compared with the corresponding fixed base building. Story drift of isolated base building at story 1 is 6.195mm while in the fixed base building for the same story is 1.628mm with 73.7% difference, that attribute to the flexibility of isolator in the foundation under story 1 which taken place a large displacement in the story 1.
Table 4.4 Comparison of Story Drifts
| TABLE: Story Drifts | |||||
| Story | Load Case | Direction | Drift (m) | ||
| Base Isolation | Fixed Base | Diff | |||
| Story1 | Time History | X | 0.006195 | 0.001628 | 73.7% |
| Story2 | Time History | X | 0.000562 | 0.001197 | -112% |
| Story3 | Time History | X | 0.000365 | 0.001081 | -196% |
| Story4 | Time History | X | 0.000238 | 0.000835 | -250% |
| Story5 | Time History | X | 0.000118 | 0.000434 | -267% |
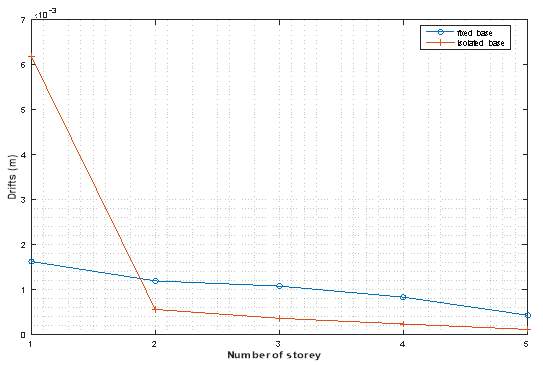
Figure 4.5 Story Drifts of Fixed Base& Isolated Base Buildings
4.5.3 Time Period
The aim of isolators is to shift and increase the time period of an earthquake. Results are reported in Table 4.5 which shows the time periods of 12 modes for both cases; fixed base model and isolated base model. Figure 4.7 shows that the time period increases in case of base isolated with 36.5 % for first model (fundamental model) as compared with the fixed base model.
Table 4.5 Modal Periods of Fixed Base & Isolated Base Buildings
| Mode | Period (sec) | ||
| Base Isolation | Fixed base | Diff | |
| 1 | 2.18 | 1.384 | 36.51% |
| 2 | 1.9 | 1.034 | 45.58% |
| 3 | 0.52 | 0.45 | 13.46% |
| 4 | 0.41 | 0.335 | 18.29% |
| 5 | 0.32 | 0.266 | 16.87% |
| 6 | 0.28 | 0.195 | 30.35% |
| 7 | 0.21 | 0.195 | 7.15% |
| 8 | 0.2 | 0.165 | 17.5% |
| 9 | 0.16 | 0.138 | 13.75% |
| 10 | 0.14 | 0.113 | 19.28% |
| 11 | 0.1 | 0.073 | 27% |
| 12 | 0.1 | 0.071 | 29% |
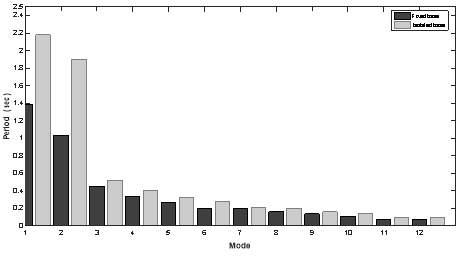
Figure 4.6 Modal Periods for Fixed Base & Isolated Base Buildings
4.5.4 Time History Plot-Fixed Base
The analysis has been carried out by non-linear time history analysis. Figure 4.8 shows that the base shear verse time, it is observed that the increase of base shear in the fixed base model as compared with base isolated model by 48.56 %. Therefore, the base isolation building sufficiently reduces the base shear during an earthquake, subsequently the energy dissipation by isolator devices.
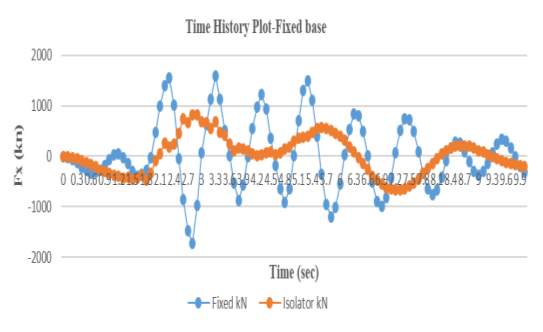
Figure 4.7 Time History Plot Verse Fixed Base
4.5.5 Pseudo-Spectral Acceleration, PSA
The seismic energy dissipation and damage control of building structures can be done by isolators. The acceleration due to earthquake reduces with the isolators at the 1st floor is as shown in Figure 4.8, after that starts increasing slightly along with increasing the number of the stories.
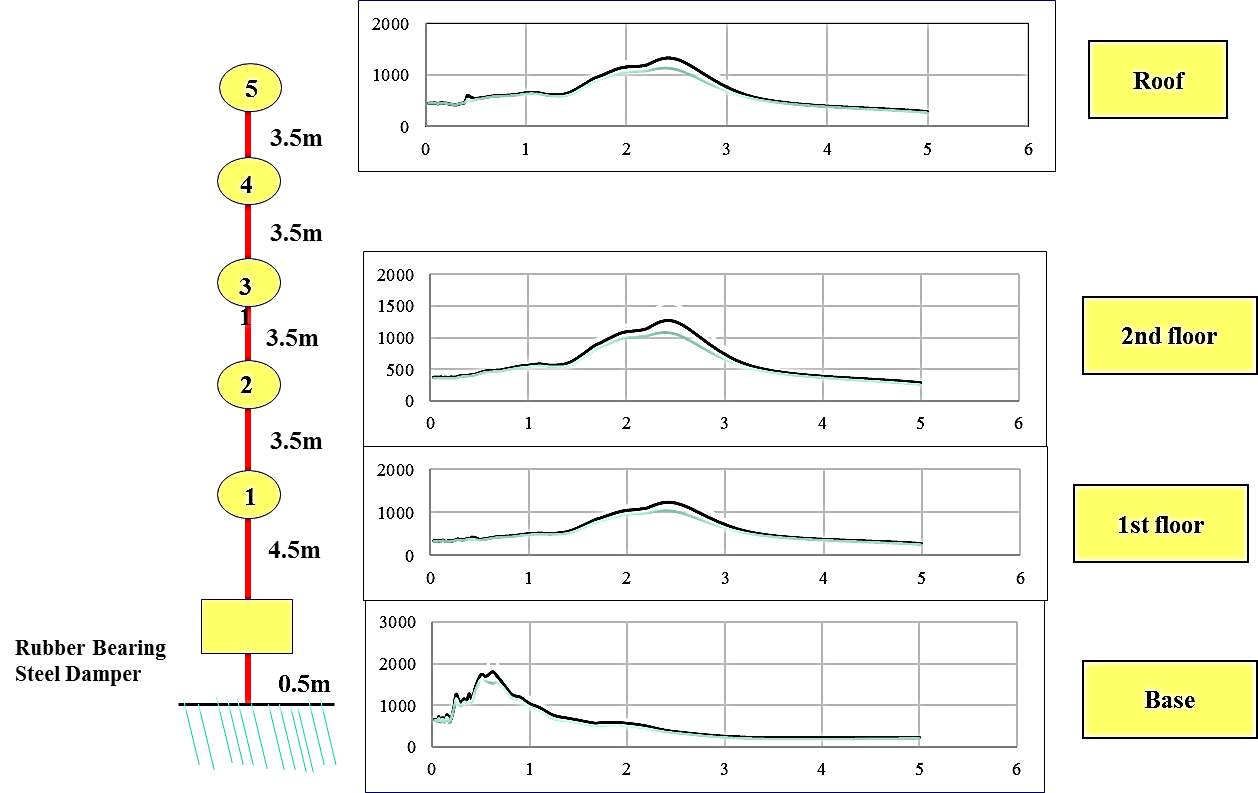
Figure 4.8 Pseudo Spectral Acceleration, PSA
4.6 Conclusion
- After providing lead rubber base isolator (LRBs), the fundamental period mode of the structure is increased by 37 % for G+4 stories building. It is concluded that the mode period is increased after providing rubber isolator due to the flexible property of the isolator.
- For time history analysis, the base shear for (G+ 4) stories building in X and Y direction for the fixed condition is 1596 kN. After providing rubber isolator the base shear is 821.5 kN. It is concluded that the base shear is decreased in base isolation model.
- As compared to fixed base structure, the base shear is reduced in base isolated structures, thus the response of building is good in base isolated structures than fixed base structures.
- The story displacement is more in the case of base isolation by 73.8 % for G+4 stories building which gives us an evidence, the base isolation model is more flexible than the fixed base model.
- It is observed that the energy of seismic dissipation by LBR isolators, i.e. acceleration is reducing in superstructure in base isolated case.
Chapter 5
5 effect of soil condition on seismic response of base isolation buildings
5.1 Introduction
The interaction of soil structure is a special field of analysis in earthquake engineering. The interaction of soil structure is defined as “The dynamic interrelationship between the structure response and the soil response is influenced by the vibration of the structure is called an interaction of soil structure.” However, engineering community discussed SSI only when the basement motion by interaction force as compared to the ground motion of free field. The stress and deformation in the supporting soil cause vibration of structure which generates base shear, moment and displacement. Since in reality it is not fixed base structure, the deformation of soil further modifies the response of the structure[36].
The literature shows the effect of soil condition mainly on type of soil rested beneath the fixed and isolated bases. Even though the buildings are of the same earthquake magnitude, same region, and same configuration but the damages that occur during the ground motion are not of the same pattern. This means that there are some factors that affects the damage pattern like earthquake characteristics, soil statement under foundations, structural system of plan, mass, stiffness, and vertical irregularities[37].
Present study has been discussed that the response of structure provided by isolators in the base of structure under three altered condition of soil, hard soil (I), medium soil (II) and soft soil (III), and discuss their seismic response such as, story displacement, story drift, story force, spectral acceleration and spectral displacement. This work has been done by Etabs software in which is the analysis carried out by time history method and response spectrum method.
5.2 Response Spectrum Analysis (RSA)
Response spectrum (RS) is one of the appropriate approaches of earthquake engineering for performance analysis of structures especially in earthquakes, since many systems act as single degree of freedom systems. Therefore, if the natural period of the system is known, then the peak response of the building can be estimated by reading the value from the ground response spectrum for the corresponding frequency. In the most building codes in seismic regions, this value forms the basis for calculating the forces that a structure must be designed to resist earthquakes[47].
A response spectrum is a plot of the maximum response amplitude (displacement, velocity or acceleration) versus time period of many linear single degree of freedom oscillators to a give component of ground motion as shown in Figure 5.1. The resulting plot can be used to choose the response of any linear SDOF oscillator, given its natural time period of oscillation. One such use is in evaluating the peak response of structures to ground motions. The first data listed from an earthquake record is usually the peak ground acceleration (PGA) which expresses the tip of the maximum spike of the acceleration ground motion.
Table 5.1 shows, with considering seismic zone (Z) =IV=0.36 & ratio damping is (5%) that the response spectrum function, according IS 1893: 2002 code for various soil conditions[48].
Table 5.1 Response Spectrum Function – IS 1893:2002
| Hard Soil-I | Medium Soil-II | Soft Soil-III | |||
| Period (sec) | Acceleration | Period (sec) | Acceleration | Period (sec) | Acceleration |
| 0.00 | 0.36 | 0.00 | 0.36 | 0.00 | 0.36 |
| 0.10 | 0.90 | 0.10 | 0.90 | 0.10 | 0.90 |
| 0.40 | 0.90 | 0.55 | 0.90 | 0.67 | 0.90 |
| 0.60 | 0.60 | 0.80 | 0.61 | 0.8 | 0.75 |
| 0.80 | 0.45 | 1.00 | 0.49 | 1.00 | 0.60 |
| 1.00 | 0.36 | 1.20 | 0.41 | 1.20 | 0.50 |
| 1.20 | 0.30 | 1.40 | 0.35 | 1.40 | 0.43 |
| 1.40 | 0.26 | 1.60 | 0.31 | 1.60 | 0.36 |
| 1.60 | 0.23 | 1.80 | 0.27 | 1.80 | 0.33 |
| 1.80 | 0.20 | 2.00 | 0.24 | 2.00 | 0.30 |
| 2.00 | 0.18 | 2.50 | 0.20 | 2.50 | 0.24 |
| 2.50 | 0.14 | 3.00 | 0.16 | 3.00 | 0.20 |
| 3.00 | 0.12 | 3.50 | 0.14 | 3.50 | 0.17 |
| 3.50 | 0.10 | 4.00 | 0.12 | 4.00 | 0.15 |
| 4.00 | 0.09 | 4.50 | 0.12 | 4.50 | 0.15 |
| 4.50 | 0.09 | 5.00 | 0.12 | 5.00 | 0.15 |
| 5.00 | 0.09 | 5.50 | 0.12 | 5.50 | 0.15 |
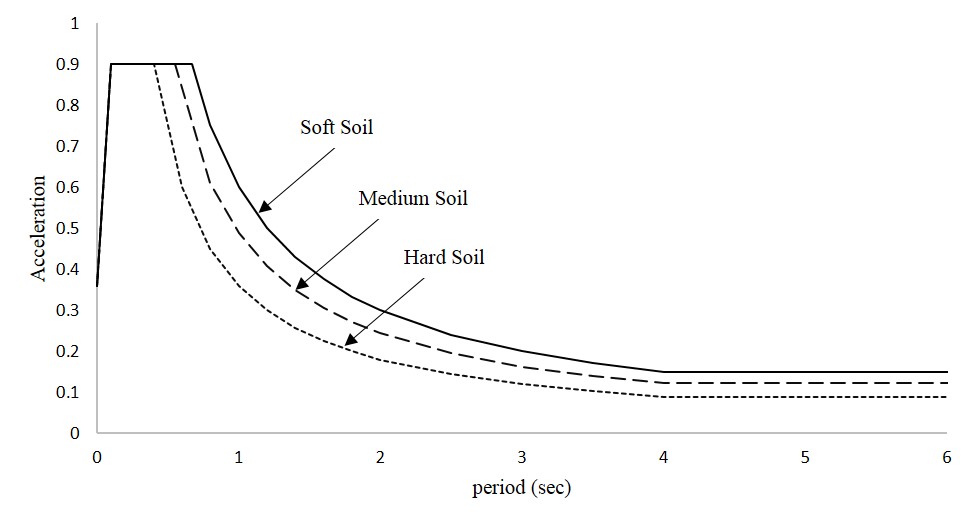
Figure 5.1 Response Spectrum Function in Various Types of Soil
5.3 Time History Analysis
Etabs Software handles the initial conditions of a time function differently for linear and nonlinear time-history load cases[49]. A description is as follows:
- Linear cases always start from zero, thus the corresponding time function must also start from zero.
- Nonlinear cases may either start from zero or may continue from a previous case. When starting from zero, the time function is simply defined to start with a zero value. When analysis continues from a previous case, it is supposed that the time function also continues relative to its starting value. A long record may be broken into multiple sequential analyses which use a single function with arrival times. This prevents the need to create multiple modified functions.
5.4 Modeling and analysis of soil condition effect in fixed & isolated base buildings
The fixed base model and base isolation model in three soil conditions were analyzed by response spectrum analysis (RSA) & time history analysis (THA) considering fast nonlinear analysis (FNA) using ETABS software to indicate the likely maximum seismic response of an elastic structure. The analysis results will show the performance levels, behavior of the structures.
To perform dynamic analysis in ETABS, following steps must be followed: i. Geometric Modeling ii. Sectional Properties and Material Properties iii. Supports: Boundary Conditions iv. Loads & Load combinations (Dynamic) v. Analysis Specification and Design command.
5.4.1 Geometric Modeling
To model any structure in Etabs the first step is to specify the code considering, units used, grid of plan, number and height of stories. For the present work 12 stories and IS units considered.
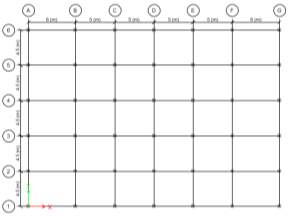
Figure 5.2 Plane of the Fixed and Isolated Base Model
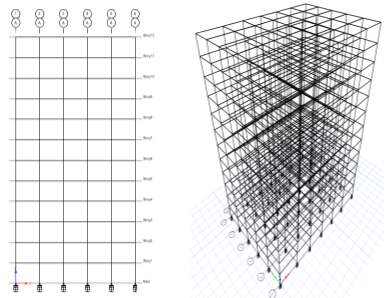
Figure 5.3 Elevation and 3-D View of the Fixed and Isolated Base model
5.4.2 Sectional & Material Properties
The element selected for modeling is then assigned the properties if the element is beam the cross section of beam is assigned. For plate elements thickness is assigned. After assigning the sectional property to the member it is important to assign it with member properties. Material properties include modulus of elasticity, poisson’s ratio; weight density, thermal coefficient, damping ratio and shear modulus
| Grade of concrete | M 25 | Seismic Zone (Z) | 0.36 |
| Grade of steel | Fe 415 | Response Reduction Factor (R) | 5.0 |
| Floor to floor height | 3.5 m | Importance Factor (I) | 1.0 |
| Ground floor height | 3.5 m | Soil Type | Hard Soil-I |
| Medium Soil-II | |||
| Soft Soil-III | |||
| Dead load | 1.5 m2 | ECC. Ratio (e) | 0.05 |
| Slab thickness | 150 mm | Effective stiffness (Keff) | 79148.6 KN/m |
| Wall partition on beams | 2 KN/m | Force at 0 displacement (F0) | 1000 KN/m |
| Internal wall | 150 mm | Stiffness of rubber in LBR (Kr) | 72932.28 KN/m |
| Columns | 450× 450 mm | bearing horizontal stiffness(Kb) | 13854.3 KN/m |
| Beams | 300 × 600 mm | Total bearing vertical stiffness(kv) | 25386991 KN/m |
| Live load on all floors | 3 kN/m2 | Damping ratio | 5% |
5.4.3 Support and boundary condition
After assigning the sectional and material properties, boundary condition is assigned to the structure in form of fixed, hinged and roller support to structure. In the present work boundary condition is assigned in form of fixed support and isolated base by assigned base with rubber isolators.
5.5 Analysis Specification and Results
Response spectrum analysis and time history analysis with respect type of soil was performed on regular building using Etabs software. The story displacement, story drift, story shear forces, spectral acceleration and spectral displacement were calculated for each floor and graph was plotted for each structure.
5.5.1 Matched Response spectrum -Time History Function
Seismic input to nonlinear dynamic analyses of structures is generally defined in terms of acceleration time series (time-history function) whose response spectra are compatible with a specified target response spectrum. Various methods have been developed to modify a reference time series so that its response spectrum is compatible with a specified target spectrum. Two of the most widely used methods, namely the Frequency Domain Method and the Time Domain Method, are available in ETABS 2015.
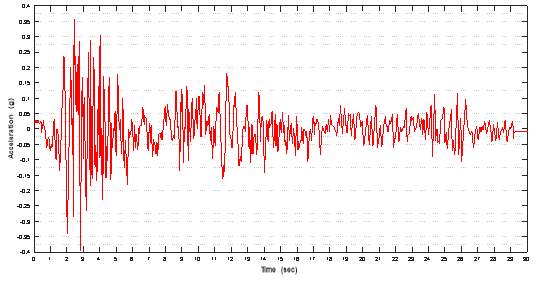
Figure 5.4 Matched Response Spectrum-Time History Function (El Centro 1940)-Hard Soil
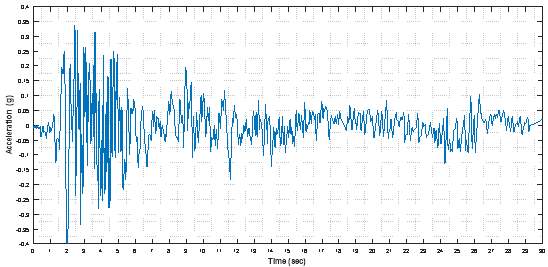
Figure 5.5 Matched Response Spectrum-Time History Function (El Centro 1940)-Medium Soil
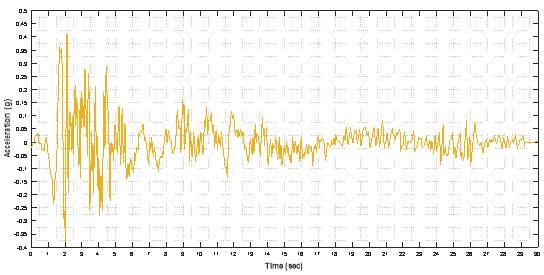
Figure 5.6 Matched Response Spectrum-Time History Function (El Centro 1940)-Soft Soil
5.5.2 Story Displacements
When an acceleration record is specified for time-history analysis, the ground motion is automatically applied to all support restraints. Etabs Software uses d’Alembert’s principle to then translate the time history into acceleration loads which are applied to structural joints. During formulation, since acceleration couples with mass, it is important that joints have mass. Acceleration loads are explained further in the CSI (Chapter XVII: Load Patterns, Acceleration Loads)[50].
Table 5.3 and Figures 5.7 to 5.9 demonstrate the maximum displacements of isolated base and fixed base carried out by response spectrum analysis (RSA) for three cases, which are; hard soil, medium soil, and soft soil conditions. At the top floor, the results of isolated base model show that the hard soil condition produces 27.7mm as fixed base produced 25.4mm with 8.3% difference. It also observed that the displacement story of the isolated base model at the roof is 37.8mm and 43.87mm for medium soil condition and soft soil condition respectively.
Similarly, Table 4 and figures 5.7 to 5.9 show that the story displacements of the isolated base and fixed base calculated by time history analysis (THA) for various soil conditions, according to IS code. It observed that the maximum displacements at roof are 29.1mm, 33.7mm and 38.1mm for hard, medium and soft soil conditions respectively. While the results of displacement at roof, in fixed base model are 26.3mm, 33.7mm and 19.2mm for hard, medium and soft soil conditions, which is mean that story displacement decrease whenever increase stiffness of soil, it also indicates that the isolated base produced displacement more than fixed base in both methods of analysis, RSA and THA. It is also observed that the results of the time history analysis are slightly more than the results of response spectrum analysis. The above discussion demonstrates that the isolated base provides more flexibility to the structure. It also demonstrates the effects of story displacement according to the soil condition and flexibility of the structure.
Table 5.3 Comparison of the Story Displacements in Various Soil Conditions for Fixed and Isolated Base Buildings by Response Spectrum analysis (mm)
| NO. of Story | Hard Soil | Medium Soil | Soft Soil | ||||||
| FB | IB | Diff% | FB | IB | Diff% | FB | IB | Diff% | |
| 12 | 25.4 | 27.7 | 8.3 | 25.7 | 37.8 | 32.01 | 26.1 | 46.5 | 43.87 |
| 11 | 24.9 | 27.3 | 8.79 | 25.2 | 37.2 | 32.26 | 25.5 | 45.8 | 44.32 |
| 10 | 24 | 26.6 | 9.77 | 24.3 | 36.2 | 32.87 | 24.6 | 44.6 | 44.84 |
| 9 | 22.7 | 25.6 | 11.33 | 23 | 34.8 | 33.91 | 23.3 | 42.8 | 45.56 |
| 8 | 21.1 | 24.2 | 12.81 | 21.4 | 33 | 35.15 | 21.7 | 40.6 | 46.55 |
| 7 | 19.2 | 22.6 | 15.04 | 19.4 | 30.8 | 37.01 | 19.7 | 37.9 | 48.02 |
| 6 | 17 | 20.7 | 17.87 | 17.2 | 28.2 | 39.01 | 17.4 | 34.7 | 49.86 |
| 5 | 14.5 | 18.6 | 22.04 | 14.7 | 25.4 | 42.13 | 14.9 | 31.2 | 52.24 |
| 4 | 11.8 | 16.3 | 27.61 | 12 | 22.2 | 45.95 | 12.1 | 27.3 | 55.68 |
| 3 | 8.9 | 13.8 | 35.51 | 9 | 18.8 | 52.13 | 9.1 | 23.1 | 60.61 |
| 2 | 5.8 | 11.1 | 47.75 | 5.8 | 15.1 | 61.59 | 5.8 | 18.5 | 68.65 |
| 1 | 2.5 | 7.8 | 67.95 | 2.5 | 10.6 | 76.42 | 2.5 | 13 | 80.77 |
Table 5.4 Comparison of the Story Displacements in Various Soil Conditions for Fixed and Isolated Base Buildings by Time History analysis (mm)
| NO. of Story | Hard Soil | Medium Soil | Soft Soil | ||||||
| FB | IB | Diff% | FB | IB | Diff% | FB | IB | Diff% | |
| 1 | 2.1 | 7.8 | 73.08 | 3.4 | 10.5 | 67.62 | 1.9 | 12.8 | 85.16 |
| 2 | 5 | 10.8 | 53.70 | 8 | 14.8 | 45.95 | 4.5 | 17.9 | 74.86 |
| 3 | 7.9 | 13 | 39.23 | 12.4 | 18.2 | 31.87 | 6.9 | 21.5 | 67.91 |
| 4 | 10.8 | 14.7 | 26.53 | 16.7 | 21.1 | 20.85 | 9.1 | 24.4 | 62.70 |
| 5 | 13.5 | 17 | 20.59 | 20.7 | 23.8 | 13.03 | 11.1 | 26.5 | 58.11 |
| 6 | 16.3 | 19.2 | 15.10 | 24.1 | 26.2 | 8.02 | 13 | 28.8 | 54.86 |
| 7 | 18.8 | 21.8 | 13.76 | 26.9 | 28.2 | 4.61 | 14.6 | 31.4 | 53.50 |
| 8 | 21.1 | 24.1 | 12.45 | 29 | 29.9 | 3.01 | 15.9 | 33.6 | 52.68 |
| 9 | 23.1 | 25.8 | 10.47 | 30.7 | 31.6 | 2.85 | 17.2 | 35.4 | 51.41 |
| 10 | 24.6 | 27.3 | 9.89 | 32.2 | 32.9 | 2.13 | 18.2 | 36.7 | 50.41 |
| 11 | 25.7 | 28.5 | 9.82 | 33.3 | 33.7 | 1.19 | 18.8 | 37.6 | 50.00 |
| 12 | 26.3 | 29.1 | 9.62 | 33.7 | 34.2 | 1.46 | 19.2 | 38.1 | 49.61 |
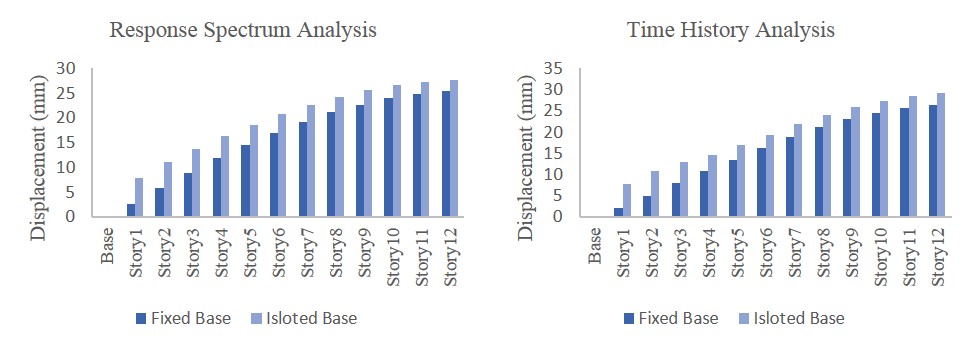
Figure 5.7 Story displacements in hard soil condition for both analyses, Time history and response spectrum
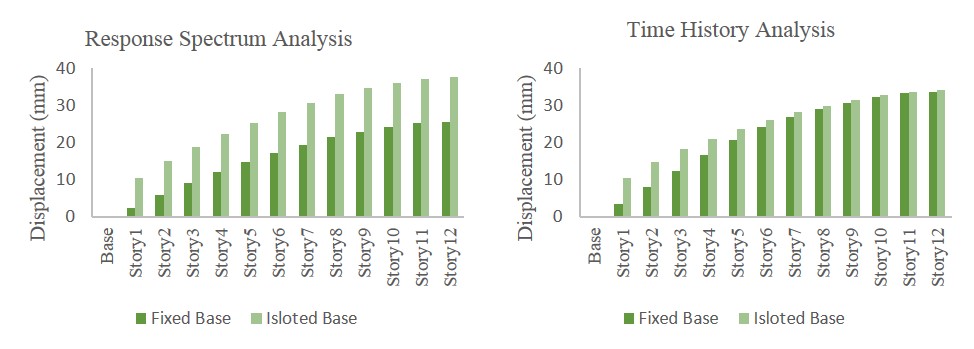
Figure 5.8 Story Displacements in Medium Soil Condition for both Analyses, Time History and Response Spectrum
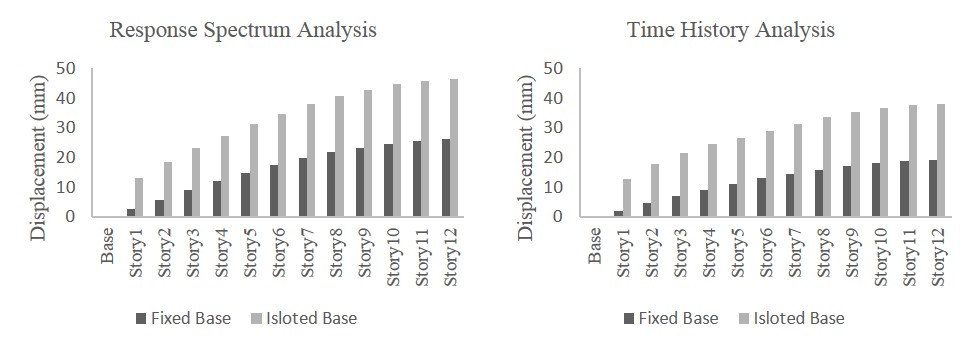
Figure 5.9 Story Displacements in Soft Soil Condition for both Analyses, Time History and Response Spectrum
5.5.3 Story drifts
Story drift is defined as the variance in lateral displacement between two adjacent stories. During an earthquake, large lateral forces can be imposed on structures; lateral displacement and drift have three main effects on a structure; the movements influence on the structural components (such as beams and columns); the movements influence on non-structural components, and the movements influence on adjacent structures. Without appropriate consideration during the design stage, large displacements and drifts can have adverse effects on structural components, non-structural components, and adjacent structures.
Table 5.5 and Table 5.6 show that the story drifts carried out by response spectrum analysis and time history analysis. It is observed that the maximum drift produced, is seen on the first floor, above the isolators. It also observed the story drift increasing according to soil’s flexibility. The largest drifts are created in soft soil condition.
Table 5.5 Comparison of the Story Drifts in Various Soil Conditions for Fixed and Isolated Base Buildings by Response Spectrum Analysis (mm)
| NO. of Story | Hard Soil | Medium Soil | Soft Soil | ||||||
| FB | IB | Diff% | FB | IB | Diff% | FB | IB | Diff% | |
| 12 | 0.207 | 0.148 | -39.86 | 0.195 | 0.194 | -0.52 | 0.187 | 0.232 | 19.4 |
| 11 | 0.364 | 0.269 | -35.32 | 0.351 | 0.355 | 1.13 | 0.339 | 0.427 | 20.61 |
| 10 | 0.484 | 0.375 | -29.07 | 0.48 | 0.502 | 4.38 | 0.471 | 0.608 | 22.53 |
| 9 | 0.573 | 0.46 | -24.57 | 0.579 | 0.623 | 7.06 | 0.574 | 0.76 | 24.47 |
| 8 | 0.645 | 0.531 | -21.47 | 0.654 | 0.724 | 9.67 | 0.653 | 0.886 | 26.3 |
| 7 | 0.709 | 0.593 | -19.56 | 0.715 | 0.808 | 11.51 | 0.717 | 0.991 | 27.65 |
| 6 | 0.768 | 0.649 | -18.34 | 0.769 | 0.881 | 12.71 | 0.774 | 1.081 | 28.4 |
| 5 | 0.82 | 0.7 | -17.14 | 0.821 | 0.948 | 13.4 | 0.828 | 1.162 | 28.74 |
| 4 | 0.868 | 0.746 | -16.35 | 0.874 | 1.011 | 13.55 | 0.883 | 1.241 | 28.85 |
| 3 | 0.914 | 0.795 | -14.97 | 0.925 | 1.081 | 14.43 | 0.935 | 1.329 | 29.65 |
| 2 | 0.942 | 0.946 | 0.42 | 0.951 | 1.289 | 26.22 | 0.957 | 1.585 | 39.62 |
| 1 | 0.708 | 2.219 | 68.09 | 0.71 | 3.02 | 76.49 | 0.712 | 3.709 | 80.8 |
Table 5.6 Comparison of the Story Displacements in Various Soil Conditions for Fixed and Isolated Base Buildings by Time History Analysis (mm)
| NO. of Story | Hard Soil | Medium Soil | Soft Soil | ||||||
| FB | IB | Diff% | FB | IB | Diff% | FB | IB | Diff% | |
| 1 | 0.597 | 2.216 | 73.06 | 0.982 | 2.995 | 67.21 | 0.544 | 3.655 | 85.12 |
| 2 | 0.83 | 0.872 | 4.82 | 1.298 | 1.231 | -5.44 | 0.733 | 1.45 | 49.45 |
| 3 | 0.844 | 0.788 | -7.11 | 1.265 | 0.988 | -28.04 | 0.703 | 1.092 | 35.62 |
| 4 | 0.846 | 0.806 | -4.96 | 1.226 | 0.928 | -32.11 | 0.658 | 1.088 | 39.52 |
| 5 | 0.832 | 0.864 | 3.7 | 1.143 | 0.866 | -31.99 | 0.609 | 1.059 | 42.49 |
| 6 | 0.796 | 0.851 | 6.46 | 0.979 | 0.809 | -21.01 | 0.57 | 0.973 | 41.42 |
| 7 | 0.736 | 0.76 | 3.16 | 0.958 | 0.737 | -29.99 | 0.523 | 0.944 | 44.6 |
| 8 | 0.656 | 0.741 | 11.47 | 0.872 | 0.66 | -32.12 | 0.487 | 0.853 | 42.91 |
| 9 | 0.558 | 0.663 | 15.84 | 0.724 | 0.576 | -25.69 | 0.427 | 0.715 | 40.28 |
| 10 | 0.441 | 0.518 | 14.86 | 0.618 | 0.434 | -42.4 | 0.34 | 0.623 | 45.43 |
| 11 | 0.327 | 0.346 | 5.49 | 0.484 | 0.326 | -48.47 | 0.235 | 0.466 | 49.57 |
| 12 | 0.22 | 0.193 | -13.99 | 0.276 | 0.174 | -58.62 | 0.13 | 0.257 | 49.42 |
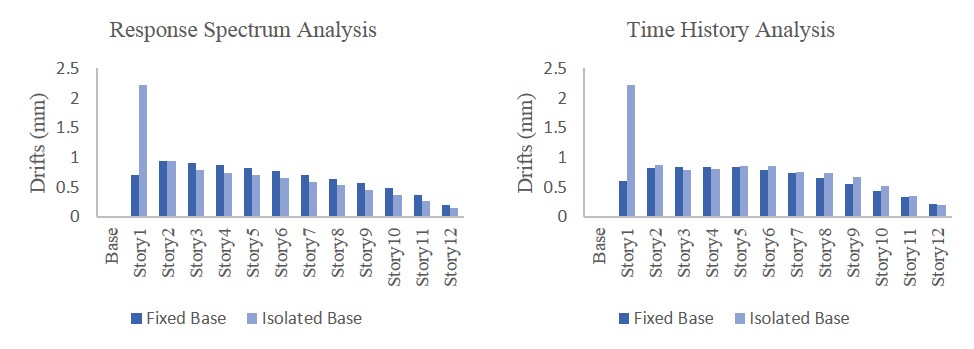
Figure 5.10 Story Drifts in Hard Soil Condition for Both Analyses, Time History and Response Spectrum
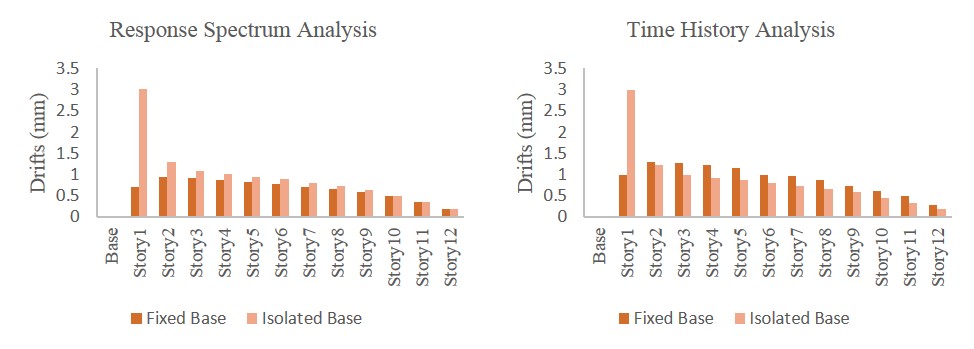
Figure 5.11 Story Drifts in Medium Soil Condition for both Analyses, Time History and Response Spectrum
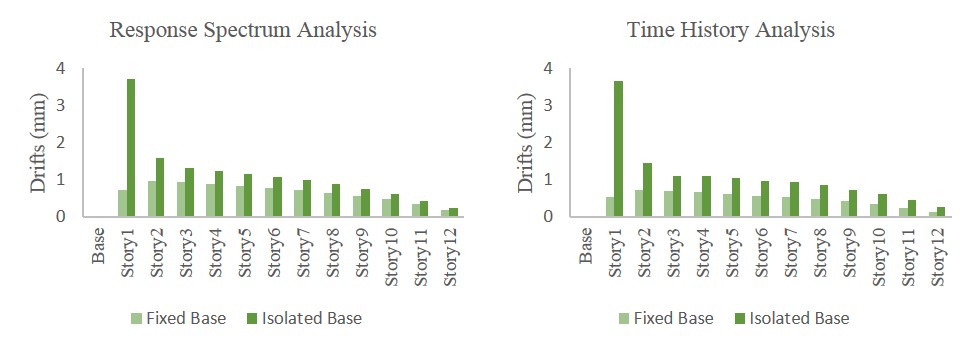
Figure 5.12 Story Drifts in Soft Soil Condition for Both Analyses, Time History and Response Spectrum
5.5.4 Story Forces
Story shear is the sum of designed lateral forces at all levels above the story under consideration. Story shear value, as per IS code, is calculated and plotted for buildings with different heights, and resting on different soil types. Representative variations in the pattern of distribution of lateral shear force in a 12-story building corresponding to the seismic provisions of IS code are as shown in Figures 13 to 15. It is observed that the value of story shear increases as the stiffness of the soil decreases and so forth; it is highest for the soft soil type (SS) and lowest for hard soil type (HS)[51].
In case of hard soil, the values of story forces at first floor are 1551.43kN, 1334.38kN for fixed base and isolated base respectively. It observes that the percentage reduction of story force value at first floor is 16.3% in isolated base when compared with fixed base. However the story forces at first floor are 1552.22kN and 1553.9kN for fixed base and 1814.8kN and 2228.5kN for isolated base in case of medium soil condition and soft soil condition respectively, therefore the story forces of isolated base increases by 14.5% for medium soil and 30.3% for soft soil, as compared with a fixed base model. Subsequently, as shown in Figures 5.13 to 5.15, the performance of hard soil condition with isolated base model is better than that of other conditions. It is also observed that the difference of story forces in the response spectrum analysis (RSA) as compared to the time history analysis (THA) results are negligible for same cases.
Table 5.7 Comparison of the Story Forces in Various Soil Conditions for Fixed and Isolated Base Buildings by Response Spectrum Analysis (kN)
| NO. of Story | Hard Soil | Medium Soil | Soft Soil | ||||||
| FB | IB | Diff% | FB | IB | Diff% | FB | IB | Diff% | |
| 12 | 276.06 | 180.97 | -52.54 | 249.77 | 230.80 | -8.22 | 233.86 | 272.50 | 14.18 |
| 11 | 537.23 | 382.86 | -40.32 | 508.93 | 499.59 | -1.87 | 487.116 | 596.80 | 18.38 |
| 10 | 718.94 | 545.87 | -31.71 | 708.01 | 727.78 | 2.72 | 690.48 | 879.26 | 21.47 |
| 9 | 850.63 | 675.62 | -25.9 | 857.08 | 914.19 | 6.25 | 847.46 | 1113.8 | 23.92 |
| 8 | 960.45 | 784.81 | -22.38 | 971.95 | 1068.4 | 9.03 | 969.37 | 1307.9 | 25.88 |
| 7 | 1062.2 | 882.35 | -20.39 | 1066.9 | 1200.3 | 11.11 | 1069.1 | 1471.3 | 27.33 |
| 6 | 1156.3 | 971.75 | -19 | 1152.9 | 1317.3 | 12.48 | 1158.99 | 1614.3 | 28.21 |
| 5 | 1240.5 | 1053.3 | -17.77 | 1237.8 | 1424.8 | 13.12 | 1247.8 | 1746.2 | 28.54 |
| 4 | 1319.6 | 1127.7 | -17.01 | 1326.3 | 1527.0 | 13.15 | 1339.6 | 1873.7 | 28.5 |
| 3 | 1401.5 | 1197.7 | -17.01 | 1416.9 | 1627.5 | 12.94 | 1430.2 | 2000.1 | 28.49 |
| 2 | 1486.1 | 1267.8 | -17.22 | 1499.2 | 1726.8 | 13.18 | 1507.8 | 2123.3 | 28.99 |
| 1 | 1551.4 | 1334.3 | -16.27 | 1552.2 | 1814.7 | 14.47 | 1553.8 | 2228.5 | 30.27 |
Table 5.8 Comparison of the Story Forces in Various Soil Conditions for Fixed and Isolated Base Buildings by Time History Analysis (kN)
| NO. of Story | Hard Soil | Medium Soil | Soft Soil | ||||||
| FB | IB | Diff% | FB | IB | Diff% | FB | IB | Diff% | |
| 12 | 250.02 | 245.21 | -1.96 | 349.71 | 228.94 | -52.7 | 242.73 | 326.82 | 25.73 |
| 11 | 587.16 | 488.67 | -20.15 | 670.19 | 489.89 | -36.8 | 532.30 | 680.80 | 21.81 |
| 10 | 851.33 | 751.16 | -13.33 | 941.69 | 665.12 | -41.5 | 791.53 | 930.84 | 14.97 |
| 9 | 970.52 | 988.42 | 1.81 | 1193.9 | 860.25 | -38.7 | 939.05 | 1052.4 | 10.77 |
| 8 | 1062.7 | 1115.7 | 4.75 | 1385.7 | 994.23 | -39.3 | 920.95 | 1267.0 | 27.32 |
| 7 | 1235.8 | 1136.8 | -8.7 | 1496.4 | 1094.7 | -36.6 | 883.76 | 1418.7 | 37.71 |
| 6 | 1340.9 | 1294.3 | -3.6 | 1484.5 | 1210.5 | -22.6 | 993.21 | 1459.3 | 31.94 |
| 5 | 1412.8 | 1315.7 | -7.38 | 1479.4 | 1302.4 | -13.5 | 1098.5 | 1603.5 | 31.5 |
| 4 | 1410.0 | 1218.6 | -15.7 | 1416.3 | 1401.7 | -1.05 | 1193.15 | 1662.5 | 28.23 |
| 3 | 1481.3 | 1200.4 | -23.4 | 1504.5 | 1482.9 | -1.46 | 1343.1 | 1640.5 | 18.13 |
| 2 | 1497.6 | 1158.7 | -29.25 | 1533.4 | 1643.0 | 6.67 | 1478.4 | 1932.3 | 23.49 |
| 1 | 1546.8 | 1347.4 | -14.79 | 1561.9 | 1809.8 | 13.7 | 1549.5 | 2219.7 | 30.19 |
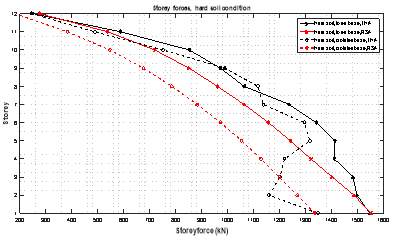
Figure 5.13 Story Forces in Hard Soil Condition for both Analyses, Time History and Response Spectrum
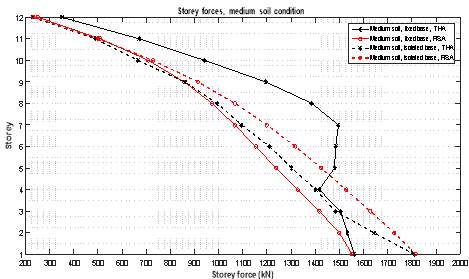
Figure 5.14 Story Forces in Medium Soil Condition for both Analyses, Time History and Response Spectrum
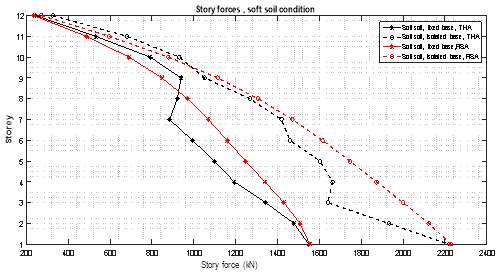
Figure 5.15 Story Forces in Soft Soil Condition for both Analyses, Time History and Response Spectrum
5.5.5 Time history base shear- FX
Base Shear directly depends on the input earthquake history so if a structure is not expected to be subjected to high seismic forces, its design base shear would be low, which is good but the engineer has no control over the design base shear. Whatever it is, one must design for it or risk structural failure. So, it does not matter whether a building has low or high base shear. What matters is, can your building withstand it or not. In other words, Base shear is an evaluation of the maximum expected horizontal or lateral forces that will occur due to seismic at the base of a structure. Calculations of base shear (V) depend on:
- Soil conditions at the site.
- Proximity to potential sources of seismic activity (such as geological faults).
- Probability of significant seismic.
- The level of ductility and over-strength associated with various structural configurations and the total weight of the structure.
- The fundamental (natural) period of vibration of the structure when subjected to dynamic loading.
In this study, the values of base shear of the isolated base model over HS, MS, and SS soil site as per IS 1893 are as shown in Figure 5.16. It is observed that the soil condition effects in the case of isolated base buildings, the values of base shear maximum are 1344.73kN, 2167.4kN and 2346.76kN for hard soil, medium soil, and soft soil respectively. As shown in Figure 16 the percentage reduction in base shear value of hard soil condition is 38% as compared to medium soil and 42.7% compared to soft soil. While the percentage reduction in base shear value of medium soil condition is 7.6 % as compared with soft soil.
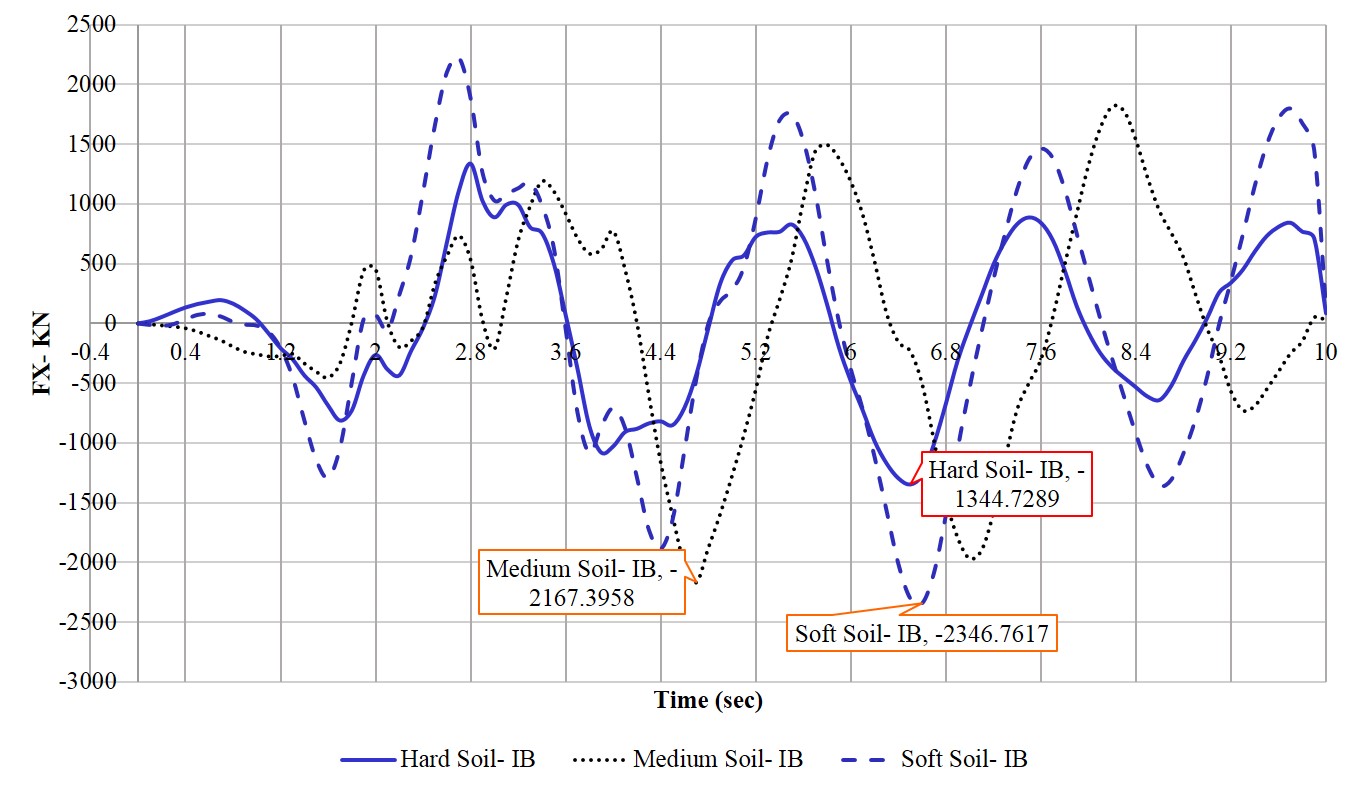
Figure 5.16 Time History Base Shear in Various Types of Soil
5.5.6 Spectral Acceleration at Roof
Spectral acceleration coefficient value of structures founded on various soil types was obtained from the design response spectrum, as suggested in IS. It is found that the value of spectral acceleration coefficient obtained by considering the base isolation effect in buildings is much less than those obtained by the standard conventional design practice (fixed). As shown in Figures 5.17 to 5.19, the maximum values of spectral acceleration for both models is observed; isolated base model and fixed base model, taking into consideration the type of soil according to IS code. It observed that the maximum values of spectral acceleration are; 1561.44mm/sec², 1032.81mm/sec², in case of hard soil, and 2118.4mm/sec², 1753.4mm/sec², in case of medium soil, for fixed base condition and isolated base condition respectively. In the case of soft soil, the values are 1622.9mm/sec² for fixed base condition and 2015.2mm/sec² for isolated base condition. As you can see, in the case of hard soil and medium soil, the value of spectral acceleration is greater in fixed base models than in isolated base models for the same cases. However as compared to the soft soil model that show the value of spectral acceleration in fixed base conditions being less than that of the isolated base model.
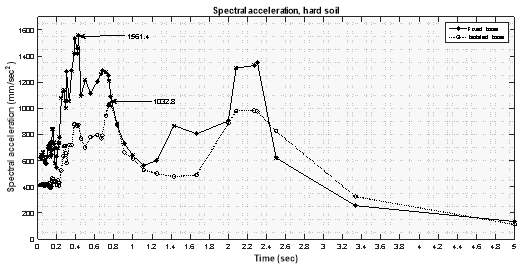
Figure 5.17 Comparison of Spectral Acceleration for Fixed and Isolated Base Models in Hard Soil Condition
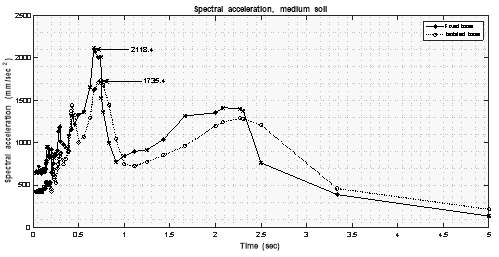
Figure 5.18 Comparison of Spectral Acceleration for Fixed and Isolated Base Models in Medium Soil Condition
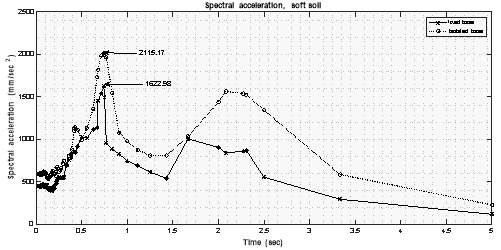
Figure 5.19 Comparison of Spectral Acceleration for Fixed and Isolated Base Models in Soft Soil Condition
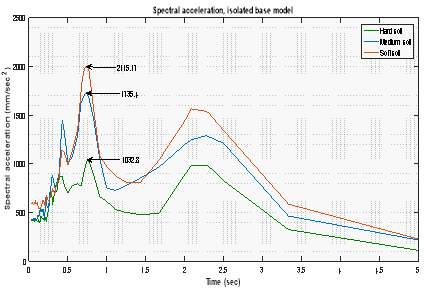
Figure 5.20 Comparison of Spectral Acceleration for Isolated Base Model in Different Soil Conditions
5.5.7 Spectral Displacement at Roof
The two factors affecting spectral displacement are energy dissipation by the isolators and the forces developed within the isolators themselves[8].
The spectral displacement decreases with increase in energy dissipation but increases as the isolators’ forces rise. Figure 5.21 presents the time history of the spectral displacement at roof for the El Centro earthquake 1940 matched with the response spectrum.
The peak displacements of the roof are presented in Figure 5.22, illustrating that the roof produces large displacement in soft soil condition with 213.2 mm. However, in hard soil conditions, the spectral displacement value of isolated base is 130.5 mm and 189.3 mm for medium soil condition. Thus, the increase percentage of spectral displacement in soft soil condition is 38.8% and 31% in medium soil condition when compared with hard soil condition. Also, as shown in Figure 22, the spectral displacement of various soil conditions, in cases of fixed base and isolated base, is observed. The difference in spectral displacement history of hard soil condition, between fixed base and isolated base, is negligible. Whereas the spectral displacement history of medium soil, in isolated base, increases by 27.3% and 58.7 % for soft soil condition, when compared with a fixed base for the same soil conditions.
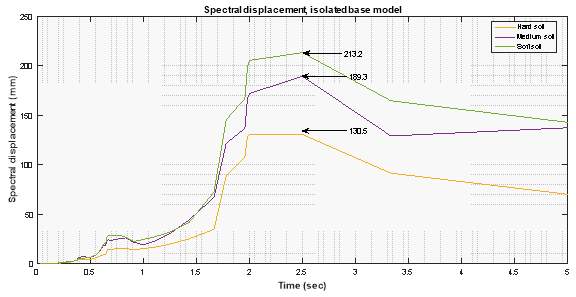
Figure 5.21 Comparison of Spectral Displacement for Isolated Base Model in Different Soil Conditions
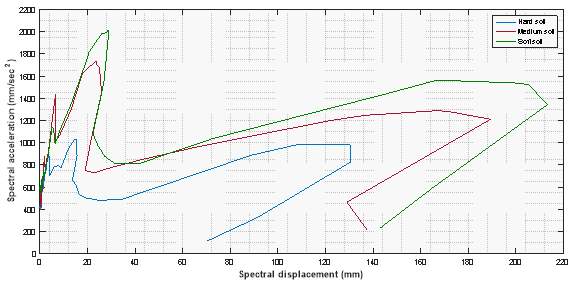
Figure 5.22 Comparison of Spectral Acceleration vs. Spectral Displacement for Isolated Base Model in Different Soil Conditions
5.6 Conclusion
The present work shows three different soil conditions under the base isolation building. They are examined for their seismic performance in terms of base and superstructure drift, displacement, and shear force, the El Centro earthquake in 1940 matched for these different types of soil. The purpose of the study was to investigate the seismic performance of an isolated-base building under various soil conditions according to IS code, the responses of the building, such as story displacements, story drifts, story forces, spectral acceleration at roof and spectral displacement have been studied. Time history analysis and response spectrum. So, after this investigation it has been concluded as following:
- It is observed that the value of story shear increases with decrease in stiffness of soil and so forth; it is highest for the soft soil type (SS) and lowest for hard soil type (HS).
- It is observed that the spectral acceleration history at roof level of an isolated base model increases in soft soil condition by 48.7% and 40.5% in medium soil condition when compared with hard soil.
- The work shows that the story displacement increases with the increased flexibility of the soil, in other words, soft soil conditions produced the largest displacement compared with hard soil and medium soil. It also observed that the displacement produced due to time history analysis being more than the displacement produced due to response spectrum analysis in hard soil conditions with an increase of 5%. However it decreases by 9.5% and 18% for medium soil condition and soft soil condition respectively.
- The maximum story drift is produced in the first floor, above the isolators for various soil conditions, that attribute to flexibility of base isolated introduced by isolators. It also observed that the story drift increasing with increase of flexibility of soil. Thus the largest drifts are created in soft soil condition.
- Hard soil and medium soil conditions are suitable for multi-story isolation structures according to the response of base isolation building.
Chapter 6
6 Optimization of base isolation parameters Using genetic algorithm
6.1 Introduction
In this Chapter, the optimization of base isolation system parameters via the genetic algorithms (GAs) optimization method is adopted for isolated base buildings subjected to real history earthquake which is El Centro 1940. To obtain optimal values of base isolation system parameters, an optimization program was constructed in Matlab using the genetic algorithm method. The objective of this work was to obtain a set of base isolation building parameters within a defined range that minimizes the acceleration response of an isolated base structure at roof subjected to ground motion and resting on various soil conditions namely; hard, medium, and soft soils. Several cases were investigated for different isolation system damping ratios and time period of seismic isolation devices. Nonlinear time history analyses were performed for the models. Parameters of optimal results and the values proved that the parameters determined via GA were true optima.
6.2 develpoment the model of base isolation buildings
A base isolation building is generally composed of three basic parts: (1) a rigid base floor, which attaches the isolation devices; and (2) the superstructure composed of columns, beams and story diaphragms; and (3) An isolation system, which is composed of the isolator including dampers and bearings. Figure 6.2 illustrates that the motion of an isolated base building subjected to an earthquake ground acceleration
Ẍg is expressed by two equations, Equations 6.1 and 6.2 [52]. The equations of motion of an N-floor superstructure with mass, damping and stiffness matrices [M], [C] and [K] are given by
[M]{Ẍ} + [C]{Ẋ} + [K]{X} =-[M]{H}{Ẍb+Ẍg} (6.1)
Where {H} is the vector of influence coefficients, {X} = {
X1,
X2, . . . ,
XN}T,
{Ẋ}and
{Ẍ}are the relative floor displacement, velocity and acceleration vectors, respectively, and
Ẍbis the relative acceleration of the base mass. In the case of shear frame modelling, while [M] and [K] are constructed using the story masses (m) and the story stiffness (k), respectively, [C] can be constructed such that the corresponding modal damping matrix represents the assumed superstructure damping ratios [39]. The governing equation of motion of the base mass is given by:
m0 X0̈+f0-K1X1-C1X1̇=-m0Xg̈ (6.2)
Where
m0is the mass of base,
f0is the restoring force, and
K1and
C1are the story stiffness and damping of the first floor, respectively. Considering a Kelvin–Voigt viscoelastic model for the isolation system, which is essentially a rheological model consisting of a linear spring in parallel with a linear viscous damper, the restoring force in the isolation system is given by:
f0=K0X0+C0X0̇ (6.3)
Where
K0 is the effective stiffness of the isolation system and
C0is the effective viscous damping constant of the isolation system. Then, for a rigid-body superstructure motion, the isolation period
( ) and the isolation damping ratio (
 ) are given by:
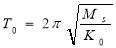 (6.4)
(6.4)
 (6.5)
(6.5)
Where  is the total mass of the structure including the mass of the base. While the records of ground excitations far away from the generating fault typically contain dominant high-frequency motions with an effective earthquake period that is generally between 0.2 and 0.7s, those recorded in the close vicinity of the fault contain long-period (about 1–5s) and high-amplitude (about 100cm/s or more) velocity pulses. Since the main idea behind seismic base isolation is to shift the time period of a structure by implementing a laterally flexible isolation system underneath the superstructure and detune the structure’s period from the dominant period of the ground motion, it works perfectly in the case of far-fault ground motions. However, if the same structure is subjected to a near-fault earthquake, then there is a possibility of the long-period large-amplitude velocity pulse being coincident with the isolation period of the structure and a failure of the isolation system due to rupture or buckling. In such a case, the peak isolation system displacement needs to be limited to ensure safety, which is typically taken care of by providing supplemental damping. Unluckily, large damping may result in increased floor accelerations, particularly in the case of far-fault earthquakes. This dilemma is a major problem in the design of seismically isolated structures[53],[54],[30].
Owing to the complicated nature of the problem, with many constraints, GA is well suited to the solution of the problem defined above: finding the optimal isolation system parameters that would work the best under the possibility of being subjected to both near-fault and far-fault earthquakes.
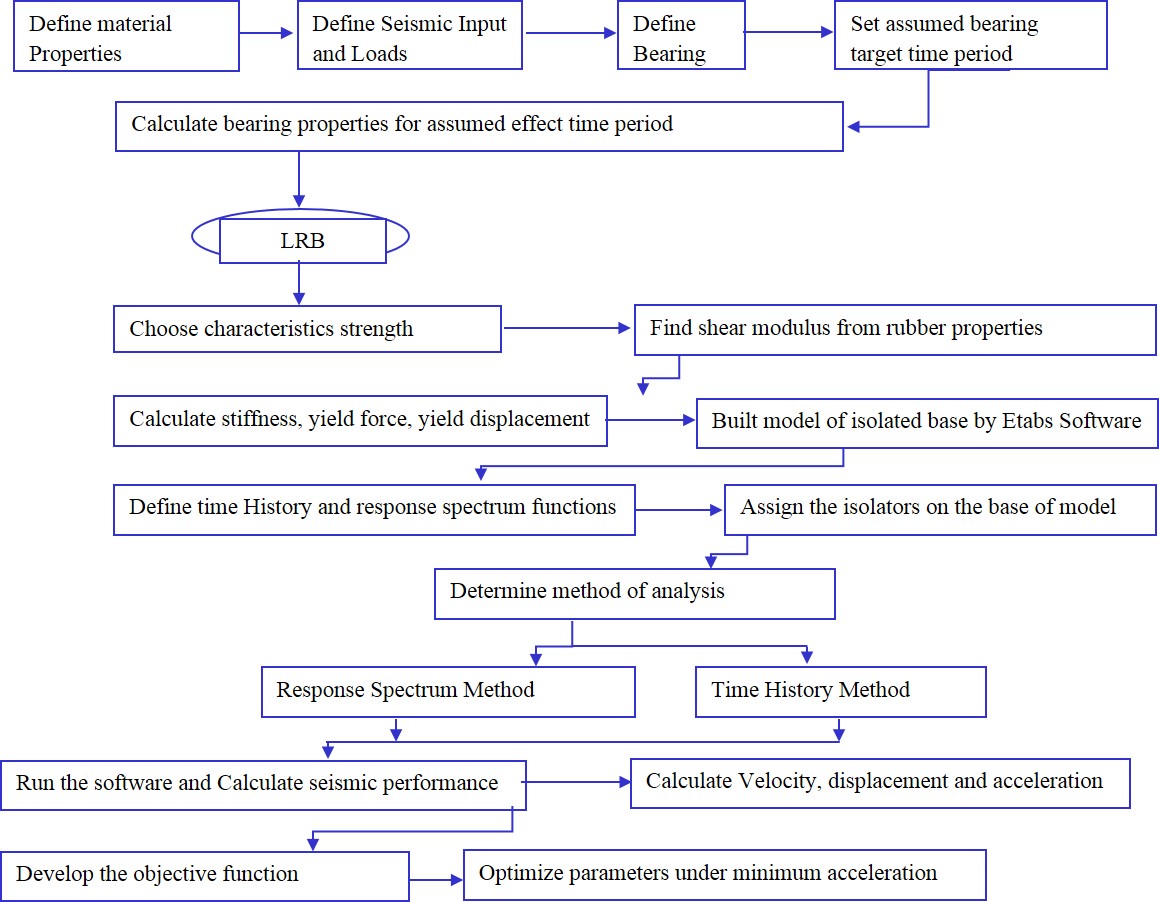
Figure 6.1 Flowchart for the optimization of seismic isolation systems via Genetic Algorithm Method
This chapter presents the optimization of base isolation systems, which may be subjected to earthquake matched with response spectrum function which is developed according to IS code, via Genetic Algorithm (GA) optimization. The formulation of base isolation is given above in Equations 6.1 to 6.5. Then, the optimization of the base isolation system of a model structure using genetic algorithm method is demonstrated. Finally, the results are reported and discussed along with a numerical verification of the true optimality of the genetic algorithm optimized isolation system parameters.
6.3 using Genetic Algorithm for optimiztion study
Optimization technique is a process in which an objective function is systematically minimized or maximized within an allowed set. Some restrictions, such as economic, physical or technical restrictions, may exist depending on the nature of the issue at hand, which must be taken into consideration in the study of optimization [55]. Genetic Algorithms (GAs) are adaptive heuristic search algorithm based on the natural evolutionary ideas. As such they represent a suitable exploitation of a random search used to solve optimization problems. The basic techniques of the GAs are designed to simulate procedures in normal systems necessary for evolution, particularly those follow the principles first laid down by Charles Darwin of “survival of the fittest.” Since in normal, competition among individuals for scanty resources results in the fittest individuals dominating over the weaker ones. A genetic algorithm method and time history analysis is used for the optimization of isolated base structure. The analysis of models has been achieved in Etabs-2015 software, and the optimization of base isolation parameters have been performed via genetic algorithm method. The flowchart which used for optimization study is given in Figure 6.1.
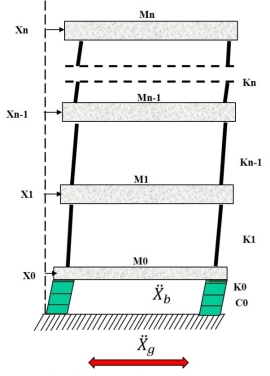
Figure 6.2 Isolated Base Model
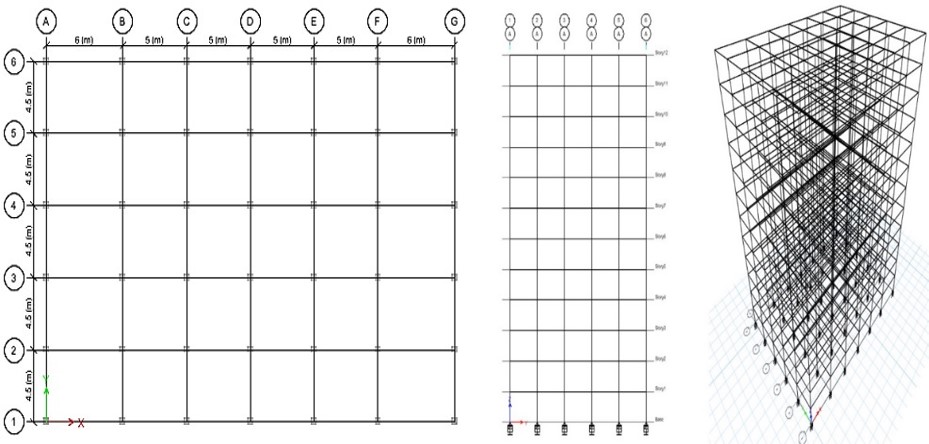
Figure 6.3 Geometric of the Isolated Base Structure for Optimization Study
In addition, the isolation damping and the isolation period should be within a defined realistic range that is actually attainable. But, in order to save the contents of the structure and reduce earthquake-induced forces, the most important objective of base isolation is to reduce the spectral acceleration transformed. Therefore, the optimization objective of the isolated base structure has been set as follows: ‘Obtain a set of an isolated base system parameters within a defined range that minimizes the acceleration response of an isolated base structure at roof, and subject to El- centro-1940 earthquake which is matched with response spectrum function, developed according to Indian standard (IS) code, relevant data are first input by the user, including: (1) the structural properties, namely materials properties, sectional properties, loads and modal damping ratios of the superstructure; (2) select ground acceleration record which will be used for the analysis and optimization process; (3) a range for the base isolation building parameters, specifically isolation period and isolation damping ratio, that represents realistic and physically attainable conditions. Then, isolation period and isolation damping ratio, is generated and time history analysis of the isolated base structure is achieved under El Centro earthquake excitation for all generated random isolation system parameters. In light of the objective of minimizing the spectral acceleration at roof by optimizing the system stiffness and the ratio of damping.
6.4 Optimization of base isolation parameters
A multi-story isolated base structure is used as the subject model structure and the optimum isolation base building parameters are obtained via Etabs-2015 software employing the genetic algorithm. The superstructure is modelled as an equivalent shear frame and the story stiffness (k) and story mass (m) are adjusted to obtain a fundamental fixed-base period of 1.98s. Models of the superstructures of isolated base buildings successfully represent the class of realistic buildings with the same natural period and distribution of stiffness over the height. The isolation story mass (m0) is assumed to be the same for other stories. The superstructure damping ratios are assumed to be 5% for all modes. The isolation period (T0) and the isolation damping ratio (ζ0) are the base isolation structure properties which are to be optimized. The corresponding base isolation structure stiffness (k0) and the isolation system damping coefficient (c0) are then calculated by using Equations (6.4) and (6.5). The range of isolation period for this example is set to be between 2 and 4s, which is a usual range for many base isolated buildings [56]. Three various practical ranges for the base isolation building damping ratios are studied: 0% < ζ0 < 20%, 0% < ζ0 < 30% and 0% < ζ0 < 40%. Therefore, nine different cases corresponding to various combinations of the above-reported restrictions are calculated in Table 6.1.
It is possible that a structure be subjected to earthquake with different types of soil, and therefore its base isolation structure needs to be suitable for all types of soil. The optimization procedure for the structure considering of this study was performed using El Centro-1940 earthquake which is matched with response spectrum function [57]
Table 6.1 Restrictions and Calculated Isolation System Parameters of the Different Cases Investigated (I: Hard soil, II: Medium Soil, III: Soft Soil)
|
Case |
Xg̈
(m/sec2) |
Xb̈
(m/sec2) |
M
(kg) |
Ẋ
(m/sec) |
X
(m) |
|||
| 0% < ζ0 < 20% | I | 0.356 | 0.251 | 8765667 | 0.0875 | 0.0275 | ||
| II | 0.356 | 0.349 | 8765667 | 0.0971 | 0.0457 | |||
| III | 0.356 | 0.427 | 8765667 | 0.1412 | 0.0478 | |||
| 0% < ζ0 < 30% | I | 0.356 | 0.251 | 8765667 | 0.0875 | 0.0275 | ||
| II | 0.356 | 0.349 | 8765667 | 0.0971 | 0.0457 | |||
| III | 0.356 | 0.427 | 8765667 | 0.1412 | 0.0478 | |||
| 0% < ζ0 < 40% | I | 0.356 | 0.251 | 8765667 | 0.0875 | 0.0275 | ||
| II | 0.356 | 0.349 | 8765667 | 0.0971 | 0.0457 | |||
| III | 0.356 | 0.427 | 8765667 | 0.1412 | 0.0478 | |||
The multi-objective optimization problem given in Equation (6.1) can be written in a general form as:
- Objective Function:
min(x”)@ top story
- Variables: Damping of system (C), and Stiffness of system (K).
K∈2.16-8.67*107(N) ;
C∈2.75-5.507*106(N.s/m)
- Constraints :
- 2≤T≤4,
- 0<ζ<20%→Case I;
20%<ζ<30%→Case II;
30%<ζ<40%→Case III
6.5 Optimum parameters and performance analysis of base isolation buildin
The model of the base isolation structure in Figure 6.3 has been considered for optimization study, and three soil conditions taking into consideration according to IS code namely; hard soil (I), medium soil (II) and soft soil (III) using genetic algorithm method. GA optimization of nine different cases (Table 6.1), aiming to minimize the peak roof acceleration response, resulted in optimum isolation system stiffness and optimum isolation system damping values as reported in Table 6.2. It should be noted here that the isolation periods are within the design target range (2s < T0 < 4s) and the isolation system damping ratios do not exceed the set limits in each case. Table 6.2 shows the peak isolation system acceleration at roof PRA amplification for each case, which is obtained by time history analyses, employing the optimum parameters of base isolation building.
Table 6.2 Optimum Isolation System Parameters of the Different Cases Investigated
| Case | Optimum isolation system stiffness (N) | Optimum isolation system damping (N.s/m) | Optimum isolation period (s) | Optimum isolation damping ratio (%) | Spectral acceleration at roof | |
| 0% < ζ0 < 20% | I | 3.52715E+07 | 3.55009E+06 | 3.13 | 10.09 | 0.573774 |
| II | 3.46934E+07 | 3.40192E+06 | 3.16 | 9.75 | 0.639941 | |
| III | 3.36262E+07 | 3.21700E+06 | 3.21 | 9.37 | 0.736302 | |
| 0% < ζ0 < 30% | I | 3.80824E+07 | 5.50186E+06 | 3.01 | 15.06 | 0.545472 |
| II | 3.80389E+07 | 5.44735E+06 | 3.02 | 14.92 | 0.599841 | |
| III | 3.79484E+07 | 3.95685E+06 | 3.02 | 10.85 | 0.700814 | |
| 0% < ζ0 < 40% | I | 4.09589E+07 | 5.50460E+06 | 2.91 | 14.53 | 0.536421 |
| II | 4.10213E+07 | 5.12030E+06 | 2.90 | 13.50 | 0.587916 | |
| III | 3.46949E+07 | 5.45648E+06 | 3.16 | 15.64 | 0.694399 | |
To verify the efficiency of the optimized isolation buildings in reducing the acceleration response of the structure at roof. The peak roof acceleration (PRA) values are reported in Table 6.2. A comparison of the results reported in Tables 6.6 and 6.7 shows the success of the optimized base isolation buildings. Whereas the ratio of PRA/PGA of the isolated-base structure before the optimization under El Centro earthquake are more than 1.0, these values are less than 1.0 for the optimized isolated base structures (see Table 6.6). The reduction in PRA via the optimized base isolation systems varies from 40 % to 56% depending on the soil condition as compared without using optimum values. As representative cases, the time history plots of base shear are also shown in Figure 6.12 for various soil condition before and after using optimum parameters. As shown, time history base shear after using optimum parameters are well below 44% to 54% of time history base shear before using the optimum parameters, the lowest values are found in hard soil condition (1344.73kN) before using optimum parameters and (689.85kN) after using the optimum parameters with 48.7% difference, proving that the genetic algorithm technique for optimization was efficiently technique to reduce the dynamic response of base isolation structures especially reducing the base shear and spectral acceleration. The optimum isolation systems performed suitably in terms of spectral acceleration-spectral displacement. As can be seen in Table 6.7, the peak isolation system displacements before using optimum parameters are; hard soil 74.8mm, medium soil 113.7mm and 125mm for soft soil, while the peak isolation system displacements after using optimum parameters are hard soil 32.9mm, medium soil 59.9mm and 74.4mm for soft soil with 56.01%, 47.32% and 40.48% differences, which gives us evidence that the effect of using optimum parameters for reducing the spectral displacement.
Table 6.3 Comparison of the Story Displacements Results before and After Using Optimum Parameters (mm)
| NO. of Story | Hard Soil | Medium Soil | Soft Soil | ||||||
| Non-Optimum | Optimum | Diff % | Non-Optimum | Optimum | Diff % | Non-Optimum | Optimum | Diff % | |
| 12 | 29.1 | 15 | 48 | 34.2 | 15.1 | 56 | 38.1 | 19 | 50 |
| 11 | 28.5 | 14.8 | 48 | 33.7 | 14.9 | 56 | 37.6 | 18.8 | 50 |
| 10 | 27.3 | 14.3 | 48 | 32.9 | 14.4 | 56 | 36.7 | 18.4 | 50 |
| 9 | 25.8 | 13.6 | 47 | 31.6 | 13.7 | 57 | 35.4 | 17.8 | 50 |
| 8 | 24.1 | 12.7 | 47 | 29.9 | 12.9 | 57 | 33.6 | 17 | 49 |
| 7 | 21.8 | 11.6 | 47 | 28.2 | 11.9 | 58 | 31.4 | 16.1 | 49 |
| 6 | 19.2 | 10.3 | 46 | 26.2 | 10.8 | 59 | 28.8 | 14.9 | 48 |
| 5 | 17 | 9.2 | 46 | 23.8 | 9.6 | 60 | 26.5 | 13.6 | 49 |
| 4 | 14.7 | 7.9 | 46 | 21.1 | 8.2 | 61 | 24.4 | 12.3 | 50 |
| 3 | 13 | 6.9 | 47 | 18.2 | 6.9 | 62 | 21.5 | 10.7 | 50 |
| 2 | 10.8 | 5.7 | 47 | 14.8 | 5.4 | 64 | 17.9 | 8.8 | 51 |
| 1 | 7.8 | 4 | 49 | 10.5 | 3.9 | 63 | 12.8 | 6.2 | 52 |
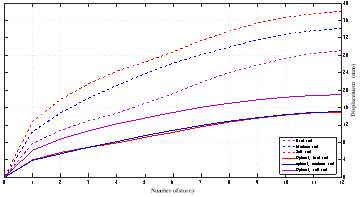
Figure 6.4 Story Displacements in Different Types of Soil with and Without Optimum Parameters
Table 6.4 Comparison of the Story Drifts Results before and After Using Optimum Parameters (m)
| NO. of Story | Hard Soil | Medium Soil | Soft Soil | ||||||
| Non-Optimum | Optimum | Diff % | Non-Optimum | Optimum | Diff % | Non-Optimum | Optimum | Diff % | |
| 12 | 0.000193 | 8.60E-05 | 55 | 0.000174 | 7.30E-05 | 58 | 0.000257 | 0.000116 | 55 |
| 11 | 0.000346 | 0.000162 | 53 | 0.000326 | 0.000137 | 58 | 0.000466 | 0.000213 | 54 |
| 10 | 0.000518 | 0.000238 | 54 | 0.000434 | 0.000186 | 57 | 0.000623 | 0.00029 | 53 |
| 9 | 0.000663 | 0.000302 | 54 | 0.000576 | 0.000238 | 59 | 0.000715 | 0.000333 | 53 |
| 8 | 0.000741 | 0.000343 | 54 | 0.00066 | 0.000283 | 57 | 0.000853 | 0.000354 | 58 |
| 7 | 0.00076 | 0.000375 | 51 | 0.000737 | 0.000322 | 56 | 0.000944 | 0.000405 | 57 |
| 6 | 0.000851 | 0.000412 | 52 | 0.000809 | 0.000354 | 56 | 0.000973 | 0.000446 | 54 |
| 5 | 0.000864 | 0.00042 | 51 | 0.000866 | 0.000377 | 56 | 0.001059 | 0.000496 | 53 |
| 4 | 0.000806 | 0.000408 | 49 | 0.000928 | 0.000399 | 57 | 0.001088 | 0.000529 | 51 |
| 3 | 0.000788 | 0.000423 | 46 | 0.000988 | 0.000422 | 57 | 0.001092 | 0.000565 | 48 |
| 2 | 0.000872 | 0.000463 | 47 | 0.001231 | 0.000479 | 61 | 0.00145 | 0.000721 | 50 |
| 1 | 0.002216 | 0.001153 | 48 | 0.002995 | 0.001104 | 63 | 0.003655 | 0.001786 | 51 |
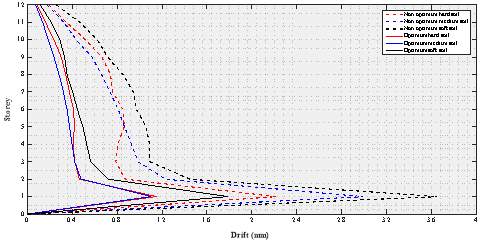
Figure 6.5 Story Drifts in Different Types of Soil with and Without Optimum Parameters-Linear Graph
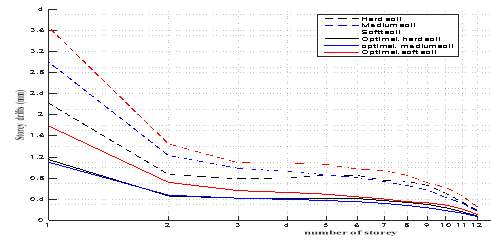
Figure 6.6 Story Drifts in Different Types of Soil with and Without Optimum Parameters-Log Graph
Table 6.5 Comparison of the Story Forces Results before and After Using Optimum Parameters (kN)
| NO. of Story | Hard Soil | Medium Soil | Soft Soil | ||||||
| Non-Optimum | Optimum | Diff % | Non-Optimum | Optimum | Diff % | Non-Optimum | Optimum | Diff % | |
| 12 | 245.2128 | 96.2172 | 61 | 228.9472 | 103.613 | 55 | 326.8212 | 142.9367 | 56 |
| 11 | 488.6719 | 222.5979 | 54 | 489.9048 | 218.8916 | 55 | 680.8073 | 306.9599 | 55 |
| 10 | 751.1658 | 344.5014 | 54 | 665.1335 | 294.7697 | 56 | 930.851 | 430.3637 | 54 |
| 9 | 988.4273 | 446.7403 | 55 | 860.2651 | 362.7957 | 58 | 1052.406 | 497.965 | 53 |
| 8 | 1115.75 | 512.4282 | 54 | 994.2516 | 437.0143 | 56 | 1267.081 | 522.8492 | 59 |
| 7 | 1136.875 | 560.2951 | 51 | 1094.78 | 487.8888 | 55 | 1418.775 | 605.2692 | 57 |
| 6 | 1294.34 | 623.4517 | 52 | 1210.533 | 540.8003 | 55 | 1459.333 | 665.7632 | 54 |
| 5 | 1315.721 | 636.2843 | 52 | 1302.445 | 579.8251 | 55 | 1603.589 | 747.4686 | 53 |
| 4 | 1218.639 | 622.7026 | 49 | 1401.729 | 619.7779 | 56 | 1662.529 | 803.3838 | 52 |
| 3 | 1200.449 | 645.8034 | 46 | 1482.948 | 659.247 | 56 | 1640.589 | 848.6822 | 48 |
| 2 | 1158.742 | 616.2001 | 47 | 1643.12 | 669.0246 | 59 | 1932.345 | 960.6926 | 50 |
| 1 | 1347.504 | 698.9724 | 48 | 1809.91 | 699.0386 | 61 | 2219.773 | 1081.794 | 51 |
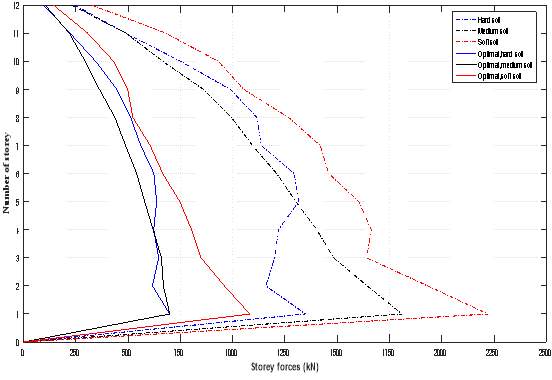
Figure 6.7 Story Forces in Different Types of Soil with and Without Optimum Parameters
Table 6.6 Comparison of the Spectral Acceleration before and After Using Optimum Parameters
| Spectral acceleration, (mm/sec2) | |||||||||
| Story | Hard Soil | Medium Soil | Soft Soil | ||||||
| Non-Optimum | Optimum | Diff % | Non-Optimum | Optimum | Diff % | Non-Optimum | Optimum | Diff % | |
| Roof | 628.02 | 210.72 | 66.45 | 999.77 | 353.46 | 64.65 | 1058.48 | 448.86 | 57.59 |
| Base | 618.25 | 432.77 | 29.97 | 894.56 | 626.19 | 30.00 | 791.01 | 535.71 | 32.27 |
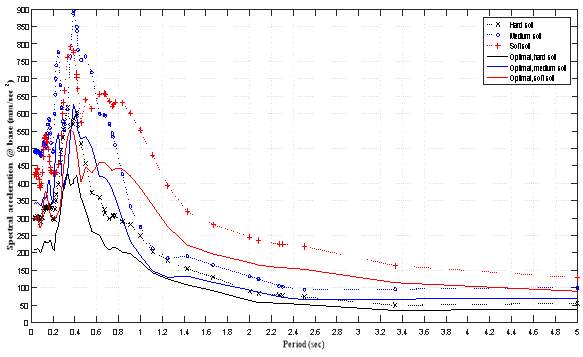
Figure 6.8 Spectral Acceleration at Base in Different Types of Soil with and Without Optimum Parameters
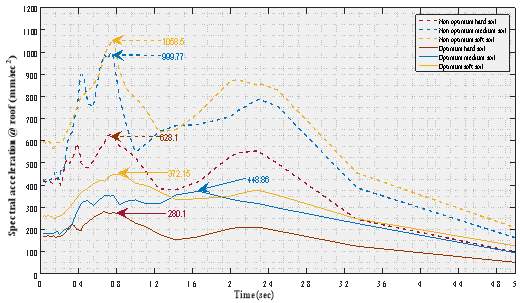
Figure 6.9 Spectral Acceleration at Roof in Different Types of Soil with and Without Optimum Parameters
Table 6.7 Comparison of the Spectral Displacement before and After Using Optimum Values (mm)
| Story | Hard Soil | Medium Soil | Soft Soil | ||||||
| Non-Optimum | Optimum | Diff % | Non-Optimum | Optimum | Diff % | Non-Optimum | Optimum | Diff % | |
| Roof | 74.8 | 32.9 | 56.01 | 113.7 | 59.9 | 47.32 | 125 | 74.4 | 40.48 |
| Base | 35.4 | 20.9 | 40.96 | 60.1 | 42.1 | 29.95 | 76.1 | 53.3 | 29.96 |
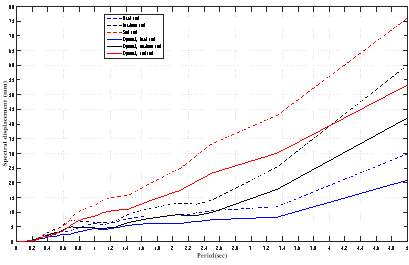
Figure 6.10 Spectral Displacement at Base in Different Types of Soil with and Without Optimum Parameters
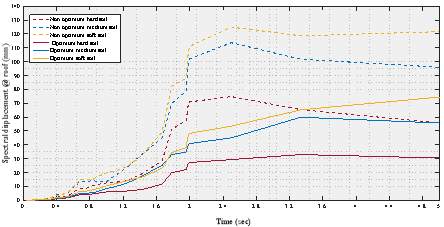
Figure 6.11 Spectral Acceleration at Roof in Different Types of Soil with and Without Optimum Parameters
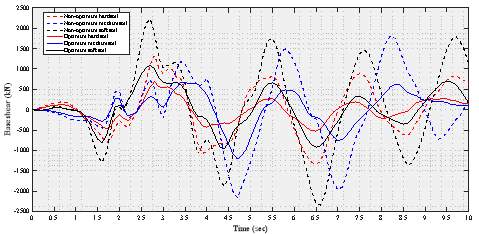
Figure 6.12 Time History Base Shear In Various Types of Soil With and Without Optimum Parameters
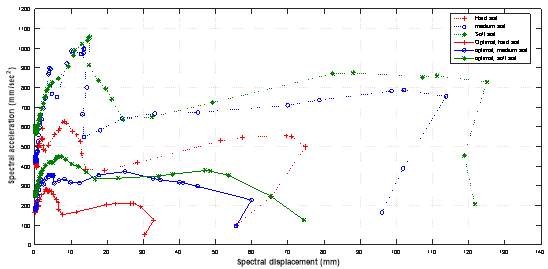
Figure 6.13 Spectral Displacement versus Spectral Acceleration of Earthquake Records Used For Checking Of Optimum Parameters
6.6 conclsion
In this chapter, the parameters optimization of base isolation buildings using the genetic algorithm (GA) method was adopted based time history analysis using Etabs-2015 software for analyzing the base isolated structures. Whereas the possibility of very large displacements of isolator in case of high ground motions requires large damping, the negative effect of large damping that lightly damped systems have lower force transmissibility than those with larger damping, in addition, the negative effect of high stiffness of structures . Moreover, there exist economic consideration and dynamical limitations in practical applications. Taking into consideration all these factors, the objective of optimization is determined to find the parameters of base isolation building within a defined range that minimizes the acceleration response of an isolated base structure at roof subject to earthquake. A detailed study on a base isolated structure demonstrated that the GA optimization method can successfully determine optimum isolation system parameters. The optimum values of base isolation system calculated by GA method show the best performances and sufficiently reducing the seismic response. It is also shown that the optimum isolation system parameters determined by GA method are effective not only on objective function of optimization which was minimizing the acceleration at roof, but also on other dynamic response such as, story displacements, story drifts, story forces and base shear, proving the robustness of the proposed optimization method with respect to the variation in the characteristics of the soil condition.
Chapter 7
7 Conclusion
7.1 INtroduction
The requirements for earthquakes resistant are well documented. Beyond designing structures that have the ability to withstand seismic events, society needs designs that prevent damage. Damage is not the total compromise of the structural integrity of a building. It is not even just cracks in the foundation. Though both of those are important reasons to design better structures and would save millions of dollars, damage can even be as little as fatigue in the members leading to reduced strength. This reduced strength, even at low vibrations can, over time, render a building unsafe without being noticed. To maintain a building’s integrity, any and all energy must be deflected or dissipated. Accomplishing the above-stated performance targets is rather difficult. Base isolation must be harnessed to stay upright, therefore transferring energy to the structure. The most promising ideas are coming from innovative researchers who are applying unrelated ideas to the topic to find solutions. Engineers actually designing structures that allow relative motion of parts of the structure itself are finding promising results. And this is only one direction which research is leading. Figure 7.1 illustrates the summary of the thesis and how it meets the research objectives.
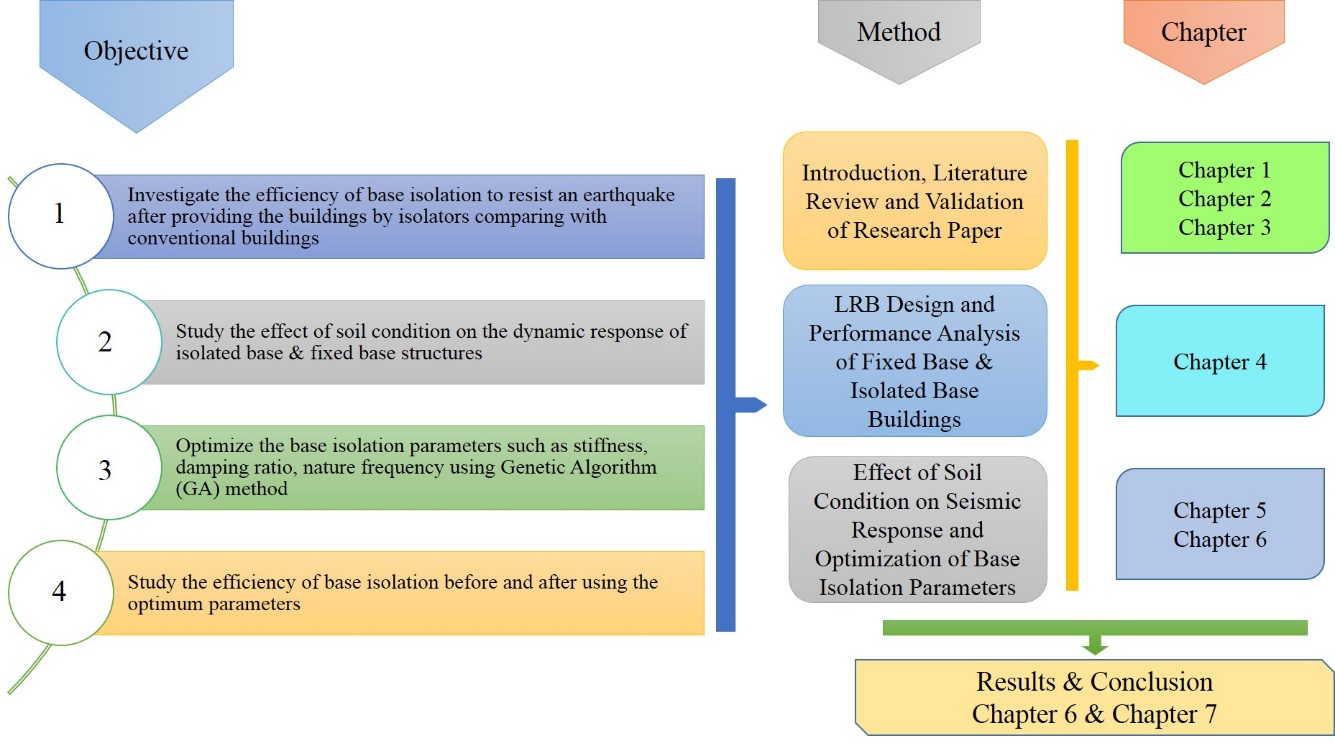
Figure 7.1 Summary Layout of Thesis and how it Meets the Research Objectives
7.2 Summary of current work
The objective of this thesis is to find the best solution to resist earthquakes during seismic events. Find a method of designing a structure to reduce any and all demands. This is to be done by isolating the superstructure from base to remove it from the inertia that is mobilized by seismic events. The basically goal of this thesis is to minimize the acceleration at top story by using genetic algorithm method for optimizing the parameters of base isolation system. The final objective is to demonstrate the effectiveness of this system over excitation in different soil condition according to IS code. The conclusion of this study is as following:
7.2.1 Design and Analysis of Isolated Base Structures
- After providing lead rubber base isolator (LRBs), the fundamental period mode of the structure is increased by 37 % for G+4 stories building. It is concluded that the mode period is increased after providing rubber isolator due to the flexible property of the isolator.
- For time history analysis, the base shear for (G+ 4) stories building in X and Y direction for the fixed condition is 1596 kN. After providing rubber isolator the base shear is 821.5 kN. It is concluded that the base shear is decreased in base isolation model.
- As compared to fixed base structure, the base shear is reduced in base isolated structures, thus the response of building is good in base isolated structures than fixed base structures.
- The story displacement is more in the case of base isolation by 73.8 % for G+4 stories building which gives us an evidence, the base isolation model is more flexible than the fixed base model.
7.2.2 Effect of Soil condition on Seismic Response of Base Isolation Buildings
- It is observed that the value of story shear increases with decrease in stiffness of soil and so forth; it is highest for the soft soil type (SS) and lowest for hard soil type (HS).
- It is observed that the spectral acceleration history at roof level of an isolated base model increases in soft soil condition by 48.7% and 40.5% in medium soil condition when compared with hard soil.
- The work shows that the story displacement increases with the increased flexibility of the soil, in other words, soft soil conditions produced the largest displacement compared with hard soil and medium soil. It also observed that the displacement produced due to time history analysis being more than the displacement produced due to response spectrum analysis in hard soil conditions with an increase of 5%. However it decreases by 9.5% and 18% for medium soil condition and soft soil condition respectively.
- The maximum story drift is produced in the first floor, above the isolators for various soil conditions, that attribute to flexibility of base isolated introduced by isolators. It also observed that the story drift increasing with increase of flexibility of soil. Thus the largest drifts are created in soft soil condition.
- Hard soil and medium soil conditions are suitable for multi-story isolation structures according to the response of base isolation building.
7.2.3 Optimization of Base Isolation Parameters Using Genetic Algorithm
- The objective of optimization is determined to find the parameters of base isolation building within a defined range that minimizes the acceleration response of an isolated base structure at roof subject to earthquake.
- A detailed study on a base isolated structure demonstrated that the GA optimization method can successfully determine optimum isolation system parameters.
- The optimum values of base isolation system calculated by GA method show the best performances and sufficiently reducing the seismic response.
- It is also shown that the optimum isolation system parameters determined by GA method are effective not only on objective function of optimization which was minimizing the acceleration at roof, but also on other dynamic response such as, story displacements, story drifts, story forces and base shear, proving the robustness of the proposed optimization method with respect to the variation in the characteristics of the soil condition.
7.3 Future research
Depending on the desired results, the design could be expanded as well. As discussed before, different damping devices could be added to improve energy dissipation and reduce the response of the structure over all frequencies of excitation. Though this would be a simple addition and require minimal derivation or changes to the calculations, this thesis is focused on the isolation effects and demonstration of the ability of this system without excess energy dissipation. Combining this design with energy dissipation appears to have great possibilities. Another expansion on the design would be to calculate the section of structure element and account the cost of section design before using the optimum parameters and after that. That work will show the saving percentage in cost subsequently, determining the economically benefit.
This study demonstrated the applicable and strength of genetic algorithm method for engineering optimizing, further than that can use different method such as, harmony search (HS) method and comparing the output results for both methods which will reflect the most suitable method for engineering optimizing
8 References
[1] S. Pourzeynali and M. Zarif, “Multi-objective optimization of seismically isolated high-rise building structures using genetic algorithms,” J. Sound Vib., vol. 311, no. 3–5, pp. 1141–1160, 2008.
[2] Amer Hassan & Shilpa Pal, “Performance Analysis of Base Isolation & Fixed,” pp. 1–5, 2017.
[3] H. Monfared, A. Shirvani, S. Nwaubani, and B. H. Lane, “An investigation into the seismic base isolation from practical perspective,” J. Civ. Eng. Struct. Eng., vol. 3, no. 3, pp. 451–463, 2013.
[4] D. J. Dowrick, Earthquake Resistant Design and Risk Reduction. 2009.
[5] Y. Wang, D. M. McFarland, A. F. Vakakis, and L. A. Bergman, “Seismic base isolation by nonlinear mode localization,” Arch. Appl. Mech., vol. 74, no. 5–6, pp. 387–414, 2005.
[6] S. Patil and G. Reddy, “State Of Art Review – Base isolation systems for structures,” Int. J. Emerg. Technol. Adv. Eng., vol. 2, no. 7, pp. 438–453, 2012.
[7] V. A. Zayas, S. S. Low, and S. A. Mahin, “A Simple Pendulum Technique for Achieving Seismic Isolation,” Earthquake Spectra, vol. 6, no. 2. pp. 317–333, 1990.
[8] D. Pietra, S. Pampanin, R. L. Mayes, N. G. Wetzel, and D. Feng, “Design of base-isolated buildings: An overview of international codes,” Bull. New Zeal. Soc. Earthq. Eng., vol. 48, no. 2, pp. 118–135, 2015.
[9] P. Gueguen, “Experimental analysis of the seismic response of one base-isolation building according to different levels of shaking: Example of the Martinique earthquake (2007/11/29) Mw 7.3,” Bull. Earthq. Eng., vol. 10, no. 4, pp. 1285–1298, 2012.
[10] G. D. Manolis and A. Markou, “A distributed mass structural system for soil-structureinteraction and base isolation studies,” Arch. Appl. Mech., vol. 82, no. 10–11, pp. 1513–1529, 2012.
[11] T. Soong, “Review of Principles of Passive Supplemental Damping and Seismic Isolation by C. Christopoulos and A. Filiatrault,” J. Struct. Eng., vol. 133, no. 8, p. 1192, 2007.
[12] G. Mondal and S. K. Jain, “Design of non-structural elements for buildings: A review of codal provisions,” Indian Concr. J., vol. 79, no. 8, pp. 22–28, 2005.
[13] R. S. Jangid, “Optimum lead – rubber isolation bearings for near-fault motions,” 1995.
[14] R. S. Jangid, “Optimum lead-rubber isolation bearings for near-fault motions,” Eng. Struct., vol. 29, no. 10, pp. 2503–2513, 2007.
[15] R. Jangid, “Optimum damping in a non-linear base isolation system,” J. Sound Vib., vol. 189, pp. 477–487, 1996.
[16] C. A. Kircher and D. Ph, “FEMA P-751: Chapter 12: Seismically Isolated Structures,” pp. 1–64.
[17] G. Attanasi, “An Innovative Superelastic System for Base Isolation,” 2009.
[18] Q. Wang, H. Fang, and X. K. Zou, “Application of Micro-GA for optimal cost base isolation design of bridges subject to transient earthquake loads,” Struct. Multidiscip. Optim., vol. 41, no. 5, pp. 765–777, 2010.
[19] F. Chatzidaki, “Optimum design of base isolated RC structures,” no. October, Athens, 2011.
[20] E. Mundus and M. Course, “Design of Story-Isolation System in Multi-Story Building,” 2007.
[21] “The 4th International Conference on Earthquake Engineering,” 2006.
[22] A. K. M. T. Alam and M. A. R. Bhuiyan, “Effect of soil-structure interaction on seismic response of a seismically isolated highway bridge pier,” J. Civ. Eng., vol. 41, no. 2, pp. 179–199, 2013.
[23] X. K. Zou and C. M. Chan, “An optimal resizing technique for seismic drift design of concrete buildings subjected to response spectrum and time history loadings,” Comput. Struct., vol. 83, no. 19–20, pp. 1689–1704, 2005.
[24] T. J.Engle, “A FLOOR SLAB DAMPER AND ISOLATION HYBRID SYSTEM OPTIMIZED FOR SEISMIC VIBRATION CONTROL,” Colorado State, 2010.
[25] M. Nakashima and P. Chusilp, “A partial view of Japanese post-Kobe seismic design and construction practices,” Earthq. Eng. Eng. Seismol., vol. 4, no. 1, pp. 3–13, 2003.
[26] J. C. Rarnallo and E. A. Johnson, “SEMIACTIVE BUILDING BASE ISOLATION Juan,” no. June, pp. 5–9, 1999.
[27] J. C. Ramallo, E. A. Johnson, and J. B. F. Spencer, ““Smart’’ Base Isolation Systems,” J. Eng. Mech., vol. 128, no. 10, pp. 1088–1099, 2002.
[28] P. A. N. Wen and S. U. N. Baifeng, “Two Step Design Method for Base Isolation Structures,” 14th World Conf. Earthq. Eng. Oct. 12-17, Beijing, China, pp. 12–17, 2008.
[29] P. J. Sayani and K. L. Ryan, “Comparative Evaluation of Base-Isolated and Fixed-Base Buildings Using a Comprehensive Response Index,” J. Struct. Eng., vol. 135, no. 6, pp. 698–707, 2009.
[30] C. P. Providakis, “Effect of LRB isolators and supplemental viscous dampers on seismic isolated buildings under near-fault excitations,” Eng. Struct., vol. 30, no. 5, pp. 1187–1198, 2008.
[31] R. B. Salic, M. a Garevski, and Z. V Milutinovic, “Response of Lead-Rubber Bearing Isolated Structure,” Response lead rubber Bear. Isol. Struct., 2008.
[32] V. Kilar and D. Koren, “Usage of Simplified N2 Method for Analysis of Base Isolated Structures,” 14 th World Conf. Earthq. Eng. Beijing, China, 2008.
[33] Saiful Islam. A. B. M., Jameel. M., Ahmad. S. I., and Jumaat. M. Z., “Study on corollary of seismic base isolation system on buildings with soft story,” Int. J. Phys. Sci., vol. 6, no. 11, pp. 2654–2661, 2011.
[34] D. Sarno, “Application of Base Isolation To a Large Hospital in,” Control, 2007.
[35] B. R. Jayalekshmi and H. K. Chinmayi, “Effect of soil stiffness on seismic response of reinforced concrete buildings with shear walls,” Innov. Infrastruct. Solut., vol. 1, no. 1, p. 2, 2016.
[36] P. P. J. P. Mr. Magade S. B, “Effect of Soil Structure Interaction On The Dynamic Behavior of Buildings,” IOSR J. Mech. Civ. Eng., pp. 9–14, 2008.
[37] I. Gjorgjiev, M. Garevski, K. Edip, V. Sesov, and J. Cvetanovska, “Effects of Soil Medium on Response of Base Isolated Multistory Frame Structures,” 15th World Conf. Earthq. Eng., 2012.
[38] F. Hatami, “Effects of Soil-Structure Interaction on the Seismic Response of Base Isolated in High-Rise Buildings,” vol. 4, no. 3, pp. 237–242, 2015.
[39] S. M. Nigdeli, G. Bekdaş, and C. Alhan, “Optimization of seismic isolation systems via harmony search,” Eng. Optim., vol. 46, no. 11, pp. 1553–1569, 2014.
[40] A. Baratta and I. Corbi, “Optimal design of base-isolators in multi-story buildings,” Comput. Struct., vol. 82, no. 23–26, pp. 2199–2209, 2004.
[41] S. Etedali, M. R. Sohrabi, and S. Tavakoli, “Optimal PD/PID control of smart base isolated buildings equipped with piezoelectric friction dampers,” J. Earthq. Eng. Eng. Vib., vol. 12, no. 1, pp. 39–54, 2013.
[42] T. R. W. Ashish R. Akhare*1, “Seismic Performance of RC Structure Using Different Base Isolator,” Int. J. Eng. Sci. Res. Technol., vol. 3, no. 5, pp. 1–6, 2014.
[43] S. Nagarajaiah and X. Sun, “Seismic performance of base isolated buildings in the 1994 Northridge earthquake,” in 11 world conference on earthquake engineering, 1996.
[44] M. Celebi, Design of Seismic Isolated Structures: From Theory to Practice, vol. 16, no. 3. 2000.
[45] Http://www.dis-inc.com/key_people.html, “http://www.dis-inc.com/technical.html.” .
[46] CSI, “ETABS Integrated Software for Structural Analysis and Design,” pp. 1–74, 1995.
[47] A. E. Seifried and J. W. Baker, “Spectral variability and its relationship to structural response estimated from scaled and spectrum-matched ground motions,” Earthq. Spectra, vol. 32, no. 4, pp. 2191–2205, 2016.
[48] S. K. Jain, “Review of Indian seismic code, IS 1893 (Part 1): 2002,” Indian Concrete Journal, vol. 77, no. 11. pp. 1414–1422, 2003.
[49] CSI, “Integrated Building Design Software.” Berkeley, California,USA.
[50] CSI, “CSI Analysis Reference Manual,” I: Berkeley (CA, USA): Computers and Structures INC. p. 496, 2013.
[51] K. Shakeri, M. A. Shayanfar, and T. Kabeyasawa, “A story shear-based adaptive pushover procedure for estimating seismic demands of buildings,” Eng. Struct., vol. 32, no. 1, pp. 174–183, 2010.
[52] V. A. Matsagar and R. S. Jangid, “Influence of isolator characteristics on the response of base-isolated structures,” Eng. Struct., vol. 26, no. 12, pp. 1735–1749, 2004.
[53] T. H. Heaton, J. F. Hall, D. J. Wald, and M. W. Halling, “Response of high-rise and base-isolated buildings to a hypothetical mw 7.0 blind thrust earthquake.,” Science, vol. 267, no. 5195, pp. 206–211, 1995.
[54] T. E. Kelly, “Base Isolation of Structures,” no. July, p. 229, 2001.
[55] Z. W. Geem, J. H. Kim, and G. V. Loganathan, “A New Heuristic Optimization Algorithm: Harmony Search,” Simulation, vol. 75, no. 2, pp. 60–68, 2001.
[56] P. PAN, D. ZAMFIRESCU, M. NAKASHIMA, N. NAKAYASU, and H. KASHIWA, “Base-Isolation Design Practice in Japan: Introduction To the Post-Kobe Approach,” J. Earthq. Eng., vol. 9, no. 1, pp. 147–171, 2005.
[57] Pear, “http://peer.berkeley.edu/.” [Online]. Available: http://peer.berkeley.edu/.
Cite This Work
To export a reference to this article please select a referencing stye below:
Related Services
View all


Related Content
All TagsContent relating to: "Technology"
Technology can be described as the use of scientific and advanced knowledge to meet the requirements of humans. Technology is continuously developing, and is used in almost all aspects of life.
Related Articles

DMCA / Removal Request
If you are the original writer of this dissertation and no longer wish to have your work published on the UKDiss.com website then please: