Optimization of Cable Fault Recognition Using Fisher’s Ratio Feature Selection
Info: 8121 words (32 pages) Dissertation
Published: 17th Feb 2022
Tagged: EngineeringElectronics
Abstract
Polyethylene polymers, especially cross-linked polyethylene (XLPE), are widely used in high voltage transmission cables. It has been reported in literature that newly installed cable accessories can pass typical commissioning tests and yet show significant PD activity leading to premature failure in the long term. [29] The degradation process of XLPE insulation can be categorized into two main groups. The first one is due to voids, contaminants, physical imperfections, or poorly dispersed components and the second would be due to physical or chemical changes or trapped charges in the cables. The partial discharge measurements have been widely used in the field of insulation diagnostics. Partial discharge (PD) technique is one of the effective methods to identify this slowly developing fault. For studying the aging mechanism, space charge accumulation and local electric field are the important parameters. The presence of partial discharges inside the cable indicates the degradation of insulation material.
In the history of Partial discharge, various pattern recognition methods to classify PD have been introduced where each of them has its own pros and cons. Furthermore, most of the research on PD are usually done in a noise-free environment and using lab fabricated insulator as the material. In this research, PD data measured from real cable joints with artificially created defects were used. In all the PD data collected, not all of them are equally important and useful in classifying different PD pattern which means some of the data collected are useless or have low significance value. Therefore, feature extraction using Fisher’s Ratio Feature Selection is proposed.
Table of Contents
CHAPTER 1. INTRODUCTION
1.1 Research Background
1.2 Problem Statement
1.3 Research Objective
1.4 Research Scope
1.5 Research Contribution
2. LITERATURE REVIEW
2.1 Prior Work
2.2 Summary
3. PROPOSED METHODOLOGY
4. CONCLUSION
REFERENCES
Chapter 1: Introduction
1.1 Research Background
Power cables are very important and sensitive devices in the power system, and they play an important role in the safety of the power load and reliable transmission of electricity. Nowadays, the majority of power cables are insulated with polymeric material. Cross-linked polyethene (XLPE), as the main polymeric insulation, is widely used as electrical insulation material for high voltage distribution power cables. The power cables may be exposed to high currents and voltages and they are critical parts of the transmission infrastructure. Therefore, they are expected to have high resistance against possible failures [1].
Damage of insulation can lead to equipment failure and other disorders. The insulation degradation is inevitable during the operation and the failure rate of XLPE cable increases with service time [2]. The cables are permanently exposed to thermal ageing during operation and it may change in dielectric parameters of cables and irreversible damage of cable insulation. High reliability of the electrical insulation system is of key importance to any high voltage apparatus. The effect of many parameters or mechanisms needs to be carefully assessed when designing electrical insulation systems. The effects of humidity, temperature, pollution/contaminants, mechanical and electrical stress, and external pressure need to be assessed in order to assure high reliability of the insulation system.
So, the research on the application of detection and diagnosis technology for insulation defects in HV XLPE cable line is particularly urgent. Studies have shown that defects of power cable insulation at an early stage can be detected by partial discharge sensitively. Partial discharge is also a major cause of insulation degradation, so it is often seen as one of the main parameters for the electrical equipment insulation status. Partial discharges are localized electrical discharges which partly bridges the insulation between the electrodes. The detection and continuous monitoring of PD data can provide useful information regarding the insulation condition. As PD occurs before the complete breakdown, PD monitoring can alarm for necessary emergent actions in order to remove the system component before the occurrence of catastrophic failure [2].
Further, it has been observed that polymeric insulation materials, like XLPE, may have a complete breakdown within a few days after the inception of partial discharge. Therefore, many researchers still aim to relate partial discharge to the lifetime of insulation materials. However, defining such a quantitative relationship is difficult to confirm. Partial discharge measurements are performed with the help of Phase Resolved Partial Discharge Analyzer (PRPDA). This technique is used to analyze the PDs with respect to the phase angle of applied voltage [5]. The PD pattern recorded with the help of PRPDA can be used to recognize the insulation defects which are the root cause of partial discharges.
The aim of many researches regarding the PD measurements is to automate the PD pattern recognition process which allows predicted behavior of partial discharge activity [4]. It is believed that each type of PD mechanism has a unique set of statistical parameters like skewness, kurtosis [3-5] and others. The variations in PD pattern with respect to phase angle can be reflected by a change in these statistical quantities. Different techniques of automated learning such as neural networks, fuzzy logic and clustering are used to compare the PD patterns which allows the prediction of insulation degradation.
Furthermore, the ultrawideband characteristics of the individual discharge pulses observe by means of nonconventional PD detection methods allows the detection of various type of ageing mechanisms taking place inside the insulation [6]. Thus, it’s quite possible to devise an intelligent and automated insulation diagnostic system based on the quantification of the partial discharge signals.
Feature extraction selection is one of the most important tasks for dimensionality reduction in pattern recognition problems. There are two steps in feature extraction: first, the information relevant to the classification is extracted from raw data to a parameter vector X with m dimensions; second, feature vector Y with n dimensions (n
Both methods search optimal directions for the projection of input data onto a lower dimensional space. The task of linear discriminant feature extraction algorithms is to reduce the dimensionality of pattern observation space by finding a suitable linear subspace in which the class separability is optimally maintained. Therefore, in this work, Fisher’s Ratio Feature Selection is proposed.
1.2 Problem Statement
Feature extraction is one of the important steps in any pattern recognition task. The efficient feature extraction technique extracts the feature which is able to discriminate one pattern from another accurately. If the feature vector is of high dimension, it is reduced to lower dimensional subspace using the techniques like Principal Component Analysis (PCA) and Linear Discriminant Analysis (LDA). These techniques are also known as dimensionality reduction techniques.
Dimensionality reduction of the features is done so that the computational cost and system complexity for subsequent processing can be decreased. Linear Discriminant Analysis [7][8][9] finds a linear transform by maximizing the Fisher’s ratio and is found to be good in discriminating patterns. In a big dimension of PD data, not all of the input data extracted has the same significance level for PD pattern recognition. By using input PD data with high significance level and ignoring the low significance data, classification accuracy under noise contamination could be improved. One of the major challenges of on-site partial discharge PD measurements is the (PD) recovery of PD signals from a noisy environment. The different sources of noise include thermal or resistor noise added by the measuring circuit and high-frequency sinusoidal signals that electromagnetically couple from radio broadcasts and or carrier wave communications.
For a sensitive PD measurement, these disturbing signals have to be rejected. In the case of development and routine tests, the PD measurements are carried out in the manufacturer’s shielded laboratories, with filtered mains, to reach the demanded measurement sensitivity. However, the problems faced in PD measurements performed in unshielded laboratories as well as on-site conditions, is the strong coupling of external noise, particularly from broadcasting stations.
1.3 Research Objectives
The key objectives of this work are:
- To propose feature extractions using Fisher’s Ratio Feature Selection from PD data and artificial intelligence classifiers to identify PD types from cable joint defects.
- To compare the performance of the proposed Fisher’s Ratio Feature Selection based input data against normal input features under noisy condition using different classifiers.
1.4 Research Scope
In this work, the research seeks to do an analysis on the feature extractions impact towards classifying the faults or defects in the cable. In this case, the proposed feature extraction method is the Fisher’s Ratio Feature Selection. As stated earlier, feature extraction is a vital procedure in order to increase the accuracy in classifying partial discharge (PD) pattern. Feature extraction will be able to reduce the dimension of a feature vector by extracting out the data which have a lower significance level. By keeping data with high significance level and inputting them into artificial intelligence classifier would have a better and more accurate result.
After performing feature extraction, the data will input to artificial intelligence classifier in order to check whether the classifier performs a good pattern recognition of the cable faults. In this research, an investigation on which classifier gives the highest accuracy in recognizing partial discharge (PD) pattern is performed. Last but not least, classification under noisy environment will also be performed in order to imitate the situation in real life as close as possible.
1.5 Research Contribution
The main contribution of this research are:
- A feature extraction named Fisher’s Ratio Feature Selection which could possibly increase the accuracy of PD classification with or without noise contamination has been proposed.
- Imitation of real time event on site by experimenting using actual cable joint samples.
- Investigation on different classifier in artificial intelligence which results in the highest accuracy in PD classification is performed.
Chapter 2: Literature Review
Partial discharges (PD) are one of the main causes of deterioration of insulating material in power transformer windings. Many researches already had been done to find PD mechanism, the PD detection techniques, the relationship between PD and the damage they cause to insulating materials and insulating system, the location of PD sources and the problems related to avoid external interference [10]. The reliability of power transformers mainly depends on the condition of insulation. Therefore any indication of terrible failure must be detected at early stage. It is widely accepted that the presence of PD may start and lead to failure of power transformer.
Even though there is no direct relationship between occurrences of PD in power transformer failure, it is widely accepted that the presence of PD may start and lead to failure of power transformer. If the PD pulse allowed to growing over time, it can cause the insulation to deteriorate which may lead to complete breakdown of the power transformer insulation [11]. PD is an electrical discharge or sparks that bridge small fraction of insulating between two conducting electrodes. PD can occur when electric field strength goes beyond the breakdown strength of insulation and can lead to flashover [12]. PD is most common phenomena which occur in high voltage equipment especially power transformer and power cables. Several causes of occurrence of PDs are ageing in the insulation and electrical overstressing on equipment or presence of defects (voids, cracks) presented during manufacturing [13]. Power transformer reliability can be seriously affected by partial discharge (PD) [14].
FISHER LINEAR DISCRIMINANT ANALYSIS
Fisher linear discriminant analysis (FLDA) is a mathematical transformation method from multidimensional to one-dimensional space which can be used in dimensionality reduction and pattern classification. The basic idea of FLDA is to project an n-class m-dimensional data to one direction (one straight line, called projection line) and to possibly separate classes (maximizing between-class distance and minimizing within- class distance). Let us consider a two-class problem {w1,w2 } as well as the linear discriminant function. Assume that x is d-dimensional original samples, m1 and m2 are the means of the two class samples, S1 and S2 are the within-class scatter matrices of the two samples, then Sw is the total within-class scatter matrix Sw = S1 + S2 and Sb is the between-class scatter matrix of the class samples. Then a projection or transformation is carried out to the original samples y=wTx where w is the weight vector or projection direction, µ1 and µ2 are the transformed mean of two samples, σ1 and σ2 are the transformed within-class scatter matrices, σw is the transformed total within-class scatter matrix, σb is the transformed between-class scatter matrix.
The objective of FLDA is now to seek the w*which is the most easily classification vector or the best projection direction from d-dimension to 1-dimension and make the projected ratio of between-class distance and within-class distance maximum. Thus the definition of Fisher linear discriminant function is:
JFw=μ1-μ22σ1+σ2=wTSbwwTSww (1)
So, the best weight vector or the best projection direction is a vector w*which makes JFwmaximum. Then w1 or could be classified only by a threshold θ’s achievement after the w*’s determination. y=w*x-θ>0, x ϵ ω1
θ=N1μ1+N2μ2N1+N2 (3)
In formula (3), N1 and N2 are the numbers of the two samples.
ANN (ARTIFICIAL NEURAL NETWORK)
Different types of ANN have been successfully employed for PD classification problems. The most used ANN for such classification purposes are the Back Propagation Network (BPN) [15, 17, 18, 20-24], the Kohonen Self- Organizing map [21], Nearest Neighbor Classifier (NNC) [22] and the Learning Vector Quantization (LVQ) network [21,22]. These networks differ in their capabilities, since each of them has its own structure and training procedure, for example, the network may be trained in either a supervised fashion or in an unsupervised fashion.
The main advantage of the BPN is its ability to create clustering shapes that are highly nonlinear and capable of forming arbitrary decision boundaries between the classes. On the contrary, LVQ is piecewise linear, since it is based on the nearest neighbor rule. Further, Modular Neural Network (MNN) based on task decomposition is also used for classification of PD [25].
More recently, Counter Propagation NN [26] and Adaptive Resonant Network [27] have been used for identification of PD source. The progress in computer measurement techniques has made it possible to calculate various statistical parameters from all discharge pulses being detected during the measurement period. The computer measurement technique showed the possibility of more accurate diagnosis. The important parameters that characterize PD are discharge magnitude, Q, number of pulse count, n of PD pulse and phase angle of the applied voltage, φ. Since, each defect has its own characteristic discharge parameters, different discharge sources will result in different patterns. Thus, PD pattern recognition may be effectively employed to discriminate between different types of PD activities that occur in the insulating systems of electrical apparatus.
Further improvements in characterizing discharges have been also shown by applying statistical operators that could provide an even more effective means for the discrimination of information. The PD patterns are composed of above three parameters are φ -q, φ -n, q-n and φ -q-n patterns. However, the complexity of these patterns makes it difficult to find effective parameters for the diagnosis. A φ -q pattern indicates the mean PD magnitude of the pulses in each phase window. To obtain a φ -q-n pattern, the matrix like windows is set for phase angle and PD magnitude. The number of pulse count, n, which is defined as the number of PD in each cell per unit time and is normalized by the maximum value among all cells. In both φ -q and φ -q-n patterns, one can see the difference between the patterns before and after the discharge initiation.
In addition, it seems that one can discriminate more accurately with φ -q-n patterns than with φ -q patterns, because φ -q-n patterns provide a larger amount of information. However, the quantitative expression of these patterns is difficult because of the complexity of the patterns. It is expected that the ANN is able to recognize the differences between these patterns. Following sections review the architecture of different ANN used for PD classification problems.
Back Propagation Network:
It is essentially a feed forward network composed of an organized topology of interconnected processing elements (PE) called neurons. It consists of an input layer, an output layer and one or more hidden layers. Figure 1 shows a three layer back propagation network. As shown, each neuron in the input layer is connected to all neurons in the hidden layer and each neuron in the hidden layer is connected to all neurons in the output layer. The learning fingerprints of different defects are presented to the ANN in a random way. This helps the ANN to learn.
The main purpose of the hidden layer is to extract features of the different PD sources and pass its knowledge to the output layer (or succeeding hidden layer if there is more than one hidden layer). The number of processing elements in the input layer is equal to the number of the statistical operators (input patterns) and in the output layer is equal to the number of defects to be classified. Learning constitutes the means by which the ANN adapts itself to the desired output.
This adaptation is performed through a change in the weights, which gradually converge to values that ensure that each input vector produces the correct output. The network is trained in a supervised fashion. It then runs through a series of iterations, where in each iteration, it compares its own output with the desired response until the rms error at the output layer is smaller than a certain number called convergence criterion. For example, the network is trained for two defects; say Defect A and Defect B. If the fingerprints are presented to the ANN, the desired outputs are Defect A=1 and at the same time Defect B=0.
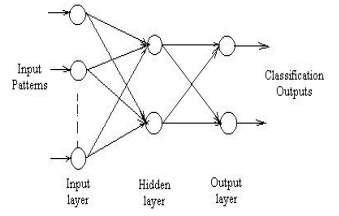
Figure1: Structure of Back Propagation Network with Three Layers
Kohonen Self-Organizing Map
In this network, each PE of the input and the output layer is fully connected to the element of the Kohonen (KOH) layer, as shown in Figure 2. Each PE of the KOH layer measures the Euclidean distance between its weights and the input values. The weights are randomly generated at the beginning of the learning process. During the learning process, the KOH PE with the smallest distance adjusts its weights closer to the input data. The neighboring element in the KOH layer also adjusts their weights closer to the same input data.
A problem that is associated with this type of learning is that only one PE can adjust the weights. For example, if the KOH PE number 1 adjusted its weights closer to the defect A, then it is much c loser to this defect than any other PE. If another defect A fingerprint is presented to the ANN, then the PE number 1 may again adjust its weights to the defect A etc. However, it means that only PE number 1 adjusts its weights to defect A while the other PE simply does not learn. This problem can be overcome by introducing the conscience mechanism. If the KOH PE has won more than the average frequency, 1/N (N= number of learning cycle) then increasing the distance from the particular defect punishes it, thus, its probability to win in the next round is reduced.
Also, if the KOH PE has won
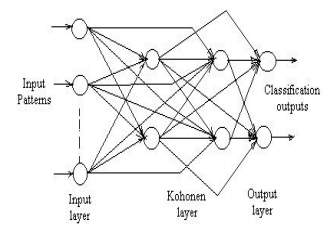
Figure 2: Kohonen Network with Classification.
Nearest Neighbor Classifier
In this classifier, the classes are represented in a pattern space and it is determined that to which of these classes an unspecified pattern of pulse shape feature belongs. The decision is based on the shortest distance to the neighboring class cavity size sample. Thus, the distance matrix must be specified in order to measure the similarity of the pattern sample in the geometric pattern space. The most common matrices used is the Euclidean distance measure, which is obtained in terms of the input pattern distance to all the stored pattern, that is, the pulse shape features.
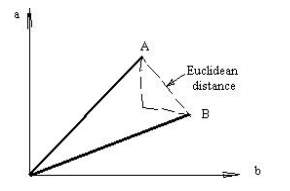
Figure 3: Euclidean Distance Measure.
For example, as shown in Figure 3, the vectors A and B denote the two pulse shapes of the PD occurring within two cavities of different size respectively. When a new pulse shape enters the network, the distance between the input pulse shape and all the stored pulse shapes is calculated and sorted to determine the prototype with the least distance. The NNC structure is very simple because there is no iterative training involved. However, it is computationally very demanding, since all training PD pulse shapes must be stored and the distance computations and sorting for each pulse to all prototype may take a long time on the computer, especially for complex problems with many dimensions.
Learning Vector Quantization Network
The LVQ approach is by definition a NNC (define what is NNC) with adaptively trained codebook vectors to enhance the classification performance. Essentially, an LVQ network begins the classification task as an unsupervised learning NNC and completes it as a supervised learning NN to minimize the classification error. The basic structure for this network is shown in Figure 4 and was originally suggested by Kohonen. The network consists of an input layer, the Kohonen layer with the same number of processing elements as the number of class and the output layer. The learning process is as follows.
The Euclidean distance between the learning vector and the weights of each neuron at the Kohonen layer is calculated. The nearest PE is declared as the winner. If the winning PE is in the class of the learning vector, then its distance to a particular class is decreased by moving weights of the winning PE towards the learning vector. Thus, the probability of winning in the next round is increased. If the winning PE is not in the class of the learning vector, then its distance to a particular class is increased by moving weights of the winning PE away from the input vector. Thus, the probability of the winning for this PE in the next round is decreased.
The whole process is repeated until N= 3 to 5 l, where l depends on the number of PE and learning coefficient of the network. In the classification mode, the distance of the unknown input vector to each PE is computed and the nearest element is declared as a winner.
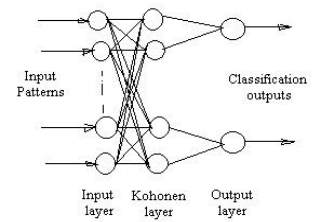
Figure 4: LVQ Network for PD Classification
Modular Neural Network based on Task Decomposition
In this, the recognition of PD sources is decomposed into sub-tasks, each of which is to identify a particular PD source by a sub-network. Each sub-network can be trained and tested individually or in parallel. The sub-network used is BPN type with a sigmoid as the activation function for the PE in the hidden and output layers. The output of the network can be regarded as the probability of a particular input belonging to the PD source represented by a sub-network. The outputs from the sub-network are connected with a maximum selector that identifies the sub-network with the largest output as shown in Figure 5. It is observed that as compared with a single NN, modular NN has a higher speed of convergence, a higher accuracy and a better recognition ability. Better performance of modular NN can be expected, if the structure of the sub-network is optimized.
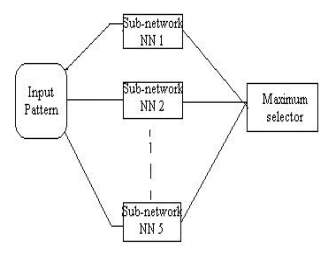
Figure 5: The Structure of the MNN Classifier.
Counter propagation Network
Counter propagation Network Counter propagation networks are often used for rapidly prototyping a complex system-containing mapping networks. The approach is based on applying variants of counter propagation network architecture to the classification of PD patterns. These patterns are derived from physically related discharge parameters, different from those commonly used.
Adaptive Resonant Network
The stability of the clusters formed by a competitive learning network is not guaranteed. The winning unit may continue to change even when the same set of unit vectors is continuously presented. This may be prevented from happening by gradually reducing the learning rate to zero. However, the network will not then be able to learn new clusters. The concept of the Adaptive Resonant Theory (ART) model allows it to learn new patterns without forgetting those already known. Thus, the ART network needs no separate training period like the networks used so far for PD measurements, because it learns continuously.
The stability of the clusters formed by a competitive learning network is not guaranteed. The winning unit may continue to change even when the same set of unit vectors is continuously presented. This may be prevented from happening by gradually reducing the learning rate to zero. However, the network will not then be able to learn new clusters. The concept of the Adaptive Resonant Theory (ART) model allows it to learn new patterns without forgetting those already known. Thus, the ART network needs no separate training period like the networks used so far for PD measurements, because it learns continuously during classification. Figure 6 shows a typical hierarchy layers used in the PD classification problem from noises.
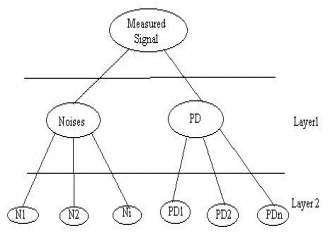
Figure 6: Hierarchy Layers in the Classification using ART Network.
From early PD recognition techniques, much research has been done recently in the application of ANN. Table1 presents the state-of –the-art of PD recognition technique along with the network used to detect different PD source.
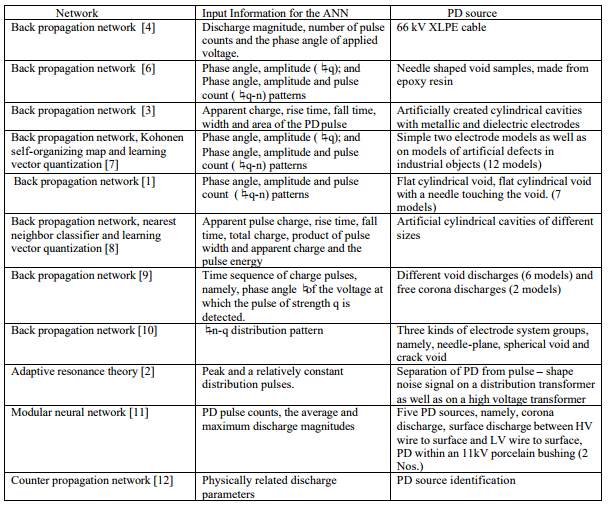
Table 1: The state-of –the-art of PD recognition technique. [28]
2.1 Prior Work
AN UNDECIMATED WAVELET TRANSFORM BASED ENHANCEMENT, STATISTICAL FEATURE EXTRACTION AND DETECTION-CLASSIFICATION OF PD SIGNALS
Two researchers named Pradeep Kumar Shetty and T.S.Ramu address the problem of recognition and retrieval of relatively weak industrial signal such as Partial Discharges (PD) buried in excessive noise. The major bottleneck being the recognition and suppression of stochastic pulsive interference (PI) which has similar frequency characteristics as PD pulse.
In their paper, they provide techniques to de-noise, detect, estimate and classify the PD signal in a statistical perspective. A multi-resolution analysis based technique is incorporated to discard the huge amount of redundant data in acquired signal. A scale dependent MMSE based estimator is implemented in undecimated wavelet transform (UDWT) domain to enhance the noisy signal. characterize the PD and PI pulses using a statistical model as the first moment of multi variate Gaussian distribution and its parameters are estimated using maximum likelihood (ML) and maximum aposteriroi probability (MAP) based techniques. A statistical test known as generalized log likelihood ratio test (GLRT) was incorporated to ensure the existence of the pulse. The decision as to whether a pulse is a noise or the desired signal has been made based on a weighted-nearest neighbor methodology.
FEATURE EXTRACTION OF PARTIAL DISCHARGE SIGNALS USING THE WAVELET PACKET TRANSFORM AND CLASSIFICATION WITH A PROBABILISTIC NEURAL NETWORK
Partial discharge (PD) classification in power cable accessories and high voltage equipment in general is essential in evaluating the severity of the damage in the insulation. In this article, the PD classification was realised as a two-fold process.
Firstly, measurements taken from a high-frequency current transformer (HFCT) sensor were represented as features by means of a transformation to the classifier and secondly, the probabilistic neural network (PNN) classifier itself was capable of effectively recognising features coming from different types of discharges. The feature that was used as a fingerprint for PD characterization was extracted from the moments of the probability density function (PDF) of the wavelet coefficients at various scales, obtained through the wavelet packets transformation. The PNN classifier was used to classify the PDs and assess the suitability of this feature vector in PD classification. Four types of artificial PDs were created in a high voltage laboratory, namely corona discharge in air, floating discharge in oil, internal discharge in oil and surface discharge in air, at different applied voltages, and were used to train the PNN algorithm.
The results obtained here (97.49, 91.9, 100 and 99.8% for the corona, the floating, the internal and the surface discharges, respectively) are very encouraging for the use of PNN in PD classification with this particular feature vector. This article suggests a feature extraction and classification algorithm for PD classification, which when combined together reduced the dimensionality of the feature space to a manageable dimension, and achieved very high levels of classification.
A NEW HYBRID FEATURE EXTRACTION METHOD FOR PARTIAL DISCHARGE SIGNALS CLASSIFICATION
In this research, a new hybrid feature extraction method combining adaptive optimal radially Gaussian kernel (AORGK) time-frequency representation with two dimensional non-negative matrix factorization (2DNMF) is proposed for partial discharge (PD) classification.
Firstly, AORGK is applied to obtain the time-frequency matrices of PD ultra-high-frequency (UHF) signals. Then 2DNMF is employed to compress the AORGK amplitude (AORGKA) matrices to extract various feature vectors with different (d1, d2) combinations, i.e. (5, 5), (5, 10), (10, 5) and (10, 10).
Finally, the extracted features are classified by fuzzy k nearest neighbor (FkNN) classifier and back propagation neural network (BPNN). 600 samples sampled from four typical artificial defect models in Laboratory are adopting for testing of the proposed feature extraction algorithm. It is shown that the success rate by FkNN and BPNN are all higher than 80%, and FkNN has superior classification accuracies than BPNN under four circumstances of (d1, d2) combinations. In addition, FkNN achieves the highest classification accuracy 93.73% with (10, 5) combination. The results demonstrate that it is feasible to apply the proposed algorithm to PD signal classification.
PATTERN RECOGNITION OF PARTIAL DISCHARGE IN XLPE CABLE BASED ON PHASE DISTRIBUTION
In order to analyze the type of XLPE cable partial discharge, and grasp characteristics of partial discharge caused by different defects. In this research, they use a 10kV 30-meter-long XLPE cable and design different types of defects. Then they collect the PD data of different defect model by PD data acquisition system. To characterize Partial discharge signals generated by different defect model by use of discharge capacity qs, discharge times n , the average discharge amount qn and phase distribution function include the maximum discharge amount distribution HQmax(φ) , the average discharge amount distribution HQmean(φ) , the discharge times phase distribution HN(φ) as well as φ-Q-N distribution map and so on. The results show that the partial discharge signals produced by different defect model have different statistical characteristics.
PARTIAL DISCHARGE ANALYSIS USING PCA AND ANN FOR THE ESTIMATION OF SIZE AND POSITION OF METALLIC PARTICLE ADHERING TO SPACER IN GAS-INSULATED SYSTEM
The presence of metallic particles can adversely affect the reliability of Gas-Insulated Substation (GIS) by initiating partial discharges (PDs). Therefore, the investigation of PD characteristics and particle size and position on the spacer surface are the significant steps toward the reliability improvement of the GIS equipments. This paper presents the use of Back-Propagation Artificial Neural Network (BP-ANN) technique supplemented with Principal Component Analysis (PCA) as the PD pattern recognition tools for the estimation of the particle size (length) and position on the spacer surface in a simulated GIS. PD features acquisition was performed by collecting their fingerprints from the measurements carried out using IEC 60270 method.
The role of PCA is to reduce the dimension of the collected PD fingerprint data. The obtained results show that PCA can significantly improve the BP-ANN performance in terms of execution time. Without PCA, 88% and 92% accuracies can be achieved when BP-ANN was implemented with 1 and 2 hidden layers, respectively. With the integration of PCA, execution times were greatly reduced while retaining fairly high accuracy, i.e. 88% and 88%. Thus the proposed method is a contribution in the development of the tool for improving the reliability of GIS.
PARTIAL DISCHARGE PATTERN RECOGNITION VIA SPARSE REPRESENTATION AND ANN
In this study, seventeen samples were created for classifying internal, surface, and corona partial discharges (PDs) in a high voltage lab. Next, PDs were measured experimentally to provide a dictionary comprising the types. Due to the huge size of the recorded dataset, a new and straightforward preprocessing method based on signal norms was used to extract the appropriate features of various samples. The new sparse representation classifier (SRC) was computed using ℓ 1 and stable ℓ 1 -norm minimization by means of Primal-Dual Interior Point (PDIP) and Basis Pursuit De-noise (BPDN) algorithms, respectively. The pattern recognition was also performed with an artificial neural network (ANN) and compared with the sparse method. It is shown that both methods have comparable performance if training process, tuning options, and other tasks for finding the best result from ANN are not taken into account. Even with this assumption, it is shown that SRC still performs better than ANN in some cases. In addition, the SRC technique presented in this paper converges to a fixed result, while the results after training the ANN vary with every run due to random initial weights.
2.2 Summary
There are various methods and ways to classify PD patterns while each having their pros and cons. ANN (Artificial Neural Network) without a doubt would be one of the best methods to be used in classifying PD patterns as there are many research progressing based on ANN. As for the feature extraction, there are various methods too such as wavelets, PCA, and also sparse representation.
Chapter 3: Proposed Methodology
In this research, analysis on the PD classification pattern based on the 5 defects which usually occur on site in actual XLPE cable joints. In order to obtain high level significance input while discarding the low level significance input, feature extraction was proposed which is the Fisher’s Ratio Feature Selection. It is vital to perform feature extraction on the input data because it helps to increase the accuracy when those inputs were used as training for different classifier in artificial intelligence. After extracting out the useful input features, those input features will be fed to various artificial intelligence classifier to identify multiple PD patterns. Different classifier will bring different result and the best result will be chosen as the best work in classifying PD pattern in this research.
Normally, input feature without noise contamination will be only fed to the classifier for training but in this research, input feature with noise contamination will be used in order to bring this up a level so that this experiment will be similar to the event which is happening on site. All the simulation in this research will be done using a software which is MATLAB. Since MATLAB contains Artificial Neural Network toolbox which provides algorithms, pre-trained models, and apps to create, train, visualize, and simulate both shallow and deep neural networks. It is possible to perform classification, regression, clustering, dimensionality reduction, time-series forecasting, and dynamic system modeling and control using MATLAB.
Gantt Chart
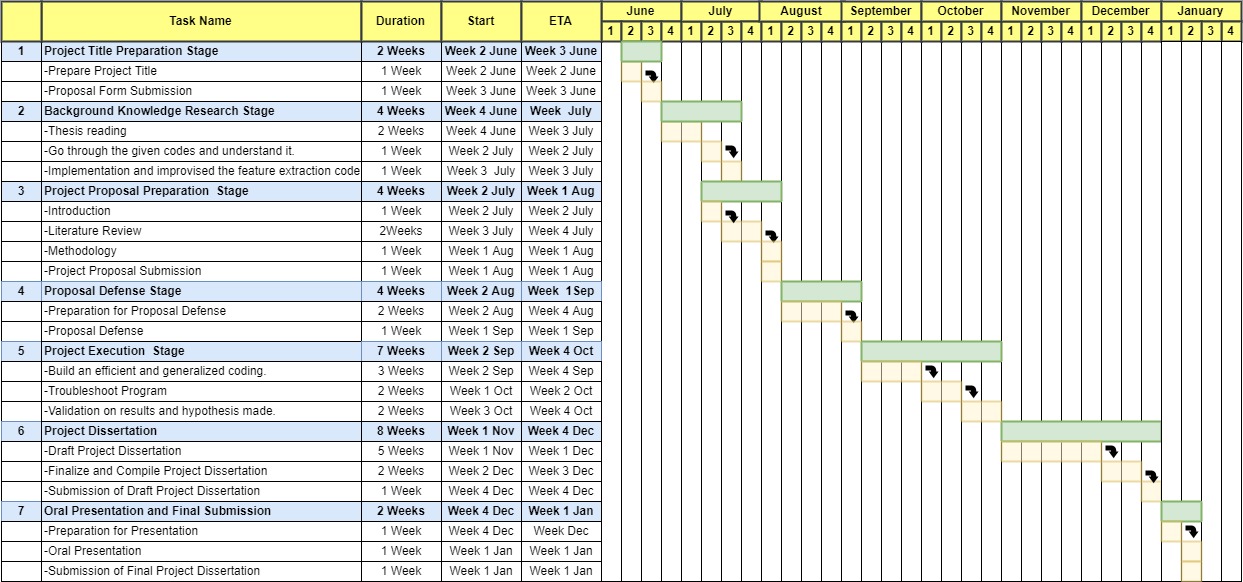
Figure 7: Gantt Chart outlining FYP work.
The above Gantt Chart is the outline of the task during the whole period of completing this research. The project started in May 2017 and it will last until January 2018. The Gantt Chart covers progress from the very beginning which is preparation on project title until final submission of final year project dissertation. This outline will serve a guide as the research progresses so that I will be able to complete all the required tasks and objectives on time and complete my final year project.
Flow Chart
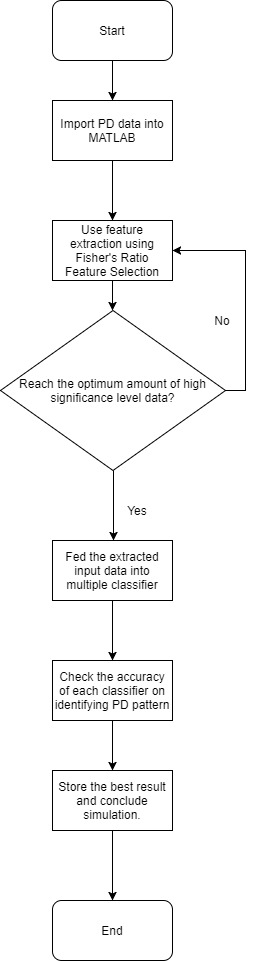
Figure 8: Flowchart of general flow of the program
The flowchart above represents the overall program’s framework. Generally, the framework will be as Figure 8 but the in each step, the works need to be very detail and precise in order to generate an efficient program. Firstly, the obtained PD data need to be imported into MATLAB in order to be able to work with it, then using MATLAB coding, a feature extraction which is Fisher’s Ratio Feature Selection will be performed. The next step would be checking the optimum value of high significance data input in order to feed into artificial intelligence classifiers. Multiple artificial intelligence classifiers will be tested in order to get the highest accuracy in classifying different PD patterns. Data with noise contamination will be used in order to test the capability of feature extraction and classifiers working under noise contamination.
Chapter 4: Conclusion
In conclusion, there are lots of works and research have been completed on the recognizing different PD pattern using different techniques. Artificial Neural Network has been a very popular thing in the field of partial discharge as there are many works used ANN in recognizing PD patterns. As for Fisher’s Ratio Feature Selection, there are still no works which use Fisher’s Ratio to do feature extraction, thus it would be wise and interesting to propose this method in this project. Furthermore, Fisher’s Ratio Feature Selection is popular in performing classification and reducing large dimensionality of data which is what I aim for and therefore this will be a good investigation to perform.
References
Petzold, F. Et al..’Advance solution for on-site diagnosis of distribution power cables. In:Electrical Distribution – Part 1, 2009. CIRED 2009. 20th International Conference and Exhibition, 2009, pp.1-4.
Shuvalov, M. et al..’Analysis of Water Trees in Power Cable Polymeric Insulation. In: Journal Applied Polymer Science, Vol.88, 2003, pp.1543-1549.
G.C.Stone, “Partial discharge diagnostics and electrical equipment insulation condition assessment”, in Dielectrics and Electrical Insulation, IEEE Transactions, vol.12, no.5, Oct. 2005, pp.891-904.
I.Ticar, J.Pihler, O.Bíró, K. Preis, “Partial discharges in insulation of Medium Voltage Systems”, The international journal for computation and mathematics in electrical and electronics engineering, Vol.20, no.2, 2001, pp.473-481.
T. Okamoto, T. Tanaka, “Novel partial discharge measurement computer-aided measurement systems,” in Electrical Insulation, IEEE Transactions, vol.EI-21, no.6, Dec. 1986, pp.1015-1019.
P.H.F. Morshuis, “Time-resolved discharge measurements”, in Partial Discharge 1993, International Conference, 28-30 Sep 1993, pp.43-46.
C. M. Bishop, Pattern recognition and machine learning (Vol. 4, No. 4, p. 12). New York: springer, 2006.
N. Kumar, A. G. Andreou, “Heteroscedastic discriminant analysis and reduced rand HMMs for improved speech recognition”, Speech Communication, vol. 26, pp. 283–297, 1998. [Online]. Available: http://dx.doi.org/10.1016/S0167-6393(98)00061-2
R. O. Duda, P. E. Hart, & D. G. Stork, Pattern classification, John Wiley & Sons, 2001.
M. Danikas, N. Gao, and M. Aro, “Partial discharge recognition using neural networks: a review,” Electrical Engineering, vol. 85, pp. 87–93, 2003.
H. H. Sinaga, “Detection, Identification And Localization Of Partial Discharges In Power Transformers Using UHF Techniques".The University of New South Wales Australia. Doctor Of Philosophy, 2012.
M. Yaacob, M. AlSaedi, and N. A. Al Gizi, “Partial discharge signal detection using ultra high frequency method in high voltage power equipments: a review,” ijser.org, vol. 4, no. 1, pp. 1–6, 2013.
A. Rahman, L. Hao, P. Rapisarda, and P. Lewin, “Partial discharge simulation for a high voltage transformer winding using a model based on geometrical dimensions,” p. 106, 2012.
J. Ramírez-Niño and a Pascacio, “Acoustic measuring of partial discharge in power transformers,” Measurement Science and Technology, vol. 20, no. 11, p. 115108, Nov. 2009.
L. Satish and W. S. Zaengl, “Artificial Neural Networks for Recognition of 3-d Partial Discharge Patterns”, IEEE Trans. on Dielectrics and Electrical Insulation, Vol. 1, No. 2, 1994, pp. 265-275
H. Borsi, E. Gockenbach and D. Wenzel, “Separation of Partial Discharges from Puls e-shaped Noise Signals with the help of Neural Networks”, Proc. of IEE: Science, Measurement and Technology, Vol. 142, No. 1, 1995, pp. 69-74
A. A .Mazroua, M. M. A Salama.and R. Bartnikas, “PD Pattern Recognition with Neural Networks using the Multilayer Perceptron Technique”, IEEE Trans. on Electrical Insulation, Vol. 28, No. 6, 1993, pp. 1082-1089.
H. Suzuki and T. Endoh, “Pattern Recognition of Partial Discharge in XLPE Cables using a Neural Network”, IEEE Trans. on Electrical Insulation, Vol. 27, No. 3, 1992, pp. 543-549.
E. Gulski, “Computer-aided Measurement of Partial Discharges in HV Equipment”, IEEE Trans. on Electrical Insulation, Vol. 28, No. 6, 1993, pp. 969-983.
N. Hozumi, T. Okamoto and T. Imajo, “Discrimination of Partial Discharge Pattern using a Neural Network”, IEEE Trans. on Electrical Insulation, Vol. 27, No. 3, 1992, pp. 550-556
E. Gulski and A. Krivda, “Neural Networks as a Tool for Recognition of Partial Discharges”, IEEE Trans. on Electrical Insulation, Vol. 28, No. 6, 1993, pp. 984-1001
A. A. Mazroua, R. Bartnikas and M. M. A. Salama, “Discrimination between PD Pulse Shapes using Different Neural Network Paradigms”, IEEE Trans. on Dielectrics and Electrical Insulation, Vol. 1, No. 6, 1994, pp. 1119- 1131.
C. Cachin and H. J. Wiesmann, “ PD Recognition with Knowledge-based Preprocessing and Neural Networks”, IEEE Trans. on Dielectrics and Electrical Insulation, Vol. 2, No. 4, 1995, pp. 569-589.
T. Okamoto and T. Tanaka, “Partial Discharge Pattern Recognition for Three Kinds of Model Electrodes with a Neural Networks”, Proc. of IEE: Science, Measurement and Technology, Vol. 142, No. 1, 1995, pp. 75-84
T. Hong, M. T. C. Fang and D. Hilder, “ PD Classification by a Modular Neural Network based on Task Decomposition”, IEEE Trans. on Dielectrics and Electrical Insulation, Vol. 3, No. 2, 1996, pp. 207-211
M. Hoof, B. Freisleben and R. Patsch, “ PD Source Identification with Novel Discharge Parameters using Counter Propagation Neural Network, IEEE Trans on Dielectrics and Electrical Insulation, Vol. 4, No. 1, 1997, pp. 17-32.
H. Borsi, E. Gockenbach and D. Wenzel, “ Separation of Partial Discharges fro Pulse-shaped Noise Signals with the help of Neural Networks”, Proc of IEE: Science, Measurement & Technology, Vol. 142, No. 1 , 1985, pp. 69-74
M. G. Danikas, N. Gao, and M. Aro, "Partial discharge recognition using neural networks: a review," Electrical Engineering, vol. 85, pp. 87-93, May 01 2003.
D. Fynes-Clinton, PD Characteristics of Typical MV XLPE Power Cable Termination Defects at VLF and Power Frequency Test Voltages: University of the Witwatersrand, Faculty of Engineering and the Built Environment, School of Electrical and Information Engineering, 2016.
Cite This Work
To export a reference to this article please select a referencing stye below:
Related Services
View all


Related Content
All TagsContent relating to: "Electronics"
Electronics regards the science and technology involved in the development of electrical circuits and electronic devices and equipment that use them.
Related Articles

DMCA / Removal Request
If you are the original writer of this dissertation and no longer wish to have your work published on the UKDiss.com website then please: