Impacts of Voltage Unbalance on the Thermal Condition of Power Transformer
Info: 7076 words (28 pages) Dissertation
Published: 16th Dec 2019
Tagged: Electronics
Impacts of Voltage Unbalance on the Thermal Condition of Power Transformer
In this paper, the effect of unbalanced voltages on the temperature distribution of components within the power transformer is investigated. We applied CFD to the transformer winding through a commercial software based on FEM. Since the core, tank and clamping structures have a complex structure, 3D model is used to consider their electromagnetic-thermal behavior. To avoid spending too much calculation time for the thermal analysis of core, tank, flitch and clamp through fluid dynamics approach, thermal model based on the heat conduction equation with heat convection as boundary conditions is used for these area. The electromagnetic analysis is used to determine the power losses as the heat sources in the transformer. In this paper, the effective relative permeability theory is proposed for quasi-nonlinear modeling of core and structural steel components in the electromagnetic analysis. Finally, according to the results of transformer thermal analysis, it is suggested that for the proper temperature distribution within the transformer under unbalanced conditions, the load capacity of the transformer is corrected.
Keywords : Electromagnetic analysis, FEM, power transformer, thermal analysis, voltage unbalance.
e-mail: mikhak.2913@yahoo.com
* Corresponding author: Tel:+98-66-33120005, Fax: +98-66-33120005,
1. Introduction
The power transformer is one of the important equipment in the electricity system. The power transformer life is generally limited by the temperature of the hottest point. The standard transformer life is specified to the aging rate of insulation system when transformer operates at the normal condition. However, the high temperatures caused with abnormal operations can accelerate the aging rate of insulations and short the transformers life. Moreover, severe increase of the hot-spots temperature can lead to serious damage of the transformer [1, 2].
One of the abnormal conditions of the transformer is unbalanced voltages imposed on it through a power system. Although voltage unbalance often occurs on distribution systems [3, 4], voltage unbalance on power systems have also been reported [5, 6]. In many studies, unbalanced voltages in the electricity systems have been investigated [7] , but less attention has been paid to the effects of unbalanced voltages on the thermal conditions of the transformer. Hence, the purpose of this study is to investigate the effect of unbalanced voltages on the thermal conditions of the transformer power.
In this paper, the thermal analysis is employed on a 125 MVA, ONAN/ONAF transmission transformer that was recently repaired after a fault on the low voltage (LV) windings. The power transformer has complex components such as core, disc-type windings, tank, flitch, clamp, etc. To reveal unbalanced voltages effect on the transformer, all transformer components in the thermal modeling must be present. Duo to the involvement of heat, fluid flow and electromagnetics in transformer, the thermal analysis of all the transformer components at once is not possible. It is therefore essential that modeling techniques applied to various components of the transformer [8].
The heat generated inside the transformer is due to the power losses in the transformer. The transformer oil is considered as an important factor in the transfer of this heat. The transformer oil gains in temperature by absorbing heat in the heat transfer process and then directed to the radiators which dissipate the heat to the ambient air then cooled oil is returned into the transformer. Since the maximum temperature, called hot-spot, occurs on the upper discs of the LV winding of the transformer, numerical methods are developed for to predict the hot-spot temperature and thermal analysis of winding. These methods can be categorized into tow numerical techniques such as Thermal Network Models (TNM) [9-11] and Computational Fluid Dynamics (CFD) [12-15] to determine the oil flow and the temperature distribution in the winding. While network models can perform quick and simple estimate, they are heavily dependent on several empirical correlations that might not be valid for new the power transformer configurations with the different dimensions or local conditions. In this study, by implementing fluid dynamics through COMSOL Multiphysics that is a commercial software based on FEM, it is possible to characterize the fine detailed information of the distribution temperature in the computational domain, thus allowing a more complete understanding of the transformer windings under unbalanced and rated voltages.
In this study, the thermal analysis of all the transformer components under the unbalanced voltages is targeted. Since the oil transformer has some complex components such as core, tank and clamping structures, only three-dimensional (3D) model can accurately represent the topological arrangement and electromagnetic-thermal behavior of transformer components. High computational efforts and large convergence time are required for the thermal analysis of core, tank, flitch and clamp through fluid dynamics approach. For this reason, used thermal model for these area is based on the heat conduction equation with heat convection as boundary conditions [16]. In these area a couple electromagnetic-thermal calculation is considered with quasi-nonlinear electromagnetic modeling and static thermal 3D model. Convection cooling by air and oil is determined by empirical relationships for heat transfer coefficients instead of implementing a fluid dynamics analysis. In this paper, the effective relative permeability theory is proposed for quasi-nonlinear modeling of core and structural steel components. In this method, calculations are done with the material approximate response in case of time harmonic excitation in steady state [17, 18] so that of the heavy computation in nonlinear transient finite element model can be avoided.
Finally, according to the results obtained from transformer thermal analysis with rated voltages compared to unbalanced voltages, it is suggested that by reducing the transformer load, the transformer temperature under unbalanced conditions remains at the normal level.
2. Evaluation the Voltage Unbalance
In power systems, unbalanced voltages occur due to reasons such as asymmetrical transmission impedances caused by the un-transposed transmission lines, the single phase traction loads between two phase of the three phase lines, and railroad systems [7]. Unbalanced voltages can have destructive effects on components of the power system. The purpose of this study is to investigate the effect of unbalanced voltages on the thermal conditions of the transformer power.
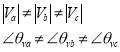
The slight deviation in amplitude or phase angle of three phase system at the fundamental system frequency produce unbalanced voltage in power systems. In systems with unbalanced voltages, the negative and zero sequences voltages appear on the power system. Unbalanced voltages can be expressed as follows:

where
We can decompose this unbalance three phase system into two components; completely balance and completely unbalance:
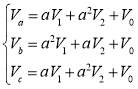
Where V1 is positive sequence voltage as balance component, V2 and V0 are negative and zero sequence voltages respectively as unbalance component and  . The IEC and IEEE have made definitions to determine the amount of unbalance in voltage or current of a three-phase system. The IEC defines the unbalance voltage factor of a three-phase system as follows:

The IEEE definition is as follows:
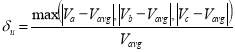
Where
Despite in many countries, the planning limits is don for  on the voltage levels MV and HV, but uu is beyond this limit in some cases. For example, [19] shows that the presence traction substation in the power system generates
  on the high voltage buses. In this paper, a power transformer is considered under unbalance condition so that there is the negative sequence component with
  in the supply voltages of the primary windings. The three phase voltages in the per-unit system are:
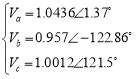
It can be seen that, the average of three phase voltage is 1pu, but the phases A and C are above the rated voltage and the phase B is below of the nominal voltage.
3. Electromagnetic Modeling
The important objective of this paper is to investigate the thermal effects and temperature rise in different areas of the power transformer under unbalanced voltage condition. The power losses are the heat sources in the transformer, which the electromagnetic analysis should be used to determine these losses. The power losses of different areas of the transformer consist of:
No load losses: No load losses consisting of magnetic and hysteresis losses in the laminations of core that is independent of load of transformer.
Load losses: load losses consisting of losses RI2 in eddy current losses winding and stray losses in constructive steel of transformer. The stray losses are generated due to the leakage flux and eddy current induced in the metal parts of the tanks walls and clamping structures includes clamps, frames and flitch plates.
First, local distribution of the volumetric heat sources within the core should be obtained by electromagnetic model, then the thermal analysis is don with the heat source obtained from electromagnetic analysis. In addition, this analysis required the coupling procedure between the electromagnetic, thermal and fluid flow solutions due to the temperature-dependence of material properties. Implementation of this coupling procedure is not possible with taking into account all parts of the transformer in the modeling.
The three-phase oil transformer has complex structural components such as core, winding disks, tank, flitch, clamp, etc. So, only 3D model can accurately represent the topological arrangement of transformer components and estimates the distribution of magnetic field and the power losses. The specifications of a 125 MVA power transformer have been summarized in Table 1. Figs. 1(a) and 1(b) show the shape of the transformer under repair and the 3D model implemented for it, respectively.
A. 3D Mesh
Due to the presence of conductive materials in power transformer, it is important to consider the skin effect phenomenon. The depth of the skin effect for conductive material with conductivity σ and relative permeability μ in low-frequency can be estimated from the following equation [20]:

The structural steel components of the power transformer specified in Table 1 are made of mild steel. Therefore, the value corresponding to a saturation condition for mild steel with μr=500 and σ=5×10⁶ mho/m, its skin depth is 1.2 mm at 50 Hz. In the case of copper with μr=1 and σ=4.74×10⁷ mho/m (at 75°C), the skin depth at 50 Hz is 10.3 mm.
Because the structural steel components are made of plates with the thickness greater than 12 mm, so boundary layers should be used for taking into account the skin effect. Fig. 2 shows the generation of the mesh in 3D configuration (1/4) model of the power transformer, in which the boundary layers with mesh sizes smaller than the skin depth are used for the metallic components. The region of skin depth is subdivided into 3 layers. As a result, the steel plate is subdivided into 12 layers. It should be noted that the disks of winding consist of strand conductors with dimension smaller than the depth of skin penetration, so the skin effect is negligible for them.
In the 3D model showed in Fig. 2, the elements are tetrahedral. The number of elements of the different areas in the mesh are: 238430 elements for clamping structures set includes clamps, frames and flitch plates; 287171 elements for tank; 105499 elements for core; 429011 elements for windings and; 1153935 elements for air. the total number of elements is 2214046.
B. Governing Equation
Maxwell equations are commonly used for electromagnetic analysis in finite element method. Theses equations are solved in COMSOL Multiphysics software by means of a magnetic vector potential approach. The electric field E, the magnetic field B, the magnetic field intensity H and the current density J in terms of the magnetic vector potential A can be expressed as follows:


The nonlinear magnetic behavior of the ferromagnetic material (core and structural steel) have a great influence on the above equations and the calculation of the losses in different areas of the transformer. In this paper, the effective relative permeability theory is proposed for quasi-nonlinear modeling of core and structural steel components. In this method, by applying the effective nonlinear magnetic curve Beff(H)=μreff×H in electromagnetic equations, calculations are done with the material approximate response in case of time harmonic excitation in steady state. By this way, the heavy computation of nonlinear transient finite element model can be avoided.
Using simple energy and average energy methods, μreff can be extracted from [17] the nonlinear B-H curve of materials. The μreff curves derived from the simple energy and average energy methods represent the time harmonic behavior with the first harmonic approximation of the B-H curve. Accordingly, the permeability can be calculated by the following equations:
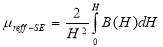
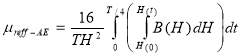
where H is the magnitude of the magnetic field intensity in time harmonic, B(H) is the material’s nonlinear B(H) relation, H(t) is the time-dependent oscillating magnetic field and T is the arbitrary period of the oscillation. The equations (5) and (6) are used to calculate μreff in terms of H and the curves B(H) measured for the M5 laminations of core and the mild steel material forming the structural regions of the transformer. Fig. 3 shows calculated μreff and the relative permeability μr from the measurements, which confirms the proper approximation of the proposed methods. In this paper, the simple energy method will be used due to a more accurate approximation.
C. losses calculation
(1) structural steel components losses
The stray losses inside the structural steel components include the eddy current loss and hysteresis loss, whereas hysteresis loss comprise between 25 and 30% of total stray loss [21]. Although many studies regardless of hysteresis loss, but to enhance the accuracy of calculation, it is essential that hysteresis loss is also taken into calculation.
Regarding the implementation of the relative effective permeability theory for modeling the magnetic behavior of in the steel plates and the use of boundary layers for meshing in these regions, one can easily calculate the current density vector in each element. Then, the eddy current loss is calculated in the whole volume as follows:
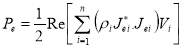
where n is the number of elements in the steel plate, ρiis the resistance diagonal tensor of material, Jei is the eddy current density vector, Jei∗ is the conjugate vector of the eddy current density and Vi is the volume of the element i.
Hysteresis loss can be assumed as the function of the maximum flux density Bm, which is obtained by measuring for the material. Hysteresis loss in the desired volume can be written as follows:
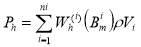
Where  is the dc hysteresis loss (W/kg) and
  is maximum flux density. By determining the peak density of flux in each element, the related hysteresis losses can be determined through interpolation according to the measured Wh-Bm curve (for mild steel) shown in Fig. 4.
(2) core losses
The generation of mesh for the laminations and their insulations is not possible for the transformer core, so the equation (13) cannot be used to calculate the eddy current loss of the core. Since the core is modeled seamlessly in a 3-D finite element, it is recommended that the loss curves in the unit of weight measured by the manufacturer be used to calculate the total losses of the core [22]. By implementing the relative effective permeability theory for the transformer core, the distribution of the flux density in each element of core is obtained, then the losses in unit weight are obtained through interpolation according to the BP curve shown in Fig. 5.
(3) winding losses
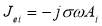
The heat sources in windings are the ohmic and eddy current losses. The windings are made up of many disks with a uniform ampere-turn distribution, so the RI2 loss is same for disks and easily is calculated but the eddy loss vary depending on the location of disks. The values of the axial and radial flux densities for each disk can be obtained from electromagnetic analysis, whereupon the axial and radial components of the eddy losses are calculated for each conductor using following equation [25]:
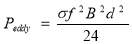
where B is the peak of leakage flux density in T, f is the frequency in s-1, and d is the conductor dimension perpendicular to the direction of the leakage flux density in m. The axial and radial flux densities are assumed to be same over the conductors of a single disk and equal to the average value of the disk. The total eddy loss for each disk is calculated by integrating the loss components of all its conductors.
D. Results
In this paper, the electromagnetic analysis is used to calculated the power losses in different areas of power transformer under unbalanced and rated voltages. The obtained results could be used in the thermal analysis of transformer. In order to investigate the effect of unbalanced voltages on transformer losses, Table 2 shows the power losses under rated voltages in comparison with unbalanced voltages. As can be seen, the power losses have increased in different areas of transformer with unbalanced voltages, and it is also clear that the losses of windings have the highest increase. The local distribution of power losses in later sections is used as the input of thermal modeling.
To verify the validity of the electromagnetic analysis, the calculated power losses with rated voltages were compared with the measured results in the short-circuit test and no-load test. It can be seen that the calculation error is less than %3.5, so the validity of the electromagnetic modeling is confirmed.
5. Thermal Analysis Core and Metal Parts
The thermal restrictions are considered in the design of the structural steel components and core of power transformer in normal operation. However, the thermal conditions in abnormal operation are less reported. In this section, the effect of unbalanced voltages on the thermal conditions of the structural steel components and core are investigated.
According to the theories of heat transfer, the heat generated in theses area of transformer is transferred by three different heat transfer mechanism, including conduction, convection and radiation. The steady-state temperature distribution based on heat transfer theory can be expressed as:
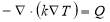
where k is the thermal conductivity, Q is the heat source (W/m3), T is the temperature.
The power losses in the core and the metal parts are the heatsources that are computed using the electromagnetic analysis described in the previous section. The isotropic material properties for the metal parts made from mild steel can be defined with value of thermal conductivity 40 W/mK. To avoid modeling laminations and insulations, the integrated core is modeled. so the anisotropic material properties are defined for core. It is assumed that the core has the homogenous material with the equivalent effective value for the thermal conductivity in each coordinate direction. The effective value of two parallel directions to laminates is considered as a connection of parallel resistors: kx=ky=48.9 W/mK, while the formula of a series connection of the resistors is used for the perpendicular direction to the laminates: kz=14.5 W/mK. Here, the dependence on temperature is not taken into for the electric and thermal material properties, because this dependence leads to a significant increase in computational cost, while temperature dependent will have little effect on calculations [26].
the boundary conditions can be used in order to model the natural convection of oil and air as [16]:
where hc is the is the convection heat coefficient, Teis the temperature of the oil or air that cools core and metal parts, and n is the normal direction. These boundary condition is considered on the surfaces of core and metal parts in contact with oil and air. The temperatures selected for air and oil are 30℃ and 70℃ respectively. hc is dependent on the heat flux along the steel-oil interface. Therefore, hc is considered as a nonlinear curve dependent on the heat flux for the oil, more details are given in [16]. Radiation on the outer surface of thetank is not modeled separately, but the combined heat transfer coefficient of convection and radiation effects used in equation (17) for hc along the tank-air interface [8].
Fig. 6 shows the temperature distribution on the structural steel components and core of power transformer with unbalanced and rated supply voltages. As can be seen, the higher temperature appeared on the different parts of transformer with the unbalanced supply voltages. In the unbalance condition, the phase A feeds the nominal load with 4.36% overvoltage that leads to the over flux in a limb of core and the increase of stray flux in coils, tank and clamp close to this limb. Figs. 6(b) and 6(c) show that the hot-spot temperature of tank and clamping structures increases with the unbalanced supply voltages and hot-spot location is shifted near the limb of phase A. Fig. 6(d) show that the hot-spot temperature changes of core is insignificant. This is because of the fact that in the unbalance condition, the average of three phase voltage is 1pu so the average value of flux density and the power losses in the whole core is constant approximately, this causes the hot-spot in joint of the middle limb and yoke of core is not change with low heat transfer rate. In addition, the average temperature of core, tank and clamping structures is almost same with unbalanced and rated supply voltages, as shown in Table 3.
6. Thermal Analysis on Winding
The transformer studied in this paper has the disc-type windings in a natural cooling mode (ON) where buoyancy is the only driving force. The temperature distributions and hot-spot temperature prediction is affected by heat generation and dissipation in the winding. Heat generation in the winding is the result of power losses within the coils and heat dissipation is mainly done through oil circulation in the cooling ducts. Therefore, in this paper in order to accurately model the temperature distribution inside the windings, fluid flow and heat transfer in transformer windings are coupled using Computational Fluid Dynamics (CFD). The steady-state governing equations (Naviere-Stokes) to solve model consists of the general expressions for conservation of mass, momentum, and energy:

where ρ is the temperature-dependent density of oil in kg/m3, µ is the temperature-dependent viscosity of oil in Pa.s, cp is the temperature-dependent specific heat capacity of oil in J/(kg.K), v is the flow velocity, p is the pressure in Pa, T is the temperature in K, k is the thermal conductivity in W/(m.K), F is the buoyancy force in N, and Q is the heat flux density in W/m3. These equations are performed using the COMSOL Multiphysics 5.3 software that is a common software platform based on FEM.
Since the oil viscosity is high and the flow velocities in the cooling channels are quite low (≤0.1 m/s), the flow is assumed laminar and no turbulence is not modeled. In this study the absolute pressure is not important for the current case, therefore the static pressure was considered and the outlet pressure set equal to zero. The inlet oil temperature is also specified according to the measured value.
The dependence of the transformer oil characteristics on temperature is taken into account by the following relationships:

- Computational Domain and Mesh Discretization
In this paper, the thermal and fluid flow analysis are investigated for the LV winding of phase A, which has the highest losses in unbalanced voltages. Since the windings are cylindrical in shape, the analysis can be performed in 2D axisymmetric mode where the rotational periodic conditions are defined in the angular direction. In 2D approximation, the sticks and spacers is not taken into account, which lead to larger exposed area of the discs to the oil compared to the real situation, therefore lower oil velocities for the same oil mass flow rate. In fact, these components reduce the exposed area of the discs to the oil, where the heat transfer occurs. To solve this problem one can apply an area correction coefficient or a convection heat transfer coefficient to the model, as indicated in [15].
The winding is made of six passes that each pass is comprised of 15 channels and 14 discs. Washers at the top and at the bottom of the pass dictate the fluid on a zig-zag path in the winding. The 2D geometry of three passes of winding and detail of the mesh illustrated in Fig. 7. The meshing can cause the results to be completely exposed, so must be careful about it. Since the winding is made up of rectangular components, so the rectangular element selection may look better for meshing, but not the most appropriate choice because it greatly increases the number of meshes in the branching areas and cannot accurately represent the border areas of the arbitrary geometrical shapes. Thus the triangular element is preferred for the 2D geometry of winding passes. In the fluid domain, the element size in the area of the side-walls must be small in order to well capture the temperature and velocity gradients, therefore 5 layers of thin rectangles for the flow boundary layers are employed for the fluid domain close to the wall of vertical channels and disks. The elements size refined at the inlet and at the outlet of each horizontal channel since in these areas there are strong radial gradients. Overall, the fluid domain and solid domain containing discs and washers have 1,144,961 and 846,500 elements respectively.
To avoid modeling the wire and wire insulation of coils, it was assumed that each disk behave like a homogenous material and has one equivalent value for the thermal conductivity in
each coordinate direction, as it was applied. In this way, the thermal conductivity for the directions r and z of each coil in the 2D cylindrical coordinates is computed from the following equation:

where Liis the total length of the wires and insulations in the ith direction, kj is the thermal conductivity of the jth material in the disk and Lj is the length of the jth material in the ith direction.
B. Boundary Conditions
To solve the equations, boundary conditions must be determined for two fluid domain and solid domain. The boundary condition is set for the inlet and outlet of the fluid domain. At the inlet, the fluid velocity and temperature are 0.01 m/s in the z-directions and 45°C respectively. At the outlet, the pressure of oil is set equal to 0 Pa. Since the outer wall and the oil washers have a very low thermal conductivity, these walls are considered insulation.
For the solid domain, the uniform volumetric heat source calculated from the electromagnetic analyze is set in each disc. The ohmic and eddy losses are the heat sources in the discs, which these losses are derived from the electromagnetic analysis described in Section III. Fig. 8. Show the calculated ohmic and eddy losses for the discs of the LV winding of phase A with the unbalanced and rated supply voltages.
C. Results
Fig. 9 shows the temperature distribution on the LV winding of phase A with the unbalanced and rated supply voltages. As can be seen, the disks temperature is higher with the unbalanced supply voltages than balanced operation of transformer. In the unbalance condition, the hot-spot temperature of winding increases with the unbalanced supply voltages, but the hot-spot location does not change. In addition, Table 4 shows the average temperature of winding also increases with the unbalanced supply voltages. It is evident that the winding temperature rise has the highest increase among all areas of the transformer, so that the increase of hot-spot temperature of winding is more than 4 ℃. Therefore, permanent unbalanced supply voltages for transformer can increases the aging rate of the conductors paper insulation.
7. Determination of Loading Transformers with Unbalance Voltages
It was observed that with the unbalanced supply voltages, the highest temperature rise of transformer (almost %4.3) occurred in the hot-spot values of winding than the normal operating. In general, the hot-spot temperature depends on the ambient temperature and load of transformer. In this paper, it is suggested that by reducing the transformer load, the transformer temperature under unbalanced conditions is remain at the normal operation. It is assumed that the ambient temperature does not change. By reducing the transformer load, we find that by loading 96% of the transformer under unbalanced conditions (with  ), the different areas of transformer remain at the normal operation. Fig. 10. shows the temperatures distribution on the different areas of transformers with the unbalanced supply voltages and loading %96.
8. Conclusion
In this paper, the thermal, fluid flow and electromagnetic numerical models have been performed to consider the effect of unbalanced voltages on the temperature distributions all components of a power transformer. To study unbalance condition, a power transformer was considered with the negative sequence component uu=5% in the supply voltages of the primary windings. In this paper to accurately determine the power losses as the heat sources in the transformer (in case of time harmonic excitation), the effective relative permeability theory is proposed for quasi-nonlinear modeling of core and structural steel components in the electromagnetic analysis. To verify the developed method, the calculated power losses with rated voltages were compared with the measured results in the short-circuit test and no-load test. Result has shown that the calculation error is less than %3.5, so the validity of the electromagnetic modeling was confirmed.
According to the calculation results, the winding temperature rise has the highest increase among all areas of the transformer, so that with uu=5% in the supply voltages, the increase of hot-spot temperature of winding is more than 4 ℃. By reducing the transformer load, we find that by loading 96% of the transformer under unbalanced conditions (with uu=5%), the different areas temperature of transformer remain at the normal operation.
References
[1] Torriano, F., M. Chaaban, and P. Picher, J. Applied Thermal Engineering, 14, 2034 (2010).
[2] Pradhan, M. and T. Ramu, J. IEEE transactions on power delivery 4, 1704 (2004).
[3] Bergeron, R., et al., Voltage Unbalance on Distribution Systems: Phase I, Canadian Electrical Association (1989).
[4] Guerrero, J.M., et al., J. IEEE Transactions on Industrial Electronics 4, 1254 (2013).
[5] Jayatunga, U., S. Perera, and P. Ciufo, J. IEEE Transactions on Power Delivery 3, 1653 (2012).
[6] Von Jouanne, A. and B.B. Banerjee, Electric Power Research Institute, Palo Alto, CA, EPRI Final Rep, (2000).
[7] Von Jouanne, A. and B. Banerjee, J. IEEE transactions on power delivery 4, 782 (2001).
[8] Rosillo, M.E., C.A. Herrera, and G. Jaramillo, J. IEEE Transactions on Power Delivery 4, 1710 (2012).
[9] Wu, W., et al., J. IET electric power applications 1, 19 (2012).
[10] A. Oliver, J. IEE Proceedings C (Generation, Transmission and Distribution) 6, 395 (1980).
[11] Campelo, H., L. Braña, and X. Lopez-Fernandez, Electrical Machines (ICEM), 2014 International Conference (2014) pp. 2275~2281
[12] Das, A.K. and S. Chatterjee, J. IET Electric Power Applications 4, 664 (2017).
[13] Smolka, J., J. Applied Thermal Engineering 1, 124(2013).
[14] Zhang, X., Z. Wang, and Q. Liu, J. IEEE Transactions on Power Delivery 4, 1655 (2017).
[15] Torriano, F., P. Picher, and M. Chaaban, J. Applied Thermal Engineering 4, 121 (2012).
[16] Sitar, R., Ž. Janić, and Ž. Štih, J. Applied Thermal Engineering 2, 516 (2015).
[17] Paoli, G., O. Biro, and G. Buchgraber, J. IEEE Transactions on Magnetics 5, 2625(1998).
[18] Susnjic, L., Z. Haznadar, and Z. Valkovic, J. Electric Power Systems Research 10, 1814 (2008).
[19] Burchi, G., et al., J. Electrical Power Quality and Utilisation. Journal 2, 113 (2005).
[20] Kulkarni, S.V. and S. Khaparde, Book, CRC Press (2012).
[21] Olivares, J., et al., J. Electric Power Systems Research 2, 179 (2004).
[22] Liu, X., Y. Yang, and F. Yang, J. Applied Thermal Engineering 1, 49 (2017).
[23] Cheng, Z., N. Takahashi, and B. Forghani, TEAM problem 21 family (2009).
[24] Steel, A., Grain oriented electrical steels–M-2 M-3 M-3X LITE CARLITE GOES–M-2 M-3 M-4 M-5 M-6 MILL-ANNEAL GOES. Product Data Bulletin,[Online]. Available: http://www.
[25] Picher, P., et al. CIGRE conference, Paris, A2-305. 2010.
[26] Cranganu-Cretu, B., A. Kertesz, and J. Smajic. Electrical Machines ICEM,18th International Conference (2008). pp. 1~6.
Fig. 1. (a) The view of power transformer under repair (b) 3D view.
Fig. 2. Mesh 3D generated within the power transformer geometry.
Fig. 3. Variation μreff and μr with field intensity in (a) mild steel material (b) M5 core steel.
Fig. 4. The measured Wh-Bm curve of mild steel [23].
Fig. 5. The measured BP curve of the M5 silicon steel [24].
Fig. 6. Comparison of the temperatures distribution on the transformers with the unbalanced and rated supply voltages.
Fig. 7. 2D axisymmetric geometry (three pass of the LV winding) and Meshing of computational domain.
Fig. 8. The calculated ohmic and eddy losses for the discs of the LV winding phase A with (a) the balanced supply voltages (b) the unbalanced supply voltages.
Fig. 9. Comparison of the temperatures distribution on the LV winding of phase A with (a) unbalanced voltages and (b) rated supply voltages.
Fig. 10. the temperatures distribution on the transformers with the unbalanced supply voltages and loading %96.
Cite This Work
To export a reference to this article please select a referencing stye below:
Related Services
View all


Related Content
All TagsContent relating to: "Electronics"
Electronics regards the science and technology involved in the development of electrical circuits and electronic devices and equipment that use them.
Related Articles

DMCA / Removal Request
If you are the original writer of this dissertation and no longer wish to have your work published on the UKDiss.com website then please: