The Economic Impacts of Cougars in Western Washington
Info: 12172 words (49 pages) Dissertation
Published: 11th Dec 2019
ABSTRACT
THE ECONOMIC IMPACTS OF COUGARS IN WESTERN WASHINGTON
The combination of increasing cougar populations, and the rising human population in Wildland-Urban Interface (WUI) areas suggests that the number of human-cougar encounters will rise as well. The increase in human-cougar encounters creates potential issues in regards to public safety, public policy, and management of predators. For the purposes of this research, I will employ a housing data set of fourteen counties in Western Washington in order to quantify the impacts of a confirmed cougar sighting on the sale value of a home. Specifically, I will be employing the use of a hedonic real estate price model. I expect to find that the presence of a cougar will negatively affect the sale value of a home. These results would suggest the need for changes in policy in regards to management of cougars, as well as land use management.
TABLE OF CONTENTS
Chapter Page
1 INTRODUCTION………………………………………….1
2 LITERATURE REVIEW………………………………………7
First-Order Subheading……………………………….7
First-Order Subheading………………………………15
First-Order Subheading………………………………28
3 DATA, ANALYSIS, AND THE USE OF GEOGRAPHIC INFORMATION SYSTEMS.30
3.1 Background ……………………………………30
3.2 Study Area…………………………………….46
First-Order Subheading………………………………55
IV RESULTS……………………………………………60
First-Order Subheading………………………………60
First-Order Subheading………………………………67
First-Order Subheading………………………………75
V DISCUSSION…………………………………………78
First-Order Subheading………………………………78
First-Order Subheading………………………………81
First-Order Subheading………………………………85
REFERENCES…………………………………………91
APPENDIXES………………………………………..100
Appendix A—Title………………………………….100
Appendix B—Title………………………………….101
TABLE OF CONTENTS
- INTRODUCTION
- COUGAR ECOLOGY AND HUMAN INTERACTIONS
2.1 COUGAR ECOLOGY, INTERACTION WITH PREY, AND SPATIAL USE
2.2 HUMAN-COUGAR INTERACTIONS AND POPULATION DYNAMICS
2.3 EFFECTS OF HUNTING OF COUGAR POPULATIONS
2.4 LEGISLATIVE HISTORY OF COUGAR MANAGEMENT STRATEGIES
2.5 WILDLAND URBAN INTERFACE
3. ECONOMIC VALUATION OF WILDLIFE – A LITERATURE REVIEW
3.1 WILDLIFE VALUATION
3.2 HEDONIC VALUATION
PROPERTY VALUE MODELS
THEORY OF HEDONIC WELFARE MEASUREMENT LOCALIZED EXTERNALITIES
CHARACTERISTICS THAT AFFECT HOUSING PRICES
- DATA, ANALYSIS AND THE USE OF GEOGRAPHIC INFORMATION SYSTEMS
3.1 BACKGROUND
3.2 STUDY AREA, SOURCES, AND DATA VALIDITY
3.2.1 COUGAR INCIDENT REPORTS
3.2.2 HOUSING DATA
3.3 DATABASE MANAGEMENT
3.3.1 CONCATENATING DATA
3.3.2 SPLITTING DATA
3.3.3 BUFFERS AND INTERSECTIONS
3.3.4 TIME VARIABLES
4.4 FINAL DATASET
- METHODS
- RESULTS
- JOURNAL ARTICLE 4000-6000 WORDS
4.1 INTRODUCTION
4.2 STUDY AREA AND DATA
4.3 METHODS
4.4 RESULTS
4.5 DISCUSSION AND CONCLUSSION
- POLICY IMPLICATIONS AND FURTHER WORK
- REFERENCES
- APPENDIXES
Chapter 1
Introduction
The population of the predator cougar (i.e., puma concolor)have reportedly increased over the past thirty years (Washington Department of Fish and Wildlife 2010). Furthermore, the human population in Washington State has increased as well. The population of counties of western Washington in which rural land is being developed is growing at a greater rate than the state average (State of Washington 2015). The combination of increasing cougar populations and the rising human population in Wildland-Urban Interface (WUI) areas suggests that the number of human-cougar encounters will increase as well. A human-cougar encounter may result in a range of possible outcomes. These outcomes span from a confirmed sighting of a cougar to an attack on livestock, pets, or even humans. The amount of human-cougar encounters in Washington have been increasing, (Beier 1991, Fitzhugh et al. 2003) as have the number of cougars taken in hunts (Dawn et al. 2003). The increase in human-cougar encounters creates potential issues in regards to public safety, public policy, and management of predators.
The presence of cougars in increasingly residential WUI areas create potential issues for the safety of cougars and humans alike. According to a survey conducted by the Washington Department of Fish and Wildlife (WDFW), 75% of Washington residents claim to have little knowledge about cougar behavior or ecology (WDFW 2010). This lack of knowledge creates a potential risk for the safety of individuals, animals, and larger communities. Furthermore, the presence of cougars may have a significant impact on the real estate market in residential areas within the WUI, based on public perceptions regarding cougars.
The main purpose of this research is to measure the impacts of large predators on housing prices in western Washington. Specifically, I will assess the confirmed presence of cougars on home sale prices in fourteen rural western Washington counties. Based on this information, I will attempt to discover the relationship between a confirmed sighting of a cougar in the general vicinity of a house and the house’s value. Based on the results, I will make recommendations for changes in policy in regards to management of cougars, as well as land use management.
This research will provide a quantitative assessment of the effect of a confirmed cougar sighting on the sale price of a home. Upon further analysis of the results, the fourteen counties in my study area may use this research to shape policy in regards to the management of predators, their populations, and harvesting techniques. In addition, if cougars have a significant negative impact of the sale price of a home, this could cause a decrease in the amount of tax revenue generated from these homes. Furthermore, the results could help shape policy in regards to land management, ensuring that future homes created in WUI areas are safe for both humans and cougars alike. The results of this research may also be used at a statewide level, through agencies such as the Washington Department of Fish and Wildlife. On a national level, this research will add to the body of knowledge surrounding management of predators, land management, as well as impacts on housing values.
Chapter 2
Literature Review
This research, which is focused on estimating the economic effects of cougars in western Washington, is inspired by a variety of research, studies, and methodologies. The purpose of this chapter is to review the relevant literature. In the following sections, I synthesize literature regarding cougar ecology, interactions between cougars and humans, the history of cougar management, the wildland urban interface, as well as studies which estimate the economic value of wildlife. Additionally, I highlight gaps in the prominent literature in which this paper can offer insight.
2.1 Cougar Ecology, Spatial Use, and Interaction with Prey
Even though there is a large body of research regarding cougars, there is much to be discovered regarding cougar behavior in comparison to other game animals. The cougar is a solitary animal (Sunquist and Sunquist 2002), meaning that they do not collaborate with other animals in order to feed, mate, or protect their young against predators (Sandell 1989). Cougar are populated at low densities over large areas (Logan and Sweanor 2001), which makes observational research difficult. Furthermore, cougars are nocturnal creatures, which adds to the difficulty of observation (Bier et al. 1995).
The cougar is the largest of the wildcats that inhabit the Pacific Northwest. Cougars range in size from 5 to 9 to feet in length, and can weigh 80 to 210 pounds (Maser 1998). The cougar is a highly adaptable animal, which reside in a variety of habitats ranging from desert climates, to mountainous regions as well as tropical climates. Furthermore, the cougar can inhabit a variety of population densities, ranging from secluded forests to the outskirts of suburban areas. Cougar habitats are spread across the state of Washington as well (Figure 1).
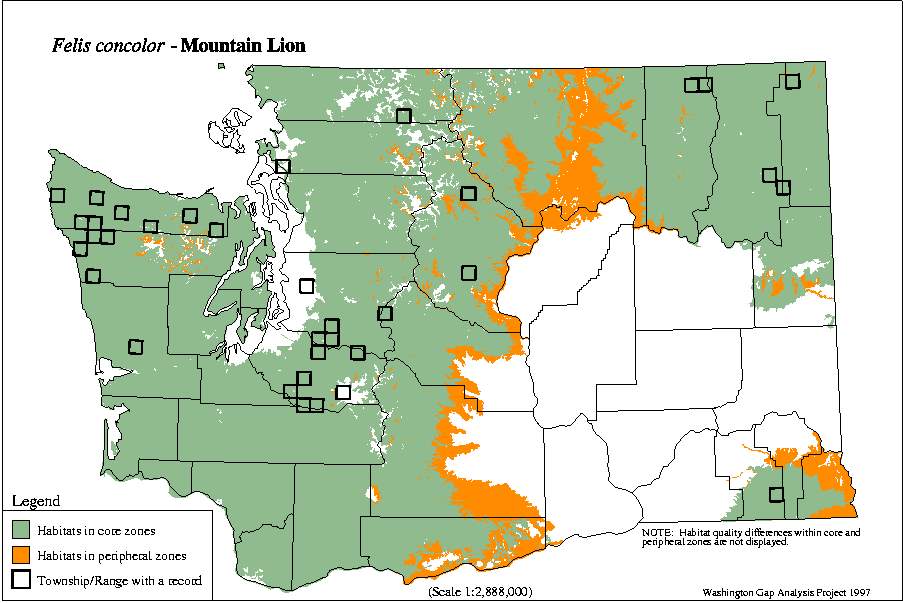
Figure 1. Cougar Habitat in Washington State (Washington Gap Analysis Project 1997).
Adult cougars have a tendency to establish a residency in a certain area, which will be occupied for a consecutive number of years. The area of this territory has a range of 90 to 475 square miles, and an average of 175 square miles (Shivaraju 2003). Given the vast range of a cougar’s territory, it can be said that they are continuous hunters. The cougar is not likely to hunt in the same location each day; it will move from one spot to the next, until it finds an area that is successful. Once this area is found, the cougar will likely hunt in nearby areas. Once the cougar has experienced repeated success in a certain area, it is likely to create its home in that general area (Maser 1998).
Maletzke et al. (2014) observed that the effects of increasing mortality rates on the spatial ecology of large predators in often misunderstood. In order to gain understanding, Maletzke et al. researched the spatial ecology of two cougar populations with different levels of hunting to test whether an increased mortality rate would affect the size of a cougar’s home range, or interactions with other cougars. The stability hypothesis states that home range and overlap will be identical for male and female cougars in the two study areas. The instability hypothesis states that home range and overlap will be greater in populations with higher mortality rates, and the rates between males and females will be different as well. Maletzke et al. tested these hypotheses by comparing home range size and overlap between the two populations. They found that male cougars in areas that were heavily hunted had larger home ranges and more overlap than males occupying lightly hunted areas. Female cougars showed no difference in size or overlap between the two populations. Therefore, Maletzke et al. rejected the stability hypotheses, while accepting the instability hypotheses. Their findings suggest that increased hunting of male cougars will increase home range size and overlap, which can result in negative impacts on cougars and residents alike.
It is generally assumed that male and female predators interact with prey in the same manner. However, differences in size and behavior suggest that male and female predators may prey upon different species. This discovery could provide crucial information in regards to wildlife management and conservation. White et al. (2011) recognized this issue and tested for the differences in prey selection by male and female cougars in Washington State from 2003 to 2008. White et al. tracked cougars using Global Positioning System (GPS) collars and studied 436 sites. White et al. discovered that solitary females and females with offspring killed a higher number of mule deer than elk, while males preyed upon more elk than mule deer. Furthermore, male cougars killed 4 times more elk than females, and females killed 2 times more mule deer than males. Based on this information, White et al. suggest that wildlife managers should consider how the sex of a predator could influence the population of prey when developing management and conservation strategies.
2.2 Human-Cougar Interactions, Hunting, and Population Dynamics
Increasing cougar populations, accompanied by increasing human populations suggest that the number of human-cougar encounters is likely to increase. A human-cougar encounter may result in a range of possible outcomes. These outcomes span from a confirmed sighting of a cougar to an attack on livestock, pets, or even humans. The number of human-cougar encounters in Washington is growing (Beier 1991, Fitzhugh et al. 2003) as are the number of cougars taken in hunts (Dawn et al. 2003). In order to assess the risks of a human-cougar encounter, there has been research done to analyze the nature of these encounters.
Lambert et al. (2001) recognized the issue of increasing numbers of human-cougar conflicts in the Pacific Northwest. There are many hypotheses that explain the number of conflicts, the most prevalent being an increase in the population of cougars. In order to test this hypothesis, Lambert et al. used trapping and tracking methods to measure the relative density, fertility, survival, and growth rate of cougar populations in northeastern Washington, northern Idaho, and southern British Columbia. According to Lambert et al. the increase in human-cougar conflicts could be due to a young population of cougars due to excessive hunting. Lambert et al. also suggest that more humans are interfering with cougar habitats, which leads to cougars becoming acclimated to the presence of humans. Finally, Lambert et al. conclude that negative social perceptions about cougars could promote excessive hunting. In order to preserve the cougar population, Lambert et al. recommend stricter hunting regulations, monitoring of cougars, and collaboration with resource managers to effectively manage the problem.
Kertson et al. (2013) assert that effective management of predator populations in WUI areas require knowledge regarding the ecology of these predators, and the characteristics of their interactions with humans. In their research, Kerston et al. quantified the residential movements of cougars as well as their interactions with humans in western Washington from 2003 to 2008. The purpose of this study was to identify the ecology and potential dangers of large predators occupying a WUI area. They found that the adaptable and nomadic tendencies of cougars explain the use of residential areas. Kerston et al. recommend that managers create strategies that focus on problematic cougars, while preserving an older age structure of cougar populations. Furthermore, they suggest the use of landscape planning and education in WUI areas in order to reduce the number of human-cougar interactions.
Between 1890 and 1990, there were 63 confirmed attacks on humans by a cougar, which resulted in 10 deaths. (Beier 1991; Fitzhugh et al. 2003). Between 1991 and 2005, there were another 54 attacks that resulted in nine deaths (Fitzhugh et al 2003; Lewis 2006). Attacks on humans are rare, with 19 reported deaths in the last 116 years. The increase in the number of attacks on humans has become an important issue for agencies in charge of cougar management (Cougar Management Guidelines Working Group 2005). Attacks on humans are widely document and publicized, which has contributed to the increase in public concern about cougars in regards to human safety (Deurbrouchk and Miller 2001; Etling 2001: Baron 2004). This creates problems for wildlife managers who serve a dual mandate of protecting the public as well as preserving sustainable cougar populations. Not all opinions about cougars are negative; cougars are widely valued for aesthetic, ecological, and recreational reasons (Cougar Management Guidelines Working Group 2005). Wildlife managers. Therefore, in order to reduce the risk of encounters between cougars and humans, a better understanding of what can lead to an attack is necessary.
Studies from Washington State (Martorello and Beausoleil 2003) propose that opportunistic hunting of cougars reduces the role of selectivity in the hunting process. In fact, this has created problem for female cougars, as the ban on hunting with hounds led to an increase in female harvest rates of 49 percent to 59 percent. Data from the western United States regarding harvest rates (Becker et al. 2003, Beausoleil and Martorello 2005) show that hunting with hounds results in greater rates of harvest in males than females. This could be caused by the fact that hunters who use hounds are able to identify the gender of the target by comparing the size of tracks. Furthermore, male cougars on average travel more than twice the average distance of females, which would increase the chance of encountering a male while hunting (Anderson 2003).Cooley et al. (2009) performed research to test the compensatory mortality hypothesis in regards to large mammals, which states that harvest mortality affects reproduction rates, offspring mortality rates, and female population growth rates by reducing competition for available resources (Connell 1978). According to this hypothesis, areas that are lightly hunted experience increased competition for resources due to higher cougar population densities. This leads to lower reproduction rates, lower survival rates for offspring, and lower population growth for females. Cooley et al. tested this hypothesis on two populations of cougars in Washington State, one heavily hunted, and one lightly hunted. They estimated the population growth rate, population density, as well as survival and fertility rates to study the effects of hunting on cougar populations. Their study found that there was no difference in maternity or mortality rates between study areas. Furthermore, they found that survival rates for kittens was lower in the heavily hunted population. Cooley et al. also concluded that areas that are heavily hunted experienced increased migration patterns, lower survival rates for kittens, lower populations of females, and a younger age structure. Therefore, Cooley et al. conclude that the compensatory mortality hypothesis should be rejected when regulating and predicting harvest levels for cougars.
Parker et al. (2009) recognize the dangers of predator control through the use of sport hunting. Parker et al. researched whether predator species that practice infanticide are susceptible to overhunting by studying four species: lions, cougars, leopards, and back bears. The black bear was used as a control because they do not practice infanticide. They found that negative trends for the harvest of lions and cougars were associated with declining populations. Parker et al. explain that trophy hunting has contributed to the declining population of both lions and cougars. They found that areas which have the highest harvest rates experience the greatest decline in populations. Trophy hunting has been characterized as a strategy to promote conservation of predators. But in reality, communities tend to view predators as a problem animal and seek their removal. This negative view of predators is evident through legislation passed by the states of Oregon and Washington. In 2006, Oregon state created plans to reduce the population of cougars by 40%, citing attacks on livestock and pets. Washington state increased the quota of cougars to be harvested to counteract the increase in human-cougar conflicts. Parker et al. claim that this pattern of legislation is contributing to the declining population of predators. In order to preserve the species, they suggest developing new hunting regulations, and monitoring of populations in order to discover a sustainable harvest rate.
2.3 History of Cougar Management and Conservation
Before the year 1960, cougars and other carnivores were managed through the process of extermination (Gittleman et al., 2001). Cougars were depicted as dangerous predators who prey upon livestock, game animals, and threaten human safety (Hansen, 1992; Deurbrouck and Miller, 2001). Hunters were incentivized through the use of bounties from the late 1800s which remained in effect until the 1960s (Young and Goldman 1946; Nowak 1976). The cultural adaptation of environmentalism and changing public perceptions towards predators during the 1960s multiple western states classified the cougar as a game animal, which offered more protections to the species (Hansen, 1992). Recently, cougars have been considered an important indicator species which emulates the ecological well-being of certain regions (Kellert & Smith, 2000). This new protective ideology has created controversy regarding the hunting of cougars. It is widely held that current policies regarding cougar management fail to protect cougars from over-hunting, which is evident by the reported increase in cougar harvest rates. Western states have taken action in order to protect the cougar from over-hunting. For example, California has successfully banned the hunting of cougars (Torres et al., 1996). Meanwhile, Washington banned the use of hunting dogs though voter Initiative 655 in order to reduce the effectiveness of hunters (Washington Department of Fish and Wildlife, 1999).
While there was growing concern about the survival of the cougar species, there was also concern about cougar-human interactions and human safety. After Initiative 655 passed, reported human/cougar conflicts increased from 247 in 1995 to 495 in 1996, to 927 in 1998 (Washington Department of Fish and Wildlife 1999). As a result, Engrossed Substitute Senate Bill (ESSB) 5001 passed in 2001, which allowed hunting with hounds for the use of removing problematic cougars. In 2001 the Washington game status report (Martorello 2001) claimed that the population of cougars were increasing, therefore officials decreased the severity of hunting regulations. In 2002, legislators in Okanogan, Ferry, and Stevens counties persuaded the WDFW to increase the allocation of hunting permits in those counties, citing the increased number of complaints involving cougars. Opponents of I-655 believed that cougar populations would grow to uncontrollable levels, as well that cougars would become more acclimated to humans (Stiffler 1999). The WDFW accepted their request despite the research that indicated that the complaints in these three counties were exaggerated and fabricated by local media sources. Furthermore, the cougar population in this region was declining due to the increased number of “problematic” cougars taken.
2.4 Wildland-Urban Interface
The wildland-urban interface (WUI) is defined as the space in which housing units intersect with wildland areas which are undeveloped or unaltered by humans. According to the USDA (2001), the WUI areas consist of interface and intermix areas. Interface areas border wildland areas, and there is a clear distinction between wildland and developing areas. Intermix areas often contain housing units which are surrounded by wildland and other vegetation. The development and urbanization of wildland areas creates conflicts and problems with the environment (Johnson 2001). Housing development in these areas are shown to cause the loss of wildlife habitat as well as fragmentation (Theobald et al. 1997). Furthermore, development can disrupt population dynamics of wildlife (Soule 1991), as well as decrease biodiversity in an ecosystem (McKinney 2002).
Over the past 25 years, the WUI of western Washington has increased in terms of area, as well as the number of housing units. According to Hammer et al. (2007), from 1990 to 2000, the area of WUI land in Washington State increased 16.4% (Figure 2). Furthermore, the number of housing units in the WUI increased 29.6% in the same time period (Figure 3). According to Tully (2013), from 2000 to 2010, the area of WUI land in Washington State increased 8.23%. Furthermore, the number of housing units in the WUI increased 22.51% during the same time period. These figures illustrate the rapid expansion of the amount of acreage in WUI areas, as well as the number of households.
| Location | 1990 | 2000 | Growth | |
| n | % | |||
| California | ||||
| Interface | 7226 | 7328 | 63 | 0.9 |
| Intermix | 18998 | 21219 | 2221 | 11.7 |
| Total WUI | 26263 | 28647 | 2284 | 8.7 |
| Oregon | ||||
| Interface | 2523 | 2617 | 94 | 3.7 |
| Intermix | 5775 | 6464 | 688 | 11.9 |
| Total WUI | 8299 | 9081 | 782 | 9.4 |
| Washington | ||||
| Interface | 3197 | 3371 | 174 | 5.4 |
| Intermix | 9951 | 11929 | 1978 | 19.9 |
| Total WUI | 13148 | 15300 | 2151 | 16.4 |
| Pacific West Region | ||||
| Interface | 12986 | 13317 | 331 | 2.5 |
| Intermix | 34742 | 39611 | 4887 | 14.1 |
| Total WUI | 47710 | 52928 | 5218 | 10.9 |
Figure 2. Wildland–urban interface (WUI) area (km2), 1990 and 2000 (Hammer et al.)
| Location | 1990 | 2000 | Growth | |
| n | % | |||
| California | 111182851 | 12214549 | 1031698 | 9.2 |
| Interface | 3163846 | 3480126 | 316280 | 10 |
| Intermix | 1305616 | 1633685 | 328069 | 25.1 |
| Total WUI | 4469462 | 5113811 | 644349 | 14.4 |
| Oregon | 1193567 | 1452709 | 259142 | 21.7 |
| Interface | 315024 | 370745 | 55720 | 17.7 |
| Intermix | 1305616 | 1633685 | 328069 | 25.1 |
| Total WUI | 4469462 | 5113811 | 644349 | 14.4 |
| Washington | 2032374 | 2541075 | 418701 | 20.6 |
| Interface | 504190 | 587484 | 83293 | 16.5 |
| Intermix | 425356 | 617439 | 192083 | 45.2 |
| Total WUI | 929547 | 1204923 | 275376 | 29.6 |
Figure 3. Wildland-urban Interface (WUI) housing units, 1990 and 2000 (Hammer et al.)
In previous decades there has been substantial growth in housing within the United States (Hammer et al. 2004; Radeloff et al. 2005). The number of housing units in the US increased by 13.6 million during the 1990s. This surge in housing development suggests there could be an increase in WUI areas as well as housing units. Furthermore, the population of the US has experienced deconcentration (Long and Nucci 1998). Residential and commercial development is prominent on the outskirts of metropolitan areas as well as in rural areas, which contain aesthetic and recreational amenities. This trend is especially evident in the western United States, heavily wooded areas, as well as space surrounding federally owned land. The development of suburban areas, known as suburban sprawl (Benfield et al. 1999; Daniels 1999) along with recreational development, known as rural sprawl (Radeloff et al. 2001, 2005a) resulted in an increase of housing in WUI areas.
With this rapid expansion of WUI area and population, it could be suggested that land use within the study area would be altered as well. In 2004, the UDSA Forest Service contracted the University of Washington’s Rural Technology Initiative (RTI) to research the issue of land use in western Washington. In order to do so, the RTI calculated the amount of acres that were classified as forests in 1988, and compared those results to the development of the same lands in 2004 (Figure 4). The results of RTI’s research showed a significant change in land use from the years of 1988 to 2004. In western Washington counties, 7,070,000 acres remained forested from the years of 1988. 796,000 acres were changed to agricultural or mixed rural land during the same time period. 401,000 acres were changed to developed land, 62,000 acres were changed to water (University of Washington 2004). As a result, 2,826,000 acres of land have been altered in its use from the years of 1988 to 2004. These figures illustrate the severity of the transformation that western Washington has experienced in its recent history. Over the past 25 years, western Washington has experienced rapid population growth, a dramatic increase in the number of housing units, an increase in the amount of acreage in WUI areas, as well as transforming landscape in terms of land usage.
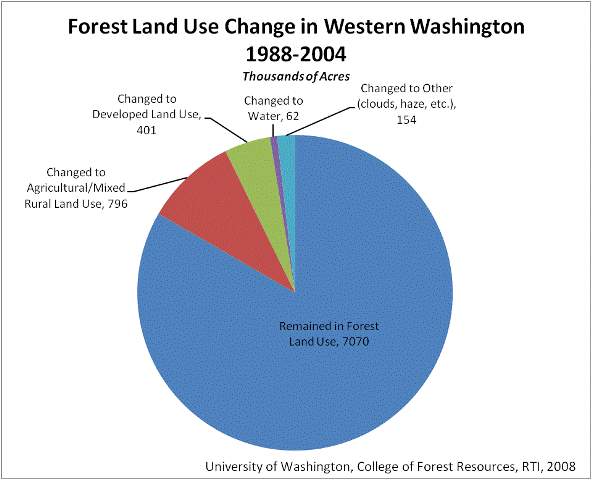
Figure 4. Forest Land Use in Western Washington (Rural Technology Institute)
Kertson et al. (2001) recognize the impacts of human involvement in the wildland-urban interface due to increased residential development. Impacts may fluctuate between species, but Kertson et al. argue that residential development creates challenges for large carnivores such as the cougar. In order to mitigate adverse effects, it is necessary to understand the spatial ecology and habitats of cougars in order to decrease the number of human-cougar interactions which include sightings, encounters, and attacks on livestock and pets, as well as people (Kertson et al., 2001). In order to further the understanding of spatial patterns and their relation to ecological events (i.e., spatial ecology), Kerston et al. studied and tracked 27 cougars in the wildland-urban interface in western Washington. The GPS tracking data was then used to model the use of space, as well as the significance of landscape features in human-cougar interactions. Their model found that cougars stayed in areas that were attractive to prey, left prey vulnerable, and had limited residential development. They also found that the use of space was similar between wilderness and residential areas because many residential areas contain landscape features which are attractive to cougars. Kerston et al. believe there is a point of equilibrium where residential development maintains enough wildland characteristics that are attractive to cougars and increases the chance of human-cougar interactions. Kerston et al. suggest that in order to reduce interactions, it is necessary to use knowledge of spatial ecology.
2.4 Economic Valuation of Wildlife: A Literature Review
Throughout America’s history of industrialization, economic growth and development was encouraged while the negative consequences on the environment were ignored. Recently scientists, environmentalists, and policy makers recognized the potential dangers that rapid expansion could cause. In 1973, the Endangered Species Act was passed in order to prevent further decline in populations of threatened species within the United States. After this act, wildlife managers began to focus on the conservation of threatened species, as well as their habitat. Generally speaking, measuring the costs of conservation is a simple task. However, in order to establish the effectiveness of such programs, it is necessary to analyze the costs of conservations in comparison with its benefits. In recent times policy makers, wildlife managers, and conservationists are realizing that estimating economic benefits of conservation is crucial amidst the debate regarding the effectiveness of these programs.
The seminal work of Hammack and Brown (1974) has led to an increase of studies regarding the economic value of wildlife (Livengood 1983). Economists suggest that wildlife are valued through use values and non-use values. Use values are assigned to the direct use of a resource, such as meat, hunting, fishing, or viewing wildlife. Nonuse values comprise of values not included in the use value grouping (Devouges et al. 1983, Fisher and Raucher 1984, Boyle and Bishop 1987). Non-use values are categorized into intrinsic and esistence value, which are based on the assumption that society value wildlife in some way (Kuritlla 1967, Stevens et al. 1991). Existence value involves the willingness to pay for the existence or preservation of wildlife, even if the individual does not directly use or interact with the resource. Although studies suggest that existence values comprise of a large share of the economic value of wildlife, they are often challenged (Brookshire et al. 1983, Stevens et al. 1991, Zawacki et al. 2000).
Due to the nature of use and nonuse values, different methodologies are necessary in order to estimate their values. The estimation of use values are conducted through revealed preference methods. This methodology is based on the direct and indirect valuation through the observation of market behavior. The estimation of nonuse values is conducted through state preference methods, which survey respondents on the value the associate with hypothetical changes through the use of surveys.
2.4.1 Stated Preference Methods and Contingent Valuation
There is no market information for natural resources that have off-site use (existence and option values for example), so it is difficult to calculate their monetary value. Therefore, economists use the contingent valuation method (CVM) to develop a replicated market (Davis 1963, Loomish and Walsh 1986, Mitchel and Carson 1989). The purpose of the CVM is to obtain an individual’s willingness to pay for the preservation or restoration of a certain natural resource. CVM’s are conducted through a survey format, in which respondents are asked how much they would pay for different levels of the natural resource in question.
Similar to natural resources and environmental amenities, conservation of endangered species is not exchanged in an open market. For this reason, measuring the demand for these goods and services is difficult. Therefore, it is necessary to use CVM to estimate the willingness to pay for preservation on the natural resource (Mitchell and Carson 1989). In the past, this method has been used to determine the value of endangered species. Loomis and White (1996) research 20 CVM studies which measured the economic value of endangered species, which included the gray wolf. Loomis and White (1996) found that the willingness to pay is determined through multiple issues, such as the change in population, whether the payment is annual or it occurs once, if the respondent identifies a non-user, as well as the type of species.
Since the adaptation of the Endangered Species Act in 1973, there have been many cases of conflict between industrial development and the protection of endangered species. Of these conflicts, the most controversial is the protection of the northern spotted owl in the Pacific Northwest. The spotted owl’s habitat consists of old growth timber, which is extremely valuable on the open market. The Pacific Northwest’s economy is heavily depended on revenues generated form harvesting timber. Therefore, protecting the spotted owl can be a very costly to the region’s economy. In contrast, under the Endangered Species Act, the spotted owl is classified as a threatened species. Meaning, without further protection, the species would be likely to go extinct. To many environmentalist and scientists, the spotted owl is a representation of the viability of the old-growth forest as an ecosystem. If the spotted owl were to become extinct, this would represent the health of the ecosystem itself. Additionally, the old-growth forest habitat of the spotted owl cannot be easily replaced once removed, therefore, people may be willing to preserve this forest for future use (Wesibrod 1964, Krutilla 1967). Furthermore, individuals may develop fulfillment simply for the fact that the old-growth forest are conserved which provides value from simply existing (Krutilla 1967, Randal and Stoll 1983). Finally, individuals may be willing to pay a bequest value in order to preserve these forest and species for the enjoyment of future generations.
When evaluating the cost and benefits of preserving the spotted owl, there was far more emphasis placed on the economic cost of preservations compared to the economic benefits. In order to challenge this perception, Rubin et al. (1991) conducted a cost-benefit analysis by conducting a CVM survey in order to estimate Washington State resident’s willingness to pay for conservation of the spotted owl. Their results show that the average willingness to pay, adjusted for socioeconomic characteristics such as education and income, was $34.82 per year. Based on this estimate, the total willingness to pay for the state of Washington was approximately $62.7 million per year.
The State of Minnesota is a prime example of this issue with their evaluation of the gray wolf (canis lupus). The gray wolf was one of the first animals that was protected when the Endangered Species Act (ESA) passed. This act was created in order to protect animals and plants who are classified as threatened or endangered, in order to ensure that their populations would return to a sustainable level. In 1987, a plan was enacted in order to increase the population of wolves to sustainable levels. According to the plan, in order to be removed from the list there must be 1250 wolves in Minnesota, and 100 wolves in Michigan and Wisconsin. In Minnesota, the requirement was met in 1978, although Michigan and Wisconsin did not reach those goals until 1990. As a result of this management plan, the gray wolf was removed from the endangered species list in January 2012. However, due to a Federal court decision, wolves in the Great Lakes area were relisted under the Endangered Species act on December 19, 2014.
When an endangered or threatened species is removed from the list, the U.S. Department of Fish and Wildlife, along with state authorities, creates a system for observing the species in question for 5 years to ensure the population remains sustainable. In 1998, the State of Minnesota held a panel discussion comprising of stakeholders that would be affected by the removal of the gray wolf from the endangered species list, such as environmentalists, farmers, and hunters. Once the panel had completed their resolution, it was submitted to the Minnesota Department of Natural Resources, which were then sent to the state legislature. In April 2000, the Minnesota legislature passed a bill which incorporated hunting regulations as well as a wolf management plan. Minnesota Governor Ventura signed the bill into law in May, 2000. Following the signing of the bill, the Minnesota Department of Natural Resources drafted a wolf management plan and submitted it to the U.S. Fish and Wildlife Service. Included in the plan was monitoring of wolf populations, protection of critical habitat, as well as regulations regarding depredation. When citizens were surveyed about the Wolf Management Plan, the were asked if they would be willing to pay a one-time payment in order to fund the plan. The responses varied, but the average willingness to pay was $67 (Chambers and Whitehead 2002). Furthermore, the total willingness to pay for the plan in the state of Minnesota is $27,446,885. According to Loomis and White (1996), one time payments produce larger willingness to pay estimates than annual payments.
These estimates allow researchers to compare the cost and benefits of maintaining the Minnesota wolf population. Mech (1999) estimates that a wolf population of 3,150 would cost $342,830 annually. Current depredation levels would require $116,953 annually to cover the compensation for lost pets or livestock.
Similar to Minnesota, the reintroduction of gray wolves in Yellowstone National Park was highly contested between the parties involved. In order to gauge public perception, Duffield and Neher (1996) conducted a CVM survey to estimate the value of the wolves, sampling locally and nationally. Due to the controversial nature of the survey, they also questioned those who opposed the proposition in order to determine the willingness to pay for blocking reintroduction. Duffield and Neher found that in general, reintroduction would produce positive net benefits. Furthermore, those in support of reintroduction were willing to financially support reintroduction more than those in opposition were willing to support prevention. Finally, the compared the benefits to the costs of wildlife management and found a total net benefit of approximately $6 to $8.9 million each year.
2.4.2 Revealed Preference Methods and Hedonic Property Models
As opposed to stated preference methods, revealed preference methods attempt to estimate the value of non-market goods through the observation of actual consumer behavior (Russell 2001). Revealed preference methods are flexible and can be used in a variety of studies. One strength of this methodology is that it is based on realistic choices made by consumers or families. This strength contrasts state preference methods which inquire how individuals would value changes in non-market goods in a hypothetical situation. Based on this information, critics of these methodologies see market based studies as a more accurate gauge of consumer preferences. The reason being that revealed preference methods produce concrete data on a consumer’s willingness to pay for acquisition of a non-market good, or a willingness to avoid potential negative effects of a non-market bad.
Based on the influential work of Rosen (1974), hedonic property models attempt to estimate non-market values by observing the willingness to pay for a home given its physical and neighborhood properties. Specifically, the price of a market good is comprised and valued on it’s characteristics. Therefore, it is possible to value individual characteristics of a good by estimating the willingness to pay of consumers if this characteristic changes. In the study of environmental economics, the hedonic pricing method is used to estimate the value for environmental services that affect housing prices. Hedonic studies have been utilized to estimate the value of non-market goods (or bads); some examples include air pollution, aircraft noise, road traffic, water quality, as well as distance to landfills.
Neumann et al. (2009) use the hedonic price model in order to effects of the Great Meadow Wildlife Refuge on nearby housing values. There is evidence that suggests that open spaces have positive effects on the value of a house (Knetsch 1962, Corel et al. 1978, Beasley et al. 1986, Garrod and Willis 1922, Geoghegan 2002). Open spaces provide a variety of amenities, such as aesthetic value, recreation, privacy, as well as ecosystem services in which homebuyers may be willing to pay a higher price in order to live near these amenities. National Wildlife Refugees are designated open space areas in which species in habitat are protected. Neumann et al. (2009) found that houses near the Great Meadow Wildlife Refuge has a price premium which is statistically equal to the premiums of two other types of open space (recreation parks and golf courses). They found the estimated price premium at $623 per 100 meters of proximity to the wildlife refuge.
The hedonic property method is prevalent in estimation of the effects of air pollution. Smith and Huang (1995) conducted a meta-analysis of the use of hedonic property models in measuring air quality. Specifically, the compiled estimates of the marginal willingness to pay (MWTP) for decreasing airborne particular matter with hedonic models between 1967 and 1988. Their analysis found that the range of estimated values was between zero and $98.52 for a reduction of one unit in particulates, measured in micrograms per cubic meter. The reported mean MWTP is $109.90 while the median MWTP is $22.40. This suggests that outliers are influential within estimates summary statistics.
Like any valuation technique, there are issues involving the use of the hedonic property method. For example, consumers may not have perfect information regarding the housing market. Secondly, the issue of multicollinearity is prevalent in hedonic studies. Characteristics of houses tend to be related to each other when determining the value of a house. For example, the square footage of a house is directly related to the number of bedrooms and bathrooms in the house. Therefore, it can be difficult to determine how these variables can independently effect the value of the house (Day 2001). Historically, academics may ignore this issue which may result in omitting influential variables, which could lead to biased results.
Add more examples of hedonic studies (522 paper)
2.5 Cost of Wildlife
Wildlife, especially predators can impose economic costs upon society, specifically to farmers and ranchers. The most prevalent type of damage may occur through livestock depredation (Baker et al. 2008). Most of the literature estimating the costs of wildlife prior to 1995 was concentrated on a single species (Conover et al. 1995), demonstrating that there is a large literature gap regarding the cost of wildlife. Another source of societal costs are collisions between wildlife and vehicles. In these cases, including the value of human life in cost analysis can be significant.
In a parallel manner to estimate the values of wildlife, the costs of wildlife are identified as direct and indirect. Direct costs signify the damages incurred by farmers or ranchers from the depredation of livestock. Depredation has the potential to increase the costs incurred to society through a reduction in the supply of livestock. If this were to happen, the reduction in supply could increase the price of livestock, which could have widespread ramifications to the agricultural economy.
2.6 Literature Gap
Prevailing literature regarding the valuation of wildlife has been limited to the use of contingent valuation methods. Specifically, the meta-analysis performed by Richardson and Loomis (2009) updates a 1996 analysis valuing endangered, threatened, and rare species. Some of these species include the spotted owl, gray wolf, salmon, and the bald eagle. In terms of behavior and ecology, none of the previously listed animals are similar to the cougar.
Although the CVM has been updated and improved throughout its history, the use of the method is highly controversial. The primary source of concern involves the accuracy and validity of WPT estimates. There are a variety of factors which can systematically bias a respondents’ answers. Specifically, these biases include hypothetical bias, strategic behavior, anchoring bias, and information bias (Pearce et al. 2006). According to Mitchell and Carson (1989) these methodological issues are not exclusive to contingent valuation and are apparent in a majority of survey based methods. These issues and resulting bias can be attributed mostly to survey design.
Previous CVM studies do not have any studies on cougars
Furthermore, there are no studies which use a revealed preference method to valuate cougars
Hedonic beter than cvm
How my research fills this gap
In the next chapter on data collection and analysis, I explain the process of collecting the information necessary for this research. Furthermore, I classify the validity and error of the data and its variables. Lastly, I discuss the use of Geographical Information Systems (GIS) is the field of resource economics as well as its use in this analysis.
Chapter 3
Data, Analysis, and the Use of Geographic Information Systems
Geographic information systems (GIS) has revolutionized and elevated the complexity of analysis available in the field of environmental economics. With GIS, it is possible to analyze multiple types of data across space, with a level a precision that was previously unattainable. Furthermore, this newly acquired spatial data can be input into economic models in order to solve problems with more precision. The development of this technology has permitted researchers to disregard strong spatial assumptions in favor of precise measurement of treatment variables, such as the size and distance of environmental amenities (Bateman et al, 2002). Furthermore, the use of GIS eliminates prevalent methodological problems such as spatial autocorrelation and omitted variable bias (Parameter and Pope, 2012).
The term GIS can refer to a variety of platforms, uses, and scales. A GIS can refer to an individual piece of software or a system of frameworks and models utilized across many users. For the purpose of this research, I accept the definition of GIS as “An integrated collection of computer software and data used to view and manage information about geographic places, analyze spatial relationships, and model spatial processes.” (ESRI, 2015). With this definition, GIS is an all-encompassing term, which does not limit itself to a single program or function.
In this chapter, section one presents a background on the use of GIS in environmental economics literature. The purpose of this section is not to present the results and significance of these studies, but to discuss the use of GIS in the data collection process. Section two discusses my study area, data sources, and quality of data. In conclusion, section three synthesizes the methods used to perform this analysis.
3.1 Background
The use of GIS in the field of resource economics is widespread, including various forms of pollution (Din et al., 2001; Leggett and Bockstael, 2000 and Metz and Clark, 1997), land cover studies, land cover studies (Smith, 2002, Walls et al., 2015), impacts of urban growth (Irwin, 2001, Irwin 2002, Appleton et al., 2002, Huang et al., 2007), as well as demand studies of recreation sites (Jones et al., 2010, Bateman et al., 1999; Lovett et al., 1997). Furthermore, GIS is revolutionizing hedonic models since the collection of data regarding environmental variables is notoriously time consuming and possibly inaccurate. Parameter and Pope (2012) created a tutorial of the necessary steps to complete a hedonic study, in which they claimed that GIS is an excellent method to digitize housing sales as well as analyze shapefile.
Geocoding is the conversion of raw addresses to points on a GIS map, and is an integral first step in the creation of hedonic models. For instance, Anselin and Gallo (2006) geocoded 115,732 sales of houses to their locations in four counties in California. Once the locations were geocoded, they were able to able to perform an intersection of the locations with variables like air quality as well as socioeconomic characteristics of the area. Lewis et al. (2008) geocoded the locations of 7,876 homes before measuring their distances to rivers and dams in the area in their hedonic analysis of the impacts of dams.
Buffers, which is an area surrounding a feature or point on a map measured in distance (ESRI, 2015), allow analyst to identify variables within a set distance of a point or observation. For instance, Heintzelman and Tuttle (2012) created buffers with a range of .5 miles to 10 miles around 1,903 parcels in order to calculate the number of wind turbines within each range. Extracting data within these buffers creates independent variables which can be used in hedonic analysis.
3.2 Study Area, Data Sources, and Validity
My study area includes the western Washington counties of Clallam, Clark, Cowlitz, Grays Harbor, Island, Jefferson, Lewis, Mason, Pacific, San Juan, Skagit, Skamania, Wahkiakum, and Whatcom (Figure 2), and has an area of 19,097 square miles. According to the 2014 US Census (2014), this area has a population of 1,322,715 people, and has 3,541,617 housing units.
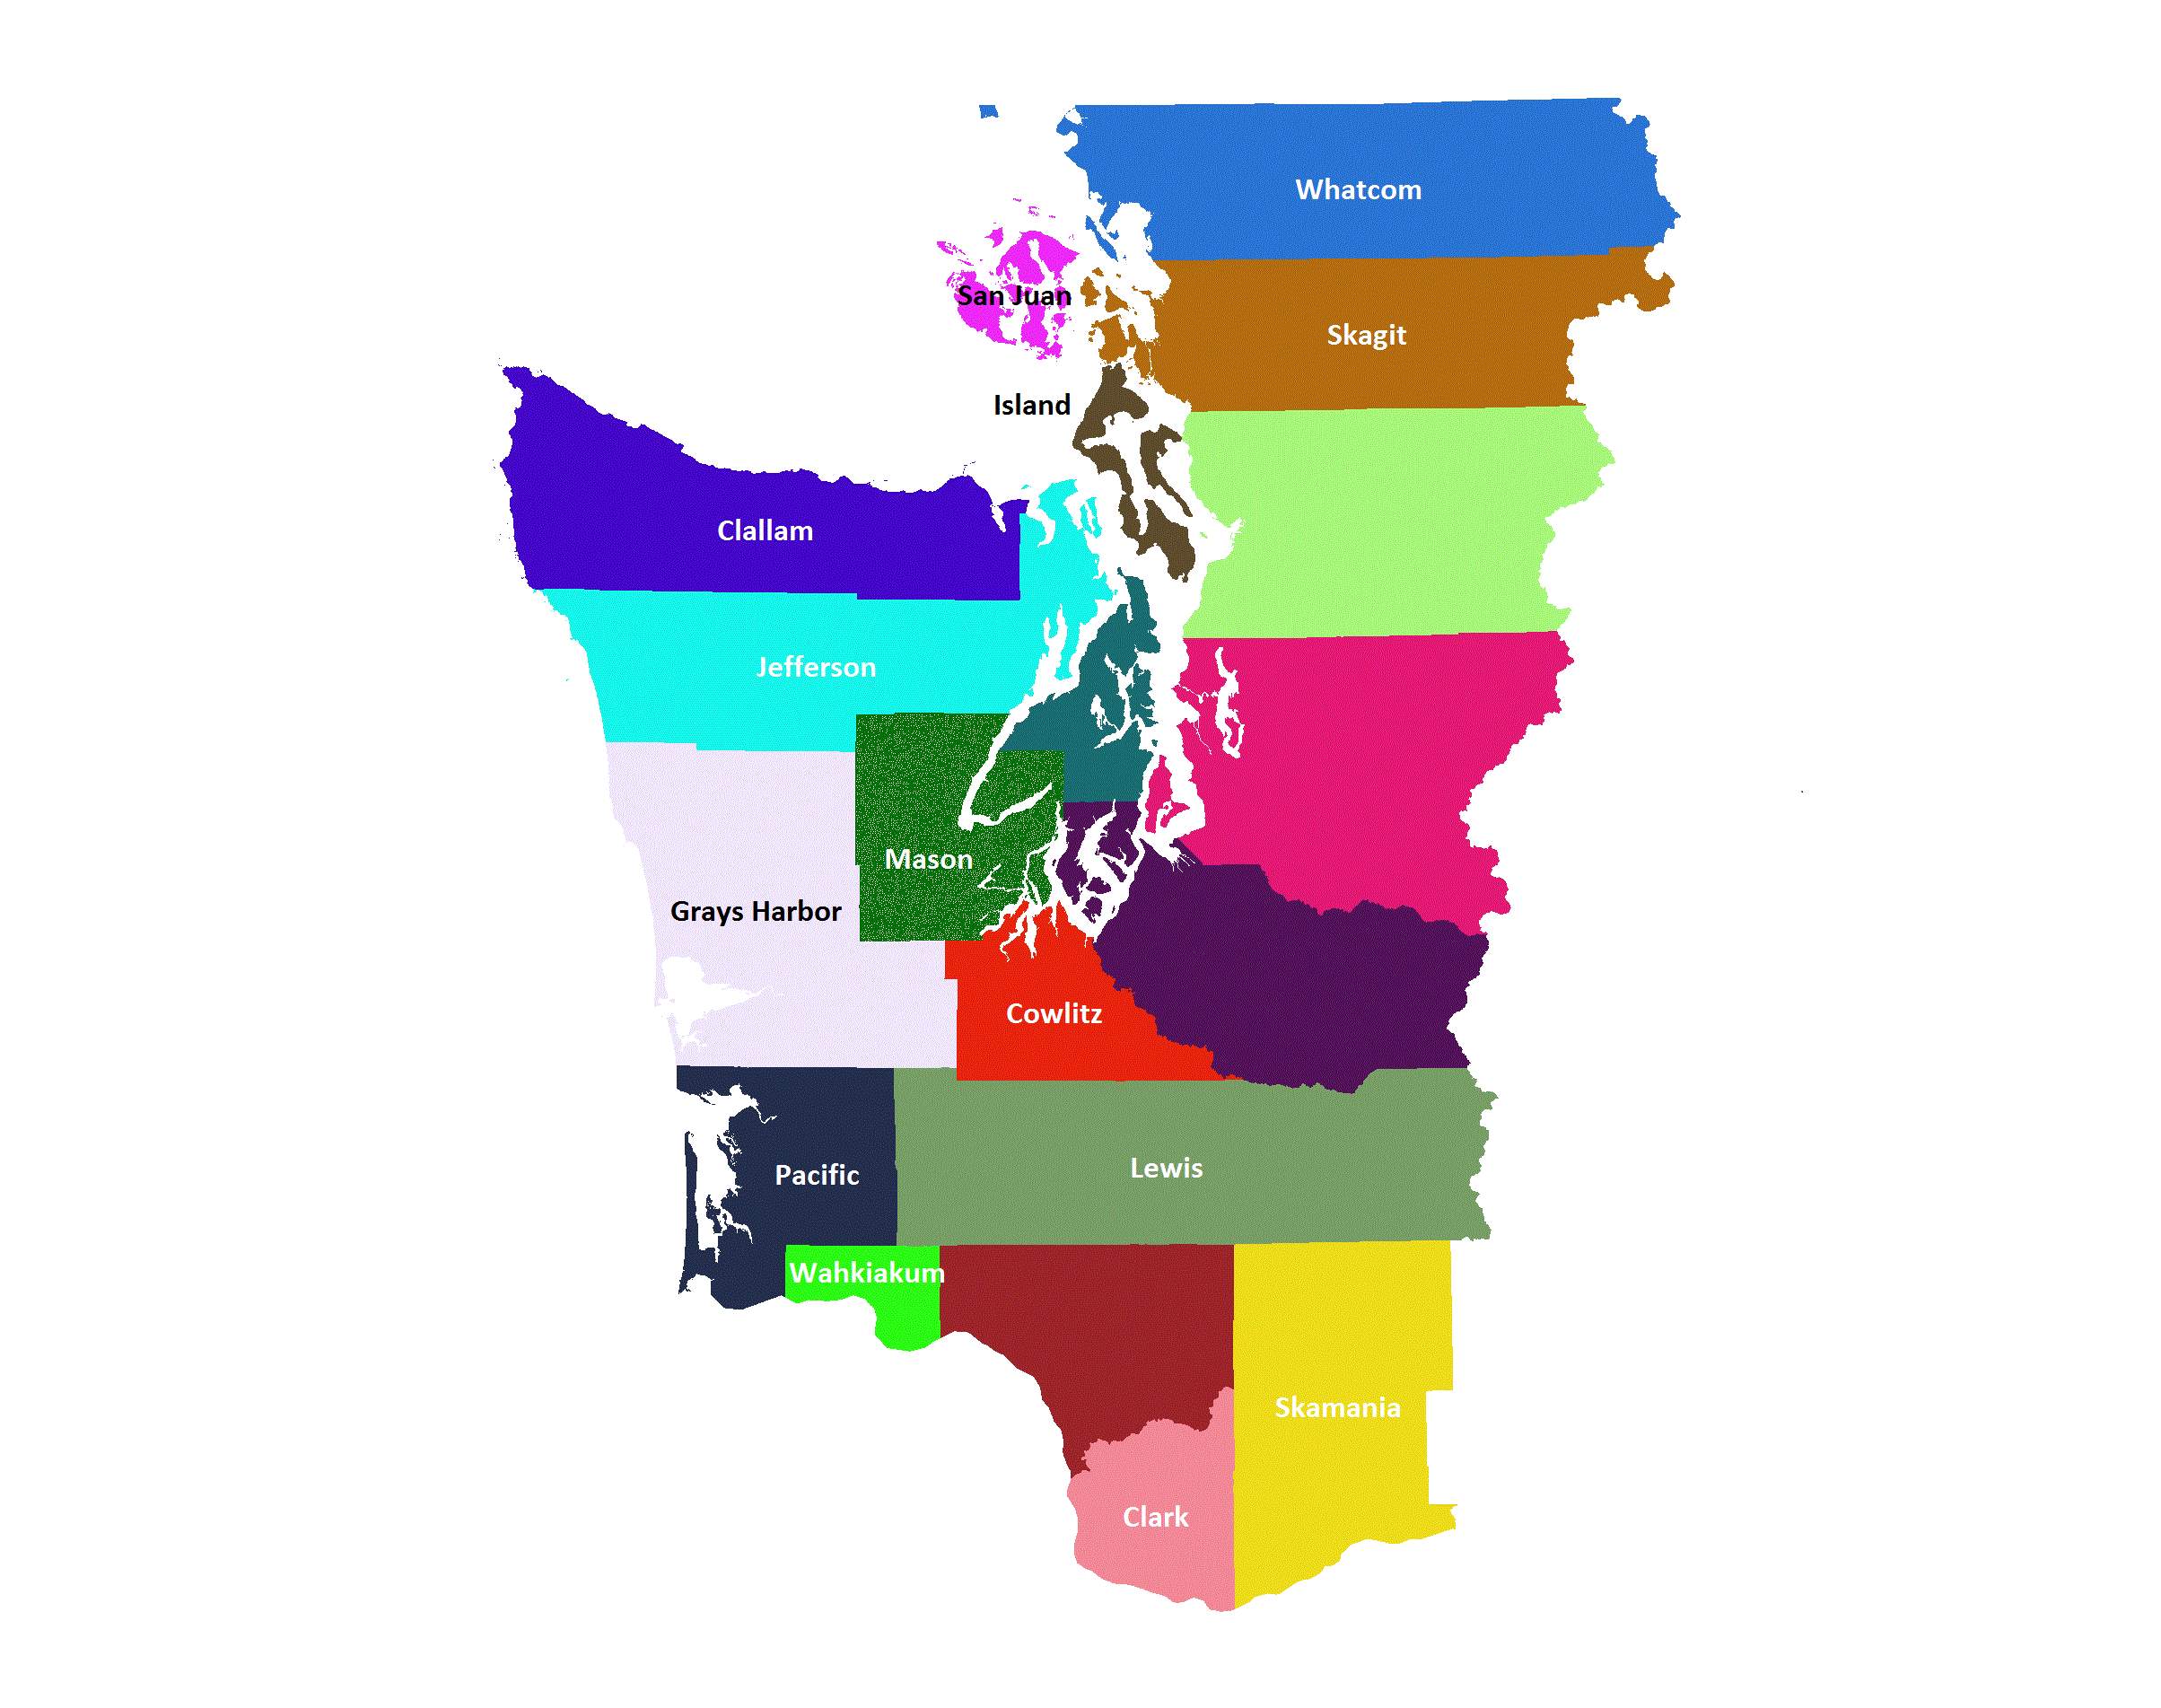
Figure 2. Western Washington Study Area (Rural Technology Institute)
Over the past 25 years, the WUI of western Washington has increased in terms of area, as well as the number of housing units. According to Hammer et al. (2007), from 1990 to 2000, the area of WUI land in Washington State increased 16.4%. Furthermore, the number of housing units in the WUI increased 29.6% in the same time period. According to Tully (2013), from 2000 to 2010, the area of WUI land in Washington State increased 8.23%. Furthermore, the number of housing units in the WUI increased 22.51% during the same time period. These figures illustrate the rapid expansion of the amount of acreage in WUI areas, as well as the number of households.
With this rapid expansion of WUI area and population, it could be suggested that land use within the study area would be altered as well. In 2004, the UDSA Forest Service contracted the University of Washington’s Rural Technology Initiative (RTI) to research the issue of land use in western Washington. In order to do so, the RTI calculated the amount of acres that were classified as forests in 1988, and compared those results to the development of the same lands in 2004 (Figure 3). The results of RTI’s research showed a significant change in land use form the years of 1988 to 2004. In western Washington counties, 7,070,000 acres remained forested from the years of 1988. 796,000 acres were changed to agricultural or mixed rural land during the same time period. 401,000 acres were changed to developed land, 62,000 acres were changed to water (University of Washington 2004). As a result, 2,826,000 acres of land have been altered in its use from the years of 1988 to 2004. These figures illustrate the severity of the transformation that western Washington has experienced in its recent history. Over the past 25 years, western Washington has experienced rapid population growth, a dramatic increase in the number of housing units, an increase in the amount of acreage in WUI areas, as well as transforming landscape in terms of land usage.
Figure 3. Forest Land Use in Western Washington (Rural Technology Institute)
This study consists of two primary sources of data: housing data, and cougar incident reports. These datasets were gathered from different sources and were processed using separate methods. The following section details each datasets source, the collection of data, as well as their validity and downfalls.
3.2.1 Housing Data
In order to perform this research, there are two datasets that I will employ. The first contains housing sales data from the twelve counties within my study area. The dataset was acquired from Real Market Data, a company that processes data regarding houses and property. The dataset contains variables such as property value, bathrooms, bedrooms, floor area, acreage, age, home state of buyer, as well as addresses from 1986-2012. There are 297,480 home sales in this dataset. The average home is 43 years old, 1600 square feet, has a sale price of $200,480, has 2.9 bedrooms and 1.7 bathrooms.
In order to be used for spatial analysis, the housing data must be geocoded. As previously explained in the introduction of this chapter, geocoding is the process of converting addresses into points on a map. This process was completed by Logan Blair in his thesis “The Economic Impacts of Forest Pathogens in Washington State: A Hedonic Approach.” Blair (2015) used the geocoder function in ESRI ArcGIS 10 in order to create physical points of the addresses provided in the housing sales dataset.
The process of geocoding creates a potential for errors if there are discrepancies in the address information of housing sales. When a set of addresses are geocoded, ArcGIS creates a score regarding the accuracy of the plotted address. Blair (2015) compiled a random sample of error scores and categorized them into ranges (41-50, 51-60, 61-75, 76-90). The tables shown below were produced from Blair (2015) and displays the ranges and errors found in his random sample. As the match score increases, the number of errors in the sample decreases. However, this relationship also reduces the number of observations, as shown in Table 3. Blair (2015) determined that because there are few errors with a score smaller than 60, he created a subset of the data with scores of 61 or greater. As a result of the work done by Blair (2015), the aforementioned subset of data was used in this thesis.
| Score Range | Errors/100 | Error in total population |
| 76-90 | 0 | – |
| 61-75 | 4 | 0.54% |
| 51-60 | 18 | 0.68% |
| 41-50 | 35 | 0.73% |
Table 2: Errors within Score Range (Blair 2015 pg. 29)
| Allowed Scores | Percent Matched at given level | Addresses Remaining | # Of records in each category |
| >90 | 17.55% | 56,971 | 56,971 |
| >76 | 75.37% | 244,676 | 187,705 |
| >61 | 87.23% | 283,168 | 38,492 |
| >51 | 87.93% | 285,432 | 2,264 |
| >41 | 88.06% | 285,859 | 427 |
Table 3: Observation per Allowed Score Criteria (Blair 2015 pg. 29)
3.2.2 Cougar Incident Reports
The second dataset contains Cougar Incidents Reports, which were obtained from the Washington Department of Fish and Wildlife (WDFW). Every time there is a confirmed cougar sighting, the WDFW compiles information about the incident, such as a report narrative, report information (report year, report number, incident date), reporting party, species, and location of the encounter. To extract the incident report data, I used the program Outwit Hub, which uses computer code to “scrape” the desired information from the website, and export the data to an Excel spreadsheet. The data regarding the location of each sighting is reported in Township, Section, Range (TRS) format. Therefore, in order to input the location data into ArcGIS, it was necessary to convert the data form TRS format to latitude and longitude coordinates. This process was done by using a Township Geocoder provided by the Bureau of Land Management. Once the data was converted to latitude and longitude, I was able to plot the cougar sightings in ArcGIS.
In order to extract cougar sightings at various distances, I created a 1km, 3km, and 5km buffer around each geocoded house in ArcGIS and intersected them with their corresponding WDFW confirmed cougar sighting.
3.3 Methods
This research utilizes GIS in order to spatialize and perform intersections on the housing sales and cougar sighting data. In order to perform regression analyses, I used GIS in order to prepare the data.
Chapter 4
Journal Article
The Economic Impacts of Cougars in Western Washington
Todd Stoothoff *
Abstract
The combination of increasing cougar populations, and the rising human population in Wildland-Urban Interface (WUI) areas suggests that the number of human-cougar encounters will rise as well. The increase in human-cougar encounters creates potential issues in regards to public safety, public policy, and management of predators. For the purposes of this research, I will employ a housing data set of fourteen counties in Western Washington in order to quantify the impacts of a confirmed cougar sighting on the sale value of a home. Specifically, I will be employing the use of a hedonic real estate price model. I expect to find that the presence of a cougar will negatively affect the sale value of a home. These results would suggest the need for changes in policy in regards to management of cougars, as well as land use management.
Keywords: Hedonic, Environmental Economics, Revealed Preference, Environmental
Impact, Cougar, Wildlife
________________________
*Todd Stoothoff is a Masters Student in the Resource Management Program at Central
Washington University. The views expressed in this paper are his own and do not
represent those mentioned above.
4.1 Introduction
The population of the predator cougar (i.e., puma concolor)have reportedly increased over the past thirty years (Washington Department of Fish and Wildlife 2010). Furthermore, the human population in Washington State is increasing as well. The population of counties of western Washington in which less occupied land is being developed is growing at a greater rate than the state average (State of Washington 2015). The combination of increasing cougar populations, and the rising human population in Wildland-Urban Interface (WUI) areas suggests that the number of human-cougar encounters will increase as well. A human-cougar encounter may result in a range of possible outcomes. These outcomes span from a confirmed sighting of a cougar to an attack on livestock, pets, or even humans. The amount of human-cougar encounters in Washington have been increasing, (Beier 1991, Fitzhugh et al. 2003) as have the number of cougars taken in hunts (Dawn et al. 2003). The increase in human-cougar encounters creates potential issues in regards to public safety, public policy, and management of predators.
The presence of cougars in increasingly residential WUI areas create potential issues for the safety of cougars and humans alike. According to a survey conducted by the Washington Department of Fish and Wildlife (WDFW), 75% of Washington residents claim to have little knowledge about cougar behavior or ecology (WDFW 2010). This lack of knowledge creates a potential risk for the safety of individuals, animals, and larger communities. Furthermore, the presence of cougars may have a significant impact on the real estate market in residential areas within the WUI, based on public perceptions regarding cougars.
The main purpose of this research is to measure the impacts of large predators on housing prices in western Washington. Specifically, I will assess the confirmed presence of cougars on home sale prices in fourteen rural western Washington counties. Based on this information, I will attempt to discover the relationship between a confirmed sighting of a cougar in the general vicinity of a house and the house’s value. Furthermore, based on the results, I will make recommendations for changes in policy in regards to management of cougars, as well as land use management.
This research will provide a quantitative assessment of the effect of a confirmed cougar sighting on the sale price of a home. Upon further analysis of the results, the fourteen counties in my study area may use this research to shape policy in regards to the management of predators, their populations, and harvesting techniques. In addition, if cougars have a significant negative impact of the sale price of a home, this could cause a decrease in the amount of tax revenue generated from these homes. Furthermore, the results could help shape policy in regards to land management, ensuring that future homes created in WUI areas are safe for both humans and cougars alike. The results of this research may also be used at a statewide level, through agencies such as the Washington Department of Fish and Wildlife. On a national level, this research will add to the body of knowledge surrounding management of predators, land management, as well as impacts on housing values.
4.2 Study Area and Data
My study area includes the western Washington counties of Clallam, Clark, Cowlitz, Grays Harbor, Island, Jefferson, Lewis, Mason, Pacific, San Juan, Skagit, Skamania, Wahkiakum, and Whatcom (Figure 2). These counties include 19,097 square miles. According to the 2014 US Census (2014), this area has a population of 1,322,715 people, and has 3,541,617 housing units.
In order to perform this research, there are two datasets that I will employ. The first contains housing sales data from the twelve counties within my study area. The dataset was acquired from Real Market Data, a company that processes data regarding houses and property. The dataset contains variables such as property value, bathrooms, bedrooms, floor area, acreage, age, home state of buyer, as well as addresses from 1986-2012. The average home is 43 years old, 1600 square feet, has a sale price of $200,480, has 2.9 bedrooms and 1.7 bathrooms.
In order to be used for spatial analysis, the housing data must be geocoded. As previously explained in the introduction of this chapter, geocoding is the process of converting addresses into points on a map. This process was completed by Logan Blair in his thesis “The Economic Impacts of Forest Pathogens in Washington State: A Hedonic Approach.” Blair (2015) used the geocoder function in ESRI ArcGIS 10 in order to create physical points of the addresses provided in the housing sales dataset.
The second dataset contains Cougar Incidents Reports which were obtained from the Washington Department of Fish and Wildlife (WDFW). Every time there is a confirmed cougar sighting, the WDFW compiles information about the incident, such as a report narrative, report information (report year, report number, incident date), reporting party, species, and location of the encounter. To extract the incident report data, I used the program Outwit Hub, which uses computer code to “scrape” the desired information from the website, and export the data to an Excel spreadsheet. The data regarding the location of each sighting is reported in Township, Section, Range (TRS) format. Therefore, in order to input the location data into ArcGIS, it was necessary to convert the data form TRS format to latitude and longitude coordinates. This process was done by using a Township Geocoder provided by the Bureau of Land Management. Once the data was converted to latitude and longitude, I was able to plot the cougar sightings in ArcGIS.
In order to extract cougar sightings at various distances, I created a 1km, 3km, and 5km buffer around each geocoded house in ArcGIS and intersected them with their corresponding WDFW confirmed cougar sighting.
4.3 Methods and Empirical Issues
The primary purpose of this research is to measure the impacts of the presence of a cougar on the value of a home, holding all other factors constant. A home is a heterogeneous entity whose value is determined though separate structural, environmental, and neighborhood characteristics, which can include environmental amenities or disamenities. Specifically, homebuyers purchase an array of housing characteristics rather than a single product. While housing characteristics may be valued differently between individuals, a large market with many buyers, sellers, and competing homes will explicitly define their value (Rosen, 1974). Rosen (1974) originally presented this function as the hedonic real estate price model:
pz= pz1, …, zn)
where
prepresents the price of a home, given
zestimates of fixed values for various characteristics. Similar to the fact that certain features of a home will determine price in the above equation, it may be possible that homebuyers will consider proximity to dangerous wildlife such as cougars into their real estate purchasing decisions. Based on this information, I hypothesis that as the number of cougar sightings increase, the impacts on housing sale price will be different from zero. Specifically, the null:
H0:B1 CougarSighting= 0
and its alternative
H1:B1 CougarSighting≠ 0
In order to quantify these impacts, I will be employing the use of a hedonic real estate price model. Hedonic pricing models are used to estimate the extent of characteristics that affect the price of a house. There are many aspects that affect the value of a home such as structural characteristics of the house, characteristics of the surrounding neighborhood, and positive or negative amenities of the surrounding environment, such as cougar sightings. A hedonic pricing model includes all of these characteristics as variables in a regression model. While holding variables constant during regression analysis, we are able to calculate the impact of a specific variable. For the purpose of this research, the variable representing confirmed presence of a cougar will be the variable in which we want to measure. In other words, we are measuring the effect of the independent variable: the presence of a cougar, on the dependent variable: the sale price of a house. By creating this model, the hedonic price regression will serve as a revealed preference valuation method in order to elicit an individual’s willingness to pay to avoid the potential negative impacts of living near a cougar.
I will be incorporating the use of ArcGIS in order to perform spatial analysis. In order to do so, I will be geocoding the locations of each house that was sold, and where each cougar incident report was located. Once the location of the cougar incident has been geocoded, I will create multiple buffers surrounding the location at 1km, 3km, and 5km. Once the buffers are created, I will search for points in which a cougar’s home range intersects with the location of a house.
Simple hedonic models are commonly associated with omitted variable bias according to Greenstone and Gayer (2009) and Parameter and Pope (2012). This bias occurs when any omitted variables are correlated with any dependent variables. It is unrealistic to control every factor that could impact the price of a home
Spatial autocorrelation bias occurs when features from one observation causes the features of another observation to contain certain characteristics (Dormann et al. 2007). This relationship violates the assumption that error terms are autonomously calculated from each other and can be harmful when analyzing expansive markets. In this research, autocorrelation is present in size and quality of a home which can affect identical features of surrounding homes.
Cite This Work
To export a reference to this article please select a referencing stye below:
Related Services
View all


Related Content
All TagsContent relating to: "Animal Sciences"
Animal science can be described as studying the biochemistry, physiology, and behaviour of animals that are under human control. Historically, animal science degrees were known as animal husbandry and focused on livestock. Studies now include companion animals such as cats and dogs.
Related Articles

DMCA / Removal Request
If you are the original writer of this dissertation and no longer wish to have your work published on the UKDiss.com website then please: