Using EMG Muscle Signal to Control DC Motor
Info: 7059 words (28 pages) Dissertation
Published: 22nd Oct 2021
Tagged: Biomedical Science
Contents
Introduction
Literature Review
Electromyography Signal
EMG Time and Frequency domain analysis
Fuzzy logic classifier
EMG Controller
Microprocessor PWM Motor control
DC Motor
Chapter 1 – Instrumentation and Equipment
Surface Electrodes
EMG Sensor
Microcontroller
LabVIEW Software
DC motor
DC motor drive
Chapter 2 – Methodology
System block diagram and implementation
Figure 1: Raw EMG Signal
Figure 2: EMG Signal Conditioning Circuit
Figure 3: Instrumental Amplifier
Figure 4: EMG Power Spectrum Characteristics
Figure 5: EMG Gaussian Membership Function
Figure 6: Membership Function for FLS grip movement classification
Figure 7: EMG Controller System
Figure 8:Block Diagram of closed loop speed control
Figure 9: Fleming’s left-hand rule
Figure 10: DC Motor Structure
Figure 11: DC Motor Circuit Diagram
Figure 12: EMG Data Acquisition Set Up Outline
Figure 13: Surface EMG Electrode
Figure 14: Electrode Cable
Figure 15: Myoware available EMG Waveform Signal
Figure 16: Myoware Sensor
Figure 17: LabVIEW Front Panel
Figure 18: LabVIEW Block Diagram View
Figure 19: DC Motor Prototype
Figure 20: Arduino DC Motor Drive Schematics
Figure 21: Drive Implementation
Figure 22: EMG Controller internal components
Figure 23: EMG Controller Actual Hardware Set-up
Figure 24:System Block Diagram
Table 1: Arduino Eleven Characteristic from Data Sheet
Table 2: DC Motor Specification
Table 3: Microcontroller Configuration
Table 4: Pin Summary
List of abbreviations
- EMG Electromyography
- HCI Human-Computer Interface
- HMI Human-Machine Interface
- IEMG Integrated Electromyography
- MYOP Myo pulse percentage rate
- MAV Mean Absolute Value
- RMS Root Mean Square
- I/O Input/Output
- FLS Fuzzy Logic System
- MUAP Muscle Unit Action Control
- IPI Inter-pulses Interval
- PWM Pulse Width Modulation
- ADC Analog to digital conversion
- DC Direct Current
- IDE (Integrated Design Environment)
Introduction
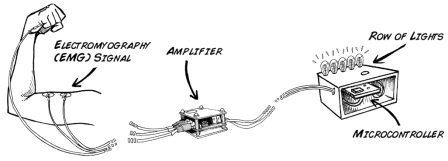
Throughout the years, the development of HCI technology has been advancing consistently however the control interaction between human and machine has a long way to go. Current HCI technologies involve Image processing, speech recognition, bio-signal processing and touch sensing. This project will focus on a hand gestured based recognition system to control a DC Motor. Through different intensity of hand contraction, the DC motor speed can be varied and control.
The demand for EMG signal controller technology is increasing due to the introduction of robotics and biomedical prosthetics. With this type of technology, the development of advanced robotics will greatly improve as this will allow robots to be able to distinguish and classify human movements. This type of control will allow workers to control dangerous equipment through hand gestures therefore isolating them from surrounding hazards. Exo-skeleton system is another application that EMG controller can be used since the concept of the design of this system relies on muscular and skeletal movements. Prosthetic replacements such as arms and limbs are now taking advantage of EMG controller however it is still under further development and improvement. People with disability will mostly benefit from this type of controller since through hand gestures; they can easily manipulate household appliances.
EMG signal is the electrical manifestation of the neuromuscular activation associated with a contracting muscle {Basmajian, 1985 #6}(Basmajian & Luca 1985). These signals can be complicated to analyze due to the difference in muscle structure and anatomical properties of each person. There are some compatibility issues with using EMG as a control signal because EMG signal pattern varies with different people therefore it must be calibrated to satisfy control process. Different types of techniques can be done to classify these signals which include:{Basmajian, 1985 #6}
- Fuzzy Logic Analysis
- Support Vector Machine
- Artificial Neural Network
- Probabilistic Neural Net{Berlia, 2014 #1}work
Fuzzy logic is discussed in this report and used as the EMG classifying technique.
This report contains the data acquisition and signal processing of EMG involved in the project. A microcontroller (Arduino Uno) is used as an I/O interface to acquire EMG signals and produce PWM signal for the motor. An EMG sensor (Myoware Muscle Sensor) is connected to the analog input of the microcontroller which acquires SEMG signal produced by the user’s hand movement. The sensor is placed on the surface of the flexor carpi ulnaris muscle since there is a lot of muscle activity in this region of the forearm during hand contraction. The microcontroller is interfaced with LabVIEW to process and condition the EMG signal. Signal processing and conditioning involve:
- Band pass Filtering
- IEMG
- MAV EMG
- RMS analysis
An open loop PWM controller design is discussed in this report and used as the controller for the 4.5V DC motor. After classifying the EMG signal through a fuzzy logic controller within LabVIEW. The output of the fuzzy logic controller is used as a reference duty cycle for the 4.5V DC motor drive circuit.
Overall this report contains the following complete documentation of the EMG controller with following components:
- Literature Review
- Instrumentation
- Data Acquisition
- Signal Processing and Analysis
- DC motor controller Implementation
{Basmajian, 1985 #6}{Berlia, 2014 #1}
Literature Review
Electromyography Signal
According to Basmajian and Deluca, “Electromyography signal (EMG) is the electrical manifestation of the neuromuscular activation associated with a contracting muscle” {Basmajian, 1985 #6}(Basmajian & Luca 1985). EMG signal has frequency range between 20 to 250 Hz therefore Raw EMG must be filtered between this range. An EMG signal is considered as a time and force dependant signal meaning that its amplitude varies in an unusual pattern above zero point. Raw EMG signal are normally recorded with AC coupled amplifiers which ensures that average value is equal to zero. This means that averaging signal techniques may not be enough to analyse EMG Signals.
Figure 1: Raw EMG Signal
(Genoud, Khan & Sun 2014) EMG signal must be processed into a linear envelope by going through the following signal processing stages:
- Amplification
- Rectification
- Smoothing and Amplification
During this process the EMG signal pass through the following filter stage:
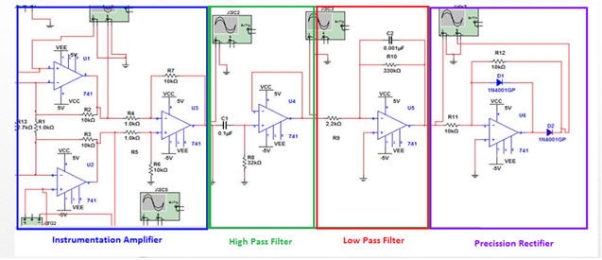
- Instrumental Amplifier
- High pass Filter
- Low pass filter
- Precision Filter
The first stage of the signal amplification is the instrumentation amplifier. The purpose of this amplifier is to filter out the noise in the circuit. An INA118 is used as the instrumentation because of its general-purpose operation and high accuracy. The instrumentation amplifier is consisted of two non-inverting amplifiers and a differential amplifier. The characteristics of the operational amplifier is shown below:
Figure 2: EMG Signal Conditioning Circuit
- Bandwidth capacity can reach up to 70Khz at a high gain value of 100 due to the current feedback
- Has an internal input protection which can withstand 40 µV.
- Gain range value of 1 to 10000 via external resistor RO.
- High common-mode refection of 110dB when gain value is equal to 1000.
The high pass filter will filter out frequencies that are too low and the low pass filter will filter out higher frequencies. Having both high pass and low pass in the circuit, provides a suitable range of frequencies. The precession rectifier is implemented to cut off residual noise in the circuit for a smoother signal input to the micro controller. LF351 Amplifier would be used as the operational filter because of the following characteristics:
- Adjustable offset voltage
- Low power consumption
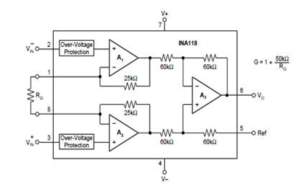
Figure 3: Instrumental Amplifier
- Output protection against short circuit
- Frequency compensation
EMG Time and Frequency domain analysis
The time and frequency domain involved in analysing EMG Signal involves (Basmajian & Luca 1985):
- MAV (Mean Average Value)
- RMS (Root-Mean-square)
- IEMG (Integrated Electromyography)
- Zero Crossing
- Power Density Spectrum
(Bhattacharya, Sarkar & Basak 2017) Mean Absolute Value (MAV) is the mean average of the SEMG over a period. Like any analogue operations, there is a time delay in the operation since a number of sample must be obtained over a time period first before calculating MAV. It is suggested that period should be set between 100ms -200ms (Basmajian & Luca 1985). In the case of sample segments, MAV can be mathematically described as:
MAV=1N∑i=1NXi where N number of sample and Xi=SEMG recorded
Using RMS as a parameter for time and force dependent signals gives more information about the behaviour of the EMG signal. This method of signal extraction is similar to standard deviation and can be mathematically characterised as:
RMS=1N∑i=1Nxi2
(Bhattacharya, Sarkar & Basak 2017) Zero crossing is related to the frequency of the EMG signal but used in time domain analysis. Zero crossing is defined as the number of times that EMG signal crossed the zero point. In some cases, at threshold point is defined as compensation for voltage fluctuation and noise. Zero crossing can be characterised as:
ZC=12N(∑k=2k=N-1|sgnxk-sgnxk-1|)
Integrated electromyography (IEMG) is another extraction from raw EMG signal that provides useful information for EMG classification. IEMG is the summation of the absolute value of the raw EMG signal over a period of samples.
IEMG=∑n=1N|xn|
(Basmajian & Luca 1985) Analysing EMG signal in frequency domain involves measurement of specific parameters of the frequency spectrum of the EMG signal. Power spectrum of an EMG signal is formed by the summation of all auto and cross-spectra of the signal which is described as:
Sω=∑n=1pSuiw+ ∑i,j=1 i ≠jqSuiujwwhere
Suiw=EMG power density
Suiujw=cross power density spectrum
Power density spectrum of the EMG signal has the following important characteristic in frequency analysis:
- Median Frequency
- Mean Frequency
- Bandwidth
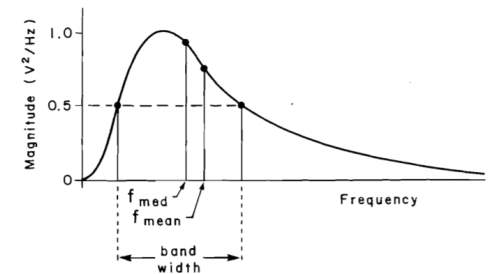
Figure 4: EMG Power Spectrum Characteristics
Fuzzy logic classifier
Due to the complex nature of EMG signals, classifying them can be difficult as these signals defer to different individuals. Fuzzy logics can be used a decomposition technique for EMG signals due to its capability to distinguish qualitative data to create algorithm. Fuzzy logic system is composed of if statement rules within a database with their corresponding output. EMG signals can be classified into quantitative human logic such as “low”, “medium”, and “High” Signal. This is also known as the fuzzification of crisp input into membership function. Membership function can be defined into different shapes such as triangle, trapezoid, and gaussian.
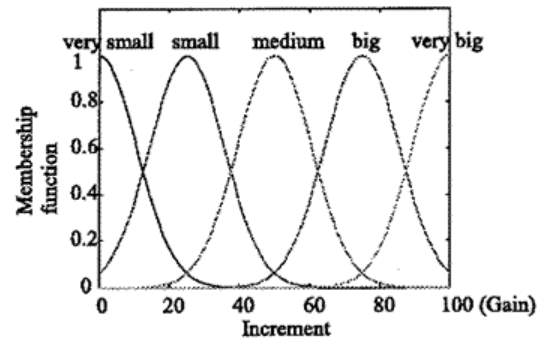
Figure 5: EMG Gaussian Membership Function
After fuzzification, the fuzzy processed inputs are compared to the if statement rule database which provides condition for different crisp output. Through previous research, using fuzzy logic to classify EMG signals has demonstrated adequate result in terms of recognizing muscle contraction and flexion. (Ülkir, Gökmen & Kaplanoğlu 2017) A previous study was done by Ülkir, Gökmen & Kaplanoğlu where they distinguish gripping movement using fuzzy logic system. EMG signal was received via surface electrodes and extracted its RMS, Wavelenght, and kurtosis.
The fuzzy logic classifier for this purpose has 6 membeship function entry which comes from the signal extraction. The contraction is defined as Start, Middle, and End which is used to define the crisp output. Triangular shapes was used as membership function.
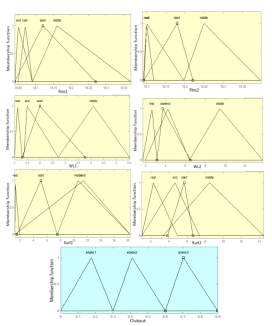
Figure 6: Membership Function for FLS grip movement classification
The Fuzzy logic system (FLS) is composed of 6 extracted input and 1 state output. To produce the crisp output, the centroid method was used for defuzzyfication. With this method, area under the scaled membership function is calculated within the vicinity of the output range (Singh 2013).
Centroid=∫XminXmaxfx*xdx∫XminXmaxfxdx
where x=variable value
where Xmin and Xmax=fuzzy set range
With 6 If then rules in the database. The fuzzy logic system study showed promising results as the classification success rate had 93.12% accuracy rate in distinguishing wrist flexion and extension from start to end. It was proven to be a simple approach of classification since training is not required and the logic classification can be adapted to a different person.
(Chauvet et al. 201) EMG is composed of MUAPs which is produced by active motor units. With increasing number of MUAP activated within the EMG signal, it becomes difficult to analyse individual MUAP structure. In 2001, A research was done on a new method of decomposing EMG signal with their corresponding MUAP. The new method uses fuzzy logic algorithm in conjunction with statistical analysis of IPI and peak detector of MUAPs. With the application of the new method to real time EMG classification, it had 88% success rate in on classifying MUAP. The modified FLS system has the following stages:
- Detection – Through a peak detection scheme, a threshold value for MUAP is identified every iteration. This reduces the number of MUAP to analysed in the EMG signal.
- Statistical Analysis – The IPI and amplitude of MUAP’s Distribution function is calculated in this stage which is used a classification parameter set for each iteration.
- Classification – Fuzzy logic uses the parameters to identify a set of MUAP.
EMG Controller
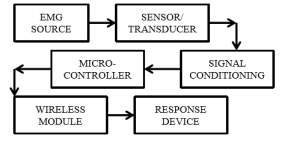
(Berlia et al. 2014) Berlia developed a universal controller prototype that uses muscle action as control signal. This control concept is beneficial for people with disability and elderly aged since will allow manipulation of household appliances easier without having physical force required. The controller is in a form of a band that converts gesture into a specific control signal. The system architecture of the design involves:
- Data Acquisition and signal processing device
- Microcontroller
- Wireless module
- Responsive device
(C.PRADEEP 2015) A surface electrode is used to collect EMG signal which is attached to the surface of skin. A full wave rectifier and low pass filter is a proposed system to signal condition the EMG signal. A conventional microcontroller is used as an I/O instrumentation for the system. The classification and control algorithm is embedded within the microcontroller. The wireless module sends the control signal to the responsive device.
Figure 7: EMG Controller System
Microprocessor PWM Motor control
(Kumar et al. 2015) Pulse-width modulation is widely used common electrical control in today’s technology. Through power electronics switching, electrical power can be supplied more efficiently. The faster the switching frequency, lower the power loss. PWM is popular with digital controllers due to its on and off nature which can be encoded to Boolean terminology. Average power input to devices can be controlled by varying the time of on and off state. The longer the on state, the more power is transferred to the DC Motor. A research project was done by Ravi Kumar where a DC motor speed controller is implemented using a P89V51RD2 microcontroller and a IC L293D driver
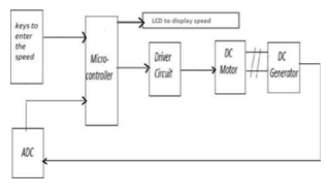
Figure 8: Block Diagram of closed loop speed control
In the system above, The microcontroller is interfaced with a keypad, LCD, ADC and a motor drive. The microcontroller generates a PWM signal which controls the speed of the motor. Through varying duty cycle, average DC input to the DC motor can be changed which is proportional to speed of the motor. The motor parameters are monitored by the LCD display. A generator is coupled with the motor which sense the speed of the motor by generating voltage with motor speed. This voltage is used as a feedback to the microcontroller to compare current speed of motor to the reference speed. If the reference speed is greater than the feedback, the controller increases the duty cycle of the PWM. If the reference speed is less than the feedback., the controller decreases the duty cycle. Since this design was used for research study, a 12V DC motor is used with rated a rated speed of 150 rpm for simplicity. The close-loop system works well under no-load and loaded conditions. Implementing a PID or a fuzzy logic controller can optimize the control algorithm of the design
DC Motor
A DC motor operates under the principle of Lenz’s law which states that when a current carrying conductor is under the influence of a magnetic field, mechanical energy is produce in the form of torque. The direction of the torque produced can be reversed by changing the direction of the current in the conductor. Rotational direction of a motor can be visualised using Fleming’s left-hand rule which is shown below:
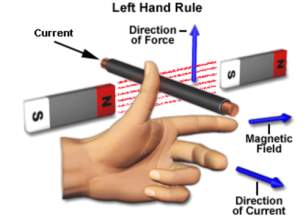
Figure 9: Fleming’s left-hand rule
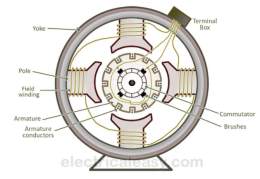
A DC motor is consisting of the following parts:
- Yoke – Yoke is the outer cast iron shell of the DC Motor. It provides protection to sensitive internal parts of the motor. It also provides additional magnetic flux which is produced by the field winding.
- Poles and pole shoes –The purpose of the poles is to carry windings which interlocked by a pole shoe. The pole shoes support the field coil and evenly spread out flux in air the airgap.
- Field Winding – Field winding are wrapped around the poles and connected in series. The wound arrangement produces an alternate north and south pole magnetic field.
- Armature core – This component is the rotor of the machine. The cylindrical structure of core provides support for the armature windings.
- Armature winding – This component is made from copper wires which is winded in different arrangement in the armature core. Provides current around the rotor.
- Commutator – provides current to the armature winding for DC Motors.
The DC Motor circuit diagram is shown below:
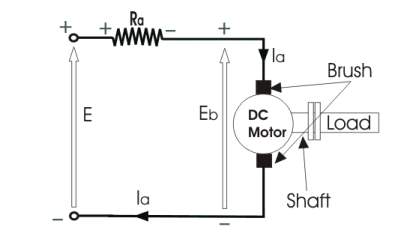
Figure 11: DC Motor Circuit Diagram
Ia = Armature current
E = Supply voltage
Eb = Back EMF
Using KCL around the circuit we get the following voltage equation:
E= Eb+IaRa
For calculate the torque produced by the DC motor, multiply both sides of the equation by
Ia.
EIa= EbIa+Ia2Ra
Ia2Ra
is the l power loss of the DC Motor system therefore the effective mechanical power to produce torque is:
Pmechanical= EbIa
Mechanical torque in terms of speed and electromagnetic torque
Tg:
Pmechanical= Tgω
Equating both mechanical power equation:
EbIa
=
Tgω
ω=2πN60
Back EMF
Ebcan be equated to in terms of flux and DC motor components:
Eb=PφZN60A
P = Number of Poles
φ=flux per pole
Z = Number of conductors
N = DC Motor Speed
A = Number of parallel paths
Substituting
ω and Ebto the electromechanical torque equation:
Tg=PφZIa 2πA
Mechanical torque is defined as the difference between electromechanical torque and mechanical power loss
Tm= Tg-mechanical loss
Electromechanical torque of a DC motor is:
Tg=KaϕIa Ka=PZ2πA ϕ=φ
We can see from the equation that electromechanical torque varies depending on flux and armature current.
Chapter 1 – Instrumentation and Equipment
Building an EMG DC motor controller involves an EMG data acquisition instrumentation, digital software signal processing, fuzzy logic controller software, and a DC motor drive system. In this chapter, individual component characteristics and their functionality will be discussed in detail. The following instrumentation components will be discussed in this chapter:
- Non-invasive surface electrode
- EMG Sensor
- Instrumentation Software (LabVIEW)
- Arduino Microcontroller
- DC Motor
- PWM motor drive
Sensitivity and accuracy was taken into consideration when selecting these components due to the nature of EMG signals. Data acquisition instrumentation must be able to sense EMG signals which has a range of 20 to 40 mV. The analogue to digital conversion (ADC) capability and sampling frequency of the microcontroller must be considered during selection. Instrumentation software needs to have the capability to digitally amplify the EMG signal at least 100 times and filter between 20 to 250 Hz. The instrumentation software must be installed in a computer with a good and fast processing power to ensure faster data acquisition and signal processing.
Figure 12: EMG Data Acquisition Set Up Outline
Surface Electrodes
For this project, A gelled non- invasive electrode is used to acquire surface EMG signals. (insert Caption) This type of electrode has an electrolyte gel which creates a chemical reaction between the skin and the metal contact of the electrode. Through oxidation and reductive chemical reactions, the electrodes become more sensitive in sensing EMG signals. The commonly used metallic compound used for this type of electrode is Silver-silver-chloride (Ag-Agcl). The Agcl layer of the metal contact allows currents to flow without obstruction between the electrolyte gel and electrode, therefore, there is less noise interference in EMG measurements. This type of electrode reduces electrode-skin impedance which improves electrode to skin contact. A disposable type of this electrode used for this project since it cost less than the reusable type. The size of the electrode used for this project is 10mm wide in diameter which is recommended since this is preferred for our application. Size of the electrode was considered that it is large enough to sense sufficient amount of EMG signals but small enough to avoid crosstalk.
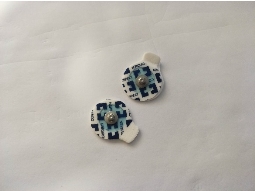
Figure 13: Surface EMG Electrode
To improve the flexibility of the electrode, an electrode cable was added with surface electrode surface set-up. This extends the range of connectivity between the sensor and user if required. With extended range, electrodes can be placed into different muscle groups. The cable is 24 inches long with a 3.5mm audio jack to connect to the sensor. This component was an essential auxiliary component with the electrode, since connecting the electrode directly to the sensor provides minimal isolation between the microcontroller and sensor. It is important that the cable has minimal movement of the cable during data acquisition as this can interfere with the accuracy of measurements.
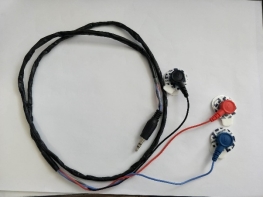
Figure 14: Electrode Cable
EMG Sensor
A proposed EMG sensor signal conditioning circuit is stated in the literature review, however, designing the analog circuit is out of the scope of this project. Another alternative solution that can be used for the EMG data acquisition is with use of a built-in EMG sensor which has a Raw signal and EMG Envelop (rectified, amplified, and integrated) output. The EMG sensor used for this system is a MyoWare Muscle Sensor which shown in figure 15. Using this type of sensor will give me the flexibility to either use the Raw EMG signal or the amplified signal ready to be used within the microcontroller however for this project, the Raw EMG signal will be used as input. The sensor has a built-in gain amplifier which can be calibrated depending on the application. The raw EMG signal output of this sensor has an offset equivalent to half of the voltage supply; therefore the voltage supply is set at 5V to ensure that both negative and positive side of the EMG signal is acquired. The available waveform output for the sensor is shown below.
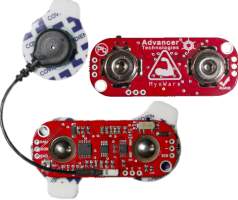
Figure 16: Myoware Sensor
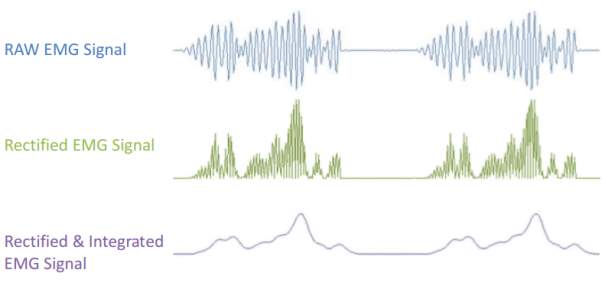
Figure 15: Myoware available EMG Waveform Signal
Microcontroller
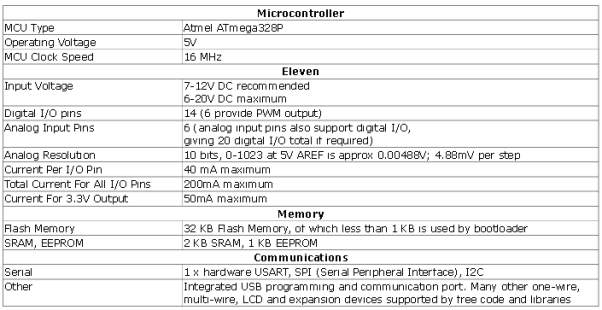
The Arduino board will be used as the Microcontroller for the project since it is most commonly used and available when building project prototype. The Microcontroller will only serve as an I/O board and ADC for the system since all the processes involve will be done in LabVIEW. Below is an overview of the Freetronics Arduino Board eleven that will be used for the project:
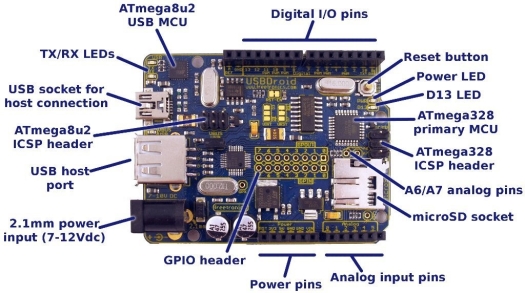
The Arduino eleven has PWM capability from pin 1 to 6 of the digital I/O pins. PWM will be the main control signal for the DC Motor. An external circuit will be connected to the Arduino board to allow
Table 1: Arduino Eleven Characteristic from Data Sheet
LabVIEW Software
LabVIEW is system-design and development platform which is a commonly used for Data Acquisition and Industrial Automation. This software is more user-friendly than other integrated design environments (IDE) since it eliminates extensive line based coding through visual programming language. With visual programming language, function libraries and laboratory equipment are in the form of image icons with specified input and output parameter. Programming algorithm is done within the block diagram panel by connecting these image icons with specified input and output which creates a data flow paradigm. LabVIEW also provides virtual instrumentation through HMI display. Developers can easily drag and drop virtual instrumentation such as a thermometer, waveform display, Boolean switches, and other numerical indicators which are connected within the block diagram. LabVIEW provides real-time data and signal processing which makes it the perfect software to use to build the HMI display for the EMG controller. LabVIEW can process the ADC output from the microcontroller which makes filtering, amplification, and signal processing much easier and eliminates the extensive use of analog circuits to process the signal. LabVIEW provides a cost-efficient solution for the capstone project.
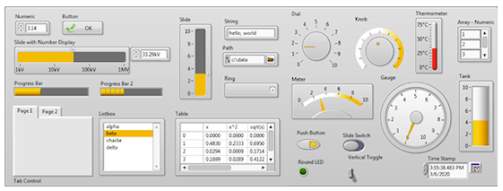
Figure 17: LabVIEW Front Panel View
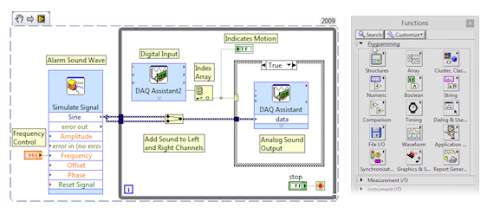
Figure 18: LabVIEW Block Diagram View
DC motor
A simple hobby DC motor with operating voltage between 1.5V – 4.5V was used to build the prototype for simplification. Basic DC motor control such as On/Off and speed control is demonstrated by the DC motor. In the previous literature review, it is known that a DC motor work under the principle of Fleming’s right-hand rule meaning that direction of the torque for is perpendicular to the current direction. Torque is proportional to the speed. Therefore, both can be controlled by controlling current input inside the DC motor. The more current input, the higher electromagnetic force produced, therefore, the faster the motor revolves. Table 2 shows the specification of the DC motor.
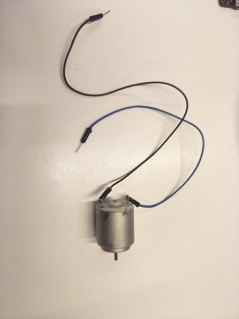
Figure 19: DC Motor Prototype
| Torque | Medium |
| Operating Voltage | 1.5 – 4.5 V |
| Nominal Voltage | 4.5 V |
| Speed (No Load) | 12500 RPM |
| Current (No load) | 0.25 A |
| Speed (Max eff) | 9560 RPM |
| Current (Max eff) | 0.81A |
| Torque (Max eff) | 17.86 gcm |
| Size Diameter | 23.6 mm |
| Size Length | 25 mm |
| Shaft Length | 6.5 mm |
| Shaft Diameter | 2 mm |
Table 2: DC Motor Specification
DC motor drive
Since a small-scale DC motor was used for the project, A simple DC motor drive can be implemented using a 10K ohm resistor, MOSFET, and a diode which is shown in figure 20. A separate power supply will be used for the drive to ensure that it does not affect the microcontroller operation. A diode is placed across the MOSFET to protect the MOSFET from current flowing the opposite direction when the motor comes to a stationary state. 10K ohm resistor is used as the pull-up resistor for the drive since this value is used typically for switching purposes. A pull up resistor is used to maintain a defined state at the pin output. Without the pull-up resistor added to the PWM output of the microcontroller, the value of the output will be defined as floating as when the gate of the MOSFET is open and only defined as high when closed. The PWM signal is produced by pin 6 of the microcontroller which was configured as a PWM output within LabVIEW. The power supply input must be taken into consideration due to the EMF produced as it can affect sensor readings.
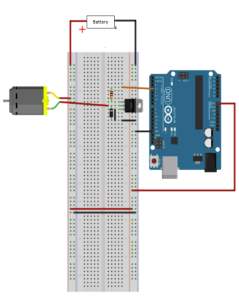
Figure 20: Arduino DC Motor Drive Schematics
Figure 21 shows the DC motor drive implementation. A 1.5 V triple A battery is used as the power supply for the drive system since this provide enough speed for whilst considering EMG by the DC motor. The MOSFET used for this set up is a IRF540N which is typically used for simple drive requirements. This type of MOSFET has a minimum gate to source voltage of 2 to 4V. Gate to source voltage is set greater than 4V to ensure that it closes. The PWM output has a max peak of 5.5V which is greater than maximum gate to source voltage of 4V. With these conditions, the drive system is able operate with varying duty cycle.
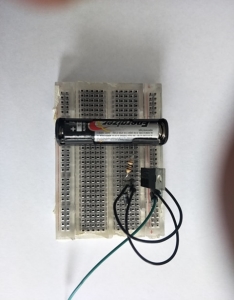
Figure 21: Drive Implementation
Chapter 2 – Methodology
System block diagram and implementation
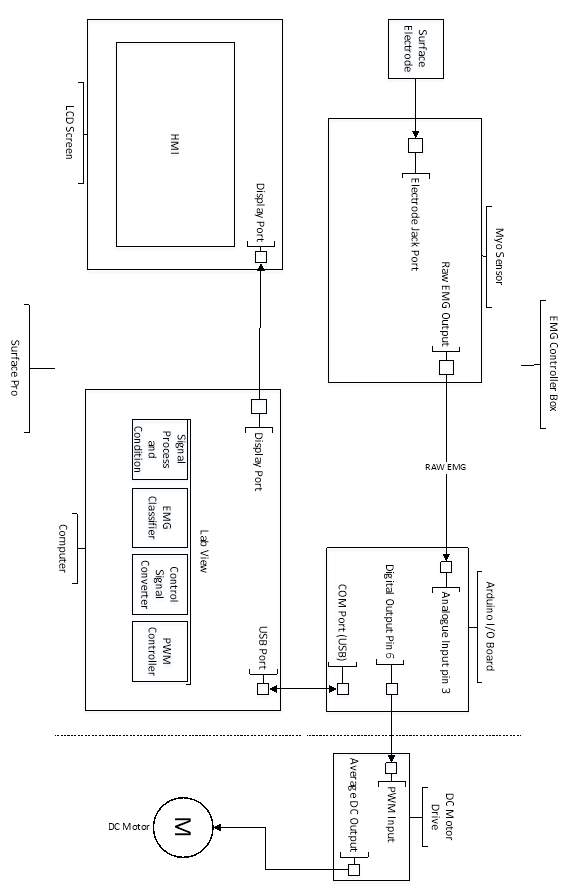
After conducting literature review about EMG data acquisition and classifier algorithms, the system block diagram for the project was designed and implemented. Instrumentation and equipment for the project were introduced in chapter 1. These will be furthered discussed in this chapter of the report to demonstrate the design approach and implementation. The proposed system block diagram is shown in figure 24. The surface electrode will have placed on the surface of the skin where there is a lot of muscle activity during contraction of the hands. It was mentioned in chapter 1 that surface electrode is extended by an electrode cable. The electrode cable is connected to the jack port of the Myoware cable shield (figure 22) which is connected to the Myoware EMG sensor. The EMG sensor is powered by the 5.5V power supply of the Arduino board. Raw EMG signal output of the EMG sensor is connected to the analog input pin 3 of the microcontroller. The microcontroller is power by the USB connection to the PC. The microcontroller communicates with the PC through USB/Serial communication with the following configuration shown in table 3. These settings are chosen based on the LabVIEW interface base code installed inside the microcontroller. Both the EMG sensor and microcontroller are stored in a plastic enclosure to provide protection and aesthetics.
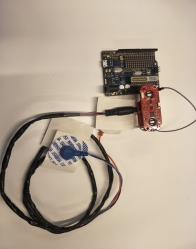
Figure 22: EMG Controller internal components
| Microcontroller Initialisation | |
| Virtual Port | COM3 |
| Baud Rate | 115200 |
| Connection Type | USB/Serial |
| Board Type | Uno |
| Bytes Per Packet | 15 |
Table 3: Microcontroller Configuration
A micro USB cable is used as the communication medium to establish connection between the microcontroller and PC. LabVIEW was installed to my own personal computer to have full control and access of the software. Due to the hardware build of the surface pro, the LCD screen and computer can be considered as one unit. Using the surface pro provides a good demonstration of a HMI control and display.
Holes were drilled at the back and the side of the enclosure to provide ventilation and cable path. Two cables pass through the side hole to ground the drive system with the microcontroller and create connection with the MOSFET gate and PWM output pin 6. The final hardware implementation is shown in figure 23.
| Microcontroller Pin Use | |
| Pin 6 (Digital) | PWM Output |
| Ground Pin | PWM ground |
| 5.5 V Pin | Sensor Power Supply |
| Pin 3 (Analog) | Raw EMG input |
Table 4: Pin Summary
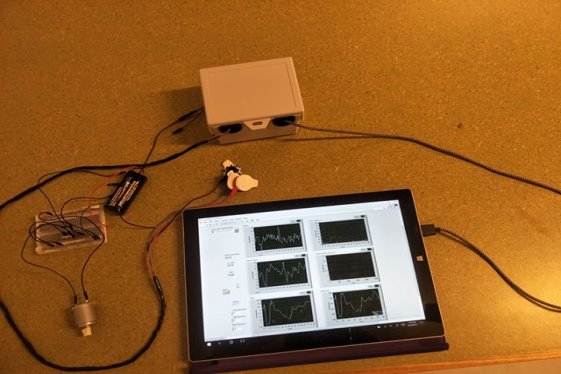
Figure 23: EMG Controller Actual Hardware Set-up
Figure 24:System Block Diagram
Data Acquisition
After implementing the system hardware architecture, Data acquisition was done through the parallel operation of the microcontroller and LabVIEW virtual instrumentation. Data acquisition is the process of converting physical properties into digital sampled data through analog to digital converters and computers. The process of data acquisition of the EMG controller is demonstrated by the flow chart in figure 25.
As mentioned in chapter 1, surface electrode was used to obtain electrical potentials generated by muscular activity. (Seidle 2017) The microcontroller converts the analog voltage from the sensor to a digital value. The Arduino microcontroller has an ADC capability to detect 1024 discrete analog levels. The analog signal that passes through the microcontroller charges an internal capacitor which then is dissipated in a resistor. The number of periods that passes before the capacitor is dissipated completely is stored and monitored by the microcontroller. The time period recorded is the number that is displayed after ADC operation.

Figure 25: Data Acquisition Flow Chart
References
Berlia, R., Kandoi, S., Dubey, S. & Pingali, T.R. 2014, ‘Gesture based universal controller using EMG signals’, International Conference on Circuits, Communication, Control and Computing, pp. 165-8.
Bhattacharya, A., Sarkar, A. & Basak, P. 2017, ‘Time domain multi-feature extraction and classification of human hand movements using surface EMG’, 2017 4th International Conference on Advanced Computing and Communication Systems (ICACCS).
C.PRADEEP, S.G.K. 2015, ‘Control of Stepper Motor Using Surface EMG Signals’, International Journal of Advanced Research in
Electrical, Electronics and Instrumentation Engineering, vol. 4, no. 10,p. 8.
Chauvet, E., Fokapu, O., Hogrel, J.-y., Gamet, D. & Duchene, J. 201, ‘A method of EMG decomposition based on fuzzy logic’, 2001 Conference Proceedings of the 23rd Annual International Conference of the IEEE Engineering in Medicine and Biology Society, pp. 1948-50.
Genoud, K., Khan, H. & Sun, K. 2014, Electromyography Controlled Car, http://www.g9toengineering.com/MechatronicsStudio/Electromygraphy.htm>.
Kumar, K.S.R., Jaideep, Rohit & Vikas 2015, ‘Microprocessor based closed loop speed control of DC motor using PWM’, 2015 International Conference on Control, Instrumentation, Communication and Computational Technologies (ICCICCT), pp. 255-7.
Seidle, N. 2017, Analog to Digital Conversion, https://learn.sparkfun.com/tutorials/analog-to-digital-conversion>.
Singh, Y. 2013, ‘Analysis and classification of EMG Signal using LabVIEW with different weights‘,Thapar University, Patiala, 147004, Punjabi, India.
Ülkir, O., Gökmen, G. & Kaplanoğlu, E. 2017, ‘Emg Signal Classification Using Fuzzy Logic’, BALKAN JOURNAL OF ELECTRICAL & COMPUTER ENGINEERING, vol. 5, no. 2,pp. 97-101.
Cite This Work
To export a reference to this article please select a referencing stye below:
Related Services
View allRelated Content
All TagsContent relating to: "Biomedical Science"
Biomedical Science focuses on how cells, organs and systems function in the human body and underpins much of modern medicine. Biomedical Science applies parts of natural and/or formal sciences to help develop advances in healthcare.
Related Articles
DMCA / Removal Request
If you are the original writer of this dissertation and no longer wish to have your work published on the UKDiss.com website then please:

![[IMG]](https://images.ukdissertations.com/28/0127628.002.jpg)
